US8701460B2 - Method and system to compensate for temperature and pressure in piezo resistive devices - Google Patents
Method and system to compensate for temperature and pressure in piezo resistive devices Download PDFInfo
- Publication number
- US8701460B2 US8701460B2 US13/077,963 US201113077963A US8701460B2 US 8701460 B2 US8701460 B2 US 8701460B2 US 201113077963 A US201113077963 A US 201113077963A US 8701460 B2 US8701460 B2 US 8701460B2
- Authority
- US
- United States
- Prior art keywords
- temperature
- pressure
- piezo resistive
- adc
- piezo
- Prior art date
- Legal status (The legal status is an assumption and is not a legal conclusion. Google has not performed a legal analysis and makes no representation as to the accuracy of the status listed.)
- Active, expires
Links
Images


Classifications
-
- G—PHYSICS
- G01—MEASURING; TESTING
- G01L—MEASURING FORCE, STRESS, TORQUE, WORK, MECHANICAL POWER, MECHANICAL EFFICIENCY, OR FLUID PRESSURE
- G01L27/00—Testing or calibrating of apparatus for measuring fluid pressure
- G01L27/002—Calibrating, i.e. establishing true relation between transducer output value and value to be measured, zeroing, linearising or span error determination
- G01L27/005—Apparatus for calibrating pressure sensors
-
- G—PHYSICS
- G01—MEASURING; TESTING
- G01L—MEASURING FORCE, STRESS, TORQUE, WORK, MECHANICAL POWER, MECHANICAL EFFICIENCY, OR FLUID PRESSURE
- G01L27/00—Testing or calibrating of apparatus for measuring fluid pressure
- G01L27/002—Calibrating, i.e. establishing true relation between transducer output value and value to be measured, zeroing, linearising or span error determination
-
- G—PHYSICS
- G01—MEASURING; TESTING
- G01L—MEASURING FORCE, STRESS, TORQUE, WORK, MECHANICAL POWER, MECHANICAL EFFICIENCY, OR FLUID PRESSURE
- G01L9/00—Measuring steady of quasi-steady pressure of fluid or fluent solid material by electric or magnetic pressure-sensitive elements; Transmitting or indicating the displacement of mechanical pressure-sensitive elements, used to measure the steady or quasi-steady pressure of a fluid or fluent solid material, by electric or magnetic means
- G01L9/02—Measuring steady of quasi-steady pressure of fluid or fluent solid material by electric or magnetic pressure-sensitive elements; Transmitting or indicating the displacement of mechanical pressure-sensitive elements, used to measure the steady or quasi-steady pressure of a fluid or fluent solid material, by electric or magnetic means by making use of variations in ohmic resistance, e.g. of potentiometers, electric circuits therefor, e.g. bridges, amplifiers or signal conditioning
- G01L9/06—Measuring steady of quasi-steady pressure of fluid or fluent solid material by electric or magnetic pressure-sensitive elements; Transmitting or indicating the displacement of mechanical pressure-sensitive elements, used to measure the steady or quasi-steady pressure of a fluid or fluent solid material, by electric or magnetic means by making use of variations in ohmic resistance, e.g. of potentiometers, electric circuits therefor, e.g. bridges, amplifiers or signal conditioning of piezo-resistive devices
- G01L9/065—Measuring steady of quasi-steady pressure of fluid or fluent solid material by electric or magnetic pressure-sensitive elements; Transmitting or indicating the displacement of mechanical pressure-sensitive elements, used to measure the steady or quasi-steady pressure of a fluid or fluent solid material, by electric or magnetic means by making use of variations in ohmic resistance, e.g. of potentiometers, electric circuits therefor, e.g. bridges, amplifiers or signal conditioning of piezo-resistive devices with temperature compensating means
Definitions
- the present invention relates generally to pressure sensors and, more particularly, to non-linear sensors having two variables with cross-dependency.
- Piezo resistive devices such as piezo resistive transducers (PRT) are commonly used in commercial systems such as stress or pressure sensor systems. Such PRTs are typically implemented in integrated circuits and semiconductor devices. In accordance with the piezo resistive effect, the resistivity of piezo resistive elements changes in response to strain from the applied mechanical or physical stress to the piezo resistive element.
- the piezo resistive elements of the PRT are arranged to be in contact with a diaphragm such that a force or pressure applied to the diaphragm and the PRT converts the mechanical stress on the piezo resistive elements into differential electrical outputs. This property is used to measure ambient pressure.
- the resistivity of piezo resistive elements within PRTs exhibit temperature dependency. This property is used to measure ambient temperature. If the PRT is not balanced with respect to pressure, large errors result in the computation of temperature. To minimize this pressure dependency of temperature computation, conventional PRTs are designed to be balanced with respect to pressure. However, attempting to balance a PRT with respect to pressure is difficult to achieve and places a heavy constraint on the design and manufacture of PRTs.
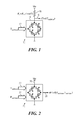
- FIG. 1 is a simplified circuit diagram of a configuration for temperature measurement of an ideal piezo resistive transducer (PRT);
- FIG. 2 is a simplified circuit diagram of a PRT configuration for pressure measurement
- FIG. 3 is a simplified block diagram showing a pressure sensor system
- FIG. 4 is a top plan view of a circuit layout of a piezo resistive sensor in accordance with an embodiment of the invention
- FIG. 5 is a cross-sectional view of the piezo resistive sensor of FIG. 4 taken along line A-A in accordance with an embodiment of the invention
- FIG. 6 is a simplified circuit diagram of a configuration for temperature measurement of an unbalanced PRT in accordance with an embodiment of the invention
- FIG. 7A is a flow chart of calculations for temperature recalibration of a PRT in accordance with an embodiment of the invention.
- FIG. 7B is a simplified block diagram showing a pressure sensor system in accordance with an embodiment of the invention.
- FIG. 8 is a graph of the absolute temperature accuracy of temperature (° C.) for several PRTs without recalibration
- FIG. 9 is a graph of the absolute temperature accuracy of temperature (° C.) for several PRTs with recalibration in accordance with an embodiment of the invention.
- FIG. 10A is a flow chart of calculations for temperature cross-fit of a PRT in accordance with an embodiment of the invention.
- FIG. 10B is a simplified block diagram showing a pressure sensor system in accordance with an embodiment of the invention.
- FIG. 11 is a graph of the absolute temperature accuracy of temperature (° C.) for several PRT with temperature cross-fit in accordance with an embodiment of the invention.
- a method of calibrating a piezo resistive device having a piezo resistive element with a fluctuating resistivity in the piezo resistive device and signals representative of the temperature and pressure readings of the piezo resistive device includes calculating a first temperature as a function of the signal representative of temperature reading of the piezo resistive device, and calculating an actual pressure as a function of the first temperature and the signal representative of pressure reading of the piezo resistive device.
- Another embodiment of the invention comprises calculating an actual temperature as a function of the first temperature and the actual pressure.
- the calculating of the actual temperature may be performed with a constant of the actual pressure calculated for calibrating the piezo resistive device.
- the constant may be determined empirically by determining a value of the constant of the actual pressure.
- the calculating of the first temperature may be a function of the signal representative of temperature reading and the signal representative of pressure reading.
- the first temperature may be an actual temperature, and calculating the actual pressure may be as a function of the actual temperature and signal representative of pressure reading of the piezo resistive device.
- the piezo resistive device may be arranged within a pressure sensor.
- the piezo resistive device may comprise at least four piezo resistive elements forming the piezo resistive device and each piezo resistive element having a fluctuating resistivity.
- the present invention also provides a system of calibrating a piezo resistive device comprising a piezo resistive element having a fluctuating resistivity in the piezo resistive device; and a processor for receiving signals representative of the temperature and pressure readings of the piezo resistive device; and calculating a first temperature as a function of the signal representative of temperature reading of the piezo resistive device; and calculating an actual pressure as a function of the first temperature and signal representative of pressure reading of the piezo resistive device.
- An embodiment of the invention comprises calculating an actual temperature as a function of the first temperature and the actual pressure. Calculating the actual temperature may be performed with a constant of the actual pressure calculated for calibrating the piezo resistive device. The value of the constant may be determined empirically of actual pressure readings.
- the calculating of the first temperature may be a function of the signals representative of temperature reading and the pressure reading.
- the first temperature may be an actual temperature.
- the calculating of the actual pressure may be as a function of the actual temperature and signal representative of pressure reading of the piezo resistive device.
- the piezo resistive device may be arranged within a pressure sensor.
- An analogue to digital converter (ADC) may convert the signals representative of temperature and pressure from the piezo resistive device and coupled to the processor.
- ADC analogue to digital converter
- the piezo resistive device may be a piezo resistive transducer.
- the piezo resistive device may comprise at least four piezo resistive elements forming the piezo resistive device and each piezo resistive element having a fluctuating resistivity.
- the piezo resistive device may be a non-linear sensor.
- the piezo resistive device may have at least two variables that have cross-dependency.
- a method and system is described to calibrate for temperature and pressure using piezo resistive devices. More generally, a method and system is described for non-linear sensors having two variables.
- a piezo resistive device such as a piezo resistive transducer (PRT) used for example in a pressure sensor system is calibrated to calculate actual/ambient temperature and pressure even though the PRT impedance is unbalanced relative to pressure.
- PRT piezo resistive transducer
- FIG. 3 is a simplified block diagram showing the basic characteristics of a pressure sensor module 30 within a pressure sensor system.
- the gain and ADC circuitry 32 is well known in the industry and may have different configurations.
- the ADC circuitry may be a sigma-delta A/D converter commercially available from a number of companies.
- T output could be realized as a third order equation and P output could be realized as a first order equation as shown below.
- T output cT 0 +cT 1 ⁇ T adc +cT 2 ⁇ T 2 adc +cT 3 ⁇ T 3 adc
- a processing means such as an arithmetic logic unit (ALU), digital signal processor (DSP), or like processor, arranged in the datapath is used to compute the functions. It is clear from this implementation that for PRTs in which vT is strictly a function of T ambient , the above method works well.
- ALU arithmetic logic unit
- DSP digital signal processor
- FIG. 4 is a top plan view of circuit layout of a piezo resistive sensor 40 that may be implemented in accordance with an embodiment of the invention.
- the piezo resistive sensor 40 comprises four piezo resistors R 1 41 , R 2 42 , R 3 43 , R 4 44 with leads 46 and circuitry 48 .
- the four piezo resistors are located at the edge of a diaphragm 49 .
- the diaphragm 49 is shown transparent to show the orientation and placement of the four piezo resistors under the diaphragm.
- Two piezo resistors R 1 ,R 2 are arranged in a perpendicular orientation relative to the edge of the diaphragm.
- the other two piezo resistors R 3 ,R 4 are arranged in a parallel orientation relative to the edge of the diaphragm.
- the piezo resistors are sensitive to silicon strain caused by the flexing of the diaphragm.
- FIG. 5 shows a cross-section 50 of the piezo resistive sensor shown in FIG. 4 taken along line A-A and includes the cross-section of piezo resistors R 1 , R 2 .
- the applied force or pressure 54 is applied to the diaphragm 49 , where the diaphragm forms a vacuum 56 , the resistance in piezo resistors R 1 ,R 2 increases due to the tensile stress in that direction.
- the piezo resistors R 3 , R 4 with the parallel orientation relative to the diaphragm 49 decrease in resistance due to the compressive stress in that direction.
- FIG. 6 is a simplified circuit diagram of a realistic PRT 60 with temperature measurement 62 and pressure measurement 63 in accordance with an embodiment of the invention.
- ⁇ R 1 ⁇ R 2 ; and ⁇ R 3 ⁇ R 4 the following behaviour is observed:
- FIG. 7A is a flow chart 70 of calculations for temperature recalibration of a PRT in accordance with an embodiment of the invention.
- the calibration process requires three computations instead of the typical two computations as discussed and shown above.
- the order of the calculations is provided in accordance with obtaining the necessary parameters, T 0 ->P output ->T output .
- the constant k is a constant of actual pressure P output and may be found empirically. An example value for k found empirically is ⁇ 0.75, where k can be derived by averaging the k value taken from a large number of samples.
- FIG. 7B is a simplified block diagram 71 showing a pressure sensor system in accordance with an embodiment of the invention incorporating the calculations for temperature recalibration of a PRT as shown in the flow chart FIG. 7A .
- FIG. 8 and FIG. 9 show the difference the temperature recalibration has on several PRTs in accordance with an embodiment of the invention.
- FIG. 8 is a graph 80 of the absolute temperature accuracy of temperature (° C.) without recalibration, with T 0 .
- the graph of FIG. 8 shows the banding or grouping at different pressures which is eliminated in FIG. 9 .
- the data shown in the graphs of FIG. 8 and FIG. 9 is taken from a sample simulation of 16 PRTs.
- FIG. 10A is a flow chart 100 of calculations for temperature cross-fit of a PRT in accordance with an embodiment of the invention.
- the pressure dependency is built into the temperature equation.
- this method requires two computations.
- the order of the calculations is provided in accordance with obtaining the necessary parameters, T output ->P output . With this method, higher order terms can be achieved then previously in pressure equations.
- FIG. 10B is a simplified block diagram 101 showing a pressure sensor system in accordance with an embodiment of the invention incorporating the calculations for temperature cross-fit of a PRT where pressure dependency is built into the temperature equation as shown in the flow chart FIG. 10A .
- FIG. 11 is a graph 110 of the absolute temperature accuracy of temperature (° C.) for a PRT with temperature cross-fit in accordance with an embodiment of the invention.
- the graph 110 of FIG. 11 also shows that the temperature calculation achieved is better than achieved by conventional methods despite an unbalanced PRT with respect to pressure. Additionally, the overall order of pressure is 2 even though the pressure equation calls for only 1 st order. This method also results in a savings in datapath calculation 34 over conventional methods, as there are more terms that are realized and considered in the pressure equation.
Landscapes
- Physics & Mathematics (AREA)
- General Physics & Mathematics (AREA)
- Chemical & Material Sciences (AREA)
- Analytical Chemistry (AREA)
- Measuring Fluid Pressure (AREA)
Abstract
Description
T output =cT 0 +cT 1 ·T adc +cT 2 ·T 2 adc +cT 3 ·T 3 adc
P output =C 0 +C 1 ·P adc +C 2 ·T+C 3 ·P adc ·T
ΔR 1 ≈ΔR 2; and ΔR 3 ≈ΔR 4
However,
|ΔR 1 |<|ΔR 4|; and |ΔR 2 |<|ΔR 3|
vT=V ex *R tot/(R tot/(R tot +R c),
T=cT 0 +cT 1 ·T adc +cT 2 ·T 2 adc +cT 3 ·T 3 adc +cT 4 ·T adc ·P adc +cT 5 ·P adc
P=C 0 +C 1 ·P adc +C 2 ·T+C 3 ·P adc ·T
P composite =C′ 0 +C′ 1 ·P adc +C′ 2 ·T adc +C′ 3 ·T 2 adc +C′ 4 ·T 3 adc +C′ 5 ·T adc ·P adc +C′ 6 ·T 2 adc ·P adc +C′ 6 ·T 3 adc ·P adc +C′ 7 ·T adc ·P 2 adc +C′8·T 2 adc ·P 2 adc
Claims (9)
Priority Applications (2)
| Application Number | Priority Date | Filing Date | Title |
|---|---|---|---|
| US13/077,963 US8701460B2 (en) | 2011-03-31 | 2011-03-31 | Method and system to compensate for temperature and pressure in piezo resistive devices |
| US14/197,221 US9157826B2 (en) | 2011-03-31 | 2014-03-05 | Method and system to compensate for temperature and pressure in piezo resistive devices |
Applications Claiming Priority (1)
| Application Number | Priority Date | Filing Date | Title |
|---|---|---|---|
| US13/077,963 US8701460B2 (en) | 2011-03-31 | 2011-03-31 | Method and system to compensate for temperature and pressure in piezo resistive devices |
Related Child Applications (1)
| Application Number | Title | Priority Date | Filing Date |
|---|---|---|---|
| US14/197,221 Division US9157826B2 (en) | 2011-03-31 | 2014-03-05 | Method and system to compensate for temperature and pressure in piezo resistive devices |
Publications (2)
| Publication Number | Publication Date |
|---|---|
| US20120247175A1 US20120247175A1 (en) | 2012-10-04 |
| US8701460B2 true US8701460B2 (en) | 2014-04-22 |
Family
ID=46925457
Family Applications (2)
| Application Number | Title | Priority Date | Filing Date |
|---|---|---|---|
| US13/077,963 Active 2032-07-21 US8701460B2 (en) | 2011-03-31 | 2011-03-31 | Method and system to compensate for temperature and pressure in piezo resistive devices |
| US14/197,221 Active 2031-07-27 US9157826B2 (en) | 2011-03-31 | 2014-03-05 | Method and system to compensate for temperature and pressure in piezo resistive devices |
Family Applications After (1)
| Application Number | Title | Priority Date | Filing Date |
|---|---|---|---|
| US14/197,221 Active 2031-07-27 US9157826B2 (en) | 2011-03-31 | 2014-03-05 | Method and system to compensate for temperature and pressure in piezo resistive devices |
Country Status (1)
| Country | Link |
|---|---|
| US (2) | US8701460B2 (en) |
Cited By (4)
| Publication number | Priority date | Publication date | Assignee | Title |
|---|---|---|---|---|
| US10054502B2 (en) | 2015-03-03 | 2018-08-21 | Denso Corporation | Sensor driving device |
| US10352801B2 (en) | 2016-05-10 | 2019-07-16 | Fike Corporation | Intelligent temperature and pressure gauge assembly |
| US11402275B2 (en) | 2016-08-05 | 2022-08-02 | Denso Corporation | Sensor apparatus |
| US11650110B2 (en) * | 2020-11-04 | 2023-05-16 | Honeywell International Inc. | Rosette piezo-resistive gauge circuit for thermally compensated measurement of full stress tensor |
Families Citing this family (7)
| Publication number | Priority date | Publication date | Assignee | Title |
|---|---|---|---|---|
| US8701460B2 (en) * | 2011-03-31 | 2014-04-22 | Freescale Semiconductor, Inc. | Method and system to compensate for temperature and pressure in piezo resistive devices |
| US10317297B2 (en) * | 2013-12-11 | 2019-06-11 | Melexis Technologies Nv | Semiconductor pressure sensor |
| GB2521163A (en) | 2013-12-11 | 2015-06-17 | Melexis Technologies Nv | Semiconductor pressure sensor |
| CN104458121B (en) * | 2014-12-15 | 2017-04-19 | 中国燃气涡轮研究院 | Silicon pressure sensor temperature excursion compensating circuit and circuit establishing method |
| CN107192938A (en) * | 2017-06-07 | 2017-09-22 | 太原市太航压力测试科技有限公司 | A kind of hardware signal processing method of silicon piezoresistive transducer |
| CN107589363A (en) * | 2017-08-15 | 2018-01-16 | 太原市太航压力测试科技有限公司 | A kind of signal processing circuit of silicon piezoresistive transducer |
| CN112985688B (en) * | 2021-02-20 | 2022-06-14 | 武汉飞恩微电子有限公司 | Output calibration method and device of pressure sensor and readable storage medium |
Citations (12)
| Publication number | Priority date | Publication date | Assignee | Title |
|---|---|---|---|---|
| US4163396A (en) | 1977-08-22 | 1979-08-07 | The Singer Company | Digital readout pressure sensor |
| US4195349A (en) * | 1978-01-26 | 1980-03-25 | Lynes, Inc. | Self calibrating environmental condition sensing and recording apparatus |
| US4226125A (en) | 1979-07-26 | 1980-10-07 | The Singer Company | Digital pressure sensor system with temperature compensation |
| US4788521A (en) * | 1985-10-10 | 1988-11-29 | Honeywell Inc. | Temperature compensation system for piezoresistive pressure sensor |
| US5460049A (en) | 1994-01-26 | 1995-10-24 | Instrumention Northwest, Inc. | Digitally-temperature-compensated strain-gauge pressure measuring apparatus |
| US5877423A (en) * | 1994-12-02 | 1999-03-02 | Getinge Ab | Method for providing temperature compensation for a wheatstone bridge-type pressure sensor |
| US6700473B2 (en) * | 2000-02-14 | 2004-03-02 | Kulite Semiconductor Products, Inc. | Pressure transducer employing on-chip resistor compensation |
| US6823711B1 (en) * | 2003-05-07 | 2004-11-30 | Halliburton Energy Services, Inc. | Static and dynamic calibration of quartz pressure transducers |
| US20060081062A1 (en) * | 2004-10-18 | 2006-04-20 | Kia Silverbrook | Wafer bonded pressure sensor |
| US7216554B2 (en) * | 2003-12-25 | 2007-05-15 | Denso Corporation | Physical quantity sensor having enhanced temperature compensation capability |
| US7278319B2 (en) * | 2005-11-10 | 2007-10-09 | Honeywell International Inc. | Pressure and temperature sensing element |
| US7483795B2 (en) * | 2004-08-10 | 2009-01-27 | Robertshaw Controls Company | Pressure and temperature compensation algorithm for use with a piezo-resistive strain gauge type pressure sensor |
Family Cites Families (1)
| Publication number | Priority date | Publication date | Assignee | Title |
|---|---|---|---|---|
| US8701460B2 (en) * | 2011-03-31 | 2014-04-22 | Freescale Semiconductor, Inc. | Method and system to compensate for temperature and pressure in piezo resistive devices |
-
2011
- 2011-03-31 US US13/077,963 patent/US8701460B2/en active Active
-
2014
- 2014-03-05 US US14/197,221 patent/US9157826B2/en active Active
Patent Citations (12)
| Publication number | Priority date | Publication date | Assignee | Title |
|---|---|---|---|---|
| US4163396A (en) | 1977-08-22 | 1979-08-07 | The Singer Company | Digital readout pressure sensor |
| US4195349A (en) * | 1978-01-26 | 1980-03-25 | Lynes, Inc. | Self calibrating environmental condition sensing and recording apparatus |
| US4226125A (en) | 1979-07-26 | 1980-10-07 | The Singer Company | Digital pressure sensor system with temperature compensation |
| US4788521A (en) * | 1985-10-10 | 1988-11-29 | Honeywell Inc. | Temperature compensation system for piezoresistive pressure sensor |
| US5460049A (en) | 1994-01-26 | 1995-10-24 | Instrumention Northwest, Inc. | Digitally-temperature-compensated strain-gauge pressure measuring apparatus |
| US5877423A (en) * | 1994-12-02 | 1999-03-02 | Getinge Ab | Method for providing temperature compensation for a wheatstone bridge-type pressure sensor |
| US6700473B2 (en) * | 2000-02-14 | 2004-03-02 | Kulite Semiconductor Products, Inc. | Pressure transducer employing on-chip resistor compensation |
| US6823711B1 (en) * | 2003-05-07 | 2004-11-30 | Halliburton Energy Services, Inc. | Static and dynamic calibration of quartz pressure transducers |
| US7216554B2 (en) * | 2003-12-25 | 2007-05-15 | Denso Corporation | Physical quantity sensor having enhanced temperature compensation capability |
| US7483795B2 (en) * | 2004-08-10 | 2009-01-27 | Robertshaw Controls Company | Pressure and temperature compensation algorithm for use with a piezo-resistive strain gauge type pressure sensor |
| US20060081062A1 (en) * | 2004-10-18 | 2006-04-20 | Kia Silverbrook | Wafer bonded pressure sensor |
| US7278319B2 (en) * | 2005-11-10 | 2007-10-09 | Honeywell International Inc. | Pressure and temperature sensing element |
Cited By (4)
| Publication number | Priority date | Publication date | Assignee | Title |
|---|---|---|---|---|
| US10054502B2 (en) | 2015-03-03 | 2018-08-21 | Denso Corporation | Sensor driving device |
| US10352801B2 (en) | 2016-05-10 | 2019-07-16 | Fike Corporation | Intelligent temperature and pressure gauge assembly |
| US11402275B2 (en) | 2016-08-05 | 2022-08-02 | Denso Corporation | Sensor apparatus |
| US11650110B2 (en) * | 2020-11-04 | 2023-05-16 | Honeywell International Inc. | Rosette piezo-resistive gauge circuit for thermally compensated measurement of full stress tensor |
Also Published As
| Publication number | Publication date |
|---|---|
| US20120247175A1 (en) | 2012-10-04 |
| US20140182353A1 (en) | 2014-07-03 |
| US9157826B2 (en) | 2015-10-13 |
Similar Documents
| Publication | Publication Date | Title |
|---|---|---|
| US8701460B2 (en) | Method and system to compensate for temperature and pressure in piezo resistive devices | |
| US8770034B2 (en) | Packaged sensor with multiple sensors elements | |
| JP6346922B2 (en) | Hall electromotive force correction apparatus and hall electromotive force correction method | |
| KR100741520B1 (en) | Semiconductor pressure sensor having diaphragm | |
| US8215177B2 (en) | Apparatus and methods for applying stress-induced offset compensation in sensor devices | |
| US9897502B2 (en) | Pressure transducer | |
| US9395386B2 (en) | Electronic tilt compensation for diaphragm based pressure sensors | |
| JP6714083B2 (en) | Sensor element for pressure sensor | |
| US8874387B2 (en) | Air flow measurement device and air flow correction method | |
| US20140137654A1 (en) | Measuring device for measuring a physical quantity | |
| CN111238361B (en) | Graphene temperature strain sensor | |
| CN101228422B (en) | Media isolated absolute pressure sensor | |
| US7493823B2 (en) | Pressure transducer with differential amplifier | |
| JP7168340B2 (en) | thermal flow meter | |
| CN102288357B (en) | Dual physical quantity sensor | |
| CN103502775B (en) | Method for correcting the voltage measured at the terminals of a sensor | |
| JPH02269912A (en) | Semiconductor composite sensor and signal processing method | |
| CN114910152B (en) | An accuracy correction method for weighing and measuring instruments | |
| JPH04307331A (en) | Complex sensor | |
| JP2002039888A (en) | Position setting method of gauge resistance of semiconductor pressure sensor | |
| CN117782414A (en) | Notifying sensor device and method for outputting sensed warning signal | |
| Wu | Doc4-Barometric Pressure Sensor | |
| JPH0542611B2 (en) |
Legal Events
| Date | Code | Title | Description |
|---|---|---|---|
| AS | Assignment |
Owner name: FREESCALE SEMICONDUCTOR, INC., TEXAS Free format text: ASSIGNMENT OF ASSIGNORS INTEREST;ASSIGNORS:KRISHNA, SIDDHARTHA GOPAL;DAWSON, CHAD S.;VARMA, VIKRAM;REEL/FRAME:026058/0909 Effective date: 20110328 |
|
| AS | Assignment |
Owner name: CITIBANK, N.A., AS COLLATERAL AGENT, NEW YORK Free format text: SECURITY AGREEMENT;ASSIGNOR:FREESCALE SEMICONDUCTOR, INC.;REEL/FRAME:027622/0075 Effective date: 20120116 Owner name: CITIBANK, N.A., AS COLLATERAL AGENT, NEW YORK Free format text: SECURITY AGREEMENT;ASSIGNOR:FREESCALE SEMICONDUCTOR, INC.;REEL/FRAME:027621/0928 Effective date: 20120116 Owner name: CITIBANK, N.A., AS COLLATERAL AGENT, NEW YORK Free format text: SECURITY AGREEMENT;ASSIGNOR:FREESCALE SEMICONDUCTOR, INC.;REEL/FRAME:027622/0477 Effective date: 20120116 |
|
| AS | Assignment |
Owner name: CITIBANK, N.A., AS NOTES COLLATERAL AGENT, NEW YORK Free format text: SECURITY AGREEMENT;ASSIGNOR:FREESCALE SEMICONDUCTOR, INC.;REEL/FRAME:030633/0424 Effective date: 20130521 Owner name: CITIBANK, N.A., AS NOTES COLLATERAL AGENT, NEW YOR Free format text: SECURITY AGREEMENT;ASSIGNOR:FREESCALE SEMICONDUCTOR, INC.;REEL/FRAME:030633/0424 Effective date: 20130521 |
|
| AS | Assignment |
Owner name: CITIBANK, N.A., AS NOTES COLLATERAL AGENT, NEW YORK Free format text: SECURITY AGREEMENT;ASSIGNOR:FREESCALE SEMICONDUCTOR, INC.;REEL/FRAME:031591/0266 Effective date: 20131101 Owner name: CITIBANK, N.A., AS NOTES COLLATERAL AGENT, NEW YOR Free format text: SECURITY AGREEMENT;ASSIGNOR:FREESCALE SEMICONDUCTOR, INC.;REEL/FRAME:031591/0266 Effective date: 20131101 |
|
| STCF | Information on status: patent grant |
Free format text: PATENTED CASE |
|
| AS | Assignment |
Owner name: FREESCALE SEMICONDUCTOR, INC., TEXAS Free format text: PATENT RELEASE;ASSIGNOR:CITIBANK, N.A., AS COLLATERAL AGENT;REEL/FRAME:037357/0387 Effective date: 20151207 Owner name: FREESCALE SEMICONDUCTOR, INC., TEXAS Free format text: PATENT RELEASE;ASSIGNOR:CITIBANK, N.A., AS COLLATERAL AGENT;REEL/FRAME:037357/0334 Effective date: 20151207 Owner name: FREESCALE SEMICONDUCTOR, INC., TEXAS Free format text: PATENT RELEASE;ASSIGNOR:CITIBANK, N.A., AS COLLATERAL AGENT;REEL/FRAME:037357/0285 Effective date: 20151207 |
|
| AS | Assignment |
Owner name: MORGAN STANLEY SENIOR FUNDING, INC., MARYLAND Free format text: ASSIGNMENT AND ASSUMPTION OF SECURITY INTEREST IN PATENTS;ASSIGNOR:CITIBANK, N.A.;REEL/FRAME:037486/0517 Effective date: 20151207 |
|
| AS | Assignment |
Owner name: MORGAN STANLEY SENIOR FUNDING, INC., MARYLAND Free format text: ASSIGNMENT AND ASSUMPTION OF SECURITY INTEREST IN PATENTS;ASSIGNOR:CITIBANK, N.A.;REEL/FRAME:037518/0292 Effective date: 20151207 |
|
| AS | Assignment |
Owner name: MORGAN STANLEY SENIOR FUNDING, INC., MARYLAND Free format text: SECURITY AGREEMENT SUPPLEMENT;ASSIGNOR:NXP B.V.;REEL/FRAME:038017/0058 Effective date: 20160218 |
|
| AS | Assignment |
Owner name: MORGAN STANLEY SENIOR FUNDING, INC., MARYLAND Free format text: SUPPLEMENT TO THE SECURITY AGREEMENT;ASSIGNOR:FREESCALE SEMICONDUCTOR, INC.;REEL/FRAME:039138/0001 Effective date: 20160525 |
|
| AS | Assignment |
Owner name: MORGAN STANLEY SENIOR FUNDING, INC., MARYLAND Free format text: CORRECTIVE ASSIGNMENT TO CORRECT THE REMOVE APPLICATION 12092129 PREVIOUSLY RECORDED ON REEL 038017 FRAME 0058. ASSIGNOR(S) HEREBY CONFIRMS THE SECURITY AGREEMENT SUPPLEMENT;ASSIGNOR:NXP B.V.;REEL/FRAME:039361/0212 Effective date: 20160218 |
|
| AS | Assignment |
Owner name: NXP, B.V., F/K/A FREESCALE SEMICONDUCTOR, INC., NETHERLANDS Free format text: RELEASE BY SECURED PARTY;ASSIGNOR:MORGAN STANLEY SENIOR FUNDING, INC.;REEL/FRAME:040925/0001 Effective date: 20160912 Owner name: NXP, B.V., F/K/A FREESCALE SEMICONDUCTOR, INC., NE Free format text: RELEASE BY SECURED PARTY;ASSIGNOR:MORGAN STANLEY SENIOR FUNDING, INC.;REEL/FRAME:040925/0001 Effective date: 20160912 |
|
| AS | Assignment |
Owner name: NXP B.V., NETHERLANDS Free format text: RELEASE BY SECURED PARTY;ASSIGNOR:MORGAN STANLEY SENIOR FUNDING, INC.;REEL/FRAME:040928/0001 Effective date: 20160622 |
|
| AS | Assignment |
Owner name: NXP USA, INC., TEXAS Free format text: MERGER;ASSIGNOR:FREESCALE SEMICONDUCTOR, INC.;REEL/FRAME:040652/0241 Effective date: 20161107 Owner name: NXP USA, INC., TEXAS Free format text: CHANGE OF NAME;ASSIGNOR:FREESCALE SEMICONDUCTOR, INC.;REEL/FRAME:040652/0241 Effective date: 20161107 |
|
| AS | Assignment |
Owner name: NXP USA, INC., TEXAS Free format text: CORRECTIVE ASSIGNMENT TO CORRECT THE NATURE OF CONVEYANCE PREVIOUSLY RECORDED AT REEL: 040652 FRAME: 0241. ASSIGNOR(S) HEREBY CONFIRMS THE MERGER AND CHANGE OF NAME;ASSIGNOR:FREESCALE SEMICONDUCTOR, INC.;REEL/FRAME:041260/0850 Effective date: 20161107 |
|
| AS | Assignment |
Owner name: MORGAN STANLEY SENIOR FUNDING, INC., MARYLAND Free format text: CORRECTIVE ASSIGNMENT TO CORRECT THE REMOVE PATENTS 8108266 AND 8062324 AND REPLACE THEM WITH 6108266 AND 8060324 PREVIOUSLY RECORDED ON REEL 037518 FRAME 0292. ASSIGNOR(S) HEREBY CONFIRMS THE ASSIGNMENT AND ASSUMPTION OF SECURITY INTEREST IN PATENTS;ASSIGNOR:CITIBANK, N.A.;REEL/FRAME:041703/0536 Effective date: 20151207 |
|
| AS | Assignment |
Owner name: MORGAN STANLEY SENIOR FUNDING, INC., MARYLAND Free format text: CORRECTIVE ASSIGNMENT TO CORRECT THE REMOVE APPLICATION 12681366 PREVIOUSLY RECORDED ON REEL 038017 FRAME 0058. ASSIGNOR(S) HEREBY CONFIRMS THE SECURITY AGREEMENT SUPPLEMENT;ASSIGNOR:NXP B.V.;REEL/FRAME:042985/0001 Effective date: 20160218 Owner name: MORGAN STANLEY SENIOR FUNDING, INC., MARYLAND Free format text: CORRECTIVE ASSIGNMENT TO CORRECT THE REMOVE APPLICATION 12681366 PREVIOUSLY RECORDED ON REEL 039361 FRAME 0212. ASSIGNOR(S) HEREBY CONFIRMS THE SECURITY AGREEMENT SUPPLEMENT;ASSIGNOR:NXP B.V.;REEL/FRAME:042762/0145 Effective date: 20160218 |
|
| MAFP | Maintenance fee payment |
Free format text: PAYMENT OF MAINTENANCE FEE, 4TH YEAR, LARGE ENTITY (ORIGINAL EVENT CODE: M1551) Year of fee payment: 4 |
|
| AS | Assignment |
Owner name: SHENZHEN XINGUODU TECHNOLOGY CO., LTD., CHINA Free format text: CORRECTIVE ASSIGNMENT TO CORRECT THE TO CORRECT THE APPLICATION NO. FROM 13,883,290 TO 13,833,290 PREVIOUSLY RECORDED ON REEL 041703 FRAME 0536. ASSIGNOR(S) HEREBY CONFIRMS THE THE ASSIGNMENT AND ASSUMPTION OF SECURITYINTEREST IN PATENTS.;ASSIGNOR:MORGAN STANLEY SENIOR FUNDING, INC.;REEL/FRAME:048734/0001 Effective date: 20190217 Owner name: SHENZHEN XINGUODU TECHNOLOGY CO., LTD., CHINA Free format text: CORRECTIVE ASSIGNMENT TO CORRECT THE TO CORRECT THE APPLICATION NO. FROM 13,883,290 TO 13,833,290 PREVIOUSLY RECORDED ON REEL 041703 FRAME 0536. ASSIGNOR(S) HEREBY CONFIRMS THE THE ASSIGNMENT AND ASSUMPTION OF SECURITY INTEREST IN PATENTS.;ASSIGNOR:MORGAN STANLEY SENIOR FUNDING, INC.;REEL/FRAME:048734/0001 Effective date: 20190217 |
|
| AS | Assignment |
Owner name: NXP B.V., NETHERLANDS Free format text: RELEASE BY SECURED PARTY;ASSIGNOR:MORGAN STANLEY SENIOR FUNDING, INC.;REEL/FRAME:050744/0097 Effective date: 20190903 Owner name: NXP B.V., NETHERLANDS Free format text: RELEASE BY SECURED PARTY;ASSIGNOR:MORGAN STANLEY SENIOR FUNDING, INC.;REEL/FRAME:050745/0001 Effective date: 20190903 |
|
| AS | Assignment |
Owner name: MORGAN STANLEY SENIOR FUNDING, INC., MARYLAND Free format text: CORRECTIVE ASSIGNMENT TO CORRECT THE REMOVE APPLICATION 12298143 PREVIOUSLY RECORDED ON REEL 042762 FRAME 0145. ASSIGNOR(S) HEREBY CONFIRMS THE SECURITY AGREEMENT SUPPLEMENT;ASSIGNOR:NXP B.V.;REEL/FRAME:051145/0184 Effective date: 20160218 Owner name: MORGAN STANLEY SENIOR FUNDING, INC., MARYLAND Free format text: CORRECTIVE ASSIGNMENT TO CORRECT THE REMOVE APPLICATION 12298143 PREVIOUSLY RECORDED ON REEL 039361 FRAME 0212. ASSIGNOR(S) HEREBY CONFIRMS THE SECURITY AGREEMENT SUPPLEMENT;ASSIGNOR:NXP B.V.;REEL/FRAME:051029/0387 Effective date: 20160218 Owner name: MORGAN STANLEY SENIOR FUNDING, INC., MARYLAND Free format text: CORRECTIVE ASSIGNMENT TO CORRECT THE REMOVE APPLICATION 12298143 PREVIOUSLY RECORDED ON REEL 042985 FRAME 0001. ASSIGNOR(S) HEREBY CONFIRMS THE SECURITY AGREEMENT SUPPLEMENT;ASSIGNOR:NXP B.V.;REEL/FRAME:051029/0001 Effective date: 20160218 Owner name: MORGAN STANLEY SENIOR FUNDING, INC., MARYLAND Free format text: CORRECTIVE ASSIGNMENT TO CORRECT THE REMOVE APPLICATION12298143 PREVIOUSLY RECORDED ON REEL 042762 FRAME 0145. ASSIGNOR(S) HEREBY CONFIRMS THE SECURITY AGREEMENT SUPPLEMENT;ASSIGNOR:NXP B.V.;REEL/FRAME:051145/0184 Effective date: 20160218 Owner name: MORGAN STANLEY SENIOR FUNDING, INC., MARYLAND Free format text: CORRECTIVE ASSIGNMENT TO CORRECT THE REMOVE APPLICATION12298143 PREVIOUSLY RECORDED ON REEL 042985 FRAME 0001. ASSIGNOR(S) HEREBY CONFIRMS THE SECURITY AGREEMENT SUPPLEMENT;ASSIGNOR:NXP B.V.;REEL/FRAME:051029/0001 Effective date: 20160218 Owner name: MORGAN STANLEY SENIOR FUNDING, INC., MARYLAND Free format text: CORRECTIVE ASSIGNMENT TO CORRECT THE REMOVE APPLICATION 12298143 PREVIOUSLY RECORDED ON REEL 038017 FRAME 0058. ASSIGNOR(S) HEREBY CONFIRMS THE SECURITY AGREEMENT SUPPLEMENT;ASSIGNOR:NXP B.V.;REEL/FRAME:051030/0001 Effective date: 20160218 Owner name: MORGAN STANLEY SENIOR FUNDING, INC., MARYLAND Free format text: CORRECTIVE ASSIGNMENT TO CORRECT THE REMOVE APPLICATION12298143 PREVIOUSLY RECORDED ON REEL 039361 FRAME 0212. ASSIGNOR(S) HEREBY CONFIRMS THE SECURITY AGREEMENT SUPPLEMENT;ASSIGNOR:NXP B.V.;REEL/FRAME:051029/0387 Effective date: 20160218 |
|
| AS | Assignment |
Owner name: MORGAN STANLEY SENIOR FUNDING, INC., MARYLAND Free format text: CORRECTIVE ASSIGNMENT TO CORRECT THE REMOVE APPLICATION11759915 AND REPLACE IT WITH APPLICATION 11759935 PREVIOUSLY RECORDED ON REEL 037486 FRAME 0517. ASSIGNOR(S) HEREBY CONFIRMS THE ASSIGNMENT AND ASSUMPTION OF SECURITYINTEREST IN PATENTS;ASSIGNOR:CITIBANK, N.A.;REEL/FRAME:053547/0421 Effective date: 20151207 Owner name: MORGAN STANLEY SENIOR FUNDING, INC., MARYLAND Free format text: CORRECTIVE ASSIGNMENT TO CORRECT THE REMOVE APPLICATION 11759915 AND REPLACE IT WITH APPLICATION 11759935 PREVIOUSLY RECORDED ON REEL 037486 FRAME 0517. ASSIGNOR(S) HEREBY CONFIRMS THE ASSIGNMENT AND ASSUMPTION OF SECURITY INTEREST IN PATENTS;ASSIGNOR:CITIBANK, N.A.;REEL/FRAME:053547/0421 Effective date: 20151207 |
|
| AS | Assignment |
Owner name: NXP B.V., NETHERLANDS Free format text: CORRECTIVE ASSIGNMENT TO CORRECT THE REMOVEAPPLICATION 11759915 AND REPLACE IT WITH APPLICATION11759935 PREVIOUSLY RECORDED ON REEL 040928 FRAME 0001. ASSIGNOR(S) HEREBY CONFIRMS THE RELEASE OF SECURITYINTEREST;ASSIGNOR:MORGAN STANLEY SENIOR FUNDING, INC.;REEL/FRAME:052915/0001 Effective date: 20160622 Owner name: NXP B.V., NETHERLANDS Free format text: CORRECTIVE ASSIGNMENT TO CORRECT THE REMOVE APPLICATION 11759915 AND REPLACE IT WITH APPLICATION 11759935 PREVIOUSLY RECORDED ON REEL 040928 FRAME 0001. ASSIGNOR(S) HEREBY CONFIRMS THE RELEASE OF SECURITY INTEREST;ASSIGNOR:MORGAN STANLEY SENIOR FUNDING, INC.;REEL/FRAME:052915/0001 Effective date: 20160622 |
|
| AS | Assignment |
Owner name: NXP, B.V. F/K/A FREESCALE SEMICONDUCTOR, INC., NETHERLANDS Free format text: CORRECTIVE ASSIGNMENT TO CORRECT THE REMOVEAPPLICATION 11759915 AND REPLACE IT WITH APPLICATION11759935 PREVIOUSLY RECORDED ON REEL 040925 FRAME 0001. ASSIGNOR(S) HEREBY CONFIRMS THE RELEASE OF SECURITYINTEREST;ASSIGNOR:MORGAN STANLEY SENIOR FUNDING, INC.;REEL/FRAME:052917/0001 Effective date: 20160912 Owner name: NXP, B.V. F/K/A FREESCALE SEMICONDUCTOR, INC., NETHERLANDS Free format text: CORRECTIVE ASSIGNMENT TO CORRECT THE REMOVE APPLICATION 11759915 AND REPLACE IT WITH APPLICATION 11759935 PREVIOUSLY RECORDED ON REEL 040925 FRAME 0001. ASSIGNOR(S) HEREBY CONFIRMS THE RELEASE OF SECURITY INTEREST;ASSIGNOR:MORGAN STANLEY SENIOR FUNDING, INC.;REEL/FRAME:052917/0001 Effective date: 20160912 |
|
| MAFP | Maintenance fee payment |
Free format text: PAYMENT OF MAINTENANCE FEE, 8TH YEAR, LARGE ENTITY (ORIGINAL EVENT CODE: M1552); ENTITY STATUS OF PATENT OWNER: LARGE ENTITY Year of fee payment: 8 |
|
| MAFP | Maintenance fee payment |
Free format text: PAYMENT OF MAINTENANCE FEE, 12TH YEAR, LARGE ENTITY (ORIGINAL EVENT CODE: M1553); ENTITY STATUS OF PATENT OWNER: LARGE ENTITY Year of fee payment: 12 |