US8198019B1 - Protein profiling for premalignant tissue - Google Patents
Protein profiling for premalignant tissue Download PDFInfo
- Publication number
- US8198019B1 US8198019B1 US10/249,385 US24938503A US8198019B1 US 8198019 B1 US8198019 B1 US 8198019B1 US 24938503 A US24938503 A US 24938503A US 8198019 B1 US8198019 B1 US 8198019B1
- Authority
- US
- United States
- Prior art keywords
- cells
- premalignant
- tissue
- lung
- cell population
- Prior art date
- Legal status (The legal status is an assumption and is not a legal conclusion. Google has not performed a legal analysis and makes no representation as to the accuracy of the status listed.)
- Expired - Fee Related, expires
Links
Images


Classifications
-
- G—PHYSICS
- G01—MEASURING; TESTING
- G01N—INVESTIGATING OR ANALYSING MATERIALS BY DETERMINING THEIR CHEMICAL OR PHYSICAL PROPERTIES
- G01N33/00—Investigating or analysing materials by specific methods not covered by groups G01N1/00 - G01N31/00
- G01N33/48—Biological material, e.g. blood, urine; Haemocytometers
- G01N33/50—Chemical analysis of biological material, e.g. blood, urine; Testing involving biospecific ligand binding methods; Immunological testing
- G01N33/53—Immunoassay; Biospecific binding assay; Materials therefor
- G01N33/575—Immunoassay; Biospecific binding assay; Materials therefor for cancer
- G01N33/5752—Immunoassay; Biospecific binding assay; Materials therefor for cancer of the lungs
-
- G—PHYSICS
- G01—MEASURING; TESTING
- G01N—INVESTIGATING OR ANALYSING MATERIALS BY DETERMINING THEIR CHEMICAL OR PHYSICAL PROPERTIES
- G01N2560/00—Chemical aspects of mass spectrometric analysis of biological material
Definitions
- This invention relates to a method of diagnosing cancer and more specifically, for detecting premalignant cells.
- Lung cancer is the leading cause of cancer death in both men and women in the United States, accounting for an estimate 160,000 deaths per year. While male incidence is beginning to fall, female lung cancer incidence is increasing with a predominance of peripheral carcinomas (adenocarcinoma). Screening for deeply malignant lung cancer cells exfoliated from the airway epithelium has not resulted in frequent early-stage lung cancer detection and cure. Several lung cancer detection trials showed no reduction in lung cancer mortality among high-risk cohorts of smokers screened with sputum cytology and radiographic techniques compared with radiographic screening alone. These studies concluded that sputum cytopathology, while highly specific, is not sufficiently sensitive for lung cancer screening.
- LCM Laser capture microdissection
- Ciphergen Biosystems, Inc. (Fremont, Calif.) has developed ProteinChip® technology that utilizes surface enhanced laser desorption/ionization time-of-flight mass spectrometry (SELDI-TOF MS) to facilitate protein profiling of complex biological mixtures.
- SELDI-TOF MS surface enhanced laser desorption/ionization time-of-flight mass spectrometry
- References relating to the SELDI-TOF MS technology include U.S. Pat. No. 6,294,790 entitled “Secondary ion generator detector for time-of-flight mass spectrometry”; U.S. Patent Application No.
- 20020177242A1 entitled “Retentate chromatography and protein chip arrays with applications in biology and medicine”
- U.S. Patent Application No. 20020182649A1 entitled “Methods for protein identification, characterization and sequencing by tandem mass spectrometry”
- U.S. Patent Application No. 20030008412A1 entitled “Plate alignment and sample transfer indicia for a multiwell multiplate stack and method for processing biological/chemical samples using the same”
- U.S. Patent Application Nos. 20030017464A1 and 20030032043A1 both entitled “Latex based adsorbent chip”
- U.S. Patent Application No. 20030054367A1 entitled “Method for correlating gene expression profiles with protein expression profiles” all assigned to Ciphergen Biosystems, Inc. and all incorporated herein by reference.
- the ProteinChip® technology advanced by Ciphergen Biosystems utilizes biochip arrays to capture individual proteins or groups of proteins with common biochemical properties such as hydrophobicity or charge from complex mixtures. These retained proteins are subsequently resolved directly by time-of-flight mass spectrometry. It is fast, sensitive and scalable for high-throughput sample processing. These characteristics make SELDI technology suitable for the studies of cancer development from premalignant lesions when minimal, multiple protein changes may have pathodiagnostic significance.
- Coupling SELDI technology with LCM of enriched cell populations provides a method to generate specific protein profiles of simply malignant lung cancer cells, and cells in intermediate stages between normal and cancer.
- the present invention stems from the inventors' discovery that proteins critical to lung neoplastic progression can be identified through the changes in peptide/protein mass spectral patterns detected by SELDI analysis of malignant lung tumors and premalignant airway epithelium lesions showing neoplastic transformation. For the first time, it is feasible to characterize malignant and premalignant lung lesions based on their unique protein mass spectral patterns.
- the present invention is a method for early detection of cancer including the steps of identifying tissue from asymptomatic individuals, gathering a substantially homogenous cell population from the tissue by laser capture microdissection (LCM), analyzing the cell population with mass spectrometry and identifying predetermined peaks in the mass spectrometry associated with an overexpression of proteins in premalignant cells.
- the mass spectrometry is done by time-of-flight technology, such as a SELDI ProteinChip® mass reader available from Ciphergen Biosystems, Fremont, Calif.
- Tissue from asymptomatic individuals may be identified by helical computed tomography. The tissue is retrieved and cryopreserved before sectioning.
- the LCM may be performed with an appropriate LCM apparatus including an AutoPixTM Automated Laser Capture Microdissection System or PixCell® Ile Laser Capture Microdissection System from Arcturus Engineering, Mountain View, Calif.
- Predetermined peaks discovered in the present invention include those at approximately 12348, 13794, 14010, 17250, 1726.8, 17922, 17930, 22250 and 22810 Da which constitute biomarkers for premalignant lung cells.
- An alternative embodiment of the invention includes a method for identifying premalignant cell biomarkers.
- the steps include identifying tissue known to be normal, identifying tissue known to be premalignant, and identifying tissue known to be malignant.
- a first substantially homogenous cell population is gathered from the normal tissue by laser capture microdissection.
- a second substantially homogenous cell population is gathered from the premalignant tissue by laser capture microdissection.
- a third substantially homogenous cell population is gathered from the malignant tissue by laser capture microdissection.
- Each resulting peptide profile is then comparatively analyzed by differentiating the peaks in the mass spectrometry to discern new biomarkers.
- cancer may be preemptively treated by gathering a substantially homogenous cell population from asymptomatic tissue by LCM, analyzing the population with mass spectrometry, identifying predetermined peaks in the mass spectrometry associated with an overexpression of proteins in premalignant cells and administering chemopreventive agents responsive to the presence of premalignant cells.
- This invention advances the type of information provided by SELDI technology for early lung cancer detection.
- Lung tumor specimens from patients treated at Moffitt Cancer Center at the University of South Florida were laser capture microdissected to obtain pure cell populations from normal lung, premalignant lesions and malignant tumors.
- SELDI mass spectrometry was used to identify protein profiles in each epithelial cell type.
- An objective of the invention was to identify protein profiles that could be used to differentiate malignant cells from non-malignant, and particularly to find early protein alterations representing the initiation of neoplastic transformation in respiratory epithelium.
- references in the field include “Use of proteomic patterns in serum to identify ovarian cancer.” Petricoin, E., Ardekani, A., Hitt, B., et al. The Lancet 2002, 359, 572-577 and “A database of protein expression in lung cancer.” Oh, J., Brichory, F., Purays, E., et el. Proteomics 2001, 1, 1303-1319.
- the present invention enables those of ordinary skill in the art to obtain unique information on lung cancer specific and premalignant lung lesions associated protein profiles (proteomic patterns) obtained with SELDI mass spectrometry data analysis after laser assisted cell capturing. This permits the analysis of protein profiles from “pure” specific respiratory cell populations reflecting stages of lung cancer development.
- FIG. 1 shows an array of representative sections from lung tumors of differing cell types (before and after laser capture microdissection), premalignant (AAH) lung tissue and normal lung tissue.
- AAH premalignant
- FIG. 2 shows comparative mass/charge spectrums of normal ( FIG. 2A ) and tumor lysates ( FIG. 2B ) in addition to the loss of spectrum detail in lysates with lower numbers of cells.
- FIG. 3 a shows mass/charge spectrum of normal and squamous lung cells to demonstrate the reproducibility of the analysis.
- FIG. 3 b shows mass/charge spectrum of squamous lung cancer cells to demonstrate the reproducibility of the analysis.
- FIG. 4 shows tumor-associated changes in the low mass/charge range for squamous lunch cancer and normal bronchial cells.
- FIG. 5 a shows tumor-associated changes in the low mass/charge range for normal, atypical, and adenocarcinoma cells.
- FIG. 5 b shows tumor-associated changes in the high mass/charge range at the 16000 to 20000 dalton scale for normal, atypical, and adenocarcinoma cells.
- FIG. 5 c shows tumor-associated changes in the high mass/charge range for normal, atypical, and adenocarcinoma cells.
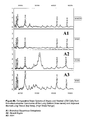
- FIG. 6 a compares spectrums in the low mass/charge range for normal and reactive type II cells adjacent to bronchioloalveolar carcinoma of the lung.
- FIG. 6 b compares spectrums in the high mass/charge range for normal and reactive type II cells adjacent to bronchioloalveolar carcinoma of the lung.
- FIG. 7 a shows tumor-associated changes in the low mass/charge range for normal and bronchioloalveolar carcinoma cells.
- FIG. 7 b shows tumor-associated changes in the high mass/charge range for normal and bronchioloalveolar carcinoma cells.
- FIG. 8 a shows comparative mass spectrums of tumor-associated changes in the low mass/charge range for normal, atypical, and bronchioloalveolar carcinoma cells
- FIG. 8 b shows comparative mass spectrums of tumor-associated changes in the high mass/charge range for normal, atypical, and bronchioloalveolar carcinoma cells.
- FIG. 9 is a table showing characteristics of samples submitted for SELDI analysis.
- FIG. 10 is a diagrammatic view of an embodiment of the invention for detecting premalignant cells.
- FIG. 11 is a diagrammatic view of an alternative embodiment of the invention for resolving new biomarkers.
- FIG. 12 is a diagrammatic view of an alternative embodiment of the invention for detecting and treating patients with premalignant cells.
- Lung tumor specimens from “Cohort of smokers” study patients treated at Moffitt Cancer Center at the University of South Florida were laser capture microdissected to obtain pure cell populations from frozen sections of normal lung, premalignant lesions and malignant tumors. SELDI mass spectrometry was used to identify protein profiles in each epithelial cell type.
- LCM was performed with 15000-20000 laser hits to each specimen.
- Cell lysates were prepared from 45 samples procured from 4 resected lung tumors (adenocarcinoma, squamous cell carcinoma, adenocarcinoma with BAC features and adenocarcinoma with BAC papillary and clear cells features) selected for analysis ( FIG. 7 ), and were applied to IMAC-Cu Chips. Chips were read on a PBS II ProteinChip Reader at low (220) and high (260) laser intensities. Clustering software was applied in the analysis of identified protein peaks.
- Highlighted proteins are of similar molecular weight range across different study cases, independent of tumor histology type, and showed that intensity of expression of six peaks is significantly high in malignant cells compared with normal cells for all cases.
- Six peaks detected in the mass spectra were significantly higher in tumor cells compared with normal cells. These peaks were: 12348, 13794, 14010, 17250, 17922 and 22810 Da.
- Two peaks at 17-18 kDa mass range and peak at 14 kDa were also increased in premalignant cells from AAH lesions.
- LCM PROTOCOL Laser capture microdissection in general is well-known in the art as provided in U.S. Pat. Nos. 5,859,699 issued Jan. 12, 1999, 5,985,085 issued Nov. 16, 1999, 6,157,446 issued Dec. 5, 2000, 6,184,973 issued Feb. 6, 2001, 6,215,550 issued Apr. 10, 2001, 6,469,779 issued Oct. 22, 2002 and 6,495,195 issued Dec. 17, 2002 all of which are incorporated herein by reference.
- Frozen tissue specimens were sectioned at 10 ⁇ m in a cryostat, mounted on uncoated glass slide and stored at 4° C. in 100% ethanol until the day of the LCM.
- H&E stain was performed on one of every 5 frozen tissue sections to assure visual discrimination of specific cell populations procured by LCM.
- Laser “capturing” was performed on frozen sections stained lightly only with hematoxylin. Each cell population is estimated to be ⁇ 98% “homogeneous” as determined by microscopic visualization of the captured cells.
- LCM was performed with capture 20000-25000 cells from each lung tumor case.
- Lysis and ProteinChip protocol LCM caps: ⁇ 1000 laser hits (1,000 to 2,000 cells).
- Lysis buffer 6 M Guanidine HCI in 0.1 M Hepes, pH 7.4, 1% Triton X100, Roche Complete protease inhibitors.
- To LCM cap added 4 ⁇ l lysis buffer and incubated one hour at RT in humidity chamber. Samples were transferred to 500 ⁇ l tubes and the caps rinsed with 10 ⁇ l 0.1 M Hepes, pH 7.4. Combined 24 ⁇ l samples were applied to IMAC-Cu Chips in a bioprocessor and incubated at RT with shaking for 1 hr. Spots were washed 3 ⁇ with 200 ⁇ l PBS and 2 ⁇ with 200 ⁇ l H 2 O.
- EAM applied, two 0.5 ml additions of saturated SPA. Chips were read on a PBS II ProteinChip Reader at low (220) and high (260) laser intensities.
- Each spot was interrogated twice, with separate optimization for low (5-12 kDa) and high (20-100 kDa) mass ranges. Mass optimization windows were set for low-mass and all of the spots on one array were analyzed. Laser power and number of shots were optimized manually. The mass optimization window was reset for the high-mass range and the samples were reanalyzed for high molecular weight proteins. Positive samples (malignant and premalignant cell lystates) and controls (normal cells) were run concurrently on the same array. For the calculation of protein peaks numbers/instensities resolved at different laser intensities, the ProteinChip Software, Version 3.0 from Ciphergen Biosystems was used. External calibration was performed using bovine insulin (5733.6 Da), bovine cytochrome C (12230.9 Da), and bovine serum albumin (66410 Da) as standards.
- SELDI mass spectral analysis was correlated with morphology from lung cancer, cells intermediate in lung cancer progression, or normal epithelial cells. Protein peaks (profiles) were considered to be differentially expressed in malignant/premalignant lung, if statistically significant differences in their frequency and/or intensity were observed, compared with normal lung epithelium. The non-parametric Mann-Whitney test and Wilcoxon Signed Ranks Test were used to compare statistically significant differences in intensity data at various protein peaks for different cell types.
- FIG. 2 shows examples of protein mass spectra of normal and malignant lung samples.
- the cell lysates from one sample of either tumor ( FIG. 2 b ) or normal ( FIG. 2 a ) cells was diluted to 1 ⁇ 2, 1 ⁇ 4, 1 ⁇ 8, and 1/16 concentration (from top to bottom) and spotted individually (equivalent to 1000, 500, 250, and 125 laser hits).
- the results for samples equivalent to 500-1000 laser hits showed consistent signal strength, suggesting that 500-1000 laser hits is a minimum sample size for this method as loss of detail was observed at lower levels of cells.
- Lysates from tumor, atypical, and normal cells were compared side by side for protein mass spectral analysis. Representative measured mass/charge ratios of specific proteins and their corresponding intensities are shown for each patient from the study set in FIGS. 4-8 .
- protein profiles for each patient were compared, they revealed similar change in several peaks expressed across different patients. Intensities for all the peaks shown in the mass/charge spectra graphs were generated by pooling all the spectra together for each individual patient and normalizing them to total ion current. Intensities for six peaks detected in the mass/charge spectra were significantly higher in tumor cells compared with normal cells. These peaks were: 12348, 13794, 14010, 17250, 17922, and 22810 Da.
- malignant lung protein profile as illustrated in Table 1. Proteins noted in bolded font are of similar molecular weight range across different study cases, independent of tumor histology type, and show that intensity of expression of six peaks is significantly higher in malignant cells compared with normal cells for all cases. Two peaks at 17-18 kDa mass range were also increased in premalignant cells from AAH lesions.
- Peaks at 47102.99 Da (not shown in table) and 66576.6 Da identified at high mass range profile are significantly higher in normal lung epithelial cells, compared with malignant or atypical samples.
- Protein profile from adenocarcinoma shows increased peaks in the 11-23 kDa mass range.
- Protein spectra of LCM cells from bronchioloalveolar carcinoma show increased peaks in the 17-23 kDa mass range compared with normal alveolar epithelial cells ( FIGS. 6 a - 8 b ).
- case 3342 Histological appearance of case 3342 showed adenocarcinoma with three foci of bronchioloalveolar, papillary, and focal clear cell features, with significant areas of AAH.
- SELDI mass spectrometry data for this case identified four distinguishable peaks in the mass range between 7 and 8 kDa (7522.8, 7649.9, 7684.4 and 7948.1 Da). These peaks were not expressed in normal epithelial cells from the same case, yet were not prominent in other study cases.
- the signal/noise for a possible peak at 14250 Da in both Reactive Type II cell samples was 1.5. Normal cells show small differences in protein expression in the higher mass range ( FIG. 6 b ).
- the two sided Mann-Whitney test and Wilcoxon Signed Ranks Test determined that the peaks at 17250 and 17930 were significantly elevated in malignant cells compared with normal cells.
- the peak at 17250 Da also was detected at low levels in bronchial atypical squamous metaplasia lesion ( FIG. 6 b , lane 2, A1, from top) and at higher levels in alveolar AAH (lanes 3, 4, A2).
- the peaks at 17250 Da showed signal/noise of 2.0 and 3.7 representing bronchial atypia and AAH, respectively (lanes 2 and 4, FIG. 6 b ).
- the peak at about 17250 Da shows a several-fold increase compared with undetectable expression in normal lung epithelial cells.
- the peak at 14000 Da is also significantly increased in cells from AAH compared with normal respiratory epithelial cells.
- the proteomic approach to the identification of lung cancer biomarkers can be focused on analysis of proteins of sub-cellular compartments such as surface membranes, nuclear and cytoplasm proteins. Databases of lung cancer proteins identified by 2-D gel now are available. Multi-dimensional liquid chromatography is another separation mode for lung cancer proteins.
- the use of protein microarrays for detecting lung cancer antigens or antibodies in sera, biological fluids or cell and tissue lysates potentially contribute to early lung cancer detection.
- the proteomic approach disclosed in this invention is based on the analysis of cell-type specific protein expression in malignant lesions detected by helical CT, and in cells exhibiting intermediate morphology associated with neoplastic transformation or differential changes in the airways epithelium.
- the invention advances the art by providing a method to identify specific protein peaks that show a marked change in expression associated with malignant tumors.
- the patterns of increases and decreases in protein levels were observed when protein profiles of tumor cells were compared with normal cells.
- the peak at 17250 Da was detected in all tumor cell types studied. This peak at 17250 Da was not detected in any of the normal cell LCM's (with a limit of detection of about 5% of tumor levels, P ⁇ 0.001) and appeared to be present at low levels in AAH samples.
- High mass range profile peaks (47102.9 and 66576.6 Da) were found at significantly greater intensities in normal lung epithelial cells, compared with malignant or atypical samples. This represents decreasing expression, or possible breakdown of these proteins to shorter peptides during malignant change in peripheral lung epithelium.
- FIG. 10 the evolution of normal cells ( 20 ) to premalignant cells ( 30 ) to cancerous cells ( 40 ) is represented.
- the invention denoted as ( 10 ), includes the steps of identifying tissue from asymptomatic individuals ( 52 ), gathering a substantially homogenous cell population ( 62 ) from the tissue by laser capture microdissection (LCM), analyzing the population with mass spectrometry to obtain a peptide profile ( 72 ) and identifying predetermined peaks or biomarkers ( 80 ) in the mass spectrometry associated with an overexpression of proteins ( 90 ) in premalignant cells.
- LCM laser capture microdissection
- the mass spectrometry is done by time-of-flight apparatus, and preferably a SELDI ProteinChip® mass reader available from Ciphergen Biosystems, Fremont, Calif.
- Asymptomatic tissue may be identified by helical computed tomography. The tissue is retrieved and cryopreserved before sectioning.
- the LCM may be performed with an appropriate LCM apparatus including an AutoPixTM Automated Laser Capture Microdissection System or PixCell® Ile Laser Capture Microdissection System from Arcturus Engineering, Mountain View, Calif.
- Predetermined peaks discovered in the present invention include those at approximately 12348, 13794, 14010, 17250, 1726.8, 17922, 17930, 22250 and 22810 Da which constitute biomarkers ( 100 ) for premalignant lung cells.
- FIG. 11 shows a method for identifying premalignant cell biomarkers including the steps of identifying tissue known to be normal ( 51 ), identifying tissue known to be premalignant ( 52 ), and identifying tissue known to be malignant ( 53 ).
- a first substantially homogenous cell population is gathered ( 61 ) from the normal tissue ( 51 ) by laser capture microdissection.
- a second substantially homogenous cell population is gathered ( 62 ) from the premalignant tissue ( 52 ) by laser capture microdissection.
- a third substantially homogenous cell population is gathered ( 63 ) from the malignant tissue ( 53 ) by laser capture microdissection.
- Each resulting peptide profile ( 71 - 73 ) is then comparatively analyzed by differentiating the peaks ( 91 ) in the mass spectrometry to discern new biomarkers ( 80 ).
- FIG. 12 shows an alternative embodiment of the invention including the steps of identifying tissue from asymptomatic individuals ( 52 ), gathering a substantially homogenous cell population ( 62 ) from the tissue by laser capture microdissection (LCM), analyzing the population with mass spectrometry to obtain a peptide profile ( 72 ), identifying predetermined peaks or biomarkers ( 80 ) in the mass spectrometry associated with an overexpression of proteins ( 90 ) in premalignant cells and initiating a treatment ( 110 ) such as administering chemopreventive agents to a patient to prevent or minimize potential malignant growth.
- a treatment such as administering chemopreventive agents to a patient to prevent or minimize potential malignant growth.
Landscapes
- Health & Medical Sciences (AREA)
- Life Sciences & Earth Sciences (AREA)
- Immunology (AREA)
- Engineering & Computer Science (AREA)
- Molecular Biology (AREA)
- Biomedical Technology (AREA)
- Chemical & Material Sciences (AREA)
- Hematology (AREA)
- Urology & Nephrology (AREA)
- Biotechnology (AREA)
- Microbiology (AREA)
- Cell Biology (AREA)
- Food Science & Technology (AREA)
- Medicinal Chemistry (AREA)
- Physics & Mathematics (AREA)
- Analytical Chemistry (AREA)
- Biochemistry (AREA)
- General Health & Medical Sciences (AREA)
- General Physics & Mathematics (AREA)
- Pathology (AREA)
- Other Investigation Or Analysis Of Materials By Electrical Means (AREA)
- Investigating Or Analysing Biological Materials (AREA)
Abstract
Description
| TABLE 1 |
| Protein peaks and intensities of expression in lung tumor and |
| cells from AAH lesions expressed in protein mass/intensity. |
| Normal Cell Type | Malignant Cell Type | AAH Cell Type | |
| 12353.6/2.01 | 12348.2/6.09* | ||
| 13803.3/3.91 | 13794.2/10.34* | ||
| 14010.3/2.44 | 14010.3/12.24* | 14000.0/8.90* | |
| 15208.7/4.97* | 15208.7/1.38 | ||
| 15921.8/15.56* | 15910.5/1.53 | ||
| 17250.0/0.00 | 17250.0/1.63* | 17250.0/0.66* | |
| 17922.4/0.12 | 17922.4/2.52* | 17926.8/0.52* | |
| 22777.9/0.20 | 22810.9/2.07* | ||
| 66633.2/2.84* | 66576.6/0.13 | ||
| *P = 0.001, Wilcoxon Signed Ranks Test. | |||
| TABLE 2 |
| SELDI intra-assay reproducibility of five |
| runs samples from |
| Protein Peaks (Da, mean +/− S.D.) | Coefficient of variation | |
| Normal Lung | ||
| 7723.28 +/− 11.53 | 0.1493148 | |
| 9053.26 +/− 12.42 | 0.1371511 | |
| 12360.14 +/− 19.99 | 0.1617828 | |
| 13815.78 +/− 21.97 | 0.1590649 | |
| 15223.52 +/− 32.37 | 0.2125213 | |
| 17978.22 +/− 45.05 | 0.2506109 | |
| 22603.32 +/− 42.18 | 0.1866218 | |
| Malignant Tumor | ||
| 7712.26 +/− 11.91 | 0.1544212 | |
| 9038.84 +/− 4.62 | 0.0511649 | |
| 12353.88 +/− 7.51 | 0.0607647 | |
| 13802.62 +/− 7.26 | 0.0526084 | |
| 15369.48 +/− 8.49 | 0.0552382 | |
| 15905.08 +/− 4.31 | 0.0270916 | |
| 17245.94 +/− 5.76 | 0.0334069 | |
| 17936.24 +/− 9.28 | 0.0517672 | |
Claims (8)
Priority Applications (1)
| Application Number | Priority Date | Filing Date | Title |
|---|---|---|---|
| US10/249,385 US8198019B1 (en) | 2002-04-04 | 2003-04-03 | Protein profiling for premalignant tissue |
Applications Claiming Priority (2)
| Application Number | Priority Date | Filing Date | Title |
|---|---|---|---|
| US36979202P | 2002-04-04 | 2002-04-04 | |
| US10/249,385 US8198019B1 (en) | 2002-04-04 | 2003-04-03 | Protein profiling for premalignant tissue |
Publications (1)
| Publication Number | Publication Date |
|---|---|
| US8198019B1 true US8198019B1 (en) | 2012-06-12 |
Family
ID=46177777
Family Applications (1)
| Application Number | Title | Priority Date | Filing Date |
|---|---|---|---|
| US10/249,385 Expired - Fee Related US8198019B1 (en) | 2002-04-04 | 2003-04-03 | Protein profiling for premalignant tissue |
Country Status (1)
| Country | Link |
|---|---|
| US (1) | US8198019B1 (en) |
Citations (1)
| Publication number | Priority date | Publication date | Assignee | Title |
|---|---|---|---|---|
| US6531318B1 (en) * | 1999-10-08 | 2003-03-11 | The General Hospital Corporation | Methods and apparatus for cell analysis |
-
2003
- 2003-04-03 US US10/249,385 patent/US8198019B1/en not_active Expired - Fee Related
Patent Citations (1)
| Publication number | Priority date | Publication date | Assignee | Title |
|---|---|---|---|---|
| US6531318B1 (en) * | 1999-10-08 | 2003-03-11 | The General Hospital Corporation | Methods and apparatus for cell analysis |
Non-Patent Citations (13)
| Title |
|---|
| Campa et al.; Protein Expression Profiling Identifies Macrophage Migration Inhibitory Factor & Cyclophilin A as Potential Molecular Targets in Non-Small Cell Lung Cancer; DUke Unv.; Apr. 1, 2003. |
| Cazares et al. Clinical Cancer Res. 8: 2541-2552, 2002. * |
| Diamandis, Clin. Chem., 2003, 49(8): 1272-1278. * |
| Garvey et al. BMJ 324: 1077-1080, 2002. * |
| Jacobs et al. Mol. Cel. Proteomics, 3.4: 355-366, 2004. * |
| Mass Spectrometry-based Diagnostics: The Upcoming Revolution in Disease Detection; Clinical Chemistry; 49, No. 4; 2003. |
| Paweletz et al. Drug Dev. Res. 49: 34-42, 2000. * |
| Paweletz et al.; New Technologies for Biomarker Analysis of Prostate Cancer Progression: Laser Capture Microdissection and Tissue Proteomics; Elsevier Science, Inc.; 2001. |
| Srinivas et al. Clinical Chemistry, 47(10): 1901-1911, 2001. * |
| Wulfkuhle et al. Nature Reviews/Cancer, 3: 267-275, 2003. * |
| Wulfkuhle et al. Proteomics, 1: 1205-1215, 2001. * |
| Zhukov et al.; Discovery of Distinct Protein Profiles Specific for Lung Tumors & Pre-Malignant Lung Lesions by SELDI Mass Spectrometry; Elsevier Science Ireland Ltd.; 2003. |
| Zhukov, et al. Prodeedings of the American Association for Cancer Research, Annual Meeting, (Mar. 2002), vol. 43, pp. 36. print. * |
Similar Documents
| Publication | Publication Date | Title |
|---|---|---|
| Zhukov et al. | Discovery of distinct protein profiles specific for lung tumors and pre-malignant lung lesions by SELDI mass spectrometry | |
| Pusch et al. | Mass spectrometry-based clinical proteomics | |
| Hu et al. | Discovery of oral fluid biomarkers for human oral cancer by mass spectrometry | |
| Seibert et al. | Advances in clinical cancer proteomics: SELDI-ToF-mass spectrometry and biomarker discovery | |
| Veenstra et al. | Proteomic patterns for early cancer detection | |
| Yip et al. | SELDI ProteinChip® array in oncoproteomic research | |
| Flatley et al. | MALDI mass spectrometry in prostate cancer biomarker discovery | |
| Zhang et al. | Tree analysis of mass spectral urine profiles discriminates transitional cell carcinoma of the bladder from noncancer patient | |
| Smith et al. | α‐1‐Antitrypsin detected by MALDI imaging in the study of glomerulonephritis: Its relevance in chronic kidney disease progression | |
| Drake et al. | Serum, salivary and tissue proteomics for discovery of biomarkers for head and neck cancers | |
| JP2002537561A (en) | Methods and apparatus for isolating and analyzing cellular protein components | |
| Li et al. | Identification of a plasma proteomic signature to distinguish pediatric osteosarcoma from benign osteochondroma | |
| Ocak et al. | Mass spectrometry–based proteomic profiling of lung cancer | |
| Widlak et al. | Serum mass profile signature as a biomarker of early lung cancer | |
| KR20090012313A (en) | Apparatus and method for predicting disease | |
| Massion et al. | Proteomic strategies for the characterization and the early detection of lung cancer | |
| Liu et al. | Serum protein profiling of smear-positive and smear-negative pulmonary tuberculosis using SELDI-TOF mass spectrometry | |
| Gemoll et al. | MALDI mass spectrometry imaging in oncology | |
| Roboz | Mass spectrometry in diagnostic oncoproteomics | |
| CN108828229B (en) | Esophageal cancer tumor marker combination and its application | |
| US20120109530A1 (en) | Method of classifying chemically crosslinked cellular samples using mass spectra | |
| Yanagisawa et al. | Molecular fingerprinting in human lung cancer | |
| Xu et al. | MALDI‐MS derived prognostic protein markers for resected non‐small cell lung cancer | |
| US8198019B1 (en) | Protein profiling for premalignant tissue | |
| CN111748624B (en) | Biomarker for predicting whether liver cancer is recurrent |
Legal Events
| Date | Code | Title | Description |
|---|---|---|---|
| AS | Assignment |
Owner name: UNIVERSITY OF SOUTH FLORIDA, FLORIDA Free format text: ASSIGNMENT OF ASSIGNORS INTEREST;ASSIGNORS:ZHUKOV, TATYANA A.;TOCKMAN, MELVYN S.;REEL/FRAME:013583/0009 Effective date: 20030415 |
|
| AS | Assignment |
Owner name: CIPHERGEN BIOSYSTEMS, INC., CALIFORNIA Free format text: ASSIGNMENT OF ASSIGNORS INTEREST;ASSIGNOR:JOHANSON, ROY A.;REEL/FRAME:018295/0310 Effective date: 20060329 |
|
| ZAAA | Notice of allowance and fees due |
Free format text: ORIGINAL CODE: NOA |
|
| ZAAB | Notice of allowance mailed |
Free format text: ORIGINAL CODE: MN/=. |
|
| STCF | Information on status: patent grant |
Free format text: PATENTED CASE |
|
| FPAY | Fee payment |
Year of fee payment: 4 |
|
| MAFP | Maintenance fee payment |
Free format text: PAYMENT OF MAINTENANCE FEE, 8TH YR, SMALL ENTITY (ORIGINAL EVENT CODE: M2552); ENTITY STATUS OF PATENT OWNER: SMALL ENTITY Year of fee payment: 8 |
|
| FEPP | Fee payment procedure |
Free format text: MAINTENANCE FEE REMINDER MAILED (ORIGINAL EVENT CODE: REM.); ENTITY STATUS OF PATENT OWNER: SMALL ENTITY |
|
| LAPS | Lapse for failure to pay maintenance fees |
Free format text: PATENT EXPIRED FOR FAILURE TO PAY MAINTENANCE FEES (ORIGINAL EVENT CODE: EXP.); ENTITY STATUS OF PATENT OWNER: SMALL ENTITY |
|
| STCH | Information on status: patent discontinuation |
Free format text: PATENT EXPIRED DUE TO NONPAYMENT OF MAINTENANCE FEES UNDER 37 CFR 1.362 |
|
| FP | Lapsed due to failure to pay maintenance fee |
Effective date: 20240612 |