US7962607B1 - Generating an operational definition of baseline for monitoring network traffic data - Google Patents
Generating an operational definition of baseline for monitoring network traffic data Download PDFInfo
- Publication number
- US7962607B1 US7962607B1 US11/518,015 US51801506A US7962607B1 US 7962607 B1 US7962607 B1 US 7962607B1 US 51801506 A US51801506 A US 51801506A US 7962607 B1 US7962607 B1 US 7962607B1
- Authority
- US
- United States
- Prior art keywords
- instructions
- network traffic
- traffic data
- data
- calculating
- Prior art date
- Legal status (The legal status is an assumption and is not a legal conclusion. Google has not performed a legal analysis and makes no representation as to the accuracy of the status listed.)
- Active, expires
Links
Images


Classifications
-
- H—ELECTRICITY
- H04—ELECTRIC COMMUNICATION TECHNIQUE
- H04L—TRANSMISSION OF DIGITAL INFORMATION, e.g. TELEGRAPHIC COMMUNICATION
- H04L43/00—Arrangements for monitoring or testing data switching networks
- H04L43/04—Processing captured monitoring data, e.g. for logfile generation
-
- H—ELECTRICITY
- H04—ELECTRIC COMMUNICATION TECHNIQUE
- H04L—TRANSMISSION OF DIGITAL INFORMATION, e.g. TELEGRAPHIC COMMUNICATION
- H04L41/00—Arrangements for maintenance, administration or management of data switching networks, e.g. of packet switching networks
- H04L41/14—Network analysis or design
- H04L41/142—Network analysis or design using statistical or mathematical methods
-
- H—ELECTRICITY
- H04—ELECTRIC COMMUNICATION TECHNIQUE
- H04L—TRANSMISSION OF DIGITAL INFORMATION, e.g. TELEGRAPHIC COMMUNICATION
- H04L41/00—Arrangements for maintenance, administration or management of data switching networks, e.g. of packet switching networks
- H04L41/14—Network analysis or design
- H04L41/147—Network analysis or design for predicting network behaviour
-
- H—ELECTRICITY
- H04—ELECTRIC COMMUNICATION TECHNIQUE
- H04L—TRANSMISSION OF DIGITAL INFORMATION, e.g. TELEGRAPHIC COMMUNICATION
- H04L43/00—Arrangements for monitoring or testing data switching networks
- H04L43/04—Processing captured monitoring data, e.g. for logfile generation
- H04L43/045—Processing captured monitoring data, e.g. for logfile generation for graphical visualisation of monitoring data
Definitions
- the present invention relates generally to the field of network and application management of computer networks, and, more specifically, to the field of monitoring networks.
- a conventional moving average is often used as a baseline.
- a baseline value is an arithmetic average of measured values within a fixed time window. Since baselining is to show a relatively short term behavior, the number of data set inside the window is small and the data distribution usually has a very large variance.
- the arithmetic average is not a good estimate of the expected value (or mathematical expectation) of a measure, which is also called the population mean.
- the baseline value obtained by using this sample mean can be very misleading (e.g., inaccurate), and an inner band and outer band based on the sample mean and sample variance may become meaningless due to an unknown sample data distribution with a large variance of the network traffic measure.
- a system and a method are disclosed for establishing a baseline and the corresponding bands of data for alarming.
- Historical raw data are aggregated and grouped. For example, the data may be hourly grouped as 168 groups of data in a weekly frame. Clusters of the groups of data are then formed based on dynamic data window by analyzing statistical similarity among the 168 groups of data.
- Data in each cluster of groups originated from the raw data at specific hour(s) of day on specific day(s) of week, are used as historical data to predict a baseline and the envelopes at these associated hour(s) and day(s).
- Generating a baseline includes determining a mapping function, which transforms data in a cluster to become normal or nearly normal.
- a mean and standard deviation of the transformed data are calculated. Envelopes are determined using the mean and the standard deviation.
- An inverse transformation function is uniquely derived. The mean and the envelopes are inversely transformed using the inverse function. This operationally decides a baseline and the corresponding bands for every weekly time frame hour.
- FIG. 1 is a block diagram illustrating an analysis engine according to the present invention.
- FIG. 2 is a diagram illustrating a data structure for caching per 15-minutes data in the analysis engine of FIG. 1 .
- FIG. 3 is a table illustrating data prepared for analysis from the extracted data of FIG. 2 .
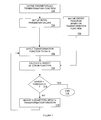
- FIG. 4 is a flowchart illustrating one embodiment of the methodology of a data query module, a data storage module, and a data preparation module of the analysis engine of FIG. 1 .
- FIG. 5 is a flowchart illustrating one embodiment of the methodology of forming clusters of the methodology of FIG. 4 .
- FIG. 6 is a flowchart illustrating one embodiment of the methodology of a data analysis module of the analysis engine of FIG. 1 .
- FIG. 7 is a flowchart illustrating one embodiment of the methodology of determining the transformation function of the methodology of FIG. 6 .
- FIG. 8 is a flowchart illustrating one embodiment of the methodology of deriving the inverse transformation function and applying it to generate a baseline and the corresponding bands of the methodology of FIG. 6 .
- FIG. 9 is a diagram illustrating data of baseline and bands calculated by the analysis engine of FIG. 1 .
- Embodiments of the invention may also relate to an apparatus for performing the operations herein.
- This apparatus may be specially constructed for the required purposes, or it may comprise a general-purpose computing device selectively activated or reconfigured by a computer program stored in the computer.
- a computer program may be stored in a computer readable storage medium, such as, but not limited to, any type of disk including floppy disks, optical disks, CD-ROMs, magnetic-optical disks, read-only memories (ROMs), random access memories (RAMs), EPROMs, EEPROMs, magnetic or optical cards, application specific integrated circuits (ASICs), or any type of media suitable for storing electronic instructions, and each coupled to a computer system bus.
- the disclosed embodiments describe a system and method for operationally defining a baseline of the network traffic data and the associated inner and outer bands.
- the baseline of a measure e.g., total bytes, utilizations, conversations, errors, or the like
- the baseline of a measure may be a function of time (e.g., hour of day, day of week, or the like.) and entities (e.g., interface, server, application, subnet, or the like).
- time e.g., hour of day, day of week, or the like.
- entities e.g., interface, server, application, subnet, or the like.
- the baselines of various network traffic measures from the prediction based on the transformed data can provide a more convincing indication for judging network performance.
- the actual data, baseline and associated bands of any selected measure may be dependent on given network critical entities for a fixed time interval. Superimposition of these values on a chart easily presents the behavior of a network traffic behavior to a user. The user may tune the band level parameters based on the standard deviation of a normal distribution, and monitor the changing of alert status on the same traffic data.
- FIG. 1 is a block diagram illustrating an analysis engine 100 according to the present invention.
- the analysis engine 100 may receive data from a plurality of sources.
- the sources are databases at data servers.
- the data have at least two characteristics, namely key and measures.
- the key is an abstraction of a physical entity that is the source of the data.
- the measure is an abstraction of the form and size of the data.
- the measure may be, for example, packets or bytes.
- a key may have one or more measures. Each measure has a value.
- the data may be gathered at a different rate than the granularity used for the baselining.
- the analysis engine 100 groups the data hourly in a weekly time frame and determines a window dynamically for clustering among these groups.
- the analysis engine 100 generates a baseline point and the corresponding bands based on the data in each cluster.
- the analysis engine 100 comprises a data query module 102 , a data storage module 104 , a data preparation module 106 , and a data analysis module 108 .
- the data query module 102 may extract, filter, group and order the data based on preset criteria (e.g., analysis type, interface, number of entities, time period, or the like), and cache them to the data storage 104 .
- preset criteria e.g., analysis type, interface, number of entities, time period, or the like
- the data storage 104 caches the data in its received and derived form for the data preparation module 106 . After the baseline prediction is done by analyzing these data, the analysis engine 100 frees the storage space and starts extracting data again, and repeats the process until all enabled entities for baselining are finished.
- the analysis engine 100 may comprise a conventional computer including a processor that executes the data query module 102 , the data preparation module 106 and the data analysis module 108 , and includes a memory for the data storage 104 .
- FIG. 2 is a diagram illustrating data cached in the data storage 104 .
- Each measure includes 168 hourly-grouped data objects in a weekly time frame.
- Each data object has a value matrix, and the data attributes which are derived when executing the data query module 102 .
- raw data are extracted, aggregated, and stored in 15-minutes intervals. (For some analysis type, one-minute intervals are used.)
- the data query module 102 extracts, groups and orders raw data into groups based on time, such as one hour increments in a weekly time frame.
- the data storage 104 caches data for the purpose of efficient data access.
- the data preparation module 106 clusters the groups of data based on statistical similarity of the groups.
- FIG. 3 is a table illustrating clusters from the groups of data of FIG. 2 .
- the number “32” in a cell indicates the number of data points in an hourly group.
- the number “32” is a configurable number and dependent on the availability and suitability of historical raw data. (Raw data may be too old to use if the number is large. In one embodiment, baselining is for studying a relatively short-term behavior.)
- Clustering is based on similarity of the distribution of the data values in each group. For example, the group for Monday, 12:00 a.m.-1:00 a.m. is clustered with the group for the following hour Monday, 1:00 a.m.-2:00 a.m. The data for 12:00 a.m.-1:00 a.m. on Wednesday, Thursday, and Friday are grouped as a cluster.
- the data analysis module 108 transforms the data in each cluster using the data transformation function determined by the data in the cluster from the data preparation module 106 as described below in conjunction with FIG. 5 .
- the data transformation function is determined through a learning process (e.g., by way of feedback control) based on the input data of a cluster from the data preparation module 106 , so that after the transformation the cluster of data has a normal or nearly normal distribution, and thereby the population mean can be well estimated by the sample mean. (For the case of a normal distribution, no unbiased estimator of the population mean has a smaller variance than its sample mean.)
- the data analysis module 108 determines a transformation function, transforms the data from the data preparation module 106 , remove outliers, calculates a mean and standard deviation of the transformed data, and calculates envelopes using the mean and standard deviation.
- the data analysis module 108 also derives the corresponding inverse transformation function and transforms the mean and envelopes back into the original data space. The inversely transformed mean and the envelopes are used to form a baseline and the corresponding bands.
- the envelopes may be used as thresholds to create alarms, alerts, violations, or the like. For example, the occurrence of data falling outside the outermost envelopes may trigger a violation, and the occurrence of data falling outside an inner envelope but within the outside envelope (e.g., inside the outer bands) may trigger an alert.
- FIG. 4 is a flowchart illustrating one embodiment of the methodology of the data query module 102 , the data storage module 104 and the data preparation module 106 of FIG. 1 .
- the data analysis module 108 then starts the baseline prediction based on the prepared data.
- the data analysis engine 100 uses a dynamic moving window for grouping and clustering the data.
- the data preparation module 106 determines the number of clusters 408 based on the changing of gradients of the ordered data groups.
- One embodiment of the formation of clusters 410 is described below in conjunction with FIG. 5 .
- the collected data are combined in a cluster for one baseline prediction.
- FIG. 5 is a flowchart illustrating one embodiment of the methodology of determining 408 number of clusters and forming 410 clusters of the methodologies of FIG. 4 .
- the data preparation module 106 calculates 502 gradients between ordered groups of data.
- the data preparation module 106 determines 504 initial clusters of groups based on the statistical analysis of gradients, and marks the initial group of clusters as “old”.
- the data preparation module 106 calculates 506 centroids of all clusters marked “old”.
- the data preparation module 106 clusters 508 groups based on the distances to the centroids, and marks the clusters as “new”.
- the data preparation module 106 determines 510 whether the clusters marked as “new” are the same as the cluster marked as “old”. If not, the data preparation module 106 marks 514 the “new” clusters as “old”, and calculates 506 centroids of the old clusters as described. Otherwise, if the clusters marked as “new” are the same as the cluster marked as “old”, the forming clusters process ends 512 .
- FIG. 6 is a flowchart illustrating one embodiment of the methodology of the data analysis module 108 of the analysis engine 100 .
- the data analysis module 108 determines a transformation function 602 that maps a data set one-to-one into another data set 604 .
- the transformation function is achieved through a learning process so that the mapping makes the transformed data in a cluster normal or nearly normal.
- One embodiment of the determination of the transformation function 602 is described below in conjunction with FIG. 7 .
- the data analysis module 108 removes 606 outlier data in each cluster.
- An outlier is defined as the edge value which is statistically far away from its closest neighbor and from the mean value. The criteria for “statistically far away” are dependent on the number of sample data and the data distribution.
- the data analysis module 108 removes the outlier(s) when a datum/data fall(s) into the criteria.
- the data analysis module 108 forms a new cluster with the outlier(s) removed, and repeats the process until no more outlier is detected.
- the data analysis module 108 calculates 608 the mean and standard deviation of the transformed data (less the outlier data), and calculates 610 envelopes based on the calculated mean and standard deviation.
- the data analysis module 108 calculates the envelopes by using the mean plus/minus some predefined multipliers times the standard deviation.
- the envelopes are calculated based on 2.0 to 4.0 standard deviations.
- the data analysis module 108 derives 612 the inverse transformation function to map the data back into the original data space as described below in conjunction with FIG. 8 . Using the inverse transformation, the data analysis module 108 inversely transforms 614 the mean and envelopes back into the original data space. The data analysis module 108 repeats the methodology of FIG. 6 until all clusters for the measures with the given entities are calculated. The data analysis module 108 outputs a baseline and the corresponding bands that may be presented as a graph such as shown in FIG. 9 .
- the data analysis module 108 involves the processes of clustering 410 more data, transforming 604 data, calculating 608 / 610 mean and envelopes, and inversely transforming 612 / 614 mean and envelopes. In one embodiment, these manipulation steps increase the predictability of baseline values, because
- the methodology of FIG. 4 is repeated for changing query criteria until all desired data are extracted and processed.
- the methodology of FIG. 5 is for each given measure with certain critical entities in data storage from FIG. 4 .
- FIGS. 7-9 illustrate portions of the methodology of FIG. 6 .
- FIG. 7 is a flowchart illustrating one embodiment of the methodology of determining 602 the inverse transformation function of the methodology of FIG. 6 .
- the data analysis module 108 defines 702 a parameterized transformation function and sets up 704 initial parameter values.
- the data analysis module 108 applies 708 the transformation function to the data to form a new data distribution.
- the data analysis module 108 defines 706 an error function based on the transformation function.
- the data analysis module 108 calculates 710 the error, which is from applying the transformed data to the error function.
- An error function is defined to measure how close the given data is to a normal distribution. If the resultant error from the error function is not less than a predetermined threshold 712 , the data analysis module 108 adjusts 716 the parameters and reformulates a new transformation function based on the results of the error function.
- the data analysis module 108 applies 708 the transformation function to the data and proceeds as described above until a transform function forms a substantially normal distributed data set. If the resultant error is less than the predetermined threshold 712 , the data analysis module 108 has completed 714 the transformation of the data and procedures as described above in FIG. 7 .
- FIG. 8 is a flowchart illustrating one embodiment of the derive 612 the inverse transformation function and inversely transform 614 the mean and envelopes in FIG. 6 .
- FIG. 9 is a diagram illustrating baseline data and the corresponding bands calculated by the data analysis module 108 .
- the data analysis module 108 derives 802 the inverse transformation function for transforming 804 / 806 / 808 the data back into the original data space.
- the data analysis module 108 applies 804 the inverse transformation function to the mean calculated 608 in FIG. 6 to calculate an inverse-transformed mean as a baseline value for the cluster data set. This calculation of the mean is repeated for each cluster data set and then graphed to form a line 900 .
- the data analysis module 108 applies 806 the inverse transformation function to the inner envelope calculated 610 in FIG. 6 to calculate inverse-transformed inner envelopes for the data set.
- the inner envelopes are shown as lines 901 - 1 and 901 - 2 and define the area between lines 901 - 1 and 901 - 2 as an inner band.
- any actual data located inside the band may be considered normal.
- the data analysis module 108 applies the inverse transformation function 808 to the outer envelopes calculated 610 in FIG. 6 to calculate inverse-transformed outer envelopes for the data set.
- the outer envelopes shown as lines 902 - 1 and 902 - 2 define the two areas between inner and outer boundary as outer bands.
- any data located inside the bands may be a warning or an alert, and outside the inner and outer bands may be a violation or an alarm.
- the terms “comprises,” “comprising,” “includes,” “including,” “has,” “having” or any other variation thereof, are intended to cover a non-exclusive inclusion.
- a process, method, article, or apparatus that comprises a list of elements is not necessarily limited to only those elements but may include other elements not expressly listed or inherent to such process, method, article, or apparatus.
- “or” refers to an inclusive or and not to an exclusive or. For example, a condition A or B is satisfied by any one of the following: A is true (or present) and B is false (or not present), A is false (or not present) and B is true (or present), and both A and B are true (or present).
- Embodiments of the invention may also include a computer program product for use in conjunction with a computer system, the computer program product comprising a computer readable storage medium and a computer program mechanism embedded therein.
Landscapes
- Engineering & Computer Science (AREA)
- Computer Networks & Wireless Communication (AREA)
- Signal Processing (AREA)
- Physics & Mathematics (AREA)
- Algebra (AREA)
- General Physics & Mathematics (AREA)
- Mathematical Analysis (AREA)
- Mathematical Optimization (AREA)
- Mathematical Physics (AREA)
- Probability & Statistics with Applications (AREA)
- Pure & Applied Mathematics (AREA)
- Data Mining & Analysis (AREA)
- Information Retrieval, Db Structures And Fs Structures Therefor (AREA)
Abstract
Description
-
- 1. A dynamic data window is determined based on all distributions of hourly-grouped data sets, so that groups are further clustered to include a larger number of samples. (A sufficient number of samples provides better statistical analysis.)
- 2. A data transformation function is determined based on the input historical data, so that the transformed data become normal or nearly normal and the sample mean from computation is used to estimate the population mean for predicting the baseline. (For the case of a normal distribution, no unbiased estimator of the population mean has a smaller variance than its sample mean.)
-
- 1. the expectation value (, which is also called the population mean), which is a good definition of the baseline, is unobtainable accurately from a limited number of data set.
- 2. the sample mean can be treated as a population mean with the smallest error, if the data distribution is normal.
- 3. By knowing the number of data points and the distribution, the outlier criteria can be quantitatively described.
- 4. By using the obtainable sample mean as the estimator of the expectation value of the transformed data set, the baseline is defined as the inverse transformation of the sample mean.
Claims (24)
Priority Applications (1)
| Application Number | Priority Date | Filing Date | Title |
|---|---|---|---|
| US11/518,015 US7962607B1 (en) | 2006-09-08 | 2006-09-08 | Generating an operational definition of baseline for monitoring network traffic data |
Applications Claiming Priority (1)
| Application Number | Priority Date | Filing Date | Title |
|---|---|---|---|
| US11/518,015 US7962607B1 (en) | 2006-09-08 | 2006-09-08 | Generating an operational definition of baseline for monitoring network traffic data |
Publications (1)
| Publication Number | Publication Date |
|---|---|
| US7962607B1 true US7962607B1 (en) | 2011-06-14 |
Family
ID=44122001
Family Applications (1)
| Application Number | Title | Priority Date | Filing Date |
|---|---|---|---|
| US11/518,015 Active 2028-04-19 US7962607B1 (en) | 2006-09-08 | 2006-09-08 | Generating an operational definition of baseline for monitoring network traffic data |
Country Status (1)
| Country | Link |
|---|---|
| US (1) | US7962607B1 (en) |
Cited By (6)
| Publication number | Priority date | Publication date | Assignee | Title |
|---|---|---|---|---|
| US20100153330A1 (en) * | 2008-12-12 | 2010-06-17 | Vitage Technologies Pvt. Ltd. | Proactive Information Technology Infrastructure Management |
| CN103177180A (en) * | 2011-12-20 | 2013-06-26 | 郑芳田 | Method for screening modeling samples of prediction model |
| US20140359626A1 (en) * | 2013-05-30 | 2014-12-04 | Qualcomm Incorporated | Parallel method for agglomerative clustering of non-stationary data |
| US20160156680A1 (en) * | 2010-12-03 | 2016-06-02 | Intouch Technologies, Inc. | Systems and methods for dynamic bandwidth allocation |
| US11245600B2 (en) * | 2019-07-18 | 2022-02-08 | Citrix Systems, Inc. | System and method for processing network data |
| CN114500310A (en) * | 2021-12-23 | 2022-05-13 | 中国人民解放军63921部队 | An accurate method for determining the baseline of multi-dimensional network situation data |
Citations (7)
| Publication number | Priority date | Publication date | Assignee | Title |
|---|---|---|---|---|
| US5757751A (en) * | 1996-01-16 | 1998-05-26 | International Business Machines Corporation | Baseline correction circuit for pulse width modulated data readback systems |
| US5907639A (en) * | 1996-09-19 | 1999-05-25 | Daewoo Electronics Co., Ltd. | Baseline-based shape coding method and apparatus for encoding a contour image |
| US6836800B1 (en) * | 1998-09-30 | 2004-12-28 | Netscout Systems, Inc. | Managing computer resources |
| US20060020924A1 (en) * | 2004-06-15 | 2006-01-26 | K5 Systems Inc. | System and method for monitoring performance of groupings of network infrastructure and applications using statistical analysis |
| US20060059392A1 (en) * | 2004-09-10 | 2006-03-16 | Kizer Jade M | Method and apparatus for estimating random jitter (RJ) and deterministic jitter (DJ) from bit error rate (BER) |
| US20070091997A1 (en) * | 2003-05-28 | 2007-04-26 | Chad Fogg | Method And Apparatus For Scalable Video Decoder Using An Enhancement Stream |
| US7406436B1 (en) * | 2001-03-22 | 2008-07-29 | Richard Reisman | Method and apparatus for collecting, aggregating and providing post-sale market data for an item |
-
2006
- 2006-09-08 US US11/518,015 patent/US7962607B1/en active Active
Patent Citations (7)
| Publication number | Priority date | Publication date | Assignee | Title |
|---|---|---|---|---|
| US5757751A (en) * | 1996-01-16 | 1998-05-26 | International Business Machines Corporation | Baseline correction circuit for pulse width modulated data readback systems |
| US5907639A (en) * | 1996-09-19 | 1999-05-25 | Daewoo Electronics Co., Ltd. | Baseline-based shape coding method and apparatus for encoding a contour image |
| US6836800B1 (en) * | 1998-09-30 | 2004-12-28 | Netscout Systems, Inc. | Managing computer resources |
| US7406436B1 (en) * | 2001-03-22 | 2008-07-29 | Richard Reisman | Method and apparatus for collecting, aggregating and providing post-sale market data for an item |
| US20070091997A1 (en) * | 2003-05-28 | 2007-04-26 | Chad Fogg | Method And Apparatus For Scalable Video Decoder Using An Enhancement Stream |
| US20060020924A1 (en) * | 2004-06-15 | 2006-01-26 | K5 Systems Inc. | System and method for monitoring performance of groupings of network infrastructure and applications using statistical analysis |
| US20060059392A1 (en) * | 2004-09-10 | 2006-03-16 | Kizer Jade M | Method and apparatus for estimating random jitter (RJ) and deterministic jitter (DJ) from bit error rate (BER) |
Non-Patent Citations (3)
| Title |
|---|
| Barnett, V. et al., Outliers Statistical Data, Third Edition, Oct. 1994, pp. 464-526, John Wiley & Sons. |
| Feather, F. et al., "Fault Detection in an Ethernet Network Using Anomaly Signature Matching," SIGCOMM '93, Sep. 1993, pp. 279-288. |
| Lupton, R., Statistics in Theory and Practice, 1993, pp. 30-80, Princeton University Press, Princeton, N.J. |
Cited By (13)
| Publication number | Priority date | Publication date | Assignee | Title |
|---|---|---|---|---|
| US11748227B2 (en) | 2008-12-12 | 2023-09-05 | Appnomic Systems Private Limited | Proactive information technology infrastructure management |
| US8903757B2 (en) * | 2008-12-12 | 2014-12-02 | Appnomic Systems Private Limited | Proactive information technology infrastructure management |
| US10437696B2 (en) * | 2008-12-12 | 2019-10-08 | Appnomic Systems Private Limited | Proactive information technology infrastructure management |
| US20150142414A1 (en) * | 2008-12-12 | 2015-05-21 | Appnomic Systems Private Limited | Proactive information technology infrastructure management |
| US20100153330A1 (en) * | 2008-12-12 | 2010-06-17 | Vitage Technologies Pvt. Ltd. | Proactive Information Technology Infrastructure Management |
| US10218748B2 (en) * | 2010-12-03 | 2019-02-26 | Intouch Technologies, Inc. | Systems and methods for dynamic bandwidth allocation |
| US20160156680A1 (en) * | 2010-12-03 | 2016-06-02 | Intouch Technologies, Inc. | Systems and methods for dynamic bandwidth allocation |
| CN103177180B (en) * | 2011-12-20 | 2016-06-22 | 郑芳田 | Method for screening modeling samples of prediction model |
| CN103177180A (en) * | 2011-12-20 | 2013-06-26 | 郑芳田 | Method for screening modeling samples of prediction model |
| US9411632B2 (en) * | 2013-05-30 | 2016-08-09 | Qualcomm Incorporated | Parallel method for agglomerative clustering of non-stationary data |
| US20140359626A1 (en) * | 2013-05-30 | 2014-12-04 | Qualcomm Incorporated | Parallel method for agglomerative clustering of non-stationary data |
| US11245600B2 (en) * | 2019-07-18 | 2022-02-08 | Citrix Systems, Inc. | System and method for processing network data |
| CN114500310A (en) * | 2021-12-23 | 2022-05-13 | 中国人民解放军63921部队 | An accurate method for determining the baseline of multi-dimensional network situation data |
Similar Documents
| Publication | Publication Date | Title |
|---|---|---|
| JP5459608B2 (en) | Communication network failure cause analysis system, failure cause analysis method, and failure cause analysis program | |
| EP3425509B1 (en) | Method and system for real-time and scalable anomaly detection and classification of multi-dimensional multivariate high-frequency transaction data in a distributed environment | |
| US7693876B2 (en) | Monitoring usage rate patterns in storage resources | |
| WO2022111327A1 (en) | Risk level data processing method and apparatus, and storage medium and electronic device | |
| CN107480028B (en) | Method and device for acquiring usable residual time of disk | |
| CN111459761B (en) | Redis configuration method, device, storage medium and equipment | |
| US20030139905A1 (en) | Method and system for analyzing and predicting the behavior of systems | |
| CN105071983A (en) | Abnormal load detection method for cloud calculation on-line business | |
| EP2466495A1 (en) | Systems and/or methods for event stream deviation detection | |
| Qahtan et al. | KDE-Track: An efficient dynamic density estimator for data streams | |
| CN109120463B (en) | Flow prediction method and device | |
| Nikolaou et al. | Detection of early warning signals in paleoclimate data using a genetic time series segmentation algorithm | |
| US10216776B2 (en) | Variance based time series dataset alignment | |
| US20220245010A1 (en) | Time-series anomaly detection using an inverted index | |
| CN109257383B (en) | BGP anomaly detection method and system | |
| CN105763387B (en) | network traffic monitoring method and device | |
| CN110717551A (en) | Training method and device of flow identification model and electronic equipment | |
| US7962607B1 (en) | Generating an operational definition of baseline for monitoring network traffic data | |
| US7636051B2 (en) | Status monitor apparatus | |
| CN109995611B (en) | Traffic classification model establishing and traffic classification method, device, equipment and server | |
| US12067430B2 (en) | Adaptive idle detection in a software-defined data center in a hyper-converged infrastructure | |
| KR102059112B1 (en) | IoT STREAM DATA QUALITY MEASUREMENT INDICATORS AND PROFILING METHOD FOR INTERNET OF THINGS AND SYSTEM THEREFORE | |
| CN119091154A (en) | A method for optimizing the aperture of VCSEL chips by wet oxidation using dynamic adjustment | |
| CN117746599A (en) | Real-time early warning method, system and storage medium for park management | |
| CN111258863B (en) | Data anomaly detection method, device, server and computer-readable storage medium |
Legal Events
| Date | Code | Title | Description |
|---|---|---|---|
| AS | Assignment |
Owner name: NETWORK GENERAL TECHNOLOGY,, CAYMAN ISLANDS Free format text: ASSIGNMENT OF ASSIGNORS INTEREST;ASSIGNORS:CHANG, HUNG-JEN;MATURI, MOHAN KUMAR;SIGNING DATES FROM 20060906 TO 20060907;REEL/FRAME:018298/0126 |
|
| STCF | Information on status: patent grant |
Free format text: PATENTED CASE |
|
| FPAY | Fee payment |
Year of fee payment: 4 |
|
| MAFP | Maintenance fee payment |
Free format text: PAYMENT OF MAINTENANCE FEE, 8TH YEAR, LARGE ENTITY (ORIGINAL EVENT CODE: M1552); ENTITY STATUS OF PATENT OWNER: LARGE ENTITY Year of fee payment: 8 |
|
| AS | Assignment |
Owner name: NETSCOUT SYSTEMS, INC., MASSACHUSETTS Free format text: ASSIGNMENT OF ASSIGNORS INTEREST;ASSIGNOR:NETWORK GENERAL TECHNOLOGY;REEL/FRAME:049489/0108 Effective date: 20190617 |
|
| AS | Assignment |
Owner name: JPMORGAN CHASE BANK, N.A., AS ADMINISTRATIVE AGENT, ILLINOIS Free format text: SECURITY INTEREST;ASSIGNORS:NETSCOUT SYSTEMS, INC.;ARBOR NETWORKS, INC.;AIRMAGNET, INC.;AND OTHERS;REEL/FRAME:056997/0847 Effective date: 20210727 |
|
| MAFP | Maintenance fee payment |
Free format text: PAYMENT OF MAINTENANCE FEE, 12TH YEAR, LARGE ENTITY (ORIGINAL EVENT CODE: M1553); ENTITY STATUS OF PATENT OWNER: LARGE ENTITY Year of fee payment: 12 |