US7933850B1 - Method and apparatus for functional relationship approximation through nonparametric regression using R-functions - Google Patents
Method and apparatus for functional relationship approximation through nonparametric regression using R-functions Download PDFInfo
- Publication number
- US7933850B1 US7933850B1 US11/598,608 US59860806A US7933850B1 US 7933850 B1 US7933850 B1 US 7933850B1 US 59860806 A US59860806 A US 59860806A US 7933850 B1 US7933850 B1 US 7933850B1
- Authority
- US
- United States
- Prior art keywords
- regression
- functional relationship
- training data
- primitives
- dimensional space
- Prior art date
- Legal status (The legal status is an assumption and is not a legal conclusion. Google has not performed a legal analysis and makes no representation as to the accuracy of the status listed.)
- Active, expires
Links
Images


Classifications
-
- G—PHYSICS
- G06—COMPUTING OR CALCULATING; COUNTING
- G06F—ELECTRIC DIGITAL DATA PROCESSING
- G06F11/00—Error detection; Error correction; Monitoring
- G06F11/07—Responding to the occurrence of a fault, e.g. fault tolerance
- G06F11/0703—Error or fault processing not based on redundancy, i.e. by taking additional measures to deal with the error or fault not making use of redundancy in operation, in hardware, or in data representation
- G06F11/0751—Error or fault detection not based on redundancy
-
- G—PHYSICS
- G06—COMPUTING OR CALCULATING; COUNTING
- G06F—ELECTRIC DIGITAL DATA PROCESSING
- G06F11/00—Error detection; Error correction; Monitoring
- G06F11/07—Responding to the occurrence of a fault, e.g. fault tolerance
- G06F11/0703—Error or fault processing not based on redundancy, i.e. by taking additional measures to deal with the error or fault not making use of redundancy in operation, in hardware, or in data representation
- G06F11/0706—Error or fault processing not based on redundancy, i.e. by taking additional measures to deal with the error or fault not making use of redundancy in operation, in hardware, or in data representation the processing taking place on a specific hardware platform or in a specific software environment
- G06F11/0748—Error or fault processing not based on redundancy, i.e. by taking additional measures to deal with the error or fault not making use of redundancy in operation, in hardware, or in data representation the processing taking place on a specific hardware platform or in a specific software environment in a remote unit communicating with a single-box computer node experiencing an error/fault
-
- G—PHYSICS
- G06—COMPUTING OR CALCULATING; COUNTING
- G06F—ELECTRIC DIGITAL DATA PROCESSING
- G06F17/00—Digital computing or data processing equipment or methods, specially adapted for specific functions
- G06F17/10—Complex mathematical operations
- G06F17/18—Complex mathematical operations for evaluating statistical data, e.g. average values, frequency distributions, probability functions, regression analysis
-
- G—PHYSICS
- G06—COMPUTING OR CALCULATING; COUNTING
- G06N—COMPUTING ARRANGEMENTS BASED ON SPECIFIC COMPUTATIONAL MODELS
- G06N20/00—Machine learning
Definitions
- the present invention relates to techniques for detecting faults in systems. More specifically, the present invention relates to a method and apparatus that approximates a functional relationship from a training data through nonparametric regression, and uses the approximated functional relationship to inferentially estimate a system variable.
- Modern server systems are typically equipped with a significant number of sensors which monitor signals during the operation of the server systems.
- these monitored signals can include temperatures, voltages, currents, and a variety of software performance metrics, including CPU usage, I/O traffic, and memory utilization.
- Outputs from this monitoring process can be used to generate time series data for these signals which can subsequently be analyzed to determine how well a computer system is operating.
- One particularly useful application of this analysis technique is to facilitate proactive fault detection and monitoring to identify leading indicators of component or system failures before the failures actually occur. Typically, this is achieved by detecting anomalies in the signals which may potentially lead to system failures.
- One proactive fault detection and monitoring technique employs functional relationship approximation techniques to predict normal system data values based on other collected information (i.e. “inferential estimation”).
- Conventional functional relationship approximation techniques can be divided into two categories: parametric techniques and nonparametric techniques.
- the parametric techniques make distributional assumptions about underlying data generating mechanisms and detect failures in data sets based on parametric models. However, the results of these parametric techniques suffer from the errors in the distributional assumptions which are used to predict the data generating mechanisms.
- the nonparametric techniques do not make distributional assumptions on the data to be modeled.
- a nonparametric technique has no (or very little) a priori knowledge about the form of the functional relationship which is being estimated.
- the functional relationship is still modeled using an equation containing free parameters, the nonparametric methods allow the class of functions which the model can represent to be very broad.
- the nonparametric techniques typically use a large number of free parameters, whereas the parametric techniques typically use only a small number of parameters.
- nonparametric methods include artificial neural networks, kernel regression, support vector machines, and autoassociative memory-based techniques.
- One embodiment of the present invention provides a system that constructs a functional relationship approximation from a set of data points through nonparametric regression.
- the system receives a training data set in an n-dimensional space.
- the system defines a set of regression primitives in the n-dimensional space, wherein a regression primitive in the set passes through N data points in the training data set, wherein N ⁇ n.
- the system next obtains the functional relationship approximation by computing an argument of the minimum of F in the n-dimensional space.
- the system subsequently uses the functional relationship approximation to classify data.
- the system classifies the data by determining whether a telemetry signal from a computer system is deviating from a normal telemetry signal from the computer system.
- the system defines the set of regression primitives in the n-dimensional space by iteratively: selecting a set of N data points from the training data set; and generating a regression primitive which passes through the selected N data points.
- the system ensures that between any two sets of selected N data points, there is at least one different data point in each of the sets.
- a regression primitive can be a linear function or a nonlinear function.
- the system logically combines the set of regression primitives by using R-function operations, wherein an R-function is a function whose sign can change if and only if the sign of one of its arguments changes, and the R-function operations mimic logical operations.
- the system logically combines the set of regression primitives to produce the convex envelope F by: for each subset of (N ⁇ 1) data points in the training data set, grouping a subset of regression primitives in the set which pass through the (N ⁇ 1) data points; and performing an R-conjunction operation on the subset of regression primitives to produce a combined functional relationship associated with the (N ⁇ 1) data points.
- the system then performs an R-disjunction operation on a set of combined functional relationship associated with different subsets of (N ⁇ 1) data points in the training data set to produce the convex envelope F.
- each data point in the training data set comprises one dependent variable y and (n ⁇ 1) independent variables, wherein the value of y is functionally related to the values of x.
- FIG. 1 illustrates real-time telemetry system in accordance with an embodiment of the present invention.
- FIG. 2 presents a flowchart illustrating the process of constructing a functional relationship approximation from the training data set in accordance with an embodiment of the present invention.
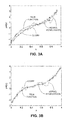
- FIG. 3A illustrates one-dimensional function fitting results from noisy data by using the LCORP technique and a kernel regression technique in accordance with an embodiment of the present invention.
- FIG. 3B illustrates one-dimensional function fitting results from noisy data by using the LCORP technique with the variation of using five nearest neighbors for each query point in accordance with an embodiment of the present invention.
- FIG. 4A illustrates a noise-free true two-dimensional function in accordance with an embodiment of the present invention.
- FIG. 4B illustrates the noisy data which are used to fit the true two-dimensional regression function using the LCORP technique in accordance with an embodiment of the present invention.
- FIG. 4C illustrates the estimated two-dimensional regression function using the LCORP technique in accordance with an embodiment of the present invention.
- FIG. 5 illustrates the predicted power using the LCORP inferential model in comparison to the true power measured by power meter in accordance with an embodiment of the present invention.
- a computer-readable storage medium which may be any device or medium that can store code and/or data for use by a computer system.
- FIG. 1 illustrates real-time telemetry system 100 in accordance with an embodiment of the present invention.
- Real-time telemetry system 100 contains server 102 .
- Server 102 can generally include any computational node including a mechanism for servicing requests from a client for computational and/or data storage resources.
- server 102 is a uniprocessor or multiprocessor server system that is being monitored by real-time telemetry system 100 .
- the present invention is not limited to the computer server system illustrated in FIG. 1 .
- the present invention can be applied to any type of computer system. This includes, but is not limited to, a computer system based on a microprocessor, a mainframe computer, a digital signal processor, a portable computing device, a personal organizer, a device controller, and a computational engine within an appliance.
- Real-time telemetry system 100 also contains telemetry device 104 , which gathers telemetry signals 106 from the various sensors and monitoring tools within server 102 , and directs telemetry signals 106 to a local or a remote location that contains fault-detecting tool 108 .
- telemetry device 104 and fault-detecting tool 108 are both embedded in server 102 which is being monitored.
- telemetry signals 106 gathered by real-time telemetry system 104 can include signals associated with physical and/or software performance parameters measured through sensors within the computer system.
- the physical parameters can include, but are not limited to: distributed temperatures within the computer system, relative humidity, cumulative or differential vibrations within the computer system, fan speed, acoustic signals, currents, voltages, time-domain reflectometry (TDR) readings, and miscellaneous environmental variables.
- the software parameters can include, but are not limited to: load metrics, CPU utilization, idle time, memory utilization, disk activity, transaction latencies, and other performance metrics reported by the operating system.
- Fault-detecting tool 108 monitors and analyzes telemetry signals 106 in real-time. Specifically, fault-detecting tool 108 detects anomalies in telemetry signals 106 and by analyzing telemetry signals 106 , predicts probabilities of specific faults and failures in server 102 .
- fault-detecting tool 108 includes a nonparametric regression model 110 .
- nonparametric regression model 110 receives training data 112 from historical data source 114 , which contains well-behaved data (in particular, signal values as a function of other system variables) previously collected from telemetry device 104 .
- Nonparametric regression model 110 uses training data 112 to construct a functional relationship approximation for telemetry signals 106 .
- Fault-detecting tool 108 uses the functional relationship approximation to estimate the signal values of the monitored telemetry signals as a function of other system metrics (e.g., temperatures, currents, loads, I/O activities), and compares the predicted signal values with the currently received signal values. Fault-detecting tool 108 subsequently detects anomalies in telemetry signals 106 if the currently received signal values deviate from the predicted normal signals values based on the functional relationship approximation.
- system metrics e.g., temperatures, currents, loads, I/O activities
- g lin ⁇ ( p ; ⁇ [ 2 ] ) ⁇ [ y x 1 y 1 x 1 1 y 2 x 2 1 ] ⁇ . ( 1 )
- regression primitives can also include nonlinear functions.
- the problem we would like to solve is to provide an estimate of y in R as a function of the query point x based on the training data set D.
- each of the regression primitive is defined as: g([y,x]; [p i — 1 , p i — 2 , . . . p i — (d+1) ]), i — 1 ⁇ i — 2 ⁇ . . . ⁇ i _( d+ 1).
- the set of regression primitives are logically combined into a single function by using R_disjunction and R_conjunction operations (For the definition of the R-conjunction and R-disjunction operations see reference V. Shapiro, “Theory of R-functions and Applications: A Primer,” Technical Report, Cornell University, 1991). We describe this process in more detail below.
- FIG. 2 presents a flowchart illustrating the process of constructing a functional relationship approximation from the training data set D in accordance with an embodiment of the present invention.
- the system iteratively selects one data point from the rest of the data set D excluding ⁇ p i1 , p i2 , . . . , p id ⁇ (step 204 ). Note that each such selection is unique in that there should be at least one different data point between any two such selections.
- Each unique combination of p i1 , p i2 , . . . , p i(d+1) is then used to define a regression primitive as previously described (step 206 ). Consequently, the system obtains a set of regression primitives associated with the subset ⁇ p i1 , p i2 , . . . , p id ⁇ .
- the system next performs an R_conjunction operation on these regression primitives to obtain a single logically combined functional relationship with respect to the subset ⁇ p i1 , p i2 , . . . , p id ⁇ (step 208 ).
- the system repeats the above steps 204 - 208 for other subset of d data points in the data set D and subsequently obtains a set of combined function relationships with respect to each given subset of d data points in D. Finally, the system performs an R_disjunction operation on this set of combined functional relationships which obtains a single logical combination function F([y, x]) of all regression primitives which are defined based on the training data set D (step 210 ).
- the system then computes the arguments of the minimum of F(y, x), arg min ⁇ F(y, x) ⁇ , i.e., the values of the arguments (y, x) for which the values of F(y, x) attains minimum values (step 212 ).
- y ⁇ arg ⁇ ⁇ min ⁇ ⁇ ( ⁇ g ⁇ ( [ y , x ] ; ⁇ [ ⁇ p i ⁇ ⁇ _ ⁇ 1 , p i ⁇ ⁇ _ ⁇ 2 , ... ⁇ , p i ⁇ ⁇ _ ⁇ ( d + 1 ) ] ) ) ⁇ , y for ⁇ ⁇ different ⁇ ⁇ ⁇ p i ⁇ ⁇ 1 , p i ⁇ ⁇ 2 , ... ⁇ , p id ⁇ for ⁇ ⁇ each ⁇ ⁇ ⁇ p i ⁇ ⁇ 1 , p i ⁇ ⁇ 2 ⁇ , ... ⁇ , p id ⁇ ⁇ ⁇ and p i ⁇ ( d + 1 ) ⁇ p i ⁇ ⁇ 1 , p i ⁇ ⁇ 2 ⁇ , ... ⁇ , ⁇
- y ⁇ arg ⁇ ⁇ min ⁇ ⁇ ⁇ ⁇ ( g ⁇ ( [ y , x ] ; ⁇ [ p 1 , p 2 ] ) ⁇ g ⁇ ( [ y , x ] ; ⁇ [ p 1 , p 3 ] ) ⁇ g ⁇ ( [ y , x ] ; ⁇ [ p 1 , p 4 ] ) ) ⁇ y ⁇ ( g ⁇ ( [ y , x ] ; ⁇ [ p 2 , p 1 ] ) ⁇ g ⁇ ( [ y , x ] ; ⁇ [ p 2 , p 3 ] ) ⁇ g ⁇ ( [ y , x ] ; ⁇ [ p 1 , p 4 ] ) ) ⁇ ⁇ ( g ⁇ ( [ y , x ] ; ⁇ [ p 1 ,
- a given training data set D is preprocessed for a given query point x using the k nearest neighbor (kNN) technique. Specifically, we first select k nearest neighbors of x from D. Next, we estimate ⁇ using Eqn. (4) with only the selected k data points as the actual training data set.
- kNN k nearest neighbor
- an estimation for ⁇ is computed as a weighted sum according to the following equation:
- w i ⁇ ⁇ ⁇ g ⁇ ( [ y i , x ] ; ⁇ [ p i ⁇ _ ⁇ 1 , ... ⁇ , p i ⁇ _ ⁇ ( d + 1 ) ] ) ⁇ / ⁇ i ⁇ ( ⁇ ⁇ g ⁇ ( [ y i , x ] ; ⁇ [ p i ⁇ _ ⁇ 1 , ... ⁇ , p i ⁇ _ ⁇ ( d + 1 ) ⁇ ) ) ) , ( 6 ) and y lo , and y hi , are chosen based on observed or expected spread (e.g., max and min) of variable y. Number of term I is chosen empirically.
- the original training data set D is preprocessed for a given query point x using a clustering technique. Specifically, a cluster of points from D that point x belongs to is used to replace the original training data set in the equation to compute an estimate ⁇ .
- the regression primitive is fitted into a k-tuple using the ordinary least squares method or a penalized least squares method. This is useful when k>(d+1).
- the present invention describes a nonparametric regression technique of using “logical combination of regression primitives” (LCORP).
- LCORP logical combination of regression primitives
- the present invention was applied to a number of regression problems.
- the LCORP technique was used to fit noisy data associated with a nonlinear function of one variable.
- the results of fitting by the LCORP technique are compared with the true function and also to the results of a traditional kernel regression fitting.
- FIG. 3A illustrates one-dimensional function fitting results from noisy data by using the LCORP technique and a kernel regression technique in accordance with an embodiment of the present invention.
- the circles on the plot represent the noisy data used to fit the regression functions, and the curve passing through all the triangles is a functional relationship fitted using the LCORP technique. Note that the function fitting curve estimated using the LCORP technique is significantly more stable than that function fitting curve estimated by the traditional kernel regression.
- FIG. 3B illustrates one-dimensional function fitting results from noisy data by using the LCORP technique with the variation of using five nearest neighbors for each query point in accordance with an embodiment of the present invention.
- the circles on the plots represent the noisy data used to fit the regression functions, and the curve passing through all the triangles is fitted using the LCORP technique. Note the function fitting curve estimated using the LCORP substantially overlaps with the true function curve.
- FIGS. 4A-4C demonstrate using the LCORP to reconstruct a two-dimensional (2D) function from noisy data whose noise characteristics are similar to the noise characteristics of actual telemetry time series signals measured from computer servers.
- FIG. 4A illustrates a noise-free true 2D function in accordance with an embodiment of the present invention.
- FIG. 4B shows the noisy data which are used to fit the true 2D regression function using the LCORP technique in accordance with an embodiment of the present invention.
- FIG. 4C illustrates the estimated 2D regression function using the LCORP technique in accordance with an embodiment of the present invention.
- the last example demonstrates the application of the LCORP technique to inferential power estimation for a computer server.
- server systems include power supplies which have embedded current sensors. These embedded current sensors can be used to produce real-time estimates of the dynamic power of the associated servers by aggregating all of the current signals.
- many other server systems use power supplies which do not have embedded current sensors.
- the typical approach to measure the actual power for the servers is to use an expensive external hardware power meter.
- One embodiment of the present invention facilitates using inferential telemetry signals measured from a server to predict the actual power of the server. Specifically, to build an LCORP inferential model to predict power as a dynamic function of the measured telemetry signals, a data set comprising measured telemetry metrics and the actual server power (in Watts) measured with an external power meter (for the purpose of cross-calibration of the LCORP technique) were obtained.
- FIG. 5 illustrates the predicted power using the LCORP inferential model in comparison to the true power measured by power meter in accordance with an embodiment of the present invention.
- results illustrated in FIG. 5 used only a subset of telemetry signals available from the server, in practice more complicated models can be built by simply adding more types of telemetry metrics (e.g., to also include distributed temperatures, fan speeds, and memory/CPU configuration data).
Landscapes
- Engineering & Computer Science (AREA)
- Theoretical Computer Science (AREA)
- Physics & Mathematics (AREA)
- General Physics & Mathematics (AREA)
- General Engineering & Computer Science (AREA)
- Data Mining & Analysis (AREA)
- Quality & Reliability (AREA)
- Mathematical Physics (AREA)
- Software Systems (AREA)
- Mathematical Optimization (AREA)
- Computational Mathematics (AREA)
- Pure & Applied Mathematics (AREA)
- Mathematical Analysis (AREA)
- Artificial Intelligence (AREA)
- Computer Vision & Pattern Recognition (AREA)
- Life Sciences & Earth Sciences (AREA)
- Bioinformatics & Cheminformatics (AREA)
- Bioinformatics & Computational Biology (AREA)
- Computing Systems (AREA)
- Evolutionary Biology (AREA)
- Evolutionary Computation (AREA)
- Computer Hardware Design (AREA)
- Operations Research (AREA)
- Probability & Statistics with Applications (AREA)
- Medical Informatics (AREA)
- Algebra (AREA)
- Databases & Information Systems (AREA)
- Management, Administration, Business Operations System, And Electronic Commerce (AREA)
Abstract
Description
Similarly in vector space R3 (i.e., in three-dimensional space), a linear regression primitive glin(p; [3])=0 is defined by a plane passing through three points p1, p2, p3 in R3. Generally, for points p in Rd+1 wherein d+1 >3, glin(p; [d+1])=0 defines a hyperplane passing through (d+1) points pi, wherein i=1, 2, . . . ,
g([y,x]; [pi
Next, the set of regression primitives are logically combined into a single function by using R_disjunction and R_conjunction operations (For the definition of the R-conjunction and R-disjunction operations see reference V. Shapiro, “Theory of R-functions and Applications: A Primer,” Technical Report, Cornell University, 1991). We describe this process in more detail below.
F(p)=0; if p is on the convex envelope;
F(p)<0; if p is inside the convex envelope; and
F(p)>0; if p is outside the convex envelope; (3)
wherein the symbol “
Variations from the Above Procedure
wherein the weights wi are given by:
and ylo, and yhi, are chosen based on observed or expected spread (e.g., max and min) of variable y. Number of term I is chosen empirically.
Claims (20)
Priority Applications (1)
| Application Number | Priority Date | Filing Date | Title |
|---|---|---|---|
| US11/598,608 US7933850B1 (en) | 2006-11-13 | 2006-11-13 | Method and apparatus for functional relationship approximation through nonparametric regression using R-functions |
Applications Claiming Priority (1)
| Application Number | Priority Date | Filing Date | Title |
|---|---|---|---|
| US11/598,608 US7933850B1 (en) | 2006-11-13 | 2006-11-13 | Method and apparatus for functional relationship approximation through nonparametric regression using R-functions |
Publications (1)
| Publication Number | Publication Date |
|---|---|
| US7933850B1 true US7933850B1 (en) | 2011-04-26 |
Family
ID=43880521
Family Applications (1)
| Application Number | Title | Priority Date | Filing Date |
|---|---|---|---|
| US11/598,608 Active 2028-03-20 US7933850B1 (en) | 2006-11-13 | 2006-11-13 | Method and apparatus for functional relationship approximation through nonparametric regression using R-functions |
Country Status (1)
| Country | Link |
|---|---|
| US (1) | US7933850B1 (en) |
Cited By (6)
| Publication number | Priority date | Publication date | Assignee | Title |
|---|---|---|---|---|
| US8868473B2 (en) | 2011-10-24 | 2014-10-21 | Oracle International Corporation | Decision making with analytically combined split conditions |
| WO2017120551A1 (en) * | 2016-01-08 | 2017-07-13 | Rehabilitation Institute Of Chicago | Convex relaxion regression systems and related methods |
| US9773211B2 (en) | 2014-05-19 | 2017-09-26 | Sas Institute Inc. | Systems and methods for interactive graphs for building penalized regression models |
| CN113010525A (en) * | 2021-04-01 | 2021-06-22 | 东北大学 | Ocean space-time big data parallel KNN query processing method based on PID |
| CN114624549A (en) * | 2022-03-08 | 2022-06-14 | 广东电网有限责任公司江门供电局 | Power distribution terminal module fault analysis method and system |
| US20240409106A1 (en) * | 2023-06-09 | 2024-12-12 | Mercedes-Benz Group AG | System on chip automotive safety monitoring |
Citations (1)
| Publication number | Priority date | Publication date | Assignee | Title |
|---|---|---|---|---|
| US20030107548A1 (en) * | 2001-12-08 | 2003-06-12 | Jong-Won Eun | System and method for executing diagnosis of vehicle performance |
-
2006
- 2006-11-13 US US11/598,608 patent/US7933850B1/en active Active
Patent Citations (1)
| Publication number | Priority date | Publication date | Assignee | Title |
|---|---|---|---|---|
| US20030107548A1 (en) * | 2001-12-08 | 2003-06-12 | Jong-Won Eun | System and method for executing diagnosis of vehicle performance |
Non-Patent Citations (4)
| Title |
|---|
| Bougaev et al. "R-functions Based Classification for Abnormal Software Process Detection", CIS, 2005, Part 1, LNAI 3801, pp. 991-996. * |
| Kotsiantis et al. "Bagging Model Trees for Classification Problems", LNCS, vol. 3746/2005, Springer Berlin/Heidelberg, pp. 328-337. * |
| Shapiro, Vadim Theory of R-Functions and Applications: A Primer, Nov. 1988 (Revised Jun. 1991), http://sal-cnc.me.wisc.edu/index.php?option=com-remository&Itemid=143&func=startdown&id=47, downloaded May 12, 2009. |
| Smola, et al. "A Tutorial on Support Vector Regression", Statistics and Computing, 2003, pp. 1-24). * |
Cited By (8)
| Publication number | Priority date | Publication date | Assignee | Title |
|---|---|---|---|---|
| US8868473B2 (en) | 2011-10-24 | 2014-10-21 | Oracle International Corporation | Decision making with analytically combined split conditions |
| US9773211B2 (en) | 2014-05-19 | 2017-09-26 | Sas Institute Inc. | Systems and methods for interactive graphs for building penalized regression models |
| WO2017120551A1 (en) * | 2016-01-08 | 2017-07-13 | Rehabilitation Institute Of Chicago | Convex relaxion regression systems and related methods |
| CN113010525A (en) * | 2021-04-01 | 2021-06-22 | 东北大学 | Ocean space-time big data parallel KNN query processing method based on PID |
| CN113010525B (en) * | 2021-04-01 | 2023-08-01 | 东北大学 | A PID-based Parallel KNN Query Processing Method for Ocean Spatiotemporal Big Data |
| CN114624549A (en) * | 2022-03-08 | 2022-06-14 | 广东电网有限责任公司江门供电局 | Power distribution terminal module fault analysis method and system |
| US20240409106A1 (en) * | 2023-06-09 | 2024-12-12 | Mercedes-Benz Group AG | System on chip automotive safety monitoring |
| US12515681B2 (en) * | 2023-06-09 | 2026-01-06 | Mercedes-Benz Group AG | System on chip automotive safety monitoring |
Similar Documents
| Publication | Publication Date | Title |
|---|---|---|
| US7702485B2 (en) | Method and apparatus for predicting remaining useful life for a computer system | |
| US11556567B2 (en) | Generating and visualizing bias scores representing bias in digital segments within segment-generation-user interfaces | |
| US9600394B2 (en) | Stateful detection of anomalous events in virtual machines | |
| CN103513983B (en) | method and system for predictive alert threshold determination tool | |
| US7310590B1 (en) | Time series anomaly detection using multiple statistical models | |
| US9875142B2 (en) | System and method for efficient task scheduling in heterogeneous, distributed compute infrastructures via pervasive diagnosis | |
| US8180664B2 (en) | Methods and systems for forecasting with model-based PDF estimates | |
| Junior et al. | A context-sensitive offloading system using machine-learning classification algorithms for mobile cloud environment | |
| CN115348159A (en) | Micro-service fault positioning method and device based on self-encoder and service dependency graph | |
| US20020138492A1 (en) | Data mining application with improved data mining algorithm selection | |
| EP2290545A2 (en) | Monitoring with adaptive dynamic classification | |
| US20160371181A1 (en) | Stateless detection of out-of-memory events in virtual machines | |
| US20250383973A1 (en) | Techniques for alerting metric baseline behavior change | |
| US10318908B2 (en) | Prioritizing client accounts | |
| US11250351B2 (en) | System and method for one-class similarity machines for anomaly detection | |
| Zhao et al. | The effect of temporal aggregation level in social network monitoring | |
| CN111125529A (en) | Product matching method and device, computer equipment and storage medium | |
| US20210374613A1 (en) | Anomaly detection in high dimensional spaces using tensor networks | |
| Karwowski et al. | Goodhart's law in reinforcement learning | |
| US7933850B1 (en) | Method and apparatus for functional relationship approximation through nonparametric regression using R-functions | |
| WO2021077226A1 (en) | Method and system for individual demand forecasting | |
| US12332755B1 (en) | Managing data processing system failures using citations generated based on hidden knowledge from predictive models | |
| US20210019397A1 (en) | Smoothed seasonality-based dynamic thresholds for anomalous computing resource usage detection | |
| CN117454165A (en) | A network model training method, motor temperature prediction method and related equipment | |
| KR20230072920A (en) | Iterative Learning Method and Apparatus for Unsupervised Anomaly Detection Under Data Contamination in IoT Environment |
Legal Events
| Date | Code | Title | Description |
|---|---|---|---|
| AS | Assignment |
Owner name: SUN MICROSYSTEMS, INC., CALIFORNIA Free format text: ASSIGNMENT OF ASSIGNORS INTEREST;ASSIGNORS:URMANOV, ALEKSEY M.;GROSS, KENNY C.;BOUGAEV, ANTON A.;SIGNING DATES FROM 20061102 TO 20061103;REEL/FRAME:018569/0927 |
|
| FEPP | Fee payment procedure |
Free format text: PAYOR NUMBER ASSIGNED (ORIGINAL EVENT CODE: ASPN); ENTITY STATUS OF PATENT OWNER: LARGE ENTITY |
|
| STCF | Information on status: patent grant |
Free format text: PATENTED CASE |
|
| FPAY | Fee payment |
Year of fee payment: 4 |
|
| AS | Assignment |
Owner name: ORACLE AMERICA, INC., CALIFORNIA Free format text: MERGER AND CHANGE OF NAME;ASSIGNORS:ORACLE USA, INC.;SUN MICROSYSTEMS, INC.;ORACLE AMERICA, INC.;REEL/FRAME:037311/0056 Effective date: 20100212 |
|
| MAFP | Maintenance fee payment |
Free format text: PAYMENT OF MAINTENANCE FEE, 8TH YEAR, LARGE ENTITY (ORIGINAL EVENT CODE: M1552); ENTITY STATUS OF PATENT OWNER: LARGE ENTITY Year of fee payment: 8 |
|
| MAFP | Maintenance fee payment |
Free format text: PAYMENT OF MAINTENANCE FEE, 12TH YEAR, LARGE ENTITY (ORIGINAL EVENT CODE: M1553); ENTITY STATUS OF PATENT OWNER: LARGE ENTITY Year of fee payment: 12 |