US7713744B2 - Determining the risk of cardiovascular disease using ion mobility of lipoproteins - Google Patents
Determining the risk of cardiovascular disease using ion mobility of lipoproteins Download PDFInfo
- Publication number
- US7713744B2 US7713744B2 US11/771,862 US77186207A US7713744B2 US 7713744 B2 US7713744 B2 US 7713744B2 US 77186207 A US77186207 A US 77186207A US 7713744 B2 US7713744 B2 US 7713744B2
- Authority
- US
- United States
- Prior art keywords
- lipoprotein
- particles
- particle
- mobility
- patient
- Prior art date
- Legal status (The legal status is an assumption and is not a legal conclusion. Google has not performed a legal analysis and makes no representation as to the accuracy of the status listed.)
- Expired - Lifetime, expires
Links
- 102000004895 Lipoproteins Human genes 0.000 title claims abstract description 233
- 108090001030 Lipoproteins Proteins 0.000 title claims abstract description 233
- 208000024172 Cardiovascular disease Diseases 0.000 title claims description 21
- 239000002245 particle Substances 0.000 claims abstract description 375
- 239000000523 sample Substances 0.000 claims abstract description 78
- 238000000034 method Methods 0.000 claims abstract description 75
- 238000009826 distribution Methods 0.000 claims abstract description 67
- 210000004369 blood Anatomy 0.000 claims abstract description 19
- 239000008280 blood Substances 0.000 claims abstract description 19
- 210000002381 plasma Anatomy 0.000 claims description 32
- 238000005259 measurement Methods 0.000 claims description 27
- 208000029078 coronary artery disease Diseases 0.000 claims description 22
- 239000012472 biological sample Substances 0.000 claims description 11
- 210000002966 serum Anatomy 0.000 claims description 11
- 230000002526 effect on cardiovascular system Effects 0.000 claims description 10
- 238000007787 electrohydrodynamic spraying Methods 0.000 claims description 6
- 238000004458 analytical method Methods 0.000 abstract description 37
- 238000001228 spectrum Methods 0.000 abstract description 19
- 150000002632 lipids Chemical class 0.000 abstract description 11
- 230000005855 radiation Effects 0.000 abstract description 6
- 238000002360 preparation method Methods 0.000 abstract description 5
- 230000000747 cardiac effect Effects 0.000 abstract description 4
- 208000019622 heart disease Diseases 0.000 abstract description 4
- 208000020446 Cardiac disease Diseases 0.000 abstract description 3
- 230000036541 health Effects 0.000 abstract description 3
- 238000002405 diagnostic procedure Methods 0.000 abstract description 2
- 238000004445 quantitative analysis Methods 0.000 abstract description 2
- 208000031226 Hyperlipidaemia Diseases 0.000 abstract 1
- 239000000538 analytical sample Substances 0.000 abstract 1
- 230000002596 correlated effect Effects 0.000 abstract 1
- 201000010099 disease Diseases 0.000 abstract 1
- 208000037265 diseases, disorders, signs and symptoms Diseases 0.000 abstract 1
- 238000000746 purification Methods 0.000 abstract 1
- 230000037230 mobility Effects 0.000 description 125
- 108010007622 LDL Lipoproteins Proteins 0.000 description 44
- 102000007330 LDL Lipoproteins Human genes 0.000 description 44
- 150000002500 ions Chemical class 0.000 description 43
- 108010010234 HDL Lipoproteins Proteins 0.000 description 29
- 102000015779 HDL Lipoproteins Human genes 0.000 description 29
- 108010062497 VLDL Lipoproteins Proteins 0.000 description 25
- FAPWRFPIFSIZLT-UHFFFAOYSA-M Sodium chloride Chemical compound [Na+].[Cl-] FAPWRFPIFSIZLT-UHFFFAOYSA-M 0.000 description 20
- 238000005199 ultracentrifugation Methods 0.000 description 20
- 239000012488 sample solution Substances 0.000 description 19
- 101710115418 Apolipoprotein(a) Proteins 0.000 description 18
- 102100040214 Apolipoprotein(a) Human genes 0.000 description 18
- 108010046315 IDL Lipoproteins Proteins 0.000 description 17
- HVYWMOMLDIMFJA-DPAQBDIFSA-N cholesterol Chemical compound C1C=C2C[C@@H](O)CC[C@]2(C)[C@@H]2[C@@H]1[C@@H]1CC[C@H]([C@H](C)CCCC(C)C)[C@@]1(C)CC2 HVYWMOMLDIMFJA-DPAQBDIFSA-N 0.000 description 17
- 230000003595 spectral effect Effects 0.000 description 17
- JHJLBTNAGRQEKS-UHFFFAOYSA-M sodium bromide Chemical compound [Na+].[Br-] JHJLBTNAGRQEKS-UHFFFAOYSA-M 0.000 description 15
- 238000001502 gel electrophoresis Methods 0.000 description 14
- 230000006870 function Effects 0.000 description 12
- 238000000926 separation method Methods 0.000 description 11
- 238000009833 condensation Methods 0.000 description 10
- 230000005494 condensation Effects 0.000 description 10
- 239000000499 gel Substances 0.000 description 10
- 230000007935 neutral effect Effects 0.000 description 10
- 239000011780 sodium chloride Substances 0.000 description 10
- 239000000243 solution Substances 0.000 description 9
- USFZMSVCRYTOJT-UHFFFAOYSA-N Ammonium acetate Chemical compound N.CC(O)=O USFZMSVCRYTOJT-UHFFFAOYSA-N 0.000 description 8
- 239000005695 Ammonium acetate Substances 0.000 description 8
- 108010004103 Chylomicrons Proteins 0.000 description 8
- 229940043376 ammonium acetate Drugs 0.000 description 8
- 235000019257 ammonium acetate Nutrition 0.000 description 8
- 239000011544 gradient gel Substances 0.000 description 8
- 239000007788 liquid Substances 0.000 description 8
- 239000003153 chemical reaction reagent Substances 0.000 description 7
- 235000012000 cholesterol Nutrition 0.000 description 7
- 238000010790 dilution Methods 0.000 description 7
- 239000012895 dilution Substances 0.000 description 7
- 230000005684 electric field Effects 0.000 description 7
- 239000000463 material Substances 0.000 description 7
- 230000001413 cellular effect Effects 0.000 description 6
- XLYOFNOQVPJJNP-UHFFFAOYSA-N water Chemical compound O XLYOFNOQVPJJNP-UHFFFAOYSA-N 0.000 description 6
- 101710095342 Apolipoprotein B Proteins 0.000 description 5
- 102100040202 Apolipoprotein B-100 Human genes 0.000 description 5
- 238000005481 NMR spectroscopy Methods 0.000 description 5
- 238000003556 assay Methods 0.000 description 5
- 238000001514 detection method Methods 0.000 description 5
- 239000000203 mixture Substances 0.000 description 5
- UFTFJSFQGQCHQW-UHFFFAOYSA-N triformin Chemical compound O=COCC(OC=O)COC=O UFTFJSFQGQCHQW-UHFFFAOYSA-N 0.000 description 5
- 238000008214 LDL Cholesterol Methods 0.000 description 4
- 238000000502 dialysis Methods 0.000 description 4
- 239000003085 diluting agent Substances 0.000 description 4
- 239000012071 phase Substances 0.000 description 4
- 230000009467 reduction Effects 0.000 description 4
- 238000003860 storage Methods 0.000 description 4
- 238000012360 testing method Methods 0.000 description 4
- 229910001868 water Inorganic materials 0.000 description 4
- 102000004856 Lectins Human genes 0.000 description 3
- 108090001090 Lectins Proteins 0.000 description 3
- 239000000443 aerosol Substances 0.000 description 3
- 239000002523 lectin Substances 0.000 description 3
- 229920002521 macromolecule Polymers 0.000 description 3
- 238000000691 measurement method Methods 0.000 description 3
- 239000012528 membrane Substances 0.000 description 3
- 230000003287 optical effect Effects 0.000 description 3
- 230000008569 process Effects 0.000 description 3
- 239000000126 substance Substances 0.000 description 3
- 150000003626 triacylglycerols Chemical class 0.000 description 3
- VHUUQVKOLVNVRT-UHFFFAOYSA-N Ammonium hydroxide Chemical compound [NH4+].[OH-] VHUUQVKOLVNVRT-UHFFFAOYSA-N 0.000 description 2
- 108010071619 Apolipoproteins Proteins 0.000 description 2
- 102000007592 Apolipoproteins Human genes 0.000 description 2
- 101000889990 Homo sapiens Apolipoprotein(a) Proteins 0.000 description 2
- VYPSYNLAJGMNEJ-UHFFFAOYSA-N Silicium dioxide Chemical compound O=[Si]=O VYPSYNLAJGMNEJ-UHFFFAOYSA-N 0.000 description 2
- 239000000908 ammonium hydroxide Substances 0.000 description 2
- 239000012062 aqueous buffer Substances 0.000 description 2
- 230000002902 bimodal effect Effects 0.000 description 2
- 230000005540 biological transmission Effects 0.000 description 2
- 239000007853 buffer solution Substances 0.000 description 2
- 238000005119 centrifugation Methods 0.000 description 2
- 239000000470 constituent Substances 0.000 description 2
- 238000011109 contamination Methods 0.000 description 2
- 239000008367 deionised water Substances 0.000 description 2
- 229910021641 deionized water Inorganic materials 0.000 description 2
- 238000001035 drying Methods 0.000 description 2
- 238000002474 experimental method Methods 0.000 description 2
- 238000005188 flotation Methods 0.000 description 2
- 230000005484 gravity Effects 0.000 description 2
- 102000045903 human LPA Human genes 0.000 description 2
- 238000003018 immunoassay Methods 0.000 description 2
- 238000001871 ion mobility spectroscopy Methods 0.000 description 2
- 230000033001 locomotion Effects 0.000 description 2
- 239000011159 matrix material Substances 0.000 description 2
- 230000015654 memory Effects 0.000 description 2
- 125000002496 methyl group Chemical group [H]C([H])([H])* 0.000 description 2
- 238000012986 modification Methods 0.000 description 2
- 230000004048 modification Effects 0.000 description 2
- 238000003921 particle size analysis Methods 0.000 description 2
- 102000004169 proteins and genes Human genes 0.000 description 2
- 108090000623 proteins and genes Proteins 0.000 description 2
- 238000011160 research Methods 0.000 description 2
- 238000005464 sample preparation method Methods 0.000 description 2
- 238000005070 sampling Methods 0.000 description 2
- 238000001179 sorption measurement Methods 0.000 description 2
- 238000004611 spectroscopical analysis Methods 0.000 description 2
- 238000010186 staining Methods 0.000 description 2
- 238000012546 transfer Methods 0.000 description 2
- 102000009027 Albumins Human genes 0.000 description 1
- 108010088751 Albumins Proteins 0.000 description 1
- 101710132601 Capsid protein Proteins 0.000 description 1
- 101710094648 Coat protein Proteins 0.000 description 1
- 102000003886 Glycoproteins Human genes 0.000 description 1
- 108090000288 Glycoproteins Proteins 0.000 description 1
- 102100021181 Golgi phosphoprotein 3 Human genes 0.000 description 1
- 102000057248 Lipoprotein(a) Human genes 0.000 description 1
- 108010033266 Lipoprotein(a) Proteins 0.000 description 1
- 101710125418 Major capsid protein Proteins 0.000 description 1
- 101710141454 Nucleoprotein Proteins 0.000 description 1
- 101710083689 Probable capsid protein Proteins 0.000 description 1
- 238000010521 absorption reaction Methods 0.000 description 1
- 238000001042 affinity chromatography Methods 0.000 description 1
- 239000000427 antigen Substances 0.000 description 1
- 102000036639 antigens Human genes 0.000 description 1
- 108091007433 antigens Proteins 0.000 description 1
- 239000007864 aqueous solution Substances 0.000 description 1
- 238000003491 array Methods 0.000 description 1
- 230000008901 benefit Effects 0.000 description 1
- 230000015572 biosynthetic process Effects 0.000 description 1
- 239000008364 bulk solution Substances 0.000 description 1
- 239000006227 byproduct Substances 0.000 description 1
- 230000015556 catabolic process Effects 0.000 description 1
- 210000004027 cell Anatomy 0.000 description 1
- 239000011248 coating agent Substances 0.000 description 1
- 238000000576 coating method Methods 0.000 description 1
- 238000004891 communication Methods 0.000 description 1
- 230000000295 complement effect Effects 0.000 description 1
- 150000001875 compounds Chemical class 0.000 description 1
- 238000012790 confirmation Methods 0.000 description 1
- 238000010276 construction Methods 0.000 description 1
- 238000012937 correction Methods 0.000 description 1
- 210000000805 cytoplasm Anatomy 0.000 description 1
- 238000000354 decomposition reaction Methods 0.000 description 1
- 238000001739 density measurement Methods 0.000 description 1
- 230000001419 dependent effect Effects 0.000 description 1
- 238000001212 derivatisation Methods 0.000 description 1
- 238000000766 differential mobility spectroscopy Methods 0.000 description 1
- 238000009792 diffusion process Methods 0.000 description 1
- 239000012470 diluted sample Substances 0.000 description 1
- 238000003113 dilution method Methods 0.000 description 1
- 230000000694 effects Effects 0.000 description 1
- 238000001493 electron microscopy Methods 0.000 description 1
- 238000001962 electrophoresis Methods 0.000 description 1
- 238000005516 engineering process Methods 0.000 description 1
- 230000002255 enzymatic effect Effects 0.000 description 1
- 238000011049 filling Methods 0.000 description 1
- 238000001914 filtration Methods 0.000 description 1
- 239000012530 fluid Substances 0.000 description 1
- 238000009472 formulation Methods 0.000 description 1
- 238000005194 fractionation Methods 0.000 description 1
- 239000012634 fragment Substances 0.000 description 1
- 238000002523 gelfiltration Methods 0.000 description 1
- 230000002068 genetic effect Effects 0.000 description 1
- 238000000227 grinding Methods 0.000 description 1
- 239000012535 impurity Substances 0.000 description 1
- 239000002198 insoluble material Substances 0.000 description 1
- 239000006101 laboratory sample Substances 0.000 description 1
- 108010022197 lipoprotein cholesterol Proteins 0.000 description 1
- 230000007774 longterm Effects 0.000 description 1
- 230000005499 meniscus Effects 0.000 description 1
- 230000004060 metabolic process Effects 0.000 description 1
- 230000001035 methylating effect Effects 0.000 description 1
- 239000002105 nanoparticle Substances 0.000 description 1
- 238000000655 nuclear magnetic resonance spectrum Methods 0.000 description 1
- 230000006911 nucleation Effects 0.000 description 1
- 238000010899 nucleation Methods 0.000 description 1
- 238000012015 optical character recognition Methods 0.000 description 1
- 230000000704 physical effect Effects 0.000 description 1
- 238000001556 precipitation Methods 0.000 description 1
- 238000005086 pumping Methods 0.000 description 1
- 238000004451 qualitative analysis Methods 0.000 description 1
- 238000011946 reduction process Methods 0.000 description 1
- 238000009877 rendering Methods 0.000 description 1
- 238000012502 risk assessment Methods 0.000 description 1
- 150000003839 salts Chemical class 0.000 description 1
- 238000012216 screening Methods 0.000 description 1
- SCPYDCQAZCOKTP-UHFFFAOYSA-N silanol Chemical compound [SiH3]O SCPYDCQAZCOKTP-UHFFFAOYSA-N 0.000 description 1
- 239000000377 silicon dioxide Substances 0.000 description 1
- 239000007787 solid Substances 0.000 description 1
- 239000007790 solid phase Substances 0.000 description 1
- 239000002904 solvent Substances 0.000 description 1
- 238000002798 spectrophotometry method Methods 0.000 description 1
- 238000010183 spectrum analysis Methods 0.000 description 1
- 210000001519 tissue Anatomy 0.000 description 1
- 238000011282 treatment Methods 0.000 description 1
- 238000011269 treatment regimen Methods 0.000 description 1
- 210000000605 viral structure Anatomy 0.000 description 1
Images


Classifications
-
- G—PHYSICS
- G01—MEASURING; TESTING
- G01N—INVESTIGATING OR ANALYSING MATERIALS BY DETERMINING THEIR CHEMICAL OR PHYSICAL PROPERTIES
- G01N15/00—Investigating characteristics of particles; Investigating permeability, pore-volume, or surface-area of porous materials
- G01N15/02—Investigating particle size or size distribution
- G01N15/0266—Investigating particle size or size distribution with electrical classification
-
- G—PHYSICS
- G01—MEASURING; TESTING
- G01N—INVESTIGATING OR ANALYSING MATERIALS BY DETERMINING THEIR CHEMICAL OR PHYSICAL PROPERTIES
- G01N33/00—Investigating or analysing materials by specific methods not covered by groups G01N1/00 - G01N31/00
- G01N33/48—Biological material, e.g. blood, urine; Haemocytometers
- G01N33/50—Chemical analysis of biological material, e.g. blood, urine; Testing involving biospecific ligand binding methods; Immunological testing
- G01N33/92—Chemical analysis of biological material, e.g. blood, urine; Testing involving biospecific ligand binding methods; Immunological testing involving lipids, e.g. cholesterol, lipoproteins, or their receptors
-
- G—PHYSICS
- G01—MEASURING; TESTING
- G01N—INVESTIGATING OR ANALYSING MATERIALS BY DETERMINING THEIR CHEMICAL OR PHYSICAL PROPERTIES
- G01N27/00—Investigating or analysing materials by the use of electric, electrochemical, or magnetic means
- G01N27/62—Investigating or analysing materials by the use of electric, electrochemical, or magnetic means by investigating the ionisation of gases, e.g. aerosols; by investigating electric discharges, e.g. emission of cathode
- G01N27/622—Ion mobility spectrometry
- G01N27/624—Differential mobility spectrometry [DMS]; Field asymmetric-waveform ion mobility spectrometry [FAIMS]
-
- G—PHYSICS
- G01—MEASURING; TESTING
- G01N—INVESTIGATING OR ANALYSING MATERIALS BY DETERMINING THEIR CHEMICAL OR PHYSICAL PROPERTIES
- G01N2800/00—Detection or diagnosis of diseases
- G01N2800/52—Predicting or monitoring the response to treatment, e.g. for selection of therapy based on assay results in personalised medicine; Prognosis
-
- Y—GENERAL TAGGING OF NEW TECHNOLOGICAL DEVELOPMENTS; GENERAL TAGGING OF CROSS-SECTIONAL TECHNOLOGIES SPANNING OVER SEVERAL SECTIONS OF THE IPC; TECHNICAL SUBJECTS COVERED BY FORMER USPC CROSS-REFERENCE ART COLLECTIONS [XRACs] AND DIGESTS
- Y10—TECHNICAL SUBJECTS COVERED BY FORMER USPC
- Y10T—TECHNICAL SUBJECTS COVERED BY FORMER US CLASSIFICATION
- Y10T436/00—Chemistry: analytical and immunological testing
- Y10T436/10—Composition for standardization, calibration, simulation, stabilization, preparation or preservation; processes of use in preparation for chemical testing
- Y10T436/104165—Lipid, cholesterol, or triglyceride standard or control
-
- Y—GENERAL TAGGING OF NEW TECHNOLOGICAL DEVELOPMENTS; GENERAL TAGGING OF CROSS-SECTIONAL TECHNOLOGIES SPANNING OVER SEVERAL SECTIONS OF THE IPC; TECHNICAL SUBJECTS COVERED BY FORMER USPC CROSS-REFERENCE ART COLLECTIONS [XRACs] AND DIGESTS
- Y10—TECHNICAL SUBJECTS COVERED BY FORMER USPC
- Y10T—TECHNICAL SUBJECTS COVERED BY FORMER US CLASSIFICATION
- Y10T436/00—Chemistry: analytical and immunological testing
- Y10T436/24—Nuclear magnetic resonance, electron spin resonance or other spin effects or mass spectrometry
Definitions
- the present invention generally relates to particle size analysis and, further, to analysis of biological particles for diagnostic purposes utilizing traditional particulate size or mobility measurement devices.
- One aspect of the present invention more particularly relates to medical diagnostics for the quantitative and qualitative analysis of lipoprotein classes and subclasses and their relationship to the assignment of coronary heart disease and other lipid-related health risks.
- lipoprotein particle measurements are used to assess cardiovascular and other lipid-related health risks, determine treatment protocols and track the efficacy of treatment regimens.
- Lipoprotein particles comprise macromolecules that package cholesterol and other biochemicals, enabling them to be transported through the blood stream.
- the size distribution of lipoprotein particles varies among individuals due to both genetic and nongenetic influences.
- the diameters of lipoprotein particles typically range from about 7 nm to about 120 nm. In this diameter size range, there exist subfractions of the particles that are important predictors of cardiovascular disease. For instance, very low density lipoproteins transport triglycerides in the blood stream; high very low density lipoprotein levels in the blood stream are indicative of hypertriglyceremia. These subfractions are identified by analytical techniques that display the quantity of material as a function of lipoprotein particle size or density.
- Typical standard lipid measurements include fasting total cholesterol, triglyceride, as well as HDL and LDL cholesterol.
- LDL cholesterol the most widely used method for measuring LDL cholesterol is the indirect Friedewald method (Friedewald, et al., Clin. Chem. Vol. 18, pp. 499-502, 1972).
- the Friedewald assay method requires three steps: 1) determination of plasma triglyceride (TG) and total cholesterol (TC), 2) precipitation of VLDL and LDL, and 3) quantitation of HDL cholesterol (HDLC).
- TG plasma triglyceride
- TC total cholesterol
- HDLC HDL cholesterol
- the predominant methods for lipoprotein subspecies analysis include nuclear magnetic resonance, the vertical auto profile, and Electrophoretic gel separation. Each of these methods will be briefly discussed below.
- Otvos teaches a nuclear magnetic resonance (NMR) procedure for determining the concentrations of lipoprotein subclasses, which has greater accuracy than Friedewald (U.S. Pat. No. 5,343,389, issued Aug. 30, 1994). Otvos initially obtains the NMR chemical shift spectrum of a blood plasma or serum sample. The observed spectrum of the entire plasma sample is then matched with the known weighted sums of NMR spectra of lipoprotein subclasses, which are stored in a computer software program. The weight factors that give the best fit between the sample spectrum and the calculated spectrum are then used to estimate the concentrations of constituent lipoprotein subclasses in the blood sample. This procedure has the additional advantage of being rapid.
- NMR nuclear magnetic resonance
- VAP Vertical Auto Profile
- a flow analyzer is used for the enzymatic analysis of cholesterol in lipoprotein classes separated by a short spin single vertical ultracentrifugation, with subsequent spectrophotometry and software analysis of the resulting data. While a useful advance, this technique does not resolve the LDL into all seven subspecies identified by electrophoretic gradient gel separation.
- the gel separation method which depends on uniform staining of all components that are subsequently optically measured, suffers from nonuniform chromogenicity. That is, not all lipoprotein particles stain equally well.
- the differential stain uptake produces erroneous quantitative results, in that a less staining peak may be read at a lower value than is actually present.
- the nonuniform chromogenicity can result in erroneous qualitative results, in that measured peaks may be skewed to a sufficient degree as to confuse one class or subclass of lipoprotein with another.
- a high-resolution assay for measuring all subclasses of LDL as well as VLDL, IDL, HDL, and chylomicron particles would be an important innovation in lipid measurement technology. If inexpensive and convenient, such an assay could be employed not only in research laboratories, but also in a clinical laboratory setting. Ideally, clinicians could use this information to improve current estimation of coronary disease risk and make appropriate medical risk management decisions based on the assay.
- This invention provides: 1) a method for preparing plasma samples for differential mobility analysis (“DMA”), 2) a technique for measuring the size or density distribution of biological particles (preferably lipoprotein particles) based on the measured particle mobility counting rate for the number of biological particles counted per second at a specific selected mobility as a function of size,
- DMA differential mobility analysis
- a fluid such as air
- a DMA device for measuring the number of biological particles in each size class and subclass
- Blood plasma samples are processed to separate all classes and subclasses of lipoprotein particles from bulk blood serum using steps designed ultimately for transferring the particles into the gas phase for subsequent mobility analysis.
- the technique preserves lipoprotein particle composition and size, and introduces no contamination into the lipoprotein particles.
- the electrospray process initially produces electrospray droplets with many different charge states. These multiply-charged droplets are passed in close proximity to an alpha radiation source, which produces alpha particles, or free secondary electrons, that reduces the charge state of the electrospray droplets to either neutral or single positive charges.
- the charged droplets may alternatively be treated in other ways to achieve a uniform charge state of no more than a single positive charge.
- An inverse linear relationship between lipoprotein mobility and size allows the mobility distribution data to be converted to a particle size distribution, thereby providing a way to display a spectrum, or distribution, of the number of particles counted per unit time vs. particle size.
- this measurement can be regarded as number of particles vs. particle size, and can be related back to a quantitative fractional distribution of lipoproteins in the original sample.
- the resulting lipoprotein particle size distribution is comprised of component regions. These regions, in turn, distinguish the quantity and types of lipoprotein particles in the original serum sample. By determining the relative location of certain peaks in certain of the regions, a prediction can be made as to the cardiac risk.
- the size distribution may additionally be converted into a distribution of the number of particles vs. density for more traditional comparison of lipoprotein densities.
- the present invention provides a method for determining a cardiovascular disease in a patient comprising providing a biological sample from a patient; obtaining a mobility distribution of charged lipoprotein particles from the sample by electrospraying the lipoprotein particles so that the particles are provided in a charged state; delivering the lipoprotein particles to a differential mobility analyzer; comparing the mobility distribution of lipoprotein particles from the patient to a reference lipoprotein particle mobility distribution; and determining whether the patient has a cardiovascular disease based on the comparison.
- the charged lipoprotein particles are at least one of VLDL, IDL, LDL, HDL or their subclasses.
- the biological sample is blood, plasma or serum.
- the charged lipoprotein particles are classified on the basis of the mobility distribution.
- the method may further comprise converting the mobility distribution of charge reduced lipoproteins to at least one of the following measurements prior to determining the cardiovascular disease of the patient: a particle mobility, a particle size, a particle density, a particle mass, a number of particles in a size interval and an amount of particle mass in a size interval.
- the cardiovascular disease is coronary heart disease.
- step (d) is carried out by a deterministic algorithm.
- the present invention also provides a method for determining a cardiovascular condition in a patient, comprising providing a biological sample from a patient; obtaining a mobility distribution of charged lipoprotein particles from the sample by electrospraying the lipoprotein particles so that the particles are provided in a charged state; delivering the lipoprotein particles to a differential mobility analyzer; comparing the mobility distribution of lipoprotein particles from the patient to a reference lipoprotein particle mobility distribution; and determining whether the patient has a cardiovascular condition based on the comparison.
- the charged lipoprotein particles are at least one of VLDL, IDL, LDL, HDL or their subclasses.
- the biological sample is blood, plasma or serum.
- the charged lipoprotein particles are classified on the basis of the mobility distribution.
- the method may further comprise converting the mobility distribution of charge reduced lipoproteins to at least one of the following measurements prior to determining the cardiovascular condition of the patient: a particle mobility, a particle size, a particle density, a particle mass, a number of particles in a size interval and an amount of particle mass in a size interval.
- the cardiovascular condition is cardiac disease or a predisposition to develop cardiovascular disease.
- the present invention also provides a method for determining a predisposition to developing a cardiovascular disease or condition in a patient comprising providing a biological sample from a patient; obtaining a mobility distribution of charged lipoprotein particles from the sample by electrospraying the lipoprotein particles so that the particles are provided in a charged state; delivering the lipoprotein particles to a differential mobility analyzer; comparing the mobility distribution of lipoprotein particles from the patient to a reference lipoprotein particle mobility distribution; and determining whether the patient has a predisposition to develop a cardiovascular disease or condition based on the comparison.
- the charged lipoprotein particles are at least one of VLDL, IDL, LDL, HDL or their subclasses.
- the sample is blood, plasma or serum.
- the charged lipoprotein particles are classified on the basis of the mobility distribution.
- the method may further comprise converting the mobility distribution of charge reduced lipoproteins to at least one of the following measurements prior to determining the predisposition to develop the cardiovascular disease or condition of the patient: a particle mobility, a particle size, a particle density, a particle mass, a number of particles in a size interval and an amount of particle mass in a size interval.
- step (d) is carried out by a deterministic algorithm.
- FIG. 1 is an overview of the ion mobility analysis of biological particles hardware and analytical sequence.
- FIG. 2 is a table of major lipoprotein classes, subclasses, densities and particle sizes as reported from gel electrophoresis results.
- FIG. 3 is a close up cross-sectional view of a properly operating axisymmetric electrospray capillary with a stable Taylor cone.
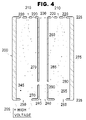
- FIG. 4 is a cross sectional view through the centerline of an axisymmetric differential mobility analyzer.
- FIG. 5 is a scanning differential mobility analyzer output of mass-offset lipoprotein size distributions obtained from six individuals.
- FIG. 6 is a graph indicating the approximately inverse linear relationship between lipoprotein particle diameter, and the estimated lipoprotein sample density.
- FIG. 7 is a graph indicating the approximately linear relationship between lipoprotein particle count, and the corresponding lipoprotein sample particle count.
- FIG. 8 is a differential mobility spectral scan of a sample of lipoprotein having an average density of about 1.000 g/cm 3 , corresponding to VLDL I.
- FIG. 9 is a differential mobility spectral scan of a sample of lipoprotein having an average density of about 1.003 g/cm 3 , corresponding to VLDL I.
- FIG. 10 is a differential mobility spectral scan of a sample of lipoprotein having an average density of about 1.005 g/cm 3 , corresponding to VLDL I.
- FIG. 11 is a differential mobility spectral scan of a sample of lipoprotein having an average density of about 1.0075 g/cm 3 , corresponding to VLDL II.
- FIG. 12 is a differential mobility spectral scan of a sample of lipoprotein having an average density of about 1.0105 g/cm 3 , corresponding to IDL I.
- FIG. 13 is a differential mobility spectral scan of a sample of lipoprotein having an average density of about 1.0161 g/cm 3 , corresponding to IDL II.
- FIG. 14 is a differential mobility spectral scan of a sample of lipoprotein having an average density of about 1.0217 g/cm 3 , corresponding to LDL I.
- FIG. 15 is a differential mobility spectral scan of a sample of lipoprotein having an average density of about 1.0273 g/cm 3 , corresponding to LDL IIa.
- FIG. 16 is a differential mobility spectral scan of a sample of lipoprotein having an average density of about 1.0330 g/cm 3 , corresponding to LDL IIb.
- FIG. 17 is a differential mobility spectral scan of a sample of lipoprotein having an average density of about 1.0386 g/cm 3 , corresponding to LDL IIIa.
- FIG. 18 is a differential mobility spectral scan of a sample of lipoprotein having an average density of about 1.0442 g/cm 3 , corresponding to LDL IVa.
- FIG. 19 is a differential mobility spectral scan of a sample of lipoprotein having an average density of about 1.0498 g/cm 3 , corresponding to LDL IVa.
- FIG. 20 is a differential mobility spectral scan of a sample of lipoprotein having an average density of about 1.0692 g/cm 3 , corresponding to HDL IIb.
- FIG. 21 is a differential mobility spectral scan of a sample of lipoprotein having an average density of about 1.0767 g/cm 3 , corresponding to HDL IIb.
- FIG. 22 is a differential mobility spectral scan of a sample of lipoprotein having an average density of about 1.0844 g/cm 3 , corresponding to HDL IIb.
- FIG. 23 is a differential mobility spectral scan of a sample of lipoprotein having an average density of about 1.090 g/cm 3 , corresponding to HDL IIb.
- Bio particle means a material having a non-covalently bound assembly of molecules derived from a living source. Examples are lipoprotein particles assembled from apolipoproteins and lipids; viral components assembled from non-covalently bound coat proteins and glycoproteins; immune complexes assembled from antibodies and their cognate antigens, etc., but not entire cells.
- Physiological sample means a sample obtained from an organism, such as blood, tissue, pulp, cytoplasm, etc.
- CHD coronary heart disease
- VLDL, IDL, LDL, and HDL are described by class name, acronym, subclass, and density range as shown in FIG. 2 .
- Chylomicrons means biological particles of size 70-120 nm, with corresponding densities of less than 1.006 g/mL.
- “Differential Mobility Analyzer” means a device for classifying charged particles on the basis of their ion electrical mobility. When the particles have a known uniform charge, the size of the particles classified may be determined from their mobility.
- Lp(a) means biological particles consisting of LDL covalently attached to the protein lipoprotein A.
- Lipoprotein particles means particles obtained from mammalian blood, comprising apolipoproteins biologically assembled with noncovalent bonds to package cholesterol and lipids. Lipoprotein particles preferably refer to biological particles having a size range of 7 to 1200 nm. Lipoprotein particles, as used herein, essentially include VLDL, IDL, LDL, HDL and chylomicrons.
- Centrifugation means separation or analysis of substances in a solution as a function of density and density-related molecular weight by subjecting the solution to a centrifugal force generated by high-speed rotation in an appropriate instrument.
- Plasma A is the designation applied to individuals having a characteristic lipoprotein particle distribution indicating a relatively low risk for CHD, as illustrated in FIG. 5 .
- Plasma B is the designation applied to individuals having a characteristic lipoprotein particle distribution indicating a relatively high risk for CHD, as illustrated in FIG. 5 .
- Pattern AB is the designation applied to individuals having a characteristic lipoprotein particle distribution indicating an intermediate risk for CHD, as illustrated in FIG. 5 .
- Pattern AB has a distribution with some of the characteristics of both Pattern A and Pattern B.
- Predisposition as used herein is substantially synonymous with risk, inclination, tendency, predilection, or susceptibility.
- Reference Size Distribution means a lipoprotein particle size distribution such as Patterns A, B, or AB as further discussed in connection with FIG. 5 .
- Computer readable medium means any source of organized information that may be processed by a computer, including but not limited to: a magnetically readable storage system; optically readable storage media such as punch cards or printed matter readable by direct methods, optical reflectance and transmission scanning, or methods of optical character recognition; other optical storage media such as a compact disc (CD), digital versatile disc (DVD), rewritable CD and/or DVD; electrically readable media such as programmable read only memories (PROMs), electrically erasable programmable read only memories (EEPROMs), field programmable gate arrays (FPGAs), flash random access memory (flash RAM); and remotely transmitted information transmitted by electromagnetic or optical methods.
- PROMs programmable read only memories
- EEPROMs electrically erasable programmable read only memories
- FPGAs field programmable gate arrays
- flash RAM flash random access memory
- Distribution means a generalized function of one or more variables, and commonly depicted as a scatter chart, graph, plot, or histogram.
- FIG. 1 depicts the major functional components involved in biological particle ion mobility analysis.
- a sample is placed in a microcentrifuge tube 410 , which is then placed in an centrifuge 420 to remove undesirable components, such as Lp(a), and other cellular components as described below in Section D “Preparation of Purified Lipoprotein Particle Samples.”
- a sample solution 455 is placed in a testing microcentrifuge tube 450 , which is in turn placed in a pressurized chamber 460 .
- a high voltage variable power supply 430 positively biases the pressurized chamber 460 , and the sample solution 455 , through a Pt wire 435 .
- the positive bias and higher relative pressure causes a capillary 100 to form a Taylor cone 150 emitting particle droplets from the pressurized chamber 460 .
- FIG. 3 more fully details the capillary 100 .
- a dry gas 210 propels the droplets into an emission region of an alpha radiation source 480 , which reduces the charge state of the droplets to no more than one positive charge per droplet as the droplets containing components other than the volatile diluent dry to single particles.
- the charged droplets may alternatively be treated with other methods to achieve a uniform charge state of no more than a single positive charge.
- One such other method is to use an alternating current corona, which produces secondary electrons having the same charge state reduction as an alpha source.
- the dry gas 210 propels the particles into a differential mobility analyzer 200 , which is shown in more detail in FIG. 4 .
- a laminar flow excess gas 220 is introduced to match the velocity of the dry gas 210 flow.
- the particles carried by the combined flows are selected into a mobility selected particle 240 flow, which in turn flows into a particle counter 490 .
- Particle counter 490 is preferably in communication with a computer system (not shown) having storage capability onto one or more computer readable media for recording a scanned distribution output of the differently sized particles.
- a computer system not shown
- the single positively charged particles, the fixed dry gas 210 and additional dry gas 230 flows, and particular voltage setting of the scanned high voltage power supply 205 , classifies a selected particle stream 285 to enter into an exiting annular selection slit 290 , the selected particle stream 285 having particles with a particular mobility and corresponding particle size.
- lipoprotein particles e.g. VLDL, IDL, LDL, and HDL and their subclasses
- VLDL, IDL, LDL, and HDL and their subclasses can be processed in such a fashion so that their particle mobilities, and hence size and density, can be quickly determined, without lipoprotein particle breakdown.
- size or mobility distributions may be converted into distributions of: a particle mass, a density ⁇ g/cm 3 of original plasma, a number of particles in a size interval, and an amount of particle mass in a size interval.
- Lipoproteins are complex macromolecules found in human blood plasma that package lipids into lipoprotein particles. Among other functions, lipoprotein particles in the circulatory system transport cholesterol for cellular use. Lipoprotein particles are subdivided into a variety of classes and subclasses based on density as well as particle size. Lipoprotein particle density can be determined directly by equilibrium density ultracentrifugation and analytic ultracentrifugation. Lipoprotein particle density may also be determined indirectly based on particle size and a known relationship between particle size and density. Particle size may be determined by several methods including gel electrophoresis.
- FIG. 2 is a table of the present standard classes and subclasses that have been assigned to various lipoprotein fractions using traditional gel electrophoresis measurements: very low density lipoproteins (VLDLs) with subclasses VLDL I and II, intermediate density lipoproteins (IDLs) with subclasses IDL I and II, low density lipoproteins (LDLs) and high density lipoproteins (HDLs), which typically includes several subclasses, such as HDL IIa, IIb, IIIa, IIIb, and IIIc.
- VLDLs very low density lipoproteins
- IDLs intermediate density lipoproteins
- LDLs low density lipoproteins
- HDLs high density lipoproteins
- Chylomicrons are not included in FIG. 2 , as chylomicrons have not been found to have any clinical significance in the prediction of heart disease.
- Ultracentrifugally isolated lipoprotein particles can be analyzed for flotation properties by analytic ultracentrifugation in two different salt density backgrounds, allowing for the determination of hydrated LDL particle density, as shown in Lindgren, et. al, Blood Lipids and Lipoproteins: Quantitation, Composition and Metabolism , Ed. G. L. Nelson, Wiley, 1992, p. 181-274, which is incorporated herein by reference.
- the LDL class as indicated in FIG. 2 , can be further divided into seven subclasses based on density or particle diameter by using a preparative separation technique known as equilibrium density gradient ultracentrifugation (EDGU). It is known that elevated levels of specific LDL subclasses, LDL-IIIa, IIIb, IVa and IVb, is a clinical finding which correlates closely with increased risk for CHD, including atherosclerosis.
- EDGU equilibrium density gradient ultracentrifugation
- Determination of the total serum cholesterol level and the levels of cholesterol in the LDL and HDL fractions are routinely used as diagnostic tests for coronary heart disease risk. Lipoprotein class and subclass distribution is a more predictive test, however, since it is expensive and time-consuming, it is typically ordered by physicians only for a limited number of patients.
- ion mobility diameters and gel electrophoresis diameters may also be due to the fact that the lipoprotein particles are distorted as they bump into the gel matrix under the influence of the electrophoresis gel's intrinsic impressed electric field.
- the size difference may also be due to historical data used to convert particle density (obtained from analytic ultracentrifuge separations) to particle size obtained from electron microscopy.
- FIG. 2 presents the lipoprotein sizes accepted for gel electrophoresis runs as published in common scientific literature. It is the inventors' opinion that ion mobility sizes may be more accurate than gel sizes, however, this needs to be confirmed.
- sample preparation comprises the following steps: taking a blood sample, separation of the blood plasma from the cellular matter, removal of non-lipoprotein proteins from the plasma by one of several methods, such as ultracentrifugation or adsorption on affinity gels, dialysis filtration to remove density adjusting components that would affect particle volatility and/or size, addition of volatile reagents to facilitate electrospray droplet formation, dilution of lipoprotein particle sample solution, and adjustment of sample solution pH.
- methods such as ultracentrifugation or adsorption on affinity gels, dialysis filtration to remove density adjusting components that would affect particle volatility and/or size, addition of volatile reagents to facilitate electrospray droplet formation, dilution of lipoprotein particle sample solution, and adjustment of sample solution pH.
- a 50 to 100 ⁇ L fasting blood sample is initially taken. Chylomicrons are not typically present in people who have been fasting for a period of at least 12 hours, so overlap of VLDL particle sizes and chylomicron sizes is eliminated by fasting.
- the sample is then initially spun in a centrifuge. The sample is preferably spun for approximately 10 minutes at 2000 gravities, sufficient to remove the cellular components from the sample. During this process, the more dense cellular components stratify at the bottom of the sample. A remaining less dense plasma specimen on top is then drawn off
- the plasma specimen is then density-adjusted to a specific density using high purity solutions of sodium chloride (NaCl) and sodium bromide (NaBr).
- the specific density is chosen to be greater than or equal to the highest density of the lipoprotein material to be analyzed, so that the lipoprotein material floats when density stratified.
- These densities may be found in the FIG. 2 table of lipoprotein classes, subclasses, densities, and sizes. By sequentially centrifuging from lowest density to highest density of the density adjustment, the various classes and subclasses of lipoproteins may be sequentially extracted.
- a single density adjustment using NaCl and NaBr salts is performed instead of a series of sequential density adjustments followed by centrifugation.
- a single specific density is chosen for density adjustment in the preferred embodiment.
- the sample density adjustment can be selected within the range of 1-1.21 g/mL according to the densities in FIG. 2 to separate a class of lipoproteins having equal or lesser density.
- a density adjustment to 1.21 g/mL is made. In this manner, all HDLs, IDLs, LDLs, and VLDLs are simultaneously extracted, since they have densities less than 1.21 g/mL.
- the density-adjusted plasma sample is then ultracentrifuged in a common commercially available 100 ⁇ L ultracentrifuge tube for approximately 18 hours at 100,000 gravities, or 10 6 m/s 2 to separate the non-lipoprotein proteins from the lipoprotein particles.
- Non-lipoprotein proteins, particularly albumin are then removed from the plasma specimen, preferably by this ultracentrifugation step.
- the lipoprotein particles float to the top of the sample during ultracentrifugation.
- Lp(a) is another type of lipoprotein particle found in serum having a molecular composition distinct from IDL and LDL particles.
- Lp(a) has a particle size that overlaps with LDL and IDL particles and therefore will interfere with particle size analysis when Lp(a) particles are present in serum.
- Lp(a) concentrations Although some patients have naturally occurring low Lp(a) concentrations, it is a good practice to remove the Lp(a) prior to LDL particle size measurements to preclude otherwise inaccurate measurements for those patients who do have significant Lp(a) concentrations. In this manner, any potential Lp(a) size interference problem is avoided.
- Lp(a) is preferably removed from the plasma sample. This removal can be achieved by solid phase absorption of the Lp(a) protein using either lectin or specific antibodies attached to a matrix. Lp(a) concentration can then be measured separately (e.g. by immunoassay) or by the difference between the immunoassay results using absorbed and unabsorbed plasma. Lp(a) is most preferably removed by lectin affinity chromatography.
- the Lp(a) removal step preferably follows density adjustment and ultracentrifugation. It precedes dialysis of the selected 1.21 g/mL fraction.
- the lowest density, top portion, of the ultracentrifuged sample is then drawn off for subsequent dialysis as a liquid sample containing lipoprotein particles.
- This liquid is then placed behind a 10,000 Dalton molecular weight cutoff filter, to retain the lipoprotein particles behind the filter, yet freely allow diffusion of H 2 O, NaCl and NaBr ionic components.
- the filter with the liquid containing the density adjusting NaCl and NaBr, is immersed in 0.22 ⁇ m particle-filtered, 18 Meg-ohm deionized water to allow the NaCl and NaBr to reach concentration equilibrium with the surrounding water. In this fashion, the NaCl and NaBr, which otherwise would have affected particle weight during mobility measurement, are removed, or dialyzed. In the laboratory, it has been found sufficient to place the cutoff membrane in contact with water, and simply deposit a drop of sample to the top of the membrane. The NaCl and NaBr levels in the drop of sample then reach equilibrium with the water diluent.
- the sample solution is then prepared in a volatile aqueous buffer at sufficiently near neutral pH (pH 7.0), so as to prevent the lipoprotein particles from disintegrating into one or more of their constituent molecules.
- the preferred buffer solution is 20-30 mM, preferably 25 mM, ammonium acetate in particle-filtered 18 Meg-ohm deionized water with pH adjusted to neutral with high purity ammonium hydroxide. It is critical to prepare the ammonium acetate and ammonium hydroxide solutions with very high purity reagents in order to prevent contamination of the lipoprotein particles, which would subsequently affect the particle mobility measurements.
- the volatile aqueous buffer serves three principal functions: 1) to dilute the sample sufficiently so that, when electrosprayed, only one lipoprotein particle is contained within each electrospray droplet, 2) to provide for electrical conductivity so that the capillary bore sample contents are uniformly at approximate equipotential with the high voltage power source, and 3) to impart a higher vapor pressure to the bulk solution, thereby improving volatility of the diluted sample and hastening droplet drying time.
- ammonium acetate has been used here, people skilled in the art could arrive at several alternative formulations achieving the same three functions.
- the amount of insoluble material and the residue remaining after dilution and subsequent volatilization are important specifications for choosing a particular quality of reagent. These quantities should be minimized; preferably each reagent should have less than 0.005 weight percent of impurities. Subsequently, the lipoprotein sample is either prepared in solution with the reagent or diluted with this reagent to about 10 11 particles per mL or less.
- the lipoprotein particles suspended in the ammonium acetate solution are then electrosprayed.
- the electrospray is fed by pumping the sample solution at a rate of about 50 nL per minute through a small capillary tube, preferably an Osage number 062442 capillary.
- a small capillary tube preferably an Osage number 062442 capillary.
- sample solution is placed in a microcentrifuge tube and the entrance to a silica capillary having a 20 ⁇ m interior diameter is placed into this sample solution.
- the microcentrifuge sample tube and the entrance end to the capillary are sealed in a positive pressure container.
- a positive differential pressure on the order of 3 psig, is applied across the capillary, producing a flow of sample solution through the capillary.
- the outlet side of the capillary maintained at approximately ambient atmospheric pressure, is inserted into an electrospray droplet generator, preferably a TSI Model 3480 Electrospray Aerosol Generator (TSI, Incorporate
- the electrospray capillary used in this invention is shown axisymmetrically in FIG. 3 .
- the capillary body 100 has a hollow core, through which a sample solution 130 is transported. It is preferred to use a capillary 100 that has been passivated with a coating such as a methyl derivatization along the hollow core of the interior bore 110 of the capillary 100 , so that substances found in the sample solution 130 are not adsorbed as the sample solution 130 is electrosprayed, as such adhesion would tend to clog the capillary, rendering it unusable until successfully cleaned.
- a capillary derivatized with a methylating reagent replaces silanol and Si—O— groups on the interior bore 110 with methyl groups, which thereby minimizes adsorption of sample onto the capillary, and subsequent clogging.
- Stable electrosprays are obtained when the capillary 100 is about 25 cm long and a positive voltage of about 2 kV is applied to the sample 130 . This is accomplished, as shown in FIG. 1 , by placing a Pt wire 435 into the testing microcentrifuge tube 450 and in electrical contact with the sample solution 435 .
- the Pt wire 435 is connected to the positive polarity of a high voltage variable power supply 430 . It is also necessary to taper the wall of the outlet end of the capillary 120 to produce a truncated flat-tipped cone 140 with about a 90° included taper. The tapered area of the capillary thus resembles a truncated cone.
- the tapered outlet end 120 of the capillary 100 is produced by placing a capillary 100 securely into a pin-vise mounted on a 50 rpm DC motor, and subsequently grinding an approximately 45° angle from the longitudinal direction of the capillary.
- Electrospray occurs at the flat-topped tapered outlet end of the capillary 120 .
- the meniscus of the exiting sample 130 liquid takes on the characteristic shape of a Taylor cone 150 , typical of stable electrosprays, but only a sharp-tipped cone 160 can be seen during the electrospray of highly conductive liquids typically used because the droplet stream 170 that forms is comprised of droplets too tiny to scatter light and thus be microscopically observed.
- the droplet stream 170 is carried into a small chamber by a laminar flow of CO 2 and air, established according to TSI factory recommendations, where they are exposed to an alpha radiation source 480 (as previously shown in FIG. 1 ), which, as the droplet diluent evaporates, lowers the droplet net charge state to zero or one.
- the initial droplet size is typically approximately 150 nm in diameter.
- the droplets dry rapidly in the flow of CO 2 and air and desolvate forming neutral or singly charged lipoprotein particles.
- the lipoprotein particles carry the same amount of charge as did the droplets that were initially electrosprayed. In typical implementations, drying and charge reduction may take place concurrently to prevent Coulomb forces breaking apart droplets, and here lipoprotein particles.
- the resulting gas-borne particles are primarily charge neutral or carry one positive charge.
- the alpha-source charge reduction process produces a reliable, well-characterized stream of charged particles. In this case, well characterized means that, although the fraction of singly charged particles depends on particle diameter, the relationship between diameter and the fraction of the particles carrying a single charge is well established.
- the electrospray aerosol generator delivers neutral and singly-charge lipoprotein particles to the input of a differential mobility analyzer 200 where the size distribution of the particles is determined.
- Another method may be used to ensure that an entering stream of charged particles exits with particles having no more than a single positive charge.
- One of these methods include using an alternating current corona to produce secondary electrons having the same charge state reduction as an alpha radiation source.
- Ion electrical mobility analysis is a technique to determine the size of a charged particle undergoing analysis when the charged particle is exposed to an electric field. Below follows the analytical method used to determine the size of the charged particle.
- Ion electrical mobility is a physical property of an ion and is related to the velocity an ion acquires when it is subjected to an electrical field.
- Electrical mobility, Z is defined as
- a differential mobility analyzer separates the charged input lipoprotein particles according the their diameter and charge.
- a preferred differential mobility analyzer is a TSI model 3080 Electrostatic Classifier.
- FIG. 4 a cross section through the centerline of a typical axisymmetric differential mobility analyzer 200 is shown.
- the analyzer is designed and operated to transmit only singly charged positive ions of a particular size 285 through an exiting annular selection slit 290 in the instrument.
- there are several particles shown that are not at the correct selection size 285 neutral particles 295 , and charged smaller particles 260 and charged larger particles 280 .
- the differential mobility analyzer 200 is housed in a cylinder canister 275 having a hollow cylindrical area 245 with a centrally placed tube 270 .
- the centrally placed tube 270 comprises an annular selection slit 290 through which particles (e.g. 285 from the hollow cylindrical area 245 ) pass when a certain electric field exists. Particles 285 enter the annular selection slit 290 as a function of the size of the particle and the electromotive force applied to the particle.
- An electromotive force results from the application of a selection voltage applied from high voltage source 205 to centrally placed tube 270 and cylinder canister 275 .
- the gas flow 230 through the centrally placed tube 270 carries particle-laden gas flow 240 to a particle-counting device 490 (as shown in FIG. 1 ).
- FIG. 4 four different types of particles are shown for purposes of illustration.
- the four different symbols represent singly charged lipoprotein particles having three different sizes 260 , 280 , and 285 , and an uncharged particle 295 .
- a high voltage source 205 is applied between the centrally placed tube 270 and the outer cylinder 275 , the positively charged particles begin to move towards the centrally placed tube 270 at a radial velocity determined by the balance between the forces exerted by the electric field strength and the viscous resisting force due to the drag of the particle moving through the ambient medium.
- the viscous drag is related to the size of the particle, for the same electromotive force, a smaller particle, having a smaller cross sectional area, will have a smaller drag, will be most affected by the electromotive force, and will consequently have a higher mobility.
- a larger particle will have a larger cross sectional area, and will be least affected by the same electromotive force, and consequently have a lower mobility.
- FIG. 4 shows that one of the types of particle ions 285 has a mobility that deposits it into a detection slit 290 that leads the selected ions away to a detector 490 . That is, only a small distribution of particle sizes distributed about the selected particle size exits detection slit 290 at a specified high voltage 205 at a specific laminar gas velocity in the hollow cylindrical area 245 .
- Particle laden dry gas 210 introduces the particles into the differential mobility analyzer 200 , with a laminar excess gas flow 220 introduced so as to minimize turbulent eddies of any sort.
- An additional dry gas 230 is introduced at the top of the analyzer 225 , ultimately exiting the bottom of the analyzer 235 as mobility-classified particle flow 240 .
- each of the three ions will be guided to hit the slit and pass on to a detector located downstream.
- the small 260 , medium 285 , and large particles 280 may respectively represent HDL, LDL, and VLDL.
- the selectable differential mobility analyzer operates by counting the number of charged biological particle ions, dn + , in a defined sampling time, dt, at a specific selected size, s, resulting in a size count rate output of
- the selectable differential mobility analyzer can be scanned over the desired specific size range to result in an output of charged biological particle ions counted in the defined sampling time versus size. Since the relationship between particle size and density is well understood, the size count rate output above can in turn be converted to data set of the number of biological particles counted per second at a specific density,
- the biological particles are lipoproteins.
- a scanning size range of 3 nm to 120 nm is appropriate, corresponding to the size of the least and most dense lipoproteins present in human patients.
- the detector 490 used to record the mobility spectrum is a condensation particle detector, preferably a Model 3025A Condensation Particle Detector from TSI.
- the condensation particle detector draws particles such as lipoprotein particles through a supersaturated vapor condensation chamber and allows the vapor to condense onto the particles, which act as condensation nucleation sites.
- the device is sensitive at the single particle level because every lipoprotein particle nucleates condensation and gives birth to a solvent droplet. A single lipoprotein particle becomes completely covered inside each condensation droplet.
- the condensation process in effect, magnifies the size of lipoprotein particles and causes them to grow from 10's of nm in diameter to several ⁇ m in diameter.
- the ⁇ m-scale droplets efficiently scatter light into a photodetector as they pass through a laser beam.
- the resultant droplets scatter light sufficiently to allow for counting individual droplets by measuring changes in transmission or reflectance (scatter) in the laser beam or other light source. Since only a single lipoprotein particle is contained in each droplet, this then becomes a method for indirectly counting single lipoprotein particles.
- Lipoprotein particle density measurement in the near-atmospheric gas-phase by particle mobility measurement provides a new way to rapidly determine the size distribution of the lipoprotein particles.
- FIG. 2 a table is shown including the density and particle size of the major lipoprotein subfractions. Since the size and density of lipoprotein particles correlate very well, it is straightforward to calculate one in terms of the other. This correlation may be shown in a plot of measured diameters and corresponding densities, which are curve fit by a line. This is shown in FIG. 6 and discussed in Section J “Linearity Versus Density.” Thus any lipoprotein particle mobility measurement of a particular size can be related to its corresponding particle density.
- FIG. 5 A mobility spectrum of six typical lipoprotein samples obtained from human blood is presented in FIG. 5 .
- Each lipoprotein particle sample solution prepared as previously discussed, was diluted to less than 10 11 lipoprotein particles per mL with a solution of 25 milliMolar ammonium acetate. The sample was electrosprayed at a rate of 50 nL per min using a positive 1850 volts to create a well-formed, stable electrospray.
- a stable electrospray refers to a lack of visible fluctuations in the Taylor cone.
- a flow of 0.5 L per min CO 2 was combined with 1.0 L per min of dry air to carry the electrospray droplets through a charge neutralizer, through a differential mobility analyzer, and into a condensation particle detector. The resulting spectrum of lipoprotein particles is displayed in FIG. 5 , which will be more thoroughly described below.
- the sample solution comprises 25 milliMolar ammonium acetate in an aqueous solution buffered to near neutral pH.
- microcentrifuge tube 410 Between 10 and 50 ⁇ L of sample solution is introduced into small plastic vial, preferably a 1.5 mL microcentrifuge tube 410 .
- the microcentrifuge tube 410 has preferably been ultracentrifuged as previously described in an ultracentrifuge 420 , however, other methods such as immunoabsorption or lectin affinity binding can be used to remove the Lp(a) that would otherwise distort the measurement of lipoproteins.
- the testing microcentrifuge tube 450 is in turn installed in a pressurized chamber 460 on the electrospray generator. About 3 psig of positive pressure is applied to the pressurized chamber 460 , forcing the sample solution 455 to flow through the electrospray capillary 100 and out the beveled tip.
- Positive high voltage from a high voltage variable power supply 430 , is then applied to the sample 455 .
- the high voltage is then scanned from ⁇ 5,000 to ⁇ 5,100 volts.
- the Taylor cone 150 of the capillary 100 is then examined during a high voltage 430 scan to find the particular voltage at which the electrospray is stable.
- a stable electrospray is obtained when the Taylor cone 150 remains fixed in place and points directly away from the axis of the capillary 100 , with a sharp tip and a single steady stream of material being ejected.
- the microscopic image of the Taylor cone appears as a 45° equilateral triangle attached to the flat tip on the end of the tapered capillary 100 .
- dry gas 210 About 1.5 L per minute flow of dry gas 210 is used to introduce the droplet stream resulting from the Taylor cone 150 into the differential mobility analyzer 200 through connected tubing, after having been first charge reduced with alpha radiation source 480 to either a neutral or single positive charge state. 15 L per min of laminar excess gas flow 220 is added to the differential mobility analyzer 200 . Additional dry gas 230 is introduced to collect the mobility selected particles, resulting in a mobility-classified particle flow 240 of 1.5 L per min that exits the differential mobility analyzer 200 , which in turn transfers the mobility selected particles 240 to the condensation particle counter 490 . By scanning the differential mobility analyzer 200 high voltage power supply 205 , a data set of particles counted per second versus mobility may be created.
- the TSI electrospray aerosol generator has a current meter for displaying the electrospray current output by the electrospray high voltage power supply 205 .
- Stable electrosprays exhibit long term stability with currents varying less than ⁇ 1 nA from a typical total electrospray current of 300 nA during the course of an analysis.
- Typical background spectra will indicate fewer than 7 particles per mL with particle diameters between 3-4 nm.
- the software supplied with the TSI Model 3980 Gas-phase Electrophoretic-Mobility Macromolecule/nanoparticle Analysis (GEMMA) unit provides several operator defined conditions.
- the data recording software allows several choices for the number of size subdivisions recorded for each decade of particle diameter. Typically 64 size subdivisions per decade are recorded.
- the scanning range can also be selected. Typically, a scanning range of 3 nm to 100 nm is scanned for typical LDL samples; however, this range is extended to a higher limit when IDL and chylomicrons are measured, to as high as 1200 nm. Scan times are typically set to 3 min.
- the position of a peak in an ion mobility spectrum is determined with the manufacturer's software. Computer mouse movement is used to select the maximum value in a peak by observing a draggable indicator.
- Differential mobility spectroscopy of lipoproteins can additionally be used for quick determinations of coronary heart disease (CHD) risk by analyzing the resultant lipoprotein size distributions.
- CHD coronary heart disease
- FIG. 5 six individual lipoprotein size spectra ( 510 , 520 , 530 , 540 , 550 , and 560 ) are presented as the result of differential mobility analysis with mobilities converted to size as previously described.
- the traces are shifted vertically in order to differentiate the graphs, which would otherwise overlap.
- the trace is shifted vertically to zero mass on its lowest particle diameter.
- the Mass ordinate is in relatively scaled arbitrary units of grams.
- Pattern A is a designation applied to individuals at relatively low risk for CHD.
- Pattern A lipoproteins are characterized by LDL particles larger (median size of ⁇ 22.5 nm versus ⁇ 20.8 nm) than those obtained from individuals at higher risk for coronary heart disease, i.e., Pattern B individuals. Additionally, Pattern A lipoproteins are characterized by a population of HDL particles that generally shows several subtypes. These subtypes are revealed by several peaks in the HDL region (of ⁇ 7-13 nm) for Pattern A spectra. The vertical line at approximately 8.9 nm indicates the principal HDL peak for patients with Pattern A, B, and intermediate Pattern AB.
- the Pattern a spectra are easily discerned by observing a second HDL peak at approximately 11 nm.
- traces 510 , 520 and 530 are low risk Type A patterns.
- the peak in the LDL population of particles for Pattern B individuals is smaller by several nanometers than LDL particles from Pattern A individuals.
- the shift from pattern A to pattern B is represented approximately by the vertical lines drawn through the LDL peaks at approximately 20.8 nm (dashed), and 22.5 nm (solid).
- the HDL particles from Pattern B individuals, shown in traces 550 and 560 generally show less heterogeneity; here the HDL peaks for Pattern B patterns show only one sharp principal peak, as expected.
- the ion mobility measurements agree with gradient gel determinations and provide an alternative measurement method for assessing CHD.
- trace 540 represents a patient with an intermediate Type AB pattern.
- This trace 540 shows an LDL peak intermediately disposed between the typical Type A peak at 22.5 nm, and the typical Type B peak of 20.8 nm.
- the trace 540 is also distinguished by only a single HLD peak, typical of the higher risk Type B pattern.
- Ion mobility spectroscopy is quantitative and can be used to directly measure the total amount of lipoprotein particles in each of the lipoprotein classes and/or subclasses.
- the area under the curves, in a particle mass versus independent variable (such as size, density, mobility, etc.) distribution, is directly representative of the lipoprotein particle mass.
- the measurement technique relies on counting individual particles as a function of size (diameter). It is therefore possible the convert the number of particles at a specific size into a mass value using the volume and density of the particles.
- the density of lipoprotein particles is a well-known function of particle size and is obtainable from the literature.
- the mass values associated with the figure are simply scaled to indicate relative values but can be converted to actual mass of lipoproteins in plasma using dilution factors along with flow rates of sample and air passing through the ion mobility spectrometer.
- the spectra in FIG. 5 also show the existence of lipoprotein particles that fall into the VLDL size class. Their presence is indicated by small bumps in the spectra above particle diameters of about 30 nm.
- the shaded area under the plots in this figure are proportional to particle mass and this area can be used to assess the mass of particles in any chosen particle interval such as 30 to 40 nm or 35 to 40 nm or any other choice of bin size.
- FIG. 6 A further example showing how ion mobility analysis can be implemented is shown with the data in FIG. 6 .
- Lipoprotein particles were fractionated with non-equilibrium ultracentrifugation in NaCl/D 2 O. The particles were removed from the ultracentrifuge tube as liquid fractions, which spanned the range of 1.0 to 1.08 g/cm 3 . Because the ultracentrifugation step was not run until the particles reached an equilibrium flotation position in the ultracentrifuge tube the density of the lipoprotein particles removed with each fraction is only an estimate, however a reasonable estimate, of the particle's true density, and is displayed as an estimated density.
- FIG. 6 A further example showing how ion mobility analysis can be implemented is shown with the data in FIG. 6 .
- FIG. 6 is a plot of lipoprotein particle diameter as a function of the solution density of each fraction reveals the expected inverse linear relationship between particle diameter and density.
- FIG. 6 has an ordinate of particle diameters in nm as measured by ion mobility analysis, and an abscissa of estimated particle density in g/cm 3 as obtained by non-equilibrium ultracentrifugation.
- the particle diameter was measured using ion mobility analysis.
- the results indicate, that there is an inverse linear correlation between particle diameter and particle density, as expected. Data points not exactly matching the inverse linear correlation are though to be due to the non-equilibrium floatation method used to obtain the data samples.
- the linearity of the detection method was verified by analyzing a series of dilutions of a specific set of LDL particles. These LDL particles were isolated by gel filtration from the other classes of lipoprotein particles. The starting concentration of these LDL particles was determined by measuring the apolipoprotein B concentration of the solution. A single molecule of apolipoprotein B is present in each LDL particle. By using the apolipoprotein B concentration it is possible to calculate the number of LDL particles in the sample.
- This specific sample was sequentially diluted, and the number of particles in each dilution (the IMS peak height, #/cm 3 axis) was determined by differential mobility spectrometry and plotted versus the calculated apolipoprotein B concentration (the Particles, #/mL axis) at each dilution.
- One option available with the commercial software supplied with the instrument manufactured by TSI, Inc. plots the number of particles detected per cm 3 of air passing through the differential mobility analyzer. Ion mobility peak height is plotted vs. the number concentration of LDL particles as determined from apolipoprotein B measurements in FIG. 7 .
- This plot, FIG. 7 shows that the measurement is linear over more than three orders of magnitude from 10 12 to 10 14 particles per mL.
- the inset graph of FIG. 7 shows the range up to 8 ⁇ 10 12 particles per mL.
- FIG. 7 implies that variations in concentrations of lipoprotein subclasses will be accurately measured over a range of 1000:1, or 0.1%.
- FIGS. 8-23 Differential mobility analysis appears to be highly linearly independent over the variety of lipoprotein classes and subclasses. This linear independence was verified as shown in FIGS. 8-23 .
- a single human blood sample was fractionated into 16 different average densities. The method used was non-equilibrium ultracentrifugation.
- One byproduct of this type of fractionation is that there is always a distribution of densities about an average density. Since we are dealing with biological particles, there are wide ranges of sizes comprising in the fractions having a particular average densities. An attempt was made to select density fractions representing each of the lipoprotein particle subclasses.
- FIGS. 8-23 show resultant differential mobility analysis scans of 16 fractions of human lipoprotein over a range of selected average densities spanning the various human lipoprotein classes and subclasses.
- Lipoprotein particles were prepared as above from human plasma, then subjected to ultracentrifugation.
- a density gradient in an ultracentrifuge tube was prepared with NaCl dissolved in D 2 O.
- the choice of gradient composition provided a way to separate lipoprotein particles with average densities varying between about 1.000 ( FIG. 8 ) and 1.090 g/cm 3 ( FIG. 23 ) from other material in the plasma.
- gel electrophoresis gradient 8 is used to separate average densities over a range from about 1.000 ( FIG.
- the resulting liquid in the ultracentrifuge tube was distributed into 16 fractions, which were subsequently dialyzed against 25 mM ammonium acetate for 3 hours using a 10,000 molecular weight cut-off dialysis membrane.
- FIGS. 8-23 The size distribution of the lipoprotein particles in each fraction was then determined using ion mobility spectral analysis. These size distributions appear in FIGS. 8-23 , and have densities that correspond to lipoprotein classes and subclasses as indicated in VLDL I ( FIGS. 8-10 ) and II ( FIG. 11 ), IDL I ( FIG. 12 ) and II ( FIG. 13 ), and LDL I ( FIG. 14 ), IIa ( FIG. 15 ), IIb ( FIG. 16 ), IIIa ( FIG. 17 ), IVa ( FIGS. 18 and 19 ), and HDL Ia ( FIGS. 20-23 ).
- VLDL I FIGS. 8-10
- II FIG. 11
- IDL I FIG. 12
- II FIG. 13
- LDL I FIG. 14
- IIa FIG. 15
- IIb FIG. 16
- IIIa FIG. 17
- IVa FIGS. 18 and 19
- HDL Ia FIGS. 20-23
- the mass value refers to the mass of particles per m 3 at each indicated particle diameter where m 3 is referenced to the volume of lipoprotein-laden gas entering the differential mobility analyzer.
- the ⁇ g/m 3 number is corrected for the fraction of particles that are charged in any given particle size interval. This rate does not take into account either the rate at which a sample solution is electrosprayed, or the flow rate of flow gas that sweeps the particles towards the DMA.
- This mass value can be converted into the mass of lipoprotein particles present in the original sample plasma by using the information of the gas flow rate, flow rate of electrosprayed sample, particle transfer efficiency and liquid dilution factors.
- FIGS. 9-18 , 20 , 21 , and 23 indicate that for lipoprotein densities ranging from about 1.003-1.090 g/cm 3 , in this particular human sample, each density sample through ultracentrifugation results in one principal peak in the mass versus size graph.
- FIGS. 8 , 19 , and 22 there is some bimodality and broadening of the peaks. It is not presently understood what these broadened and bimodal lipoprotein distributions represent. It is possible that this bimodality could be an artifact of the sample preparation method discusses above. That is, the sample preparation technique could be disruptive enough to break apart some of the agglomerated biological particles, resulting in smaller sized fragments. If this is the case, then a modification of the sample preparation method could then resolve these samples into relatively clean single peak size spectra as well.
- the bimodality and broadening could also be an artifact resulting from the nonequilibrium ultracentrifugation used to generate the subfractions in this particular experiment. This issue will be resolved by further experiment.
- an entire plasma sample could be mathematically represented by the linear superposition of each lipoprotein subclass. Even if, ultimately, the multiple peak phenomenon remains, then traditional numerical methods of data correlation such as least squares or singular value decomposition could be used to determine the amount of each lipoprotein subclass in an entire sample. Thus, in a single differential mobility spectral scan, the quantity of each lipoprotein subclass a plasma sample could be determined. After making this determination, both the quantity and type of each lipoprotein would be known. By statistically correlating the resulting subclass information with population mortality and risk factors, a more accurate assessment of coronary heart disease risk would result. In particular, the known characteristics of a bimodal vs. unimodal HDL distribution, and the peak lipoprotein diameter of the LDL distribution, could be readily transformed into a risk factor ranging from 100% Type A pattern (low risk) to 100% Type B pattern (high risk).
Abstract
Description
the LDL cholesterol concentration (LDLC) is calculated by the formula: LDLC=TC−(HDLC+VLDLC). While generally useful, the Friedewald method is limited in its accuracy in specific cases. Errors can occur in any of the three steps, in part because this method requires that different procedures be used in each step. The Friedewald method is to a degree indirect, as it presumes that VLDLC concentration is one-fifth that of plasma triglycerides. When the VLDL of some patients deviates from this ratio, further inaccuracies occur. Ultracentrifugation must be employed for separation and subsequent determination of LDL cholesterol for some samples, since the Friedewald method cannot be used for patients with TG over 400 mg/dL.
or density,
of ionized biological particles sprayed into a fluid (such as air), 3) a DMA device for measuring the number of biological particles in each size class and subclass, 4) an algorithm for predicting the risk of coronary heart disease (CHD) using the biological particle (preferably lipoprotein) size or density distribution information compared to reference data for low risk, intermediate risk, and high risk patients, and 5) a particular method for determining whether a sample corresponds to a Type A, AB, or B pattern, which respectively has an associated low risk, an intermediate risk, and a high risk for CHD. Blood plasma samples are processed to separate all classes and subclasses of lipoprotein particles from bulk blood serum using steps designed ultimately for transferring the particles into the gas phase for subsequent mobility analysis. The technique preserves lipoprotein particle composition and size, and introduces no contamination into the lipoprotein particles. The electrospray process initially produces electrospray droplets with many different charge states. These multiply-charged droplets are passed in close proximity to an alpha radiation source, which produces alpha particles, or free secondary electrons, that reduces the charge state of the electrospray droplets to either neutral or single positive charges. The charged droplets may alternatively be treated in other ways to achieve a uniform charge state of no more than a single positive charge.
0.86*gel diameter=ion mobility diameter
where V=terminal velocity and E=electrical field causing particle motion. Furthermore, particle diameter can be obtained from
where n=number of charges on the particle (in this case a single charge), e=1.6×10⁻¹⁹ coulombs/charge, Cc=particle size dependent slip correction factor, η=gas viscosity, and d=particle diameter. Solving for d, we obtain
versus density, ρ.
Claims (20)
Priority Applications (3)
| Application Number | Priority Date | Filing Date | Title |
|---|---|---|---|
| US11/771,862 US7713744B2 (en) | 2001-11-13 | 2007-06-29 | Determining the risk of cardiovascular disease using ion mobility of lipoproteins |
| US12/775,225 US7851224B2 (en) | 2001-11-13 | 2010-05-06 | Method of assessing a lipid-related health risk based on ion mobility analysis of lipoproteins |
| US12/966,739 US8097462B2 (en) | 2001-11-13 | 2010-12-13 | Aerosol preparation of intact lipoproteins |
Applications Claiming Priority (3)
| Application Number | Priority Date | Filing Date | Title |
|---|---|---|---|
| US33821401P | 2001-11-13 | 2001-11-13 | |
| US10/293,610 US7259018B2 (en) | 2001-11-13 | 2002-11-12 | Ion mobility analysis of lipoproteins |
| US11/771,862 US7713744B2 (en) | 2001-11-13 | 2007-06-29 | Determining the risk of cardiovascular disease using ion mobility of lipoproteins |
Related Parent Applications (1)
| Application Number | Title | Priority Date | Filing Date |
|---|---|---|---|
| US10/293,610 Division US7259018B2 (en) | 2001-11-13 | 2002-11-12 | Ion mobility analysis of lipoproteins |
Related Child Applications (1)
| Application Number | Title | Priority Date | Filing Date |
|---|---|---|---|
| US12/775,225 Division US7851224B2 (en) | 2001-11-13 | 2010-05-06 | Method of assessing a lipid-related health risk based on ion mobility analysis of lipoproteins |
Publications (2)
| Publication Number | Publication Date |
|---|---|
| US20070287187A1 US20070287187A1 (en) | 2007-12-13 |
| US7713744B2 true US7713744B2 (en) | 2010-05-11 |
Family
ID=23323894
Family Applications (4)
| Application Number | Title | Priority Date | Filing Date |
|---|---|---|---|
| US10/293,610 Active 2024-07-10 US7259018B2 (en) | 2001-11-13 | 2002-11-12 | Ion mobility analysis of lipoproteins |
| US11/771,862 Expired - Lifetime US7713744B2 (en) | 2001-11-13 | 2007-06-29 | Determining the risk of cardiovascular disease using ion mobility of lipoproteins |
| US12/775,225 Expired - Lifetime US7851224B2 (en) | 2001-11-13 | 2010-05-06 | Method of assessing a lipid-related health risk based on ion mobility analysis of lipoproteins |
| US12/966,739 Expired - Lifetime US8097462B2 (en) | 2001-11-13 | 2010-12-13 | Aerosol preparation of intact lipoproteins |
Family Applications Before (1)
| Application Number | Title | Priority Date | Filing Date |
|---|---|---|---|
| US10/293,610 Active 2024-07-10 US7259018B2 (en) | 2001-11-13 | 2002-11-12 | Ion mobility analysis of lipoproteins |
Family Applications After (2)
| Application Number | Title | Priority Date | Filing Date |
|---|---|---|---|
| US12/775,225 Expired - Lifetime US7851224B2 (en) | 2001-11-13 | 2010-05-06 | Method of assessing a lipid-related health risk based on ion mobility analysis of lipoproteins |
| US12/966,739 Expired - Lifetime US8097462B2 (en) | 2001-11-13 | 2010-12-13 | Aerosol preparation of intact lipoproteins |
Country Status (7)
| Country | Link |
|---|---|
| US (4) | US7259018B2 (en) |
| EP (1) | EP1444526B1 (en) |
| JP (1) | JP4705754B2 (en) |
| AT (1) | ATE525635T1 (en) |
| AU (2) | AU2002352712B2 (en) |
| CA (1) | CA2467420A1 (en) |
| WO (1) | WO2003042704A1 (en) |
Cited By (6)
| Publication number | Priority date | Publication date | Assignee | Title |
|---|---|---|---|---|
| US20100100334A1 (en) * | 2008-10-20 | 2010-04-22 | Otvos James D | Lipoprotein insulin resistance indexes and related methods, systems and computer programs for generating same |
| US20140260702A1 (en) * | 2013-03-14 | 2014-09-18 | Cardio Metrix | Apparatuses, Processes, and Systems for Measuring Particle Size Distribution and Concentration |
| US20150126473A1 (en) * | 2011-06-16 | 2015-05-07 | Children's Hospital & Research Center At Oakland | Ultra-Small ApoB-Containing Particles and Methods of Use Thereof |
| US9551768B2 (en) | 2013-03-15 | 2017-01-24 | East Carolina University | NMR method for monitoring changes in the core of lipoprotein particles in metabolism and disease |
| US9638705B2 (en) | 2010-11-01 | 2017-05-02 | Quest Diagnostics Investments Incorporated | Prognostic assays for maintenance hemodialysis patients |
| US10775458B2 (en) | 2018-03-05 | 2020-09-15 | Texas Tech University System | Method and system for non-invasive measurement of metabolic health |
Families Citing this family (40)
| Publication number | Priority date | Publication date | Assignee | Title |
|---|---|---|---|---|
| ES2206019B1 (en) * | 2002-04-11 | 2005-07-16 | Consejo Sup. Investig. Cientificas | PROCEDURE FOR IMPROVING THE RESOLUTION OF THE ELECTRICAL MOBILITY DIFFERENTIAL ANALYZER THROUGH THE EXCHANGE OF INPUT FLOWS. |
| US7416895B2 (en) * | 2002-06-21 | 2008-08-26 | Berkeley Heartlab, Inc. | Method for identifying at risk cardiovascular disease patients |
| US20040043496A1 (en) * | 2002-06-21 | 2004-03-04 | Berkeley Heartlab, Inc. | Method for identifying patients who will require multiple invasive cardiovascular procedures |
| CA2521099A1 (en) * | 2003-04-09 | 2004-10-28 | Brigham Young University | Cross-flow ion mobility analyzer |
| WO2004114347A2 (en) * | 2003-06-20 | 2004-12-29 | Brigham Young University | Single device for ion mobility and ion trap mass spectrometry |
| JP3819895B2 (en) * | 2003-10-29 | 2006-09-13 | 大塚電子株式会社 | Atherosclerosis evaluation device |
| US20050109856A1 (en) * | 2003-11-25 | 2005-05-26 | Alexander James N.Iv | Method for preparing polymer electrosprays |
| WO2005052546A2 (en) * | 2003-11-25 | 2005-06-09 | Sionex Corporation | Mobility bases apparatus and methods using dispersion characteristics to improve analysis of a sample |
| EP1564780A3 (en) * | 2003-12-08 | 2006-05-31 | Rohm And Haas Company | Apparatus for determining molecular weight of polymers |
| US20050164398A1 (en) * | 2004-01-26 | 2005-07-28 | Alexander James N.Iv | Method for determining molecular weight of polymers |
| KR100567788B1 (en) * | 2004-02-13 | 2006-04-05 | 주식회사 현대교정인증기술원 | Apparatus for Measuring Numbers of Particles and Method Thereof |
| US8884221B2 (en) * | 2006-01-05 | 2014-11-11 | Excellims Corporation | High performance ion mobility spectrometer apparatus and methods |
| US8247235B2 (en) | 2007-06-08 | 2012-08-21 | Quest Diagnostics Investments Incorporated | Lipoprotein analysis by differential charged-particle mobility |
| US20080302666A1 (en) * | 2007-06-08 | 2008-12-11 | Benner W Henry | Apparatus for differential charged-particle mobility |
| CN104198690B (en) * | 2007-06-08 | 2016-09-07 | 奎斯特诊断投资公司 | Lipoprotein analysis is carried out by differential charged-particle mobility |
| US20090078064A1 (en) * | 2007-08-06 | 2009-03-26 | Abraham Oommen | Instrument for simultaneous analysis of multiple samples using multiple differential mobility analyzers |
| KR101711663B1 (en) * | 2008-03-07 | 2017-03-13 | 더 유니버시티 오브 브리티시 콜롬비아 | Self-contained capillary electrophoresis system for interfacing with mass spectrometry |
| US9354200B1 (en) | 2008-08-07 | 2016-05-31 | Quest Diagnostics Investments Incorporated | Detection apparatus for differential-charged particle mobility analyzer |
| WO2010136633A1 (en) * | 2009-05-26 | 2010-12-02 | Tampereen Teknillinen Yliopisto | Method and apparatus for generating test aerosol |
| US20100323376A1 (en) * | 2009-06-17 | 2010-12-23 | Maine Standards Company, Llc | Method for Measuring Lipoprotein-Specific Apolipoproteins |
| US9250211B2 (en) | 2010-12-30 | 2016-02-02 | Quest Diagnostics Investments Incorporated | Magnetic separation of lipoproteins using dextran sulfate |
| US9239279B1 (en) * | 2011-06-03 | 2016-01-19 | Arkansas State University—Jonesboro | Sequential differential mobility analyzer and method of using same |
| US9239280B2 (en) * | 2012-06-16 | 2016-01-19 | Atherotech, Inc. | Measurement of serum lipoproteins |
| WO2013188879A1 (en) * | 2012-06-16 | 2013-12-19 | Atherotech, Inc. | Measurement of serum lipoproteins |
| WO2014168043A1 (en) * | 2013-04-09 | 2014-10-16 | 東京エレクトロン株式会社 | Measuring device and measuring method |
| TWI549745B (en) | 2014-05-16 | 2016-09-21 | 財團法人工業技術研究院 | Apparatus and method for mixing solution and monitoring particles in solution |
| WO2016040859A1 (en) | 2014-09-11 | 2016-03-17 | Liposcience Inc. | Cardiovascular risk evaluations using a risk parameter that includes an hdl and inflammatory biomarker interaction parameter |
| KR102222931B1 (en) * | 2016-04-01 | 2021-03-04 | 티에스아이 인코포레이티드 | Reducing false counts in condensation particle counters |
| US11668719B2 (en) * | 2017-09-20 | 2023-06-06 | The Trustees Of Indiana University | Methods for resolving lipoproteins with mass spectrometry |
| WO2019140233A1 (en) | 2018-01-12 | 2019-07-18 | The Trustees Of Indiana University | Electrostatic linear ion trap design for charge detection mass spectrometry |
| JP7398810B2 (en) | 2018-06-04 | 2023-12-15 | ザ・トラスティーズ・オブ・インディアナ・ユニバーシティー | Apparatus and method for capturing ions in an electrostatic linear ion trap |
| WO2019236143A1 (en) | 2018-06-04 | 2019-12-12 | The Trustees Of Indiana University | Apparatus and method for calibrating or resetting a charge detector |
| WO2019236139A1 (en) | 2018-06-04 | 2019-12-12 | The Trustees Of Indiana University | Interface for transporting ions from an atmospheric pressure environment to a low pressure environment |
| KR20210035103A (en) | 2018-06-04 | 2021-03-31 | 더 트러스티즈 오브 인디애나 유니버시티 | Charge detection mass spectrometry through real-time analysis and signal optimization |
| WO2020106310A1 (en) | 2018-11-20 | 2020-05-28 | The Trustees Of Indiana University | Orbitrap for single particle mass spectrometry |
| AU2019392058A1 (en) | 2018-12-03 | 2021-05-27 | The Trustees Of Indiana University | Apparatus and method for simultaneously analyzing multiple ions with an electrostatic linear ion trap |
| WO2020219527A1 (en) | 2019-04-23 | 2020-10-29 | The Trustees Of Indiana University | Identification of sample subspecies based on particle charge behavior under structural change-inducing sample conditions |
| WO2021191266A1 (en) * | 2020-03-25 | 2021-09-30 | INSERM (Institut National de la Santé et de la Recherche Médicale) | Aerosolization of hdl for the treatment of lung infections |
| CN112798481B (en) * | 2020-10-27 | 2022-02-18 | 美康生物科技股份有限公司 | Reagent for detecting concentration of lipoprotein particles and using method thereof |
| CN115773977B (en) * | 2022-12-01 | 2023-07-18 | 中国计量科学研究院 | Protein quantification method based on ES-DMA-CPC particle count |
Citations (18)
| Publication number | Priority date | Publication date | Assignee | Title |
|---|---|---|---|---|
| US4933844A (en) | 1988-09-26 | 1990-06-12 | Otvos James D | Measurement of blood lipoprotein constituents by analysis of data acquired from an NMR spectrometer |
| US5076097A (en) | 1990-06-28 | 1991-12-31 | Tsi Incorporated | Method and apparatus for determining concentration of macromolecules and colloids in a liquid sample |
| EP0546916A1 (en) | 1991-12-11 | 1993-06-16 | Sebia | Method for the separation of lp(a) by electrophoresis, gels for the implementation of this method and its application to the in vitro determination of atherogenic risk linked to the presence of lp(a) |
| US5247842A (en) | 1991-09-30 | 1993-09-28 | Tsi Incorporated | Electrospray apparatus for producing uniform submicrometer droplets |
| US5343389A (en) | 1991-07-30 | 1994-08-30 | North Carolina State University | Method and apparatus for measuring classes and subclasses of lipoproteins |
| US5788166A (en) | 1996-08-27 | 1998-08-04 | Cornell Research Foundation, Inc. | Electrospray ionization source and method of using the same |
| US5856196A (en) | 1993-10-25 | 1999-01-05 | Beth Israel Hospital | Processes for quantitating phosphoglycerides in a lipid mixture and diagnostic uses therefor |
| WO1999017096A1 (en) | 1997-10-01 | 1999-04-08 | The United States Of America, As Represented By The Secretary Of The Army | System and method for detection, identification and monitoring of submicron-sized particles |
| US5925229A (en) | 1996-05-03 | 1999-07-20 | The Regents Of The University Of California | Low density lipoprotein fraction assay for cardiac disease risk |
| JP2000214150A (en) | 1999-01-26 | 2000-08-04 | Tosoh Corp | Analyzer for lipoprotein |
| WO2000051054A1 (en) | 1999-02-26 | 2000-08-31 | Lipomed, Inc. | Methods, systems, and computer program products for analyzing and presenting risk assessment results based on nmr lipoprotein analysis of blood |
| EP1045247A2 (en) | 1999-04-14 | 2000-10-18 | Helena Laboratories Co., Ltd. | A method for separating and assaying lipoprotein, an assembly for performing such a method, and a system including such an assembly |
| WO2000065366A1 (en) | 1999-04-22 | 2000-11-02 | Lipomed, Inc. | Nmr-method for determining the risk of developing type 2 diabetes |
| US6145391A (en) | 1998-03-04 | 2000-11-14 | Regents Of The University Of Minnesota | Charged particle neutralizing apparatus and method of neutralizing charged particles |
| US6248545B1 (en) | 1993-10-22 | 2001-06-19 | Daiichi Pure Chemicals Co., Ltd. | Assay of denatured lipoproteins |
| US6267579B1 (en) | 1998-12-23 | 2001-07-31 | Clinical Laboratory Development Group, Inc. | Apparatus for making a gradient gel |
| US6485686B1 (en) | 1999-09-17 | 2002-11-26 | The United States Of America As Represented By The Secretary Of The Army | Method and apparatus for counting submicron sized particles |
| US6491872B1 (en) | 1999-09-17 | 2002-12-10 | The United States Of America As Represented By The Secretary Of The Army | Method and system for detecting and recording submicron sized particles |
Family Cites Families (1)
| Publication number | Priority date | Publication date | Assignee | Title |
|---|---|---|---|---|
| WO2000017908A2 (en) * | 1998-09-23 | 2000-03-30 | Wisconsin Alumni Research Foundation | Charge reduction in electrospray mass spectrometry |
-
2002
- 2002-11-12 WO PCT/US2002/036645 patent/WO2003042704A1/en active Application Filing
- 2002-11-12 EP EP02789660A patent/EP1444526B1/en not_active Expired - Lifetime
- 2002-11-12 US US10/293,610 patent/US7259018B2/en active Active
- 2002-11-12 CA CA002467420A patent/CA2467420A1/en not_active Abandoned
- 2002-11-12 JP JP2003544486A patent/JP4705754B2/en not_active Expired - Fee Related
- 2002-11-12 AU AU2002352712A patent/AU2002352712B2/en not_active Ceased
- 2002-11-12 AT AT02789660T patent/ATE525635T1/en not_active IP Right Cessation
-
2007
- 2007-06-29 US US11/771,862 patent/US7713744B2/en not_active Expired - Lifetime
-
2009
- 2009-01-20 AU AU2009200225A patent/AU2009200225A1/en not_active Abandoned
-
2010
- 2010-05-06 US US12/775,225 patent/US7851224B2/en not_active Expired - Lifetime
- 2010-12-13 US US12/966,739 patent/US8097462B2/en not_active Expired - Lifetime
Patent Citations (18)
| Publication number | Priority date | Publication date | Assignee | Title |
|---|---|---|---|---|
| US4933844A (en) | 1988-09-26 | 1990-06-12 | Otvos James D | Measurement of blood lipoprotein constituents by analysis of data acquired from an NMR spectrometer |
| US5076097A (en) | 1990-06-28 | 1991-12-31 | Tsi Incorporated | Method and apparatus for determining concentration of macromolecules and colloids in a liquid sample |
| US5343389A (en) | 1991-07-30 | 1994-08-30 | North Carolina State University | Method and apparatus for measuring classes and subclasses of lipoproteins |
| US5247842A (en) | 1991-09-30 | 1993-09-28 | Tsi Incorporated | Electrospray apparatus for producing uniform submicrometer droplets |
| EP0546916A1 (en) | 1991-12-11 | 1993-06-16 | Sebia | Method for the separation of lp(a) by electrophoresis, gels for the implementation of this method and its application to the in vitro determination of atherogenic risk linked to the presence of lp(a) |
| US6248545B1 (en) | 1993-10-22 | 2001-06-19 | Daiichi Pure Chemicals Co., Ltd. | Assay of denatured lipoproteins |
| US5856196A (en) | 1993-10-25 | 1999-01-05 | Beth Israel Hospital | Processes for quantitating phosphoglycerides in a lipid mixture and diagnostic uses therefor |
| US5925229A (en) | 1996-05-03 | 1999-07-20 | The Regents Of The University Of California | Low density lipoprotein fraction assay for cardiac disease risk |
| US5788166A (en) | 1996-08-27 | 1998-08-04 | Cornell Research Foundation, Inc. | Electrospray ionization source and method of using the same |
| WO1999017096A1 (en) | 1997-10-01 | 1999-04-08 | The United States Of America, As Represented By The Secretary Of The Army | System and method for detection, identification and monitoring of submicron-sized particles |
| US6145391A (en) | 1998-03-04 | 2000-11-14 | Regents Of The University Of Minnesota | Charged particle neutralizing apparatus and method of neutralizing charged particles |
| US6267579B1 (en) | 1998-12-23 | 2001-07-31 | Clinical Laboratory Development Group, Inc. | Apparatus for making a gradient gel |
| JP2000214150A (en) | 1999-01-26 | 2000-08-04 | Tosoh Corp | Analyzer for lipoprotein |
| WO2000051054A1 (en) | 1999-02-26 | 2000-08-31 | Lipomed, Inc. | Methods, systems, and computer program products for analyzing and presenting risk assessment results based on nmr lipoprotein analysis of blood |
| EP1045247A2 (en) | 1999-04-14 | 2000-10-18 | Helena Laboratories Co., Ltd. | A method for separating and assaying lipoprotein, an assembly for performing such a method, and a system including such an assembly |
| WO2000065366A1 (en) | 1999-04-22 | 2000-11-02 | Lipomed, Inc. | Nmr-method for determining the risk of developing type 2 diabetes |
| US6485686B1 (en) | 1999-09-17 | 2002-11-26 | The United States Of America As Represented By The Secretary Of The Army | Method and apparatus for counting submicron sized particles |
| US6491872B1 (en) | 1999-09-17 | 2002-12-10 | The United States Of America As Represented By The Secretary Of The Army | Method and system for detecting and recording submicron sized particles |
Non-Patent Citations (69)
| Title |
|---|
| Atherotech, Inc., Test Benefits-VAP/CAD Lipoprotein Risk Assessment Test, http://home.socal.rr.com/asylem/test-ben.htm, Artherotech, Inc., USA, p. 1-3, 2001. |
| Atherotech, Inc., Test Benefits—VAP/CAD Lipoprotein Risk Assessment Test, http://home.socal.rr.com/asylem/test—ben.htm, Artherotech, Inc., USA, p. 1-3, 2001. |
| Bacher, G. et al., Charge-reduced nano electrospray ionization combined with differential mobility analysis of peptides, proteins, glycoproteins, noncovalent protein complexes and viruses, Journal of Mass Spectrometry, vol. 36 (No. 9), p. 1038-1052, Sep. 2001. |
| Barbagallo, C.M. et al., Influence of ApoE content on receptor binding of large buoyant LDL in subjects with different DLD subclass phenotypes, J. Amer. Heart Association, p. 466-472, 1998. |
| Bell et al., [LJ.09] The dynamics of a steady Taylor cone electrospray, BAPSDFD98 Abstracts-Session LJ-Surface Tension Effects I., APS, USA, Aug. 1, 1998. |
| Bell et al., [LJ.09] The dynamics of a steady Taylor cone electrospray, BAPSDFD98 Abstracts—Session LJ—Surface Tension Effects I., APS, USA, Aug. 1, 1998. |
| Bell et al., [LJ.09] The dynamics of a steady Taylor cone electrospray, BAPSDFD98 Abstracts-Session LJ-Surface Tension Effects I., APS, USA, Aug. 20, 2001. |
| Bell et al., [LJ.09] The dynamics of a steady Taylor cone electrospray, BAPSDFD98 Abstracts—Session LJ—Surface Tension Effects I., APS, USA, Aug. 20, 2001. |
| Bell et al., [LJ.09] The dynamics of a steady Taylor cone electrospray, BAPSDFD98-Abstracts, American Physical Society, USA, Aug. 1, 1998. |
| Bell et al., [LJ.09] The dynamics of a steady Taylor cone electrospray, BAPSDFD98—Abstracts, American Physical Society, USA, Aug. 1, 1998. |
| Benner et al. Investigating Intact Viruses with Charge-Detection MS and Ion Mobility, Proc. 49th ASMS Conf. on Mass Spectrometry and Allied Topics, ASMS, Chicago IL, May 27, 2001. |
| Berneis, K. et al., Analysis and quantitation of biotinylated apoB-containing lipoproteins with streptavidin-Cy3, J. Lipid Res., vol. 43, p. 1155-1159, 2002. |
| Berneis, K. et al., Metabolic origins and clinical significance of LDL heterogeneity, J. Lipid Res., vol. 43, p. 1363-1379, 2002. |
| Bundy et al., A novel Method for the Analysis of Complex Biological Protein Mixtures Using Electrospray Ionization Mass Spectrometry Combined with Ion/Ion Chemistry, Proc. 49th ASMS Conf. on Mass Spectrometry and Allied Topics, ASMS, Chicago IL, May 27, 2001. |
| Campos et al., Predominance of large LDL and reduced HDL2 cholesterol in normolipidemic men with coronary artery disease, Arteriosclerosis, Thrombosis & Vascular Biology, vol. 15 (No. 8), p. 1043-1048, Aug. 1995. |
| Dreon et al., LDL subclass patterns and lipoprotein response to a low-fat, high-carbohydrate diet in women, Arteriosclerosis, Thrombosis & Vascular Biology, vol. 17 (No. 4), p. 707-714, Apr. 1997. |
| Dreon, D.M. et al., A very low-fat diet is not associated with improved lipoprotein profiles in men with a predominance of large, low-density lipoproteins, Am. J. Clin. Nutr., vol. 69, p. 411-418, 1999. |
| Dreon, D.M. et al., Change in dietary saturated fat intake is correlated with change in mass of large low-density-lipoprotein particules in men, Am. J. Clin. Nutr., vol. 67, p. 828-836, 1998. |
| Dreon, D.M. et al., Diet-gene interactions in human lipoprotein metabolism, J. Amer. College of Nutrition, vol. 16 (No. 4), p. 313-324, 1997. |
| Dreon, D.M. et al., Low-density lipoprotein subclass patterns and lipoprotein response to a reduced-fat diet in men, FASEB Journal, vol. 8 (No. 1), p. 121-126, Jan. 1994. |
| Dreon, D.M. et al., Reduced LDL particle size in children consuming a very-low-fat diet is related to parental LDL-subclass patterns, Am. J. Clin. Nutr., vol. 71, p. 1611-1616, 2000. |
| Edmonds et al., Capillary Electrophoresis-Electrospray Ionization-Mass Spectrometry, J. Chromatogr., PNL, USA, p. 21-37, 1989. |
| Feingold, K.R. et al., The hypertriglyceridemia of acquired immunodeficiency syndrome is associated with an increased prevalence of low density lipoprotein subclass pattern B, Journal of Clinical Endocrinology & Metabolism, vol. 76 (No. 6), p. 1423-1427, Jun. 1993. |
| Gardner et al., Association of small low-density lipoprotein particles with the incidence of coronary artery disease in men and women, Comment in: JAMA, vol. 276 (No. 11), p. 875-881, Sep. 18, 1996. |
| Gray, R.S. et al., Relation of LDL size to the insulin resistance syndrome and coronary heart disease in American Indians, Arteriosclerosis, Thrombosis & Vascular Biology, vol. 17 (No. 11), p. 2713-2720, Nov. 1997. |
| Haskell, W.L. et al., Effects of intensive multiple risk factor reduction on coronary atherosclerosis and clinical cardiac events in men and women with coronary artery disease. The Stanford Coronary Risk Intervention Project (SCRIP), Circulation, vol. 89 (No. 3), p. 975-990, Mar. 1994. |
| Havel, R.J. et al., Genetic underpinnings of LDL size and density: a role for hepatic lipase?, Am. J. Clin. Nutr., vol. 71, p. 1390-1391, 2000. |
| Henderson et al., Intrinsic Size Parameters for Val, Ile, Leu, Gin, Thr, Phe, and Trp Residues from Ion Mobility Measurements of Polyamino Acid Ions, J. Phys. Chem. B, vol. 103, p. 8780-8785, 1999. |
| Hodis et al., Intermediate-density lipoproteins and progression of carotid arterial wall intima-media thickness, Circulation, vol. 95 (No. 8), p. 2022-2026, Apr. 15, 1997. |
| Japanese Office Action (including English translation) from Japanese Patent Application No. 2003-544486 dated Nov. 17, 2009. |
| Jeyarajah et al., Radio signals give new spectrum for cholesterol lipoprotein readings, American Heart Association Journal Report-News Release, American Heart Association, USA, p. 1-3, Jul. 9, 1998. |
| Jeyarajah et al., Radio signals give new spectrum for cholesterol lipoprotein readings, American Heart Association Journal Report—News Release, American Heart Association, USA, p. 1-3, Jul. 9, 1998. |
| Katzel, L.I. et al., Persistence of low HDL-C levels after weight reduction in older men with small LDL particles, Arteriosclerosis, Thrombosis & Vascular Biology, vol. 15 (No. 3), p. 299-305, Mar. 1995. |
| Krauss et al., Detection and quantitation of LDL subfractions, Current Opinion in Lipidology, Current Science Ltd., vol. 3, p. 377-383, 1992. |
| Krauss et al., Low-density-lipoprotein subclasses and response to a low-fat diet in healthy men, American Journal of Clinical Nutrition, vol. 62 (No. 2), p. 478S-487S, Aug. 1995. |
| Krauss, R.M. et al., Atherogenic lipoprotein phenotype and diet-gene interactions, American Society for Nutritional Science Symposium: Nutritional and Metabolic Diversity: Understanding the Basis of Biologic Variance in the Obesity/Diabetes/Cardiovascular Disease Connection, p, 340S-343S, 2001. |
| Krauss, R.M. et al., Lipoprotein subclasses in genetic studies: the Berkeley data set, Genetic Epidemiology, vol. 10 (No. 6), p. 523-528, 1993. |
| Krauss, R.M., Dietary and genetic effects on low-density lipoprotein heterogeneity, Annu. Rev. Nutr. vol. 21, p. 283-295, 2001. |
| Krauss, R.M., Is the size of low-density lipoprotein particles related to the risk of coronary heart disease?, JAMA, vol. 287, (No. 6), Letters, p. 712-713, Feb. 13, 2002. |
| Krauss, Ronald M., Triglyceride-Rich Lipoproteins, LDL Particle Size, and Atherogenesis, American Assoc. of Clinical Endocrinologists Ninth Annual Meeting and Clinical Congress, Amer. Assoc. Cinical Endocrinologists, May 3, 2000. |
| Legro, R.S. et al., Alterations in low-density lipoprotein and high-density lipoprotein subclasses among Hispanic women with polycystic ovary syndrome: influence of insulin and genetic factors, Fertility and Sterility, vol, 72 (No. 6), p. 990-995, Dec. 1999. |
| Mack et al., Lipoprotein subclasses in the Monitored Atherosclerosis Regression Study (MARS). Treatment effects and relation to coronary angiographic progression, Arteriosclerosis, Thrombosis & Vascular Biology, vol. 16 (No. 5), p. 697-704, 1996. |
| Muniz et al., A New Tool for the Automated Analysis of LDL Subfraction Patterns Generated by the Lipoprint LDL System, www.4qc.com, Quantimetrix Corporation, USA, p. 1-11, 2001. |
| New Objective, Inc., Bring Electrospray Into Focus, LC-MS Nano-ESI Proteomics, New Objective, Inc. (www.newobjective.com), USA, 2001. |
| New Objective, Inc., Product Catalog: Fused Silica Pico Tips, Products (www.newobjective.com), New Objective, Inc., USA, 2001. |
| New Objective, Inc., What is Electrospray?, Products (www.newobjective.com), New Objective, Inc., USA, 2001. |
| New Objective, Inc., What New Objective Can Do for You, www.newobjective.com, New Objective, Inc., Cambridge, MA. |
| Quantimetrix Corporation, Lipoprint System for LDL Subfraction Literature, Lipoprint Literature (www.4qc.com), Quantimetrix Corporation, USA, p. 1-2, 2001. |
| Quantimetrix Corporation, Lipoprint System for LDL Subfraction, Lipoprint Technical-What's New (www.4qc.com), Quantimetrix Corporation, USA, p. 1, 2001. |
| Quantimetrix Corporation, Lipoprint System for LDL Subfraction, Lipoprint Technical—What's New (www.4qc.com), Quantimetrix Corporation, USA, p. 1, 2001. |
| Stampfer et al., A prospective study of triglyceride level, low-density lipoprotein particle diameter, and risk of myocardial infarction, Comment in: JAMA, vol. 276 (No. 11), p. 882-888, Sep. 18, 1996. |
| Superko, H.R. et al., Association of lipoprotein subclass distribution with use of selective and non-selective beta-blocker medications in patients with coronary heart disease, Atherosclerosis, vol. 101 (No. 1), p. 1-8, Jun. 1993. |
| Superko, H.R. et al., Effect of Fluvastatin on Low-density lipoprotein peak particle diameter, Amer. J. of Cardiology, vol. 80, p. 78-81, Jul. 1, 1997. |
| Superko, H.R. et al., Garlic powder, effect on plasma lipids, postprandial lipemia, low-density lipoprotein particle size, high-density lipoprotein subclass distribution and lipoprotein(a), J. Am. College of Cardiology, vol. 35 (No. 2), p. 321-326, 2000. |
| Takahata, Keiji. "Measurement and Generation of Nanometer-Sized Particles and its Application to the Establishment of Particle Size Standards" Measurement Research Report, Jan. 2001, vol. 50, No. 1, p. 127-p139 (English Translation of item "4.3 Protein" on p. 136 provided). |
| Tribble, D.L. et al., Enhanced oxidative susceptibility and reduced antioxidant content of metabolic precursors of small, dense low-density lipoproteins, Amer. J. of Medicine, vol. 110, p. 103-110, 2001. |
| TSI Incorporated, Correlation of EM Diameter with Molecular Weight, GEMMA Example- EM Diameter vs. Molecular Weight (www.tsi.com), TSI Incorporated, Particle Instrumentation Division, USA, 1999. |
| TSI Incorporated, GEMMA Method for Macromolecule/Nanoparticle Analysis, GEMMA Method Product Page (www.tsi.com), TSI Incorporated, Particle Instrument Division, USA, 1999. |
| TSI Incorporated, Model 3080-Series Electrostatic Clasifiers, TSI Product Info. Sheets (www. tsi.com), TSI Incorporated, USA, 1999. |
| TSI Incorporated, Model 3312 Ultraviolet Aerodynamic Particle Sizer Spectrometer, Preliminary Product Information (www. tsi.com), TSI Incorporated, USA, 1997. |
| TSI Incorporated, Model 3480 Electrospray Aerosol Generator, 3480 Advance Product Information (www. tsi.com), TSI Incorporated, Particle Instrument Division, USA, 1999. |
| TSI Incorporated, Model 3980 GEMMA Macromolecule Analyzer, TSI Advance Product Information (www. tsi.com), TSI Incorporated, USA, 2000. |
| TSI Incorporated, Protein Mixture, GEMMA Example-Protein Mixture (www. tsi.com), TSI Incorporated, Particle Instrument Division, USA, 1999. |
| TSI Incorporated, Protein Mixture, GEMMA Example—Protein Mixture (www. tsi.com), TSI Incorporated, Particle Instrument Division, USA, 1999. |
| Williams et al., Effects of dietary fat on high-density-lipoprotein subclasses are influenced by both apolipoprotein E isoforms and low-density-lipoprotein subclass patterns, American Journal of Clinical Nutrition, vol. 61 (No. 6), p. 1234-1240, Jun. 1995. |
| Williams et al., Variability of plasma HDL subclass concentrations in men and women over time, Arteriosclerosis, Thrombosis & Vascular Biology, vol. 17 (No. 4), p. 702-706, Apr. 1997. |
| Williams, P.T. et al., Associations of age, adiposity, alcohol intake, menstrual status, and estrogen therapy with high-density lipoprotein subclasses, Arteriosclerosis and Thrombosis, vol. 13 (No. 11), p. 1654-1661, Nov. 1993. |
| Williams, P.T. et al., Low-fat diets, lipoprotein subclasses, and heat disease risk, Am. J. Clin. Nutr., vol. 70, p. 949-950, 1999. |
| Williams, P.T. et al., The associations of high-density lipoprotein subclasses with insulin and glucose levels, physical activity, resting heart rate, and regional adiposity in men with coronary artery disease. . . , Metabolism: Clinical & Experimental, vol. 44 (No. 1), p. 106-114, Jan. 1995. |
Cited By (13)
| Publication number | Priority date | Publication date | Assignee | Title |
|---|---|---|---|---|
| US8386187B2 (en) * | 2008-10-20 | 2013-02-26 | Liposcience, Inc. | Lipoprotein insulin resistance indexes and related methods, systems and computer programs for generating same |
| US20100100334A1 (en) * | 2008-10-20 | 2010-04-22 | Otvos James D | Lipoprotein insulin resistance indexes and related methods, systems and computer programs for generating same |
| US9638705B2 (en) | 2010-11-01 | 2017-05-02 | Quest Diagnostics Investments Incorporated | Prognostic assays for maintenance hemodialysis patients |
| US11137410B2 (en) | 2010-11-01 | 2021-10-05 | Quest Diagnostics Investments Llc | Prognostic assays for maintenance hemodialysis patients |
| US10473675B2 (en) | 2010-11-01 | 2019-11-12 | Quest Diagnostics Investments Incorporated | Prognostic assays for maintenance hemodialysis patients |
| US20150126473A1 (en) * | 2011-06-16 | 2015-05-07 | Children's Hospital & Research Center At Oakland | Ultra-Small ApoB-Containing Particles and Methods of Use Thereof |
| US9857385B2 (en) | 2011-06-16 | 2018-01-02 | Children's Hospital & Research Center At Oakland | Ultra-small apoB-containing particles and methods of use thereof |
| US9322833B2 (en) * | 2011-06-16 | 2016-04-26 | Children's Hospital & Research Center At Oakland | Ultra-small ApoB-containing particles and methods of use thereof |
| US9459194B2 (en) * | 2013-03-14 | 2016-10-04 | Cardio Metrix | Apparatuses, processes, and systems for measuring particle size distribution and concentration |
| US20140260702A1 (en) * | 2013-03-14 | 2014-09-18 | Cardio Metrix | Apparatuses, Processes, and Systems for Measuring Particle Size Distribution and Concentration |
| US9551768B2 (en) | 2013-03-15 | 2017-01-24 | East Carolina University | NMR method for monitoring changes in the core of lipoprotein particles in metabolism and disease |
| US10613169B2 (en) | 2013-03-15 | 2020-04-07 | East Carolina University | Methods for monitoring changes in the core of lipoprotein particles in metabolism and disease |
| US10775458B2 (en) | 2018-03-05 | 2020-09-15 | Texas Tech University System | Method and system for non-invasive measurement of metabolic health |
Also Published As
| Publication number | Publication date |
|---|---|
| EP1444526B1 (en) | 2011-09-21 |
| US8097462B2 (en) | 2012-01-17 |
| US20070287187A1 (en) | 2007-12-13 |
| US20110089037A1 (en) | 2011-04-21 |
| JP2005509860A (en) | 2005-04-14 |
| JP4705754B2 (en) | 2011-06-22 |
| CA2467420A1 (en) | 2003-05-22 |
| EP1444526A4 (en) | 2007-08-22 |
| US7851224B2 (en) | 2010-12-14 |
| ATE525635T1 (en) | 2011-10-15 |
| AU2002352712B2 (en) | 2008-10-30 |
| AU2002352712A2 (en) | 2003-05-26 |
| EP1444526A1 (en) | 2004-08-11 |
| WO2003042704A1 (en) | 2003-05-22 |
| US20100213061A1 (en) | 2010-08-26 |
| AU2009200225A1 (en) | 2009-02-12 |
| US20030136680A1 (en) | 2003-07-24 |
| US7259018B2 (en) | 2007-08-21 |
Similar Documents
| Publication | Publication Date | Title |
|---|---|---|
| US7713744B2 (en) | Determining the risk of cardiovascular disease using ion mobility of lipoproteins | |
| AU2002352712A1 (en) | Ion mobility analysis of biological particles | |
| AU2016200628B2 (en) | Lipoprotein analysis by differential charged-particle mobility | |
| US11680949B2 (en) | Lipoprotein analysis by differential charged-particle mobility | |
| US20080302666A1 (en) | Apparatus for differential charged-particle mobility |
Legal Events
| Date | Code | Title | Description |
|---|---|---|---|
| AS | Assignment |
Owner name: ENERGY, UNITED STATES DEPARTMENT OF, DISTRICT OF C Free format text: CONFIRMATORY LICENSE;ASSIGNOR:REGENTS OF THE UNIVERSITY OF CALIFORNIA, THE;REEL/FRAME:020001/0507 Effective date: 20070810 Owner name: ENERGY, UNITED STATES DEPARTMENT OF,DISTRICT OF CO Free format text: CONFIRMATORY LICENSE;ASSIGNOR:REGENTS OF THE UNIVERSITY OF CALIFORNIA, THE;REEL/FRAME:020001/0507 Effective date: 20070810 |
|
| STCF | Information on status: patent grant |
Free format text: PATENTED CASE |
|
| FPAY | Fee payment |
Year of fee payment: 4 |
|
| MAFP | Maintenance fee payment |
Free format text: PAYMENT OF MAINTENANCE FEE, 8TH YEAR, LARGE ENTITY (ORIGINAL EVENT CODE: M1552) Year of fee payment: 8 |
|
| MAFP | Maintenance fee payment |
Free format text: PAYMENT OF MAINTENANCE FEE, 12TH YEAR, LARGE ENTITY (ORIGINAL EVENT CODE: M1553); ENTITY STATUS OF PATENT OWNER: LARGE ENTITY Year of fee payment: 12 |