US7679746B1 - System and method for measurement of pressure drop through perforated panels - Google Patents
System and method for measurement of pressure drop through perforated panels Download PDFInfo
- Publication number
- US7679746B1 US7679746B1 US12/359,328 US35932809A US7679746B1 US 7679746 B1 US7679746 B1 US 7679746B1 US 35932809 A US35932809 A US 35932809A US 7679746 B1 US7679746 B1 US 7679746B1
- Authority
- US
- United States
- Prior art keywords
- panel
- holes
- perforated panel
- perforated
- pressure drop
- Prior art date
- Legal status (The legal status is an assumption and is not a legal conclusion. Google has not performed a legal analysis and makes no representation as to the accuracy of the status listed.)
- Expired - Fee Related
Links
- 238000005259 measurement Methods 0.000 title claims abstract description 34
- 238000000034 method Methods 0.000 title claims description 78
- 230000003287 optical effect Effects 0.000 claims abstract description 57
- 238000005286 illumination Methods 0.000 claims abstract description 33
- 230000033001 locomotion Effects 0.000 claims description 14
- 238000001514 detection method Methods 0.000 claims description 8
- 238000007781 pre-processing Methods 0.000 claims description 8
- 238000003384 imaging method Methods 0.000 claims description 6
- 230000004044 response Effects 0.000 claims description 5
- 238000009877 rendering Methods 0.000 claims 2
- 238000010586 diagram Methods 0.000 description 12
- 238000004519 manufacturing process Methods 0.000 description 11
- 238000009826 distribution Methods 0.000 description 7
- 238000013461 design Methods 0.000 description 6
- 230000008569 process Effects 0.000 description 6
- 230000009467 reduction Effects 0.000 description 5
- 238000013459 approach Methods 0.000 description 4
- 238000012360 testing method Methods 0.000 description 4
- 230000000875 corresponding effect Effects 0.000 description 3
- 230000002950 deficient Effects 0.000 description 3
- 238000000605 extraction Methods 0.000 description 3
- 238000007689 inspection Methods 0.000 description 3
- 238000012805 post-processing Methods 0.000 description 3
- 238000012545 processing Methods 0.000 description 3
- 238000004458 analytical method Methods 0.000 description 2
- 238000004364 calculation method Methods 0.000 description 2
- 238000007796 conventional method Methods 0.000 description 2
- 238000012937 correction Methods 0.000 description 2
- 230000002596 correlated effect Effects 0.000 description 2
- 230000000694 effects Effects 0.000 description 2
- 238000012423 maintenance Methods 0.000 description 2
- 238000012986 modification Methods 0.000 description 2
- 230000004048 modification Effects 0.000 description 2
- RLLPVAHGXHCWKJ-IEBWSBKVSA-N (3-phenoxyphenyl)methyl (1s,3s)-3-(2,2-dichloroethenyl)-2,2-dimethylcyclopropane-1-carboxylate Chemical compound CC1(C)[C@H](C=C(Cl)Cl)[C@@H]1C(=O)OCC1=CC=CC(OC=2C=CC=CC=2)=C1 RLLPVAHGXHCWKJ-IEBWSBKVSA-N 0.000 description 1
- 230000005540 biological transmission Effects 0.000 description 1
- 230000008859 change Effects 0.000 description 1
- 230000001427 coherent effect Effects 0.000 description 1
- 238000004891 communication Methods 0.000 description 1
- 238000013500 data storage Methods 0.000 description 1
- 230000001419 dependent effect Effects 0.000 description 1
- 238000005553 drilling Methods 0.000 description 1
- 230000007613 environmental effect Effects 0.000 description 1
- 238000011156 evaluation Methods 0.000 description 1
- 238000001914 filtration Methods 0.000 description 1
- 239000000446 fuel Substances 0.000 description 1
- 229910052736 halogen Inorganic materials 0.000 description 1
- 150000002367 halogens Chemical class 0.000 description 1
- 230000010354 integration Effects 0.000 description 1
- 238000012417 linear regression Methods 0.000 description 1
- 238000013507 mapping Methods 0.000 description 1
- 239000000463 material Substances 0.000 description 1
- 230000008520 organization Effects 0.000 description 1
- 239000002245 particle Substances 0.000 description 1
- 238000010223 real-time analysis Methods 0.000 description 1
- 238000002310 reflectometry Methods 0.000 description 1
- 238000009419 refurbishment Methods 0.000 description 1
- 238000011160 research Methods 0.000 description 1
- 230000011218 segmentation Effects 0.000 description 1
- 238000000926 separation method Methods 0.000 description 1
- 238000001228 spectrum Methods 0.000 description 1
- 230000007723 transport mechanism Effects 0.000 description 1
- 230000001960 triggered effect Effects 0.000 description 1
- 238000005406 washing Methods 0.000 description 1
Images


Classifications
-
- G—PHYSICS
- G01—MEASURING; TESTING
- G01N—INVESTIGATING OR ANALYSING MATERIALS BY DETERMINING THEIR CHEMICAL OR PHYSICAL PROPERTIES
- G01N15/00—Investigating characteristics of particles; Investigating permeability, pore-volume or surface-area of porous materials
- G01N15/08—Investigating permeability, pore-volume, or surface area of porous materials
- G01N15/088—Investigating volume, surface area, size or distribution of pores; Porosimetry
-
- G—PHYSICS
- G01—MEASURING; TESTING
- G01N—INVESTIGATING OR ANALYSING MATERIALS BY DETERMINING THEIR CHEMICAL OR PHYSICAL PROPERTIES
- G01N15/00—Investigating characteristics of particles; Investigating permeability, pore-volume or surface-area of porous materials
- G01N15/08—Investigating permeability, pore-volume, or surface area of porous materials
- G01N2015/0846—Investigating permeability, pore-volume, or surface area of porous materials by use of radiation, e.g. transmitted or reflected light
Definitions
- the present disclosure relates to measurement of pressure drop through perforated panels. More particularly, the present disclosure relates to a system and method which can be used to measure drop in pressure through drilled perforated panels by determining the optical porosity of the panels.
- Airflow through the panels which form the airfoil surface may occur through thousands or millions of tiny holes, each only a few thousandths of an inch in diameter, which may be “drilled” in the panel using a high-power pulsed laser beam.
- the holes may be distributed around the surface of the panel in a pattern with a density that is determined by the aerodynamic design.
- Optical porosity seeks to establish a correlation between Pd and the amount of light that can be transmitted through an hole or holes in a panel using a backlight and some form of light sensor.
- Light transmission control technique and correlation with pressure loss characteristics of perforated panels for Hybrid Laminar Flow Applications presented by B. Paluch at the Proceedings of the CRAS/DragNet European Drag Reduction Conference, 19-21 Jun. 2000, in Potsdam, Germany, it was established that there is a high correlation (0.956 in the test configuration described) between total air flow through a test panel and the optical power transmitted through its perforations from a halogen point light source.
- the present disclosure is generally directed to a system for measurement of pressure drop through a perforated panel having panel holes.
- An illustrative embodiment of the system includes a sensor comprising an illumination source adapted to illuminate the perforated panel, a lens spaced-apart with respect to the illumination source and a camera interfacing with the lens.
- a controller is connected to the camera and adapted to receive image frames of the panel openings from the camera, measure an optical porosity of the perforated panel, identify a number and locations of missing and blocked panel holes in the perforated panel, determine a shape of a small region associated with each panel hole and calculate a pressure drop through the perforated panel based on the optical porosity of the perforated panel, the number and locations of the missing and blocked panel holes and the shape of the small region associated with each panel hole.
- the present disclosure is further generally directed to method for measurement of pressure drop through a perforated panel having panel holes.
- An illustrative embodiment of the method includes loading a perforated panel having panel holes, executing a scan of the perforated panel by illuminating the perforated panel and capturing image frames of the panel holes in the perforated panel and summarizing and archiving data by measuring an optical porosity of the perforated panel, identifying a number and locations of missing and blocked panel holes in the perforated panel and calculating a pressure drop through the perforated panel based on the optical porosity of the perforated panel and the number and locations of missing and blocked panel holes in the perforated panel.
- the method may include loading a perforated panel into position for imaging; illuminating the perforated panel; capturing images of panel holes in the perforated panel; pre-processing the images; extracting metageometry of the panel holes; assembling image statistics based on the metageometry; determining a pressure drop through the perforated panel based on the image statistics; and formatting display data of the pressure drop.
- the system for measurement of a pressure drop through a perforated panel may include a sensor adapted for moving in a scanning motion relative to the perforated panel and comprising a distributed light illumination source such as an illuminated plate or fluorescent panel adapted to backlight the perforated panel, a telecentric lens spaced-apart with respect to the illumination source and a camera interfacing with the lens; and a controller connected to the camera and adapted to receive image frames of the panel openings from the camera, the controller comprising a blob detection component adapted to find locations of the panel holes in the perforated panel and use grayscale information to measure total optical power of light rays transmitted from the illumination source through the perforated panel; an optical porosity measurement component adapted to measure optical porosity by summing a pixel response in the local region of each of the panel holes; an image frame analyzing component adapted to analyze individual image frames from the camera and identify spacing and expected locations of the panel holes in the perforated panel; a small region measurement component adapted to utilize spacing and
- the method may include loading a perforated panel into position for imaging; backlighting the perforated panel with light rays from an illumination source; capturing images of panel holes in the perforated panel; pre-processing the images by acquiring the images, normalizing the images and updating camera controls and extracting a list of blobs; extracting metageometry of the panel holes by obtaining a first approximation of hole spacing, identifying and measuring an angle of a scanning axis, identifying pulse spacing of panel openings along the scanning axis, locating a probable location of plugged holes in the perforated panel, constructing a semantic representation of an array of the panel holes in the perforated panel, identifying hole-local regions and measuring a total optical power of each panel hole; assembling image statistics based on the metageometry by obtaining a Y-axis servo hunting magnitude and variation, obtaining a spacing magnitude and variation along the scanning direction, obtaining an interline spacing of the panel holes, obtaining an optical porosity of the
- FIG. 1 is a block diagram which illustrates an illustrative embodiment of a system for measurement of pressure drop through perforated panels.
- FIG. 2 is a flow diagram which summarizes an illustrative embodiment of a method for measurement of pressure drop through perforated panels.
- FIG. 2A is a flow diagram which details an illustrative embodiment of a method for measurement of pressure drop through perforated panels.
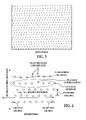
- FIG. 3 is reproduction of an image of a perforated panel.
- FIG. 4 is a schematic diagram which illustrates interpretation of a typical image frame captured by a sensor camera in implementation of an illustrative embodiment of the system and method for measurement of pressure drop through perforated panels.
- FIG. 5A is a top view which illustrates a combination of a moving perforated panel and a row of stationary cameras that film the panel in implementation of an illustrative embodiment of the system and method for measurement of pressure drop through perforated panels.
- FIG. 5B is a side view of the moving perforated panel and stationary cameras shown in FIG. 5A .
- FIG. 6 is a flow diagram which illustrates pre-processing of a panel image in implementation of an illustrative embodiment of the system and method for measurement of pressure drop through perforated panels.
- FIG. 7 is a flow diagram which illustrates a metageometry extraction process in implementation of an illustrative embodiment of the system and method for measurement of pressure drop through perforated panels.
- FIG. 8A is a line graph which illustrates a method of developing line membership of an hole in a highly-clustered pattern of holes in a perforated panel.
- FIG. 8B is a line graph which illustrates a method of developing line membership of an hole in a non-clustered pattern of holes in a perforated panel.
- FIG. 9 is a line graph which illustrates another method of developing line membership of an hole in a pattern of holes in a perforated panel.
- FIG. 10 is a line graph which illustrates building of a list of lines consisting of related holes in developing line membership of an hole.
- FIG. 11 is a method for measuring the spacing between holes along a line.
- FIG. 12 is a graph which illustrates a geometric approach to determining the cell area of an hole.
- FIG. 13 is a graph which indicates measurement of the optical power at each hole location.
- FIG. 14 illustrates key indicators of an algorithm-identified scanning angle.
- FIG. 15 is a general-purpose type of display which can be used to verify the correct operation of an entire algorithm suite at a glance.
- FIG. 16 illustrates a method of displaying a collection of individual images that have been mapped to an actual panel geometry.
- FIG. 17 is a flow diagram of an aircraft production and service methodology.
- FIG. 18 is a block diagram of an aircraft.
- the present disclosure is generally directed to a method of inspecting large areas of a perforated panel and utilizing optical porosity of the panel to determine pressure drop (Pd) through the panel.
- the method may include determining the density and distribution of plugged holes even as the geometric nature of the designed hole distribution may change across the panel surface. Since this geometry can be a constantly-changing function of location, the method may independently determine the orientation and hole pattern geometry directly from each image without the use of any reference standards.
- the array of bright dots which represent the hole pattern may be turned into a semantic representation of lines, orientations, and spacings from which one can directly calculate the associated Pd per unit area and geometric conformance to design standards.
- the system 100 may include a camera 101 which may be a high-resolution machine vision area digital camera, for example and without limitation.
- the camera 101 may interface with a lens 102 , which in some embodiments may be a telecentric lens.
- the lens 102 may be adapted to parallelize light rays 120 which are emitted from a suitable illumination source 114 .
- the illumination source may be a flat distributed light source, for example and without limitation.
- a perforated panel 116 through which extends panel holes 117 , may be positioned between the illumination source 114 and the telecentric lens 102 .
- hundreds of the panel holes 117 may be located in each image frame of the camera 101 .
- the illumination source 114 may be adapted to backlight the perforated panel 116 to determine the optical porosity of the perforated panel 116 .
- the optical porosity of the perforated panel 116 may indicate the drop in pressure (Pd) through the perforated panel 116 .
- Pd drop in pressure
- Use of a telecentric lens 102 may enable coverage of a wider FOV of the perforated panel 116 without perspective distortion.
- the camera 101 and the lens 102 , along with the illumination source 114 may be adapted to scan along the perforated panel 116 , which may remain stationary, as indicated by the arrow 110 .
- the perforated panel 116 may be adapted to move, as indicated by the arrow 112 , while the sensor 122 (which includes the camera 101 , the lens 102 and the illumination source 114 ) may remain stationary during scanning of the perforated panel 116 .
- scanning may be accomplished by a combination of movement of the sensor 122 and the perforated panel 116 .
- a controller 103 may interface with the camera 101 .
- the controller 103 may include a blob detection component 104 , an optical porosity measurement component 105 , an image frame analyzing component 106 , a small region measurement component 107 and a pressure drop calculating component 108 .
- the blob detection component 104 may be adapted to quickly find locations of the panel holes 117 in the perforated panel 116 and use grayscale information to measure total optical power of the light rays 120 transmitted through the perforated panel 116 .
- the optical porosity measurement component 105 may be adapted to measure optical porosity by summing the pixel response in the local region of each panel hole 117 .
- the image frame analyzing component 106 may be adapted to analyze individual image frames from the camera 101 in order to identify the spacing and expected locations of panel holes 117 in the perforated panel 116 .
- the spacing and expected locations of the panel holes 117 may then be used to identify missing or blocked panel holes 117 in the perforated panel 116 .
- the small region measurement component 107 may be adapted to utilize spacing and expected locations of the panel holes 117 to measure the shape of the small region associated with each panel hole 117 . This may allow determination of the exact contribution of each individual open panel hole 117 to the corresponding micro-regional area of the panel hole 117 , thus eliminating aliasing artifacts.
- the pressure drop calculating component 108 may be adapted to calculate and display in real time the pressure drop over the entire perforated panel 116 in an easily-assimilated form, which may include the automatic detection of defective hole regions of any size, for an operator (not shown) of the system 100 .
- a perforated panel 116 through which extends panel holes 117 , may be placed between the lens 102 and the illumination source 114 of the sensor 122 .
- the illumination source 114 emits light rays 120 through the panel holes 117 in the perforated panel 116 .
- the lens 102 may parallelize the light rays 120 .
- the camera 101 and the lens 102 along with the illumination source 114 of the sensor 122 , may be moved in a scanning motion, as indicated by the arrow 110 , while the perforated panel 116 may remain stationary.
- the perforated panel 116 may move in a scanning motion, as indicated by the arrow 112 , while the sensor 122 remains stationary.
- both the sensor 122 and the perforated panel 116 may move during the scan.
- the camera 101 may capture images of multiple panel holes 117 in the perforated panel 116 in each image frame.
- the blob detection component 104 of the controller 103 may quickly find locations of the panel holes 117 in each image frame and may subsequently use grayscale information in the hole locations to measure the total optical power which is transmitted through the panel holes 117 .
- the optical porosity measurement component 105 may measure the optical porosity of the perforated panel 116 by summing the pixel response in the local region of each panel hole 117 .
- the image frame analyzing component 106 may analyze the individual image frames of the camera 101 so as to identify the spacing and expected locations of panel holes 117 in the perforated panel 116 .
- the image frame analyzing component 106 may utilize the spacing and expected locations of the panel holes 117 to identify missing or blocked panel holes 117 .
- the small region measurement component 107 may utilize the spacing and expected locations of the panel holes 117 to measure the exact shape of the small region associated with each panel hole 117 , thus allowing the exact contribution of each individual open panel hole 117 to the corresponding micro-regional area and thus eliminating all aliasing artifacts.
- the pressure drop calculating component 108 may then calculate and display in real time the pressure drop (Pd) over the entire perforated panel 116 .
- the display may be presented in an easily-assimilated form and may include the automatic detection of defective regions of any size.
- FIG. 2 a flow diagram 200 which summarizes an illustrative embodiment of a method for measurement of pressure drop through perforated panels, hereinafter method, using the system 100 in FIG. 1 is shown.
- the perforated panel 116 may be loaded into position between the lens 102 and the illumination source 114 .
- the perforated panel 116 or the sensor 122 may be moved through a programmed scan as the light rays 120 from the illumination source 114 are emitted through the perforated panel 116 to the lens 102 .
- the controller 103 may monitor the results of the scan in real time.
- the perforated panel 116 may be removed from between the lens 102 and the illumination source 114 .
- the controller 103 may flag non-conformance to design specifications and report the resulting data to archived data storage.
- FIG. 3 is reproduction of an image of a perforated panel which may be imaged by the camera 101 .
- FIG. 3 In the image of FIG. 3 , several of the panel holes, evenly distributed around the imager are plugged.
- the method 200 may utilize realtime analysis of each image frame acquired by the camera 101 during scanning.
- FIG. 4 illustrates how a typical image frame as captured by a sensor camera 101 is interpreted. Perforations or panel holes are shown in the figure as circles, with their locations marked with small crosshairs. Due to the nature of the manufacturing process by which the perforated panel 116 may be produced, panel holes may be drilled by moving a pulsed high-energy laser along a scanning direction, or scanning axis. This scanning direction or axis may not align with the image frame of the camera 101 .
- Lines may be stacked up beside each other by moving the laser sideways at some interline spacing and repeating a line, but without control over whether the panel holes of one line are immediately adjacent to the panel holes of the neighbor, leading to a phase difference between lines.
- One “line of holes” is simply all of the holes that appear within the width of an image, with the understanding that the line continues beyond either side of the image and will be measured by subsequent images when the gantry or part has moved. Some panel holes may be plugged or missing. The location of these panel holes (virtual holes) may be determined by a best-estimate driven by semantic algorithms. Finally, it may be necessary to identify which holes are at the ends of each line (within the image). This information may be used to determine the spacing of panel holes within a line even in the presence of one or more virtual holes.
- an image as captured by the camera 101 of the sensor 122 may include an array of bytes (numbers that range from 0 to 255) representing optical brightness of two-dimension positions (pixels) in a focused image, arranged in rows and columns.
- An image may include no information as to what objects appear within it, other than their appearance in two dimensions.
- a blob (shorthand for “binary large object”) may be the first step in extracting some semantic meaning from these numbers, and may include a local group of bright pixels—in this case, the bright light coming through a given panel hole. Instead of a simple array of numbers, common in programming, all the blobs in an image may be identified as members of a list.
- each list element representing an individual blob may contain at a minimum its location (row and column in the image) and its size (number of connected pixels). Subsequently, additional semantic characteristics may be added to the blobs as determinations are made about their nature as holes, which may include characteristics such as total brightness; shape; membership in a given line; whether a hole is at the left end or right end of its line; whether the hole represents a virtual hole; and the amount of non-perforated panel surface area that surrounds the hole.
- Each frame of data may include lines of holes which may be blobs formed of pixels in an image. Only the image pixels may be a simple numeric data type.
- the method 200 may include the following:
- Block 202 a Load perforated panel 116 into position for imaging
- Block 204 a Illuminate perforated panel 116 with light rays 120 from illumination source 114 ;
- Block 206 a Capture image frames of panel holes 117 in perforated panel 116 ;
- Block 210 a Extract metageometry
- Block 212 a Assemble image statistics based on metageomatry
- Block 216 a Increment sensor scan position and repeat steps 2-5 until finished;
- Scanning of the perforated panel 116 may be accomplished in several ways, and the exact method of loading a perforated panel 116 into the system 100 may depend on which method is used. For instance, the so-called “step-and-repeat” method, wherewith the sensor 122 or panel 116 is moved to the each test location and halts for images to be triggered while the panel 116 and sensor 122 are stationary with respect to each other, may require the use of an expensive moving gantry to hold the sensor 122 or panel 116 .
- a pre-programmed path may move the measurement field around the panel 116 until it has been completely inspected.
- the panel 116 may be imaged while it is moving.
- One method, which may be built to deploy the system 100 is a combination of a moving part and a row of stationary cameras 103 that cover the width of the perforated panel 116 is used, as shown in FIGS. 5A and 5B . Two rows of cameras 103 may be positioned in such a way as to obtain 100% coverage of the surface of the perforated panel 116 , as illustrated.
- Pre-processing of the image captured by the camera 103 may be accomplished as shown in the flow diagram 600 shown in FIG. 6 .
- the camera gain and DC offset black level
- These control signals may come from a filter with a large time constant so that large changes of background appearance due to changes in area lighting level or surface reflectivity may be accounted for.
- the signal levels involved in this calibration may be made available to an executive portion so that the administrating process may determine sensor image validity, e.g., to make an independent evaluation of whether a given image frame is actually viewing a valid workpiece).
- the next image may be acquired as it becomes available, such as through an appropriate physical transport mechanism, e.g. a digital camera 101 and its associated communication bus.
- the camera 101 may be operated with a disabled automatic gain control (AGC) because the nature of the images may disrupt the manner in which the circuits are normally designed.
- AGC automatic gain control
- AGC may be done in software according to algorithms mentioned herein.
- a full-image power histogram may be extracted and the probable mean intensity (brightness) of the background surface and of the panel holes 117 may be located.
- Correction signals to the camera DC offset and gain may be calculated to move the background power level into the lower 25% of the histogram and push the larger power level coming through the perforations into the upper 75%.
- the gain and offset filter inputs may be updated with these corrections.
- any geometric image warping or mapping (e.g., rotating it by 90 degrees) that is required by the physical mounting orientation of the camera sensor 122 may be applied in software.
- the correct goal is one in which the scanning direction of the panel holes 117 is within plus or minus 45 degrees of the horizontal orientation of the image frame.
- a list of blobs may be extracted according to a binary threshold related to custom AGC algorithms. This may be the first place where the nature of the signal processing moves from a two-dimensional image representation into a semantic list of data objects, in this case the size and location of discrete bright spots representing the panel holes 117 .
- This task may create an understanding of the lines of panel holes 117 along the scanning direction, which may vary through a wide range of angles, as they are visible within the image frame. A certain percentage of these panel holes 117 may be plugged and thus be invisible to the camera 101 . Since this semantic abstraction relies on the underlying geometry, the term “metageometry” may be used to describe it.
- the two main levels of abstraction are holes and lines.
- the list of blobs becomes a list of holes when the characteristics of sizes optical power, and line membership are ascribed to their descriptions by various algorithms. Holes become elements in a list of lines that may be produced when it is discovered which holes are the right and left ends, and which holes lie close to a line between them. Parameters such as y-axis servo wander may be added by other algorithms to each line object.
- the line list may then be used to discover the location of virtual holes, the spacing between lines, and the size of the local regions around each hole.
- optical porosity per unit area may be used to generate the basic characteristics of the perforated panel that the system was designed to measure: optical porosity per unit area, percentage of plugged holes, and basic geometric compliance to design specifications with regard to hole spacing, array shape, and two dimensional distribution across the part.
- the flow diagram 700 shown in FIG. 7 illustrates a metageometry extraction process in implementation of an illustrative embodiment of the system and method.
- the first task may include identification of the scanning axis direction, which may later be used to discover the locations of lines of holes.
- FIGS. 8A and 8B illustrate how this may be accomplished.
- FIG. 8A it is noted that due to the basic nature of straight lines of holes, the locations along some line of projection at angle ⁇ from horizontal will form tight clusters when this line is nearly perpendicular to the scanning axis direction, as shown.
- the angle ⁇ is not near perpendicular, as seen in FIG. 8B , where ⁇ is 36 degrees, the locations may be loosely clustered or not clustered at all.
- This clustering behavior may be used by modeling the locations along the line of projection as though they were particles exerting a force among themselves proportional to some power factor of their separation.
- the total “force” contained in the population can be found by the equation at the bottom of FIG. 8B .
- angle ⁇ is simply driven through 180 degrees while the “force” and look for a peak is calculated. Since ⁇ represents a perpendicular projection, the scanning axis angle is simply 90 degrees away from it.
- the “force” may be a continuous function of angle ⁇ , with infinite resolution. Thus, it may be possible to perturbate around the candidate peak location to find the exact scanning angle to any desired resolution.
- Other methods for solving this kind of problem tend to apply a binning procedure, which may be limited in resolution to the size of the bins and thus may not achieve the precision which the method 200 exhibits.
- the minimum distance between any two holes in the image may be used below in identifying lines. It is found simply by going through the entire list of blobs and determining the Euclidean distance between each pair. Out of all possible pairs, the shortest distance may be kept. This value is referred to as the nearest neighbor distance herein. Additionally, the average neighbor distance may be measured, which may be used later in limited the search range of the filtering process used to measure spacing along the lines of holes.
- An image frame may contain one or more lines, up to several dozen depending upon how the camera field of view has been set up and what the designed hole spacing is for the particular part being inspected.
- Two different methods may be used to determine so-called line membership for each hole in the image in block 706 of FIG. 7 . This is a characteristic that is added to each member of the hole list. The results of these two independent methods may be compared to each other to increase confidence that a correct assessment has been made.
- FIG. 9 depicts this method graphically.
- the peaks are simply numbered sequentially from one, and peak membership (similar to line membership) is added to each hole as this numerical value.
- the projected location onto the interline direction axis of each hole in the entire population is compared to these peak locations, and any location within half of the nearest neighbor distance of a peak is given the number of that peak. If a given hole does not fall within this distance of any peak, it is called an orphan and given a peak membership value of zero. Note that this method allows simply scanning through the total list of holes in order from first to last, because each hole is assigned a peak membership immediately, independent of any other hole. Lines as manipulable semantic entities in themselves are not developed.
- the second method is conceptually very similar, but actually builds a list of lines consisting of related holes. A given line is discovered, then fully populated before moving ahead to the next line. Thus by the time the process is complete a list of manipulable semantic entities has been populated.
- This is a snapshot of the image frame as a list of distinct lines of perforations.
- FIG. 10 is a flow chart which illustrates this method. All holes in the image are assigned an orphan status, where the line membership value is set to zero. Then, any orphan hole is selected from the population and an imaginary line drawn from it at the scanning angle ⁇ , a new candidate line entity in a list is established. The rest of the population of orphans may then be scanned.
- the numerical value of the current line may be assigned to it (replacing the orphan status value of zero), and it may be added to the list of holes being collected under the current line. If no more orphan holes are within nearest neighbor distance of the current line, then a new line may be started by the next available orphan. This process may be repeated until no additional lines can be created.
- the list of lines is traversed, one line at a time, to ensure that all of the holes in any given line share the same peak membership that was found earlier, as described above. Any holes that do not may be returned to orphan status and treated separated or ignored later on.
- the abstract semantic list of lines may be used to easily determine the left-most and right-most hole for each line. This may be done by traversing the list and keeping track of the minimum and maximum horizontal locations of the holes (the geometry is rotated such that the scanning direction is aligned with the horizontal axis of the camera frame). Rather than actually producing a re-ordered hole list that is in horizontal position order, a computationally expensive task, pointers to the left and right holes may be added to the semantic description of a line. It may not be necessary to know the actual order of the holes between the two ends. Also (for display purposes in the realtime operator monitor) “left-endedness” and “right-endedness” may be added to the characteristics of the holes involved.
- the pulse frequency of the drilling laser which in combination with the scan velocity of the laser optics, may set the spacing between holes along the scanning direction. In practice, this may be a very constant, well-controlled value. In keeping with the philosophy of this system, however, that rate from the geometry of the perforations in the image may be measured rather than simply making use of this a priori knowledge.
- FIG. 11 illustrates a method which may be used for measuring the spacing along a line.
- a set of candidate hole locations may be calculated given some spacing value, as shown.
- a calculation similar to what was used earlier to determine clustering along a projection line may be used to find the magnitude of the “force” between the actual hole locations and these candidate hole locations.
- the spacing may be varied (scanned) over a range and the resulting magnitude for each spacing value may be kept. When the scan is complete, a peak value may be present which represents the actual spacing of the holes along the line.
- the candidate distance may be varied from slightly less than the nearest neighbor distance to about 50% more than the average neighbor distance. It should be noted that the more obvious approach to this problem would be to simply calculate a Fourier transform of the locations, and look for the peak frequency in the resulting spectrum. However, the above method, given the known constraints on the range of expected spacings, may result in a faster computation. It may also be more robust in the presence of missing (plugged) holes, whereas a Fourier transform may leak significant energy into higher-frequency components, thus “washing out” the fundamental peak.
- the next step may include determining the size of the actual area (cell) surrounding each hole in block 714 .
- the size of the actual area (cell) surrounding each hole may be determined.
- the entire image may be divided up according to straight line boundaries.
- the best-fit (linear regression) equation of a line may be determined for each semantic line (the holes along this line may “wobble” across it according to the degree of y-axis servo hunting mentioned hereinabove). These may be extended to the boundary of the image.
- perpendicular line segments may be added midway between each hole, real or virtual.
- the outer boundary of a cell near an image edge may be presumed to be the same distance from the hole as the visible side, as shown in FIG. 12 .
- the same philosophy may be applied, where a “virtual bounding line” is laid outside the actual image extent.
- the area of each cell may simply be the geometric area of the quadrilateral surrounding each hole. This may be kept in “pixel space”, or may be converted to square units of measure (e.g., square inches or square millimeters) if the sensor has been optically calibrated to determine the size of the image pixels.
- the cell area may be added as a characteristic of a hole.
- the optical power that is observed at each hole location may be measured. This may be a simple matter of going back to the original grayscale image and summing up the values of all pixels within a certain neighborhood of the hole center, and above a certain brightness level that is just above the background (unperforated) brightness. This is illustrated graphically in FIG. 13 .
- the total optical power may be added as a characteristic to each hole description.
- a rough estimate of hole diameter may be taken at this stage, as a simple template correlation of ideal circle diameter to the boundary pixels of the hole image.
- the information that is assembled concerning a given image may vary according to the needs of the particular type of inspection being performed.
- the semantic line list which points to all holes real and virtual within the image, may contain sufficient data to calculate any combination of the following:
- FIG. 14 illustrates a couple of key indicators for how the algorithms have identified the scanning angle.
- the green histogram-like plot across the bottom of the image shows the value of the “force” calculation for every angle from 0 to 180 degrees, and the green line on the display shows an operator how well the automated angle extraction agrees with what can be seen visually (in this example, perfectly).
- FIG. 15 illustrates a more general-purpose type of display which can be used to verify the correct operation of the entire algorithm suite at a glance.
- the optical porosity value for each hole is shown numerically.
- the center of each hole is indicated with a crosshair, virtual holes are covered with a circle, and line membership is shown by using an arbitrary false color for the hole crosshairs.
- the two displays above and to the right of the main image are the projected brightness histograms for each direction.
- a brightness histogram for the entire image is shown in the upper right corner, allowing an indication of how the automatic camera gain control filter algorithms are working.
- Many alternative types of realtime displays can be developed for the purpose.
- the exact method of moving the sensor 122 with respect to the perforated panel 116 may be by moving the sensor 122 , moving the panel 116 , or a combination involving multiple fixed cameras 101 and a moving panel 116 . Images may be taken while the relative motion is stopped, or they may be frozen by a short exposure time. There may also be a certain pre-programmed variation in the scanning technique to accommodate panels that are not rectangular. However the motion is accomplished, the image frame processing may continue until inspection of the entire panel 116 is completed.
- the heart of the processing in the present disclosure is all of the activity that goes into analysis of a single image frame. However, to be useful in the manufacturing environment it may be necessary to assemble these frames together into a coherent view of the entire panel being measured. This can be done simply by keeping track of the location on the panel from where each image has been taken.
- the types of post-processing implemented may include but are not limited by the following operations:
- FIG. 16 illustrates one method of displaying a collection of individual images that have been mapped to the actual panel geometry.
- the optical power from each hole has been assigned a false color as well as a “height”, and the result is shown as a three-dimensional map of the surface. In this way, areas which are deficient can be seen at a glance, and a numeric value quickly correlated to the problem.
- the panel may simply continue out the exit side of the machine.
- the inspection process as a simple station along a conveyor line.
- Other implementations, such as a step-and-repeat robotic gantry, may be used.
- embodiments of the disclosure may be used in the context of an aircraft manufacturing and service method 78 as shown in FIG. 17 and an aircraft 94 as shown in FIG. 18 .
- exemplary method 78 may include specification and design 80 of the aircraft 94 and material procurement 82 .
- component and subassembly manufacturing 84 and system integration 86 of the aircraft 94 takes place.
- the aircraft 94 may go through certification and delivery 88 in order to be placed in service 90 .
- the aircraft 94 may be scheduled for routine maintenance and service 92 (which may also include modification, reconfiguration, refurbishment, and so on).
- Each of the processes of method 78 may be performed or carried out by a system integrator, a third party, and/or an operator (e.g., a customer).
- a system integrator may include without limitation any number of aircraft manufacturers and major-system subcontractors
- a third party may include without limitation any number of vendors, subcontractors, and suppliers
- an operator may be an airline, leasing company, military entity, service organization, and so on.
- the aircraft 94 produced by exemplary method 78 may include an airframe 98 with a plurality of systems 96 and an interior 100 .
- high-level systems 96 include one or more of a propulsion system 102 , an electrical system 104 , a hydraulic system 106 , and an environmental system 108 . Any number of other systems may be included.
- an aerospace example is shown, the principles of the invention may be applied to other industries, such as the automotive industry.
- the apparatus embodied herein may be employed during any one or more of the stages of the production and service method 78 .
- components or subassemblies corresponding to production process 84 may be fabricated or manufactured in a manner similar to components or subassemblies produced while the aircraft 94 is in service.
- one or more apparatus embodiments may be utilized during the production stages 84 and 86 , for example, by substantially expediting assembly of or reducing the cost of an aircraft 94 .
- one or more apparatus embodiments may be utilized while the aircraft 94 is in service, for example and without limitation, to maintenance and service 92 .
Landscapes
- Chemical & Material Sciences (AREA)
- Dispersion Chemistry (AREA)
- Physics & Mathematics (AREA)
- Health & Medical Sciences (AREA)
- Life Sciences & Earth Sciences (AREA)
- Analytical Chemistry (AREA)
- Biochemistry (AREA)
- General Health & Medical Sciences (AREA)
- General Physics & Mathematics (AREA)
- Immunology (AREA)
- Pathology (AREA)
- Length Measuring Devices By Optical Means (AREA)
Abstract
Description
-
- Y-axis servo hunting magnitude and variation;
- Spacing magnitude and variation along scanning direction;
- Interline spacing;
- Optical porosity per unit area (relates to Pd);
- Variance of optical porosity within image;
- Percentage of blocked holes;
- Scanning direction (angle);
Block 212 b. Determine pressure drop through perforated panel based on image statistics
Block 214 a. Format and display pressure drop data for Operator;
-
- a Correlate (map) individual image statistics to part geometry;
- Create and display computer graphic image of part with Pd (pressure drop) indication;
- Identify and display regional specification compliance;
- Record relevant information for future reference and/or documentation; and
Block 220 a. Unloadperforated panel 116 fromsystem 100
Loading and Imaging
Develop Line Membership
-
- Y-axis servo hunting magnitude and variation
- Spacing magnitude and variation along scanning direction
- Interline spacing and distribution
- Optical porosity per unit area (relates to Pd)
- Variance of optical porosity within image
- Percentage of blocked holes and their geometric distribution
- Scanning direction (angle) relative to the sensor
Format and Display Data for Operator
-
- Correlation of individual image statistics to part geometry
- Creation and display of a false-color computer graphic overlay of Pd onto CAD part graphics
- Identification and display of regional compliance to design specification of hole diameter, spacing, and interline distance
- Recording of pertinent information for future reference and/or documentation
Claims (22)
Priority Applications (1)
| Application Number | Priority Date | Filing Date | Title |
|---|---|---|---|
| US12/359,328 US7679746B1 (en) | 2009-01-25 | 2009-01-25 | System and method for measurement of pressure drop through perforated panels |
Applications Claiming Priority (1)
| Application Number | Priority Date | Filing Date | Title |
|---|---|---|---|
| US12/359,328 US7679746B1 (en) | 2009-01-25 | 2009-01-25 | System and method for measurement of pressure drop through perforated panels |
Publications (1)
| Publication Number | Publication Date |
|---|---|
| US7679746B1 true US7679746B1 (en) | 2010-03-16 |
Family
ID=41819532
Family Applications (1)
| Application Number | Title | Priority Date | Filing Date |
|---|---|---|---|
| US12/359,328 Expired - Fee Related US7679746B1 (en) | 2009-01-25 | 2009-01-25 | System and method for measurement of pressure drop through perforated panels |
Country Status (1)
| Country | Link |
|---|---|
| US (1) | US7679746B1 (en) |
Cited By (7)
| Publication number | Priority date | Publication date | Assignee | Title |
|---|---|---|---|---|
| US20110188753A1 (en) * | 2010-02-03 | 2011-08-04 | Fuji Xerox Co., Ltd. | Image processing device, image processing method and computer readable medium |
| US20190130556A1 (en) * | 2017-10-31 | 2019-05-02 | Kabushiki Kaisha Toshiba | Inspection system and inspection method |
| US10688663B2 (en) | 2018-02-01 | 2020-06-23 | Raytheon Technologies Corporation | Automation of airfoil pressure taps for testing holes of an airfoil |
| CN111458341A (en) * | 2020-04-16 | 2020-07-28 | 北京领邦智能装备股份公司 | Workpiece imaging system and method for workpiece imaging |
| JP2021021740A (en) * | 2020-10-20 | 2021-02-18 | 株式会社東芝 | Inspection system and inspection method |
| US20240087135A1 (en) * | 2022-09-09 | 2024-03-14 | Applied Materials, Inc. | Clog detection via image analytics |
| WO2024233230A1 (en) * | 2023-05-09 | 2024-11-14 | Applied Materials, Inc. | Automated optical inspection tool |
Citations (1)
| Publication number | Priority date | Publication date | Assignee | Title |
|---|---|---|---|---|
| US5210021A (en) * | 1991-03-20 | 1993-05-11 | Neuro Probe, Inc. | Multiple-site chemotactic test apparatus and method |
-
2009
- 2009-01-25 US US12/359,328 patent/US7679746B1/en not_active Expired - Fee Related
Patent Citations (1)
| Publication number | Priority date | Publication date | Assignee | Title |
|---|---|---|---|---|
| US5210021A (en) * | 1991-03-20 | 1993-05-11 | Neuro Probe, Inc. | Multiple-site chemotactic test apparatus and method |
Cited By (14)
| Publication number | Priority date | Publication date | Assignee | Title |
|---|---|---|---|---|
| US20110188753A1 (en) * | 2010-02-03 | 2011-08-04 | Fuji Xerox Co., Ltd. | Image processing device, image processing method and computer readable medium |
| US8538196B2 (en) * | 2010-02-03 | 2013-09-17 | Fuji Xerox Co., Ltd. | Image processing device, image processing method and computer readable medium |
| US10902578B2 (en) * | 2017-10-31 | 2021-01-26 | Kabushiki Kaisha Toshiba | Inspection system and inspection method |
| JP2019082455A (en) * | 2017-10-31 | 2019-05-30 | 株式会社東芝 | Inspection system and inspection method |
| US20190130556A1 (en) * | 2017-10-31 | 2019-05-02 | Kabushiki Kaisha Toshiba | Inspection system and inspection method |
| US20210110530A1 (en) * | 2017-10-31 | 2021-04-15 | Kabushiki Kaisha Toshiba | Inspection system and inspection method |
| US11734811B2 (en) * | 2017-10-31 | 2023-08-22 | Kabushiki Kaisha Toshiba | Inspection system and inspection method |
| US10688663B2 (en) | 2018-02-01 | 2020-06-23 | Raytheon Technologies Corporation | Automation of airfoil pressure taps for testing holes of an airfoil |
| CN111458341A (en) * | 2020-04-16 | 2020-07-28 | 北京领邦智能装备股份公司 | Workpiece imaging system and method for workpiece imaging |
| JP2021021740A (en) * | 2020-10-20 | 2021-02-18 | 株式会社東芝 | Inspection system and inspection method |
| US20240087135A1 (en) * | 2022-09-09 | 2024-03-14 | Applied Materials, Inc. | Clog detection via image analytics |
| US12136225B2 (en) * | 2022-09-09 | 2024-11-05 | Applied Materials, Inc. | Clog detection via image analytics |
| WO2024233230A1 (en) * | 2023-05-09 | 2024-11-14 | Applied Materials, Inc. | Automated optical inspection tool |
| US20240377334A1 (en) * | 2023-05-09 | 2024-11-14 | Applied Materials, Inc. | Automated optical inspection tool |
Similar Documents
| Publication | Publication Date | Title |
|---|---|---|
| US11774735B2 (en) | System and method for performing automated analysis of air samples | |
| US7679746B1 (en) | System and method for measurement of pressure drop through perforated panels | |
| KR100924986B1 (en) | Defect detecting apparatus, defect detecting method, information processing apparatus, information processing method, and program therefor | |
| EP1995553B1 (en) | System and method for identifying a feature of a workpiece | |
| DE112007002927B4 (en) | Error detection apparatus, error detection method, information processing apparatus, information processing method and program therefor | |
| CN102084214B (en) | Accurate image acquisition for structured-light system for optical shape and positional measurements | |
| US7495758B2 (en) | Apparatus and methods for two-dimensional and three-dimensional inspection of a workpiece | |
| EP4195142A1 (en) | System for detecting the defects of the wooden boards and their classification into quality classes | |
| US12387312B2 (en) | Production-speed component inspection system and method | |
| JP2008139201A (en) | Defect detection device, defect detection method, information processing device, information processing method, and program thereof | |
| Morgan et al. | Selection and installation of high resolution imaging to monitor the PBFAM process, and synchronization to post-build 3D computed tomography | |
| US20250102294A1 (en) | System for in-process inspection of fused-filament fabricated parts and associated methods | |
| KR100950270B1 (en) | Mobile phone lens resolution automatic inspection device | |
| US12415619B2 (en) | Metrological inspection system for aircraft | |
| CN119290891B (en) | Target pill positioning circle measurement defect detection method and device based on SOD-YOLOv model | |
| CN121391774A (en) | Methods, apparatus, equipment and storage media for detecting fabric defects | |
| JPH0894339A (en) | Method for inspecting failure in object surface shape | |
| CN120778759A (en) | Automatic detection equipment and system for automobile tire defects | |
| CN120876388A (en) | Automatic optical detection method and device, storage medium and electronic terminal | |
| CN120594551A (en) | A SMT patch optical detection method | |
| CN121121174A (en) | Visual inspection methods, devices, equipment and storage media for electronic components | |
| WO2025040472A1 (en) | Method and device for inspecting a reflective surface | |
| JP2000249528A (en) | Line sensor camera |
Legal Events
| Date | Code | Title | Description |
|---|---|---|---|
| AS | Assignment |
Owner name: BOEING COMPANY, THE,ILLINOIS Free format text: ASSIGNMENT OF ASSIGNORS INTEREST;ASSIGNOR:WALTON, STEVEN R.;REEL/FRAME:022152/0393 Effective date: 20090115 |
|
| STCF | Information on status: patent grant |
Free format text: PATENTED CASE |
|
| FPAY | Fee payment |
Year of fee payment: 4 |
|
| MAFP | Maintenance fee payment |
Free format text: PAYMENT OF MAINTENANCE FEE, 8TH YEAR, LARGE ENTITY (ORIGINAL EVENT CODE: M1552) Year of fee payment: 8 |
|
| FEPP | Fee payment procedure |
Free format text: MAINTENANCE FEE REMINDER MAILED (ORIGINAL EVENT CODE: REM.); ENTITY STATUS OF PATENT OWNER: LARGE ENTITY |
|
| LAPS | Lapse for failure to pay maintenance fees |
Free format text: PATENT EXPIRED FOR FAILURE TO PAY MAINTENANCE FEES (ORIGINAL EVENT CODE: EXP.); ENTITY STATUS OF PATENT OWNER: LARGE ENTITY |
|
| STCH | Information on status: patent discontinuation |
Free format text: PATENT EXPIRED DUE TO NONPAYMENT OF MAINTENANCE FEES UNDER 37 CFR 1.362 |
|
| FP | Lapsed due to failure to pay maintenance fee |
Effective date: 20220316 |