US6506148B2 - Nervous system manipulation by electromagnetic fields from monitors - Google Patents
Nervous system manipulation by electromagnetic fields from monitors Download PDFInfo
- Publication number
- US6506148B2 US6506148B2 US09/872,528 US87252801A US6506148B2 US 6506148 B2 US6506148 B2 US 6506148B2 US 87252801 A US87252801 A US 87252801A US 6506148 B2 US6506148 B2 US 6506148B2
- Authority
- US
- United States
- Prior art keywords
- image
- pulsing
- monitor
- frequency
- pulsed
- Prior art date
- Legal status (The legal status is an assumption and is not a legal conclusion. Google has not performed a legal analysis and makes no representation as to the accuracy of the status listed.)
- Expired - Lifetime
Links
Images


Classifications
-
- A—HUMAN NECESSITIES
- A61—MEDICAL OR VETERINARY SCIENCE; HYGIENE
- A61N—ELECTROTHERAPY; MAGNETOTHERAPY; RADIATION THERAPY; ULTRASOUND THERAPY
- A61N2/00—Magnetotherapy
Definitions
- the invention relates to the stimulation of the human nervous system by an electromagnetic field applied externally to the body.
- Wiener (1958) in a discussion of the bunching of brain waves through nonlinear interactions.
- the electric field was arranged to provide “a direct electrical driving of the brain”.
- Wiener describes the field as set up by a 10 Hz alternating voltage of 400 V applied in a room between ceiling and ground.
- Brennan (1992) describes in U.S. Pat. No. 5,169,380 an apparatus for alleviating disruptions in circadian rythms of a mammal, in which an alternating electric field is applied across the head of the subject by two electrodes placed a short distance from the skin.
- a device involving a field electrode as well as a contact electrode is the “Graham Potentializer” mentioned by Hutchison (1991). This relaxation device uses motion, light and sound as well as an alternating electric field applied mainly to the head.
- the contact electrode is a metal bar in Ohmic contact with the bare feet of the subject, and the field electrode is a hemispherical metal headpiece placed several inches from the subject's head.
- the observed effects include ptosis of the eyelids, relaxation, drowziness, the feeling of pressure at a centered spot on the lower edge of the brow, seeing moving patterns of dark purple and greenish yellow with the eyes closed, a tonic smile, a tense feeling in the stomach, sudden loose stool, and sexual excitement, depending on the precise frequency used, and the skin area to which the field is applied.
- the sharp frequency dependence suggests involvement of a resonance mechanism.
- the resonance can be excited not only by externally applied pulsed electric fields, as discussed in U.S. Pat. Nos. 5,782,874, 5,899,922, 6,081,744, and 6,167,304, but also by pulsed magnetic fields, as described in U.S. Pat. Nos. 5,935,054 and 6,238,333, by weak heat pulses applied to the skin, as discussed in U.S. Pat. Nos. 5,800,481 and 6,091,994, and by subliminal acoustic pulses, as described in U.S. Pat. No. 6,017,302. Since the resonance is excited through sensory pathways, it is called a sensory resonance. In addition to the resonance near 1 ⁇ 2 Hz, a sensory resonance has been found near 2.4 Hz. The latter is characterized by the slowing of certain cortical processes, as discussed in the '481, '922, '302, '744, '944, and '304 patents.
- the signal to noise ratio (S/N) for the fm signal contained in the spike trains along the afferent nerves is so small as to make recovery of the fm signal from a single nerve fiber impossibile.
- S/N signal to noise ratio
- application of the field over a large skin area causes simultaneous stimulation of many cutaneous nerves, and the fm modulation is then coherent from nerve to nerve. Therefore, if the afferent signals are somehow summed in the brain, the fm modulations add while the spikes from different nerves mix and interlace. In this manner the S/N can be increased by appropriate neural processing.
- Another increase in sensitivity is due to involving a resonance mechanism, wherein considerable neural circuit oscillations can result from weak excitations.
- ptosis of the eyelids An easily detectable physiological effect of an excited 1 ⁇ 2 Hz sensory resonance is ptosis of the eyelids.
- the ptosis test involves first closing the eyes about half way. Holding this eyelid position, the eyes are rolled upward, while giving up voluntary control of the eyelids. The eyelid position is then determined by the state of the autonomic nervous system. Furthermore, the pressure excerted on the eyeballs by the partially closed eyelids increases parasympathetic activity. The eyelid position thereby becomes somewhat labile, as manifested by a slight flutter. The labile state is sensitive to very small shifts in autonomic state.
- the ptosis influences the extent to which the pupil is hooded by the eyelid, and thus how much light is admitted to the eye. Hence, the depth of the ptosis is seen by the subject, and can be graded on a scale from 0 to 10.
- the ptosis frequency defined as the stimulation frequency for which maximum ptosis is obtained.
- This drift is believed to be caused by changes in the chemical milieu of the resonating neural circuits. It is thought that the resonance causes perturbations of chemical concentrations somewhere in the brain, and that these perturbations spread by diffusion to nearby resonating circuits. This effect, called “chemical detuning”, can be so strong that ptosis is lost altogether when the stimulation frequency is kept constant in the initial stages of the excitation. Since the stimulation then falls somewhat out of tune, the resonance decreases in amplitude and chemical detuning eventually diminishes.
- the stimulation frequencies at which specific physiological effects occur depend somewhat on the autonomic nervous system state, and probably on the endocrine state as well.
- Computer monotors and TV monitors can be made to emit weak low-frequency electromagnetic fields merely by pulsing the intensity of displayed images.
- 1 ⁇ 2 Hz sensory resonance can be excited in this manner in a subject near the monitor.
- the 2.4 Hz sensory resonance can also be excited in this fashion.
- a TV monitor or computer monitor can be used to manipulate the nervous system of nearby people.
- the implementations of the invention are adapted to the source of video stream that drives the monitor, be it a computer program, a TV broadcast, a video tape or a digital video disc (DVD).
- the image pulses can be produced by a suitable computer program.
- the pulse frequency may be controlled through keyboard input, so that the subject can tune to an individual sensory resonance frequency.
- the pulse amplitude can be controlled as well in this manner.
- a program written in Visual Basic(R) is particularly suitable for use on computers that run the Windows 95(R) or Windows 98(R) operating system. The structure of such a program is described. Production of periodic pulses requires an accurate timing procedure. Such a procedure is constructed from the GetTimeCount function available in the Application Program Interface (API) of the Windows operating system, together with an extrapolation procedure that improves the timing accuracy.
- API Application Program Interface
- Pulse variability can be introduced through software, for the purpose of thwarting habituation of the nervous system to the field stimulation, or when the precise resonance frequency is not known.
- the variability may be a pseudo-random variation within a narrow interval, or it can take the form of a frequency or amplitude sweep in time.
- the pulse variability may be under control of the subject.
- the program that causes a monitor to display a pulsing image may be run on a remote computer that is connected to the user computer by a link; the latter may partly belong to a network, which may be the Internet.
- the image pulsing may be inherent in the video stream as it flows from the video source, or else the stream may be modulated such as to overlay the pulsing.
- a live TV broadcast can be arranged to have the feature imbedded simply by slightly pulsing the illumination of the scene that is being broadcast. This method can of course also be used in making movies and recording video tapes and DVDs.
- Video tapes can be edited such as to overlay the pulsing by means of modulating hardware.
- a simple modulator is discussed wherein the luminance signal of composite video is pulsed without affecting the chroma signal. The same effect may be introduced at the consumer end, by modulating the video stream that is produced by the video source.
- a DVD can be edited through software, by introducing pulse-like variations in the digital RGB signals. Image intensity pulses can be overlaid onto the analog component video output of a DVD player by modulating the luminance signal component.
- a television signal can be modulated such as to cause pulsing of the image intensity by means of a variable delay line that is connected to a pulse generator.
- Certain monitors can emit electromagnetic field pulses that excite a sensory resonance in a nearby subject, through image pulses that are so weak as to be subliminal. This is unfortunate since it opens a way for mischievous application of the invention, whereby people are exposed unknowingly to manipulation of their nervous systems for someone else's purposes. Such application would be unethical and is of course not advocated. It is mentioned here in order to alert the public to the possibility of covert abuse that may occur while being online, or while watching TV, a video, or a DVD.
- FIG. 1 illustrates the electromagnetic field that emanates from a monitor when the video signal is modulated such as to cause pulses in image intensity, and a nearby subject who is exposed to the field.
- FIG. 2 shows a circuit for modulation of a composite video signal for the purpose of pulsing the image intensity.
- FIG. 3 shows the circuit for a simple pulse generator.
- FIG. 4 illustrates how a pulsed electromagnetic field can be generated with a computer monitor.
- FIG. 5 shows a pulsed electromagnetic field that is generated by a television set through modulation of the RF signal input to the TV.
- FIG. 6 outlines the structure of a computer program for producing a pulsed image.
- FIG. 7 shows an extrapolation procedure introduced for improving timing accuracy of the program of FIG. 6 .
- FIG. 8 illustrates the action of the extrapolation procedure of FIG. 7 .
- FIG. 9 shows a subject exposed to a pulsed electromagnetic field emanating from a monitor which is responsive to a program running on a remote computer via a link that involves the Internet.
- FIG. 10 shows the block diagram of a circuit for frequency wobbling of a TV signal for the purpose of pulsing the intensity of the image displayed on a TV monitor.
- FIG. 11 depicts schematically a recording medium in the form of a video tape with recorded data, and the attribute of the signal that causes the intensity of the displayed image to be pulsed.
- FIG. 12 illustrates how image pulsing can be embedded in a video signal by pulsing the illumination of the scene that is being recorded.
- FIG. 13 shows a routine that introduces pulse variability into the computer program of FIG. 6 .
- FIG. 14 shows schematically how a CRT emits an electromagnetic field when the displayed image is pulsed.
- FIG. 15 shows how the intensity of the image displayed on a monitor can be pulsed through the brightness control terminal of the monitor.
- FIG. 16 illustrates the action of the polarization disc that serves as a model for grounded conductors in the back of a CRT screen.
- FIG. 17 shows the circuit for overlaying image intensity pulses on a DVD output.
- FIG. 18 shows measured data for pulsed electric fields emitted by two different CRT type monitors, and a comparison with theory.
- Computer monitors and TV monitors emit electromagnetic fields. Part of the emission occurs at the low frequencies at which displayed images are changing. For instance, a rythmic pulsing of the intensity of an image causes electromagnetic field emission at the pulse frequency, with a strength proportional to the pulse amplitude. The field is briefly referred to as “screen emission”. In discussing this effect, any part or all what is displayed on the monitor screen is called an image.
- a monitor of the cathode ray tube (CRT) type has three electron beams, one for each of the basic colors red, green, and blue. The intensity of an image is here defined as
- jr, jg, and jb being the electric current densities in the red, green, and blue electron beams at the surface area dA of the image on the screen.
- the current densities are to be taken in the distributed electron beam model, where the discreteness of pixels and the raster motion of the beams are ignored, and the back of the monitor screen is thought to be irradiated by diffuse electron beams.
- the beam current densities are then functions of the coordinates x and y over the screen.
- the model is appropriate since we are interested in the electromagnetic field emision caused by image pulsing with the very low frequencies of sensory resonances, whereas the emissions with the much higher horizontal and vertical sweep frequencies are of no concern.
- For a CRT the intensity of an image is expressed in millamperes.
- R, G, and B are the intensities of the pixel respectively in red, green and blue, normalized such as to range from 0 to 1.
- the definition (3) was provided by the Commission Internationale de l'Eclairage (CIE), in order to account for brightness differences at different colors, as perceived by the human visual system.
- CIE Commission Internationale de l'Eclairage
- the hue of the pixel is determined by the chroma signal or chrominance, which has the components R-Y and B-Y It follows that pulsing pixel luminance while keeping the hue fixed is equivalent to pulsing the pixel intensity, up to an amplitude factor. This fact will be relied upon when modulating a video stream such as to overlay image intensity pulses.
- the screen emission has a multipole expansion wherein both monopole and dipole contributions are proportional to the rate of change of the intensity I of (1).
- the higher order multipole contributions are proportional to the rate of change of moments of the current density j over the image, but since these contributions fall off rapidly with distance, they are not of practical importance in the present context.
- Pulsing the intensity of an image may involve different pulse amplitudes, frequencies, or phases for different parts of the image. Any or all of these features may be under subject control.
- the RGB values are modulated by small pulses ⁇ R, ⁇ G, ⁇ B, with a frequency that can be chosen by the subject or is swept in a predetermined manner.
- the ratios ⁇ R/R, ⁇ G/G, and ⁇ B/B were always smaller than 0.02, so that the image pulses are quite weak.
- the subject experienced physiological effects that are known to accompany the excitation of the 1 ⁇ 2 Hz sensory resonance as mentioned in the Background Section.
- the measured field pulse amplitudes fall within the effective intensity window for the 1 ⁇ 2 Hz resonance, as explored in earlier experiments and discussed in the '874, '744, '922, and '304 patents.
- Other experiments have shown that the 2.4 Hz sensory resonance can be exited as well by screen emissions from monitors that display pulsed images.
- the various implementations of the invention are adapted to the different sources of video stream, such as video tape, DVD, a computer program, or a TV broadcast through free space or cable.
- the subject is exposed to the pulsed electromagnetic field that is generated by the monitor as the result of image intensity pulsing.
- Certain cutaneous nerves of the subject exhibit spontaneous spiking in patterns which, although rather random, contain sensory information at least in the form of average frequency.
- Some of these nerves have receptors that respond to the field stimulation by changing their average spiking frequency, so that the spiking patterns of these nerves acquire a frequency modulation, which is conveyed to the brain.
- the modulation can be particularly effective if it has a frequency at or near a sensory resonance frequency. Such frequencies are expected to lie in the range from 0.1 to 15 Hz.
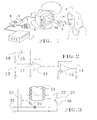
- FIG. 1 An embodiment of the invention adapted to a VCR is shown in FIG. 1, where a subject 4 is exposed to a pulsed electric field 3 and a pulsed magnetic field 39 that are emitted by a monitor 2 , labeled “MON”, as the result of pulsing the intensity of the displayed image.
- the image is here generated by a video casette recorder 1 , labeled “VCR”, and the pulsing of the image intensity is obtained by modulating the composite video signal from the VCR output. This is done by a video modulator 5 , labeled “VM”, which responds to the signal from the pulse generator 6 , labeled “GEN”.
- the frequency and amplitude of the image pulses can be adjusted with the frequency control 7 and amplitude control 8 . Frequency and amplitude adjustments can be made by the subject.
- the circuit of the video modulator 5 of FIG. 1 is shown in FIG. 2, where the video amplifiers 11 and 12 process the composite video signal that enters at the input terminal 13 .
- the level of the video signal is modulated slowly by injecting a small bias current at the inverting input 17 of the first amplifier 11 .
- This current is caused by voltage pulses supplied at the modulation input 16 , and can be adjusted through the potentiometer 15 . Since the noninverting input of the amplifier is grounded, the inverting input 17 is kept essentially at ground potential, so that the bias current is is not influenced by the video signal.
- the inversion of the signal by the first amplifier 11 is undone by the second amplifier 12 .
- the gains of the amplifiers are chosen such as to give a unity overall gain.
- a slowly varying current injected at the inverting input 17 causes a slow shift in the “pseudo-dc” level of the composite video signal, here defined as the short-term average of the signal. Since the pseudo-dc level of the chroma signal section determines the luminance, the latter is modulated by the injected current pulses. The chroma signal is not affected by the slow modulation of the pseudodc level, since that signal is determined by the amplitude and phase with respect to the color carrier which is locked to the color burst. The effect on the sync pulses and color bursts is of no consequence either if the injected current pulses are very small, as they are in practice.
- FIG. 3 shows a pulse generator that is suitable for this purpose, wherein the RC timer 21 (Intersil ICM7555) is hooked up for astable operation and produces a square wave voltage with a frequency that is determined by capacitor 22 and potentiometer 23 .
- the timer 21 is powered by a battery 26 , controlled by the switch 27 .
- the square wave voltage at output 25 drives the LED 24 , which may be used for monitoring of the pulse frequency, and also serves as power indicator.
- the pulse output may be rounded in ways that are well known in the art.
- the output of VCR 1 is connected to the video input 13 of FIG. 2, and the video output 14 is connected to the monitor 2 of FIG. 1 .
- the image intensity pulsing is caused by a computer program.
- monitor 2 labeled “MON”
- computer 31 labeled “COMPUTER”
- the subject 4 can provide input to the computer through the keyboard 32 that is connected to the computer by the connection 33 .
- This input may involve adjustments of the frequency or the amplitude or the variability of the image intensity pulses.
- the pulse frequency can be set to a sensory resonance frequency of the subject for the purpose of exciting the resonance.
- FIG. 6 The structure of a computer program for pulsing image intensity is shown in FIG. 6 .
- the program may be written in Visual Basic(R) version 6.0 (VB 6 ), which involves the graphics interface familiar from the Windows(R) operating system.
- the images appear as forms equipped with user controls such as command buttons and scroll bars, together with data displays such as text boxes.
- a compiled VB 6 program is an executable file.
- the program When activated, the program declares variables and functions to be called from a dynamic link library (DLL) that is attached to the operating system; an initial form load is performed as well.
- DLL dynamic link library
- the latter comprises setting the screen color as specified by integers R, G, and B in the range 0 to 255, as mentioned above.
- the initial setting of the screen color is labeled as 50 .
- the sine function is distorted by the rounding to integer RGB values that occurs in the VB 6 program.
- the image is chosen to fill as much of the screen area as possible, and it has spatially uniform luminance and hue.
- the form appearing on the monitor displays a command button for starting and stopping the image pulsing, together with scroll bars 52 and 53 respectively for adjustment of the pulse frequency F and the pulse amplitude A.
- These pulses could be initiated by a system timer which is activated upon the elapse of a preset time interval.
- timers in VB 6 are too inaccurate for the purpose of providing the eight RGB adjustment points in each pulse cycle.
- An improvement can be obtained by using the GetTickCount function that is available in the Application Program Interface (API) of Windows 95(R) and Windows 98(R).
- the GetTickCount function returns the system time that has elapsed since starting Windows, expressed in milliseconds.
- User activation of the start button 54 provides a tick count TN through request 55 and sets the timer interval to TT miliseconds, in step 56 .
- TT was previously calculated in the frequency routine that is activated by changing the frequency, denoted as step 52 .
- VB 6 is an event-driven program
- the flow chart for the program falls into disjoint pieces.
- the timer runs in the background while the program may execute subroutines such as adjustment of pulse frequency or amplitude.
- the timer subroutine 57 starts execution with request 58 for a tick count, and in 59 an upgrade is computed of the time TN for the next point at which the RGB values are to be adjusted.
- the timer is turned off, to be reactivated later in step 67 .
- Step 59 also resets the parameter CR which plays a role in the extrapolation procedure 61 and the condition 60 .
- step 62 is to be ignored also, since it has to do with the actual extrapolation procedure 61 .
- the increments to the screen colors R 1 , G 1 , and B 1 at the new phase point are computed according to the sine function, applied with the amplitude A that was set by the user in step 53 .
- step 67 the timer is reactivated in step 67 , initiating a new 1 ⁇ 8-cycle step in the periodic progression of RGB adjustments.
- a program written in this way would exhibit a large jitter in the times at which the RGB values are changed. This is due to the lumpiness in the tick counts returned by the GetTickCount function.
- the full extrapolation procedure 61 is introduced in order to diminish the jitter to acceptable levels. The procedure works by refining the heavy-line staircase function shown in FIG.
- the process is repeated until the condition 73 is met when the remaining time MR jumps down through the 15 ms level, shown in FIG. 8 as the transition 83 .
- the condition 73 then directs the logic flow to the assignments 76 , in which the number DM labeled by 83 is computed, and FLG 1 is set.
- the computation of DM is required for finding the slope RR of the straight-line element 85 .
- the condition 78 is met, so that the assignments 79 are executed. This includes computation of the slope RR of the line element 85 , setting FLG 2 , and resetting FLG 1 . From here on, the extrapolation procedure increments CR in steps of RR while skipping tick counts until condition 60 of FIG. 6 is violated, the loop is exited, and the RGB values are adjusted.
- a delay block 74 is used in order to stretch the time required for traversing the extrapolation procedure.
- the block can be any computation intensive subroutine such as repeated calculations of tangent and arc tangent functions.
- the timer interval TT is set to 4/10 of the time TA from one RGB adjustment point to the next. Since the timer runs in the background, this arrangement provides an opportunity for execution of other processes such as user adjustment of frequency or amplitude of the pulses.
- the adjustment of the frequency and other pulse parameters of the image intensity modulation can be made internally, i.e., within the running program.
- Such internal control is to be distinguished from the external control provided, for instance, in screen savers.
- the frequency of animation can be modified by the user, but only after having exited the screen saver program.
- Windows 95(R) or Windows 98(R) to change the animation frequency requires stopping the screen saver execution by moving the mouse, whereafter the frequency may be adjusted through the control panel.
- the requirement that the control be internal sets the present program apart from so-called banners as well.
- the program may be run on a remote computer that is linked to the user computer, as illustrated in FIG. 9 .
- the monitor 2 labeled “MON”
- the program that pulses the images on the monitor 2 runs on the remoter computer 90 , labeled “REMOTE COMPUTER”, which is connected to computer 31 ′ through a link 91 which may in part belong to a network.
- the network may comprise the Internet 92 .
- FIG. 5 shows such an arrangement, where the pulsing of the image intensity is achieved by inducing a small slowly pulsing shift in the frequency of the RF signal that enters from the antenna. This process is here called “frequency wobbling” of the RF signal.
- FM TV a slight slow frequency wobble of the RF signal produces a pseudo-dc signal level fluctuation in the composite video signal, which in turn causes a slight intensity fluctuation of the image displayed on the monitor in the same manner as discussed above for the modulator of FIG. 2 .
- FIG. 10 shows a block diagram of the frequency wobbler circuit that employs a variable delay line 94 , labelled “VDL”. The delay is determined by the signal from pulse generator 6 , labelled “GEN”. The frequency of the pulses can be adjusted with the tuning control 7 . The amplitude of the pulses is determined by the unit 98 , labelled “MD”, and can be adjusted with the amplitude control 41 .
- the input to the delay line may be routed through a preprocessor 93 , labelled “PRP”, which may comprise a selective RF amplifier and down converter; a complimentary up conversion should then be performed on the delay line output by a postprocessor 95 , labelled “POP”.
- PRP preprocessor 93
- POP postprocessor 95
- the output 97 is to be connected to the antenna terminal of the TV set.
- variable delay line 94 The action of the variable delay line 94 may be understood as follows. Let periodic pulses with period L be presented at the input. For a fixed delay the pulses would emerge at the output with the same period L. Actually, the time delay T is varied slowly, so that it increases approximately by LdT/dt between the emergence of consecutive pulses at the device output. The pulse period is thus increased approximately by
- the delay line may have to be implemented as a digital device. To do so is well within the present art. In that case it is natural to also choose digital implementations for the pulse generator 6 and the pulse amplitude controller 98 , either as hardware or as software.
- Pulse variability may be introduced for alleviating the need for precise tuning to a resonance frequency. This may be important when sensory resonance frequencies are not precisely known, because of the variation among individuals, or in order to cope with the frequency drift that results from chemical detuning that is discussed in the '874 patent. A field with suitably chosen pulse variability can then be more effective than a fixed frequency field that is out of tune. One may also control tremors and seizures, by interfering with the pathological oscillatory activity of neural circuits that occurs in these disorders. Electromagnetic fields with a pulse variability that results in a narrow spectrum of frequencies around the frequency of the pathological oscillatory activity may then evoke nerve signals that cause phase shifts which diminish or quench the oscillatory activity.
- Pulse variability can be introduced as hardware in the manner described in the '304 patent.
- the variability may also be introduced in the computer program of FIG. 6, by setting FLG 3 in step 68 , and choosing the amplitude B of the frequency fluctuation.
- FLG 3 is detected in step 47 , whereupon in steps 48 and 49 the pulse frequency F is modified pseudo randomly by a term proportional to B, every 4th cycle.
- the amplitude of the image intensity pulsing may be modified as well, in similar fashion.
- the frequency and amplitude may be swept through an adjustable ramp, or according to any suitable schedule, in a manner known to those skilled in the art.
- the pulse variability may be applied to subliminal image intensity pulses.
- intensity pulses of the image may simply be imbedded in the program material.
- the means for pulsing the image intensity may comprise an attribute of recorded data.
- the pulsing may be subliminal.
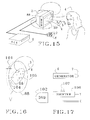
- FIG. 11 shows a video signal record on part of a video tape 28 . Depicted schematically are segments of the video signal in intervals belonging to lines in three image frames at different places along the tape. In each segment, the chroma signal 9 is shown, with its short-term average level 29 represented as a dashed line.
- the short-term average signal level also called the pseudo-dc level, represents the luminance of the image pixels. Over each segment, the level is here constant because the image is for simplicity chosen as having a uniform luminance over the screen. However, the level is seen to vary from frame to frame, illustrating a luminance that pulses slowly over time. This is shown in the lower portion of the drawing, wherein the IRE level of the short-term chroma signal average is plotted versus time. The graph further shows a gradual decrease of pulse amplitude in time, illustrating that luminance pulse amplitude variations may also be an attribute of the recorded data on the video tape. As discussed, pulsing the luminance for fixed chrominance results in pulsing of the image intensity.
- Data stream attributes that represent image intensity pulses on video tape or in TV signals may be created when producing a video rendition or making a moving picture of a scene, simply by pulsing the illumination of the scene.
- FIG. 12 shows a scene 19 that is recorded with a video camera 18 , labelled “VR”.
- the scene is illuminated with a lamp 20 , labelled “LAMP”, energized by an electric current through a cable 36 .
- the current is modulated in pulsing fashion by a modulator 30 , labeled “MOD”, which is driven by a pulse generator 6 , labelled “GENERATOR”, that produces voltage pulses 35 .
- a modulator 30 labeled “MOD”
- GENERATOR a pulse generator 6
- the brightness of monitors can usually be adjusted by a control, which may be addressable through a brightness adjustment terminal. If the control is of the analog type, the displayed image intensity may be pulsed as shown in FIG. 15, simply by a pulse generator 6 , labeled “GEN”, that is connected to the brigthness adjustment terminal 88 of the monitor 2 , labeled “MON”. Equivalent action can be provided for digital brightness controls, in ways that are well known in the art.
- the analog component video signal from a DVD player may be modulated such as to overlay image intensity pulses in the manner illustrated in FIG. 17 .
- the overlay is accomplished simply by shifting the luminance with a voltage pulse from generator 6 , labeled “GENERATOR”.
- the generator output is applied to modulator 106 , labeled “SHIFTER”. Since the luminance Y is pulsed without changing the chrominance C, the image intensity is pulsed.
- the frequency and amplitude of the image intensity pulses can be adjusted respectively with the tuner 7 and amplitude control 107 .
- the modulator 105 has the same structure as the modulator of FIG.
- the pulse amplitude control 107 operates the potentiometer 15 of FIG. 2 .
- the same procedure can be followed for editing a DVD such as to overlay image intensity pulses, by processing the modulated luminance signal through an analog-to-digital converter, and recording the resulting digital stream onto a DVD, after appropriate compression.
- the digital luminance data can be edited by electronic reading of the signal, decompression, altering the digital data by software, and recording the resulting digital signal after proper compression, all in a manner that is well known in the art.
- FIG. 14 The mechanism whereby a CRT-type monitor emits a pulsed electromagnetic field when pulsing the intensity of an image is illustrated in FIG. 14 .
- the image is produced by an electron beam 10 which impinges upon the backside 88 of the screen, where the collisions excite phosphors that subsequently emit light.
- the electron beam deposits electrons 18 on the screen, and these electrons contribute to an electric field 3 labelled “E”.
- the electrons flow along the conductive backside 88 of the screen to the terminal 99 which is hooked up to the high-voltage supply 40 , labelled “HV”.
- the circuit is completed by the ground connection of the supply, the video amplifier 87 , labeled “VA”, and its connection to the cathodes of the CRT.
- the electron beams of the three electron guns are collectively shown as 10 , and together the beams carry a current J.
- the electric current J flowing through the described circuit induces a magnetic field 39 , labeled “B”.
- B a magnetic field
- the conductive back surface 88 of the screen provides a continuum of paths from the beam impact point to the high-voltage terminal 99 .
- the magnetic fields induced by the currents along these paths partially cancel each other, and the resulting field depends on the location of the pixel that is addressed. Since the beams sweep over the screen through a raster of horizontal lines, the spectrum of the induced magnetic field contains strong peaks at the horizontal and vertical frequencies.
- the interest here is not in fields at those frequencies, but rather in emissions that result from an image pulsing with the very low frequencies appropriate to sensory resonances.
- a diffuse electron current model suffices, in which the pixel discreteness and the raster motion of the electron beams are ignored, so that the beam current becomes diffuse and fills the cone subtended by the displayed image.
- the resulting low-frequency magnetic field depends on the temporal changes in the intensity distribution over the displayed image. Order-of-magnitude estimates show that the low-frequency magnetic field, although quite small, may be sufficient for the excitation of sensory resonances in subjects located at a normal viewing distance from the monitor.
- the monitor also emits a low-frequency electric field at the image pulsing frequency. This field is due in part to the electrons 18 that are deposited on the screen by the electron beams 10 .
- screen conditions are considered functions of the time t and of the Cartesian coordinates x and y over a flat CRT screen.
- the screen electrons 18 that are dumped onto the back of the screen by the sum j(x,y,t) of the diffuse current distributions in the red, green, and blue electron beams cause a potential distribution V(x,y,t) which is influenced by the surface conductivity ⁇ on the back of the screen and by capacitances.
- a potential distribution V(x,y,t) over the screen implies a surface charge density distribution
- the partial differential equation (9) requires a boundary condition for the solution V(x,y,t) to be unique. Such a condition is provided by setting the potential at the rim of the screen equal to the fixed anode voltage. This is a good approximation, since the resistance R r between the screen rim and the anode terminal is chosen small in CRT design, in order to keep the voltage loss JR r to a minimum, and also to limit low-frequency emissions.
- V′′+V′′/r ⁇ i 2 ⁇ cn V ⁇ J ⁇ /A, r ⁇ R, (10)
- the potential distribution V(r) of ( 11 ) along the screen is of course accompanied by electric charges.
- the field lines emanating from these charges run mainly to conductors behind the screen that belong to the CRT structure and that are either grounded or connected to circuitry with a low impedance path to ground. In either case the mentioned conductors must be considered grounded in the analysis of charges and fields that result from the pulsed component J of the total electron beam current.
- the described electric field lines end up in electric charges that may be called polarization charges since they are the result of the polarization of the conductors and circuitry by the screen emission.
- FIG. 16 shows the circular CRT screen 88 and the polarization disc 101 , briefly called “plates”. For small distances ⁇ , the capacitance density between the plates of opposite polarity is nearly equal to ⁇ / ⁇ , where ⁇ is the permittivity of free space.
- the charge distributions on the screen and polarization disc are respectively ⁇ V(r)/ ⁇ +q 0 and ⁇ V(r)/ ⁇ +q 0 , where the ⁇ V(r)/ ⁇ terms denote opposing charge densities at the end of the dense field lines that run between the two plates. That the part q 0 is needed as well will become clear in the sequel.
- V( 0 ) is the pulse voltage (11) at the screen center, ⁇ the distance to the rim of the screen, and z the distance to the center of the screen. Note that V( 0 ) pulses harmonically with frequency ⁇ , because in (11) the sinusoidal part J of the beam current varies in this manner.
- the electric field (13) due to the dipole distribution causes a potential distribution V(r)/2 over the screen and a potential distribution of ⁇ V(r)/2 over the polarization disc, where V(r) is nonuniform as given by (11).
- the polarization disc is a perfect conductor it cannot support voltage gradients, and therefore cannot have the potential distribution ⁇ V(r)/2. Instead, the polarization disc is at ground potential. This is where the charge distribution q 0 (r) comes in; it must be such as to induce a potential distribution V(r)/2 over the polarization disc. Since the distance between polarization disc and screen vanishes in the mathematical model, the potential distribution V(r)/2 is induced over the screen as well.
- the total potential over the monitor screen thus becomes V(r) of ( 11 ), while the total potential distribution over the polarization disc becomes uniformly zero. Both these potential distributions are as physically required.
- the electric charges q 0 are moved into position by polarization and are partly drawn from the earth through the ground connection of the CRT.
- the electric field due to the monopole distribution q 0 is calculated in the following manner.
- the charge distribution q 0 (r) is uniquely defined by this condition, it cannot be calculated easily in a straightforward manner.
- the function ⁇ 0 (z) is expanded in powers of z/R for 0 ⁇ z ⁇ R, whereafter the powers z n are replaced by r n P n (cos ⁇ ), where the P n are Legendre polynomials, and (r, ⁇ ) are symmetric spherical coordinates centered at the screen center.
- This procedure amounts to a continuation of the potential from the z-axis into the half ball r ⁇ R, z>0, in such a manner that the Laplace equation is satisfied. The method is discussed by Morse and Feshbach (1953).
- the requirement that this potential be V(r)/2 with the function V(r) given by (11) allows solving for the constants a and b, with the result
- the center-line electric field is the sum of the part (13) due to distributed pulsed dipoles and part (19) due to distributed pulsed monopoles.
- the results may serve as an approximation for other shapes, such as the familiar rounded rectangle, by taking R as the radius of a circle that has the same area as the screen.
- the pulsed electric field due to image intensity pulsing has been measured at several points on the screen center line for pulse frequencies of 1 ⁇ 2 Hz.
- the monitors were the 15′′ computer monitor used in the sensory resonance experiments mentioned above, and a 30′′ TV tube.
- the experimental results need to be compared with the theory derived above. Since R is determined by the screen area, the electric fields given by (13) and (19) have as only free parameter the pulse voltage V( 0 ) at the screen center. The amplitude of this voltage can therefore be determined for the tested monitors by fitting the experimental data to the theoretical results. Prior to fitting, the data were normalized to an image that occupies the entire screen and is pulsed uniformly with a 100% intensity amplitude.
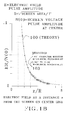
- FIG. 18 shows the theoretical graph 100 , together with the normalized experimental data points 103 for the 15 ⁇ computer monitor and for the 30′′ TV tube.
- FIG. 18 shows that the developed theory agrees fairly well with the experimental results. From the best fit one can find the center-screen voltage pulse amplitudes.
- 266.2 volt for the 15′′ computer monitor and
- 310.1 volt for the 30′′ TV tube. With these amplitudes in hand, the emitted pulsed electric field along the center line of the monitors can be calculated from the sum of the fields (13) and (19).
- the image intensity was pulsed by modifying the R, G, and B values by integer-rounded sine functions ⁇ R(t), ⁇ G(t), and ⁇ B(t), uniformly over the image, except at the button and the data boxes.
- the measured electric field pulse amplitudes were normalized to a pulsed image that occupies all of the screen area and has 100% intensity modulation for which the image pulses between black and the maximum intensity, for the fixed RGB ratios used.
- the image intensity depends on the RGB values in a nonlinear manner that will be be discussed.
- the beam current is a nonlinear function of the driving voltage, i.e., the voltage between cathode and control grid. Since this function is needed in the normalization procedure, it was measured for the 15′′ computer monitor that has been used in the 1 ⁇ 2 Hz sensory resonance experiments and the electric field measurements. Although the beam current density j can be determined, it is easier to measure the luminance, by reading a light meter that is brought right up to the monitor screen. With the RGB values in the VB 6 program taken as the same integer K, the luminance of a uniform image is proportional to the image intensity I. The luminance of a uniform image was measured for various values of K. The results were fitted with
- LCD liquid crystal displays
- TFT thin film technology
- IPS in-plane switching
- the driving electrodes are positioned in a single plane, so that the screen emission is very small.
- the electric field is closely approximated by the fringe field of a two-plate condenser, for the simple case that the image is uniform and extends over the full screen.
- the field on the center line can be readily calculated as due to pulsed dipoles that are uniformly distributed over the screen, with the result
- E d (z) is the amplitude of the pulsed electric field at a distance z from the screen and V is a voltage pulse amplitude, in which the aperture ratio of the LCD has been taken into account.
- Eq. (21) can be used as an approximation for screens of any shape, by taking R as the radius of a circle with the same area as the screen. The result applies to the case that the LCD does not have a ground connection, so that the top and bottom electrodes are at opposite potential, i.e., V/2 and ⁇ V/2.
- the pulsed electric field for screen voltage pulse amplitude V at a distance z from the screen on the center line has an amplitude that is the sum of the parts (21) and (23).
- the resultant electric field in the back is relatively small, due to the change in sign in the monopole field that is caused by the factor z/
- the pulsed electric field emitted by the 3′′ LCD-TFT color screen of the camcorder mentioned above has been measured at eleven points on the center line of the screen, ranging from 4.0 cm to 7.5 cm.
- the experimental data were fitted to the theoretical curve that expresses the sum of the fields (21) and (23).
- the effective screen pulse voltage amplitude V was found to be 2.1 volt.
- the relative standard deviation in V for the fit is 5.1%, which shows that theory and experiment are in fairly good agreement.
- Certain monitors can cause excitation of sensory resonances even when the pulsing of displayed images is subliminal, i.e., unnoticed by the average person.
- a problem arises because of the rounding of RGB values to integers, as occurs in the VB 6 program.
- the sine wave is thereby distorted into a square wave, which is easier to spot.
- a field used at a pulse frequency chosen appropriately for the 1 ⁇ 2 Hz sensory resonance and applied predominantly to the face, is expected to be sufficient for exciting the 1 ⁇ 2 Hz sensory resonance.
- a confirmation experiment was done by running the VB 6 program with the discussed settings and the 15′′ monitor. The center of the subject's face was positioned on the screen center line, at a distance of 60 cm from the screen. A frequency sweep of ⁇ 0.1% per ten cycles was chosen, with an initial pulse frequency of 34 ppm.
- Luminance pulses with fixed chrominance give a change in pixel intensity
- pure chrominance pulses may be combined with pure luminance pulses; an instance of such combination has been mentioned above.
- the subliminal region in color space needs to be explored to determine how marginally subliminal pulses ⁇ R, ⁇ G, and ⁇ B depend on RGB values.
- the condition for image pulses to be subliminal should not be phrased solely in terms of the percentage of intensity pulse amplitude.
- the ptosis test was conducted instead with a pulsed electric field source consisting of a small grounded doublet electrode of the type discussed in the '874 patent.
- the doublet electrodes are rectangles of 4.4 cm by 4.7 cm. At the large distance z d there is whole-body exposure to the field, so that the bulk effect discussed in the '874 patent comes into play, as is expected to happen also at the distance z max from the 30′′ TV monitor.
- the electric field pulse amplitude at the center of mass of the subject was found to be 7.9 mV/m. That an electric field with such a small pulse amplitude, applied to the whole body, is capable of exciting the 1 ⁇ 2 Hz sensory resonance is consistent with experimental results reported in the '874 patent, although these were obtained for the 2.4 Hz resonance.
- the distance z max was determined at which the 30′′ TV tube with 1% image intensity pulse amplitude produces an electric field with a pulse amplitude of 7.9 mV/m, along the center line of the screen. From Eqs.
- Windows 95, Windows 98, and Visual Basic are registered trademarks of Microsoft Corporation.
Priority Applications (1)
| Application Number | Priority Date | Filing Date | Title |
|---|---|---|---|
| US09/872,528 US6506148B2 (en) | 2001-06-01 | 2001-06-01 | Nervous system manipulation by electromagnetic fields from monitors |
Applications Claiming Priority (1)
| Application Number | Priority Date | Filing Date | Title |
|---|---|---|---|
| US09/872,528 US6506148B2 (en) | 2001-06-01 | 2001-06-01 | Nervous system manipulation by electromagnetic fields from monitors |
Publications (2)
| Publication Number | Publication Date |
|---|---|
| US20020188164A1 US20020188164A1 (en) | 2002-12-12 |
| US6506148B2 true US6506148B2 (en) | 2003-01-14 |
Family
ID=25359755
Family Applications (1)
| Application Number | Title | Priority Date | Filing Date |
|---|---|---|---|
| US09/872,528 Expired - Lifetime US6506148B2 (en) | 2001-06-01 | 2001-06-01 | Nervous system manipulation by electromagnetic fields from monitors |
Country Status (1)
| Country | Link |
|---|---|
| US (1) | US6506148B2 (US06506148-20030114-M00008.png) |
Cited By (3)
| Publication number | Priority date | Publication date | Assignee | Title |
|---|---|---|---|---|
| US20110082366A1 (en) * | 2005-10-04 | 2011-04-07 | Ascension Technology Corporation | DC magnetic-based position and orientation monitoring system for tracking medical instruments |
| US20130024192A1 (en) * | 2010-03-30 | 2013-01-24 | Nec Corporation | Atmosphere expression word selection system, atmosphere expression word selection method, and program |
| US11063162B2 (en) | 2018-10-14 | 2021-07-13 | Arizona Board Of Regents On Behalf Of Arizona State University | Current generation from radiation with diamond diode-based devices for detection or power generation |
Families Citing this family (5)
| Publication number | Priority date | Publication date | Assignee | Title |
|---|---|---|---|---|
| EP3594925B1 (en) * | 2018-07-13 | 2022-09-28 | Wolfgang Vogel | Device, system and method for entrainment and training of the human brain |
| CA3136986A1 (en) | 2019-05-06 | 2020-11-12 | Kamran Ansari | Therapeutic arrays of planar coils configured to generate pulsed electromagnetic fields and integrated into clothing |
| US11020603B2 (en) | 2019-05-06 | 2021-06-01 | Kamran Ansari | Systems and methods of modulating electrical impulses in an animal brain using arrays of planar coils configured to generate pulsed electromagnetic fields and integrated into clothing |
| RS63139B1 (sr) * | 2019-05-31 | 2022-05-31 | Kitanovic Aleksandra | Elektromagnetni stimulator |
| CN111643809B (zh) * | 2020-05-29 | 2023-12-05 | 广州大学 | 一种基于潜能干预仪的电磁脉冲控制方法及系统 |
Citations (15)
| Publication number | Priority date | Publication date | Assignee | Title |
|---|---|---|---|---|
| US3592965A (en) * | 1967-08-22 | 1971-07-13 | Zaid Diaz | Apparatus for converting cathode ray portrayable information to spacial images |
| US4800893A (en) * | 1987-06-10 | 1989-01-31 | Ross Sidney A | Kinesthetic physical movement feedback display for controlling the nervous system of a living organism |
| US5169380A (en) | 1988-05-04 | 1992-12-08 | Brennan Michael J W | Treatment of sleep disorders and alleviating disruption of circadian rhythms |
| US5304112A (en) * | 1991-10-16 | 1994-04-19 | Theresia A. Mrklas | Stress reduction system and method |
| US5400383A (en) * | 1991-12-09 | 1995-03-21 | General Electric Company | Fluoroscopic imager with frame-filling apparatus |
| US5412419A (en) * | 1991-02-11 | 1995-05-02 | Susana Ziarati | Magnetic resonance imaging compatible audio and video system |
| US5450859A (en) * | 1991-01-17 | 1995-09-19 | The Catholic University Of America | Protection of living systems from adverse effects of electric, magnetic and electromagnetic fields |
| US5782874A (en) | 1993-05-28 | 1998-07-21 | Loos; Hendricus G. | Method and apparatus for manipulating nervous systems |
| US5800481A (en) | 1995-12-28 | 1998-09-01 | Loos; Hendricus G. | Thermal excitation of sensory resonances |
| US5935054A (en) | 1995-06-07 | 1999-08-10 | Loos; Hendricus G. | Magnetic excitation of sensory resonances |
| US6017302A (en) | 1997-10-31 | 2000-01-25 | Loos; Hendricus G. | Subliminal acoustic manipulation of nervous systems |
| US6081744A (en) | 1993-05-28 | 2000-06-27 | Loos; Hendricus G. | Electric fringe field generator for manipulating nervous systems |
| US6091994A (en) | 1995-12-28 | 2000-07-18 | Loos; Hendricus G. | Pulsative manipulation of nervous systems |
| US6167304A (en) | 1993-05-28 | 2000-12-26 | Loos; Hendricus G. | Pulse variability in electric field manipulation of nervous systems |
| US6238333B1 (en) | 1995-06-07 | 2001-05-29 | Hendricus G. Loos | Remote magnetic manipulation of nervous systems |
-
2001
- 2001-06-01 US US09/872,528 patent/US6506148B2/en not_active Expired - Lifetime
Patent Citations (16)
| Publication number | Priority date | Publication date | Assignee | Title |
|---|---|---|---|---|
| US3592965A (en) * | 1967-08-22 | 1971-07-13 | Zaid Diaz | Apparatus for converting cathode ray portrayable information to spacial images |
| US4800893A (en) * | 1987-06-10 | 1989-01-31 | Ross Sidney A | Kinesthetic physical movement feedback display for controlling the nervous system of a living organism |
| US5169380A (en) | 1988-05-04 | 1992-12-08 | Brennan Michael J W | Treatment of sleep disorders and alleviating disruption of circadian rhythms |
| US5450859A (en) * | 1991-01-17 | 1995-09-19 | The Catholic University Of America | Protection of living systems from adverse effects of electric, magnetic and electromagnetic fields |
| US5412419A (en) * | 1991-02-11 | 1995-05-02 | Susana Ziarati | Magnetic resonance imaging compatible audio and video system |
| US5304112A (en) * | 1991-10-16 | 1994-04-19 | Theresia A. Mrklas | Stress reduction system and method |
| US5400383A (en) * | 1991-12-09 | 1995-03-21 | General Electric Company | Fluoroscopic imager with frame-filling apparatus |
| US6081744A (en) | 1993-05-28 | 2000-06-27 | Loos; Hendricus G. | Electric fringe field generator for manipulating nervous systems |
| US5899922A (en) | 1993-05-28 | 1999-05-04 | Loos; Hendricus G. | Manipulation of nervous systems by electric fields |
| US5782874A (en) | 1993-05-28 | 1998-07-21 | Loos; Hendricus G. | Method and apparatus for manipulating nervous systems |
| US6167304A (en) | 1993-05-28 | 2000-12-26 | Loos; Hendricus G. | Pulse variability in electric field manipulation of nervous systems |
| US5935054A (en) | 1995-06-07 | 1999-08-10 | Loos; Hendricus G. | Magnetic excitation of sensory resonances |
| US6238333B1 (en) | 1995-06-07 | 2001-05-29 | Hendricus G. Loos | Remote magnetic manipulation of nervous systems |
| US5800481A (en) | 1995-12-28 | 1998-09-01 | Loos; Hendricus G. | Thermal excitation of sensory resonances |
| US6091994A (en) | 1995-12-28 | 2000-07-18 | Loos; Hendricus G. | Pulsative manipulation of nervous systems |
| US6017302A (en) | 1997-10-31 | 2000-01-25 | Loos; Hendricus G. | Subliminal acoustic manipulation of nervous systems |
Non-Patent Citations (5)
| Title |
|---|
| C.A.Terzuolo and T.H.Bullock "Measurement of imposed voltage gradient adequate to modulate neuronal firing" Proc. Nat. Acad. Sci, Physiology 42,687-94, 1956. |
| M.Hutchison "Megabrain" p.232-3 Ballantine Books New York 1991. |
| N.Wiener "Nonlinear problems in random theory" p.71-72 John Wiley New York 1958. |
| O.Kellogg"Foundations of Potential Theory"p. 191 Dover, 1953. |
| P.M.Morse and H.Feshbach"Methods of Theoretical Physics"p. 1267 McGraw-Hill New York, 1953. |
Cited By (5)
| Publication number | Priority date | Publication date | Assignee | Title |
|---|---|---|---|---|
| US20110082366A1 (en) * | 2005-10-04 | 2011-04-07 | Ascension Technology Corporation | DC magnetic-based position and orientation monitoring system for tracking medical instruments |
| US8942780B2 (en) * | 2005-10-04 | 2015-01-27 | Ascension Technology Corporation | DC magnetic-based position and orientation monitoring system for tracking medical instruments |
| US20130024192A1 (en) * | 2010-03-30 | 2013-01-24 | Nec Corporation | Atmosphere expression word selection system, atmosphere expression word selection method, and program |
| US9286913B2 (en) * | 2010-03-30 | 2016-03-15 | Nec Corporation | Atmosphere expression word selection system, atmosphere expression word selection method, and program |
| US11063162B2 (en) | 2018-10-14 | 2021-07-13 | Arizona Board Of Regents On Behalf Of Arizona State University | Current generation from radiation with diamond diode-based devices for detection or power generation |
Also Published As
| Publication number | Publication date |
|---|---|
| US20020188164A1 (en) | 2002-12-12 |
Similar Documents
| Publication | Publication Date | Title |
|---|---|---|
| Berman et al. | Human electroretinogram responses to video displays, fluorescent lighting, and other high frequency sources | |
| Hochstein et al. | Linear and nonlinear spatial subunits in Y cat retinal ganglion cells. | |
| Zaidi et al. | Lateral interactions within color mechanism in simultaneous induced contrast | |
| Reid Jr et al. | Brightness induction by local contrast and the spatial dependence of assimilation | |
| Grill‐Spector et al. | A sequence of object‐processing stages revealed by fMRI in the human occipital lobe | |
| Jones et al. | Visual evoked response as a function of grating spatial frequency. | |
| US6506148B2 (en) | Nervous system manipulation by electromagnetic fields from monitors | |
| Olman et al. | BOLD fMRI and psychophysical measurements of contrast response to broadband images | |
| Anstis et al. | Adaptation to apparent motion | |
| Dresp et al. | Psychophysical measures of illusory form perception: further evidence for local mechanisms | |
| Blake et al. | Temporal aspects of spatial vision in the cat | |
| Nishida et al. | Gaze modulation of visual aftereffects | |
| Bertulis et al. | Temporal dynamics of the Oppel-Kundt illusion compared to the Müller-Lyer illusion | |
| Kellman et al. | Method for functional MRI mapping of nonlinear response | |
| Kasteleijn‐Nolst Trenité et al. | Visual stimuli in daily life | |
| FROM | United States Patent m | |
| Teller et al. | Infant temporal contrast sensitivity at low temporal frequencies | |
| US7278742B2 (en) | Systems and apparatus for assessment of visual field functions | |
| Murakami | Illusory jitter in a static stimulus surrounded by a synchronously flickering pattern | |
| Virsu et al. | Monophasic temporal modulation increases apparent spatial frequency | |
| Perna et al. | The lowest spatial frequency channel determines brightness perception | |
| McCarter et al. | A spatial frequency analogue to Mach bands | |
| Herzog et al. | Extending the shine-through effect to classical masking paradigms | |
| TAKEMOTO et al. | Retention of local information in generation of subjective contours | |
| Edwards et al. | Discrimination of global-motion signal strength |
Legal Events
| Date | Code | Title | Description |
|---|---|---|---|
| STCF | Information on status: patent grant |
Free format text: PATENTED CASE |
|
| FPAY | Fee payment |
Year of fee payment: 4 |
|
| FPAY | Fee payment |
Year of fee payment: 8 |
|
| FPAY | Fee payment |
Year of fee payment: 12 |