US4947682A - Method of locating oil and gas horizons using a wellbore heat flow log - Google Patents
Method of locating oil and gas horizons using a wellbore heat flow log Download PDFInfo
- Publication number
- US4947682A US4947682A US07/322,790 US32279089A US4947682A US 4947682 A US4947682 A US 4947682A US 32279089 A US32279089 A US 32279089A US 4947682 A US4947682 A US 4947682A
- Authority
- US
- United States
- Prior art keywords
- thermal
- wellbore
- heat flow
- ideal
- interval
- Prior art date
- Legal status (The legal status is an assumption and is not a legal conclusion. Google has not performed a legal analysis and makes no representation as to the accuracy of the status listed.)
- Expired - Lifetime
Links
- 238000000034 method Methods 0.000 title claims description 24
- 229910052500 inorganic mineral Inorganic materials 0.000 claims abstract description 31
- 239000011707 mineral Substances 0.000 claims abstract description 31
- 230000015572 biosynthetic process Effects 0.000 claims abstract description 15
- 238000005755 formation reaction Methods 0.000 claims abstract description 15
- 238000005553 drilling Methods 0.000 claims abstract description 11
- XLYOFNOQVPJJNP-UHFFFAOYSA-N water Substances O XLYOFNOQVPJJNP-UHFFFAOYSA-N 0.000 claims abstract description 10
- 239000004576 sand Substances 0.000 claims abstract description 8
- 230000002547 anomalous effect Effects 0.000 claims abstract description 3
- 230000001747 exhibiting effect Effects 0.000 claims abstract description 3
- 238000004364 calculation method Methods 0.000 claims description 5
- 239000012530 fluid Substances 0.000 description 19
- 229930195733 hydrocarbon Natural products 0.000 description 17
- 150000002430 hydrocarbons Chemical class 0.000 description 17
- 239000004215 Carbon black (E152) Substances 0.000 description 9
- 239000007789 gas Substances 0.000 description 9
- 239000011148 porous material Substances 0.000 description 7
- 238000004458 analytical method Methods 0.000 description 6
- 238000005259 measurement Methods 0.000 description 6
- 239000011435 rock Substances 0.000 description 5
- 238000012360 testing method Methods 0.000 description 5
- 239000011159 matrix material Substances 0.000 description 3
- 238000013508 migration Methods 0.000 description 3
- 230000005012 migration Effects 0.000 description 3
- 239000000523 sample Substances 0.000 description 3
- FAPWRFPIFSIZLT-UHFFFAOYSA-M Sodium chloride Chemical compound [Na+].[Cl-] FAPWRFPIFSIZLT-UHFFFAOYSA-M 0.000 description 2
- 238000012937 correction Methods 0.000 description 2
- 238000004519 manufacturing process Methods 0.000 description 2
- VNWKTOKETHGBQD-UHFFFAOYSA-N methane Chemical compound C VNWKTOKETHGBQD-UHFFFAOYSA-N 0.000 description 2
- 239000000203 mixture Substances 0.000 description 2
- 239000003208 petroleum Substances 0.000 description 2
- 239000011780 sodium chloride Substances 0.000 description 2
- 235000015076 Shorea robusta Nutrition 0.000 description 1
- 244000166071 Shorea robusta Species 0.000 description 1
- 229910052776 Thorium Inorganic materials 0.000 description 1
- 229910052770 Uranium Inorganic materials 0.000 description 1
- 229910052782 aluminium Inorganic materials 0.000 description 1
- 229910052612 amphibole Inorganic materials 0.000 description 1
- 238000009529 body temperature measurement Methods 0.000 description 1
- 244000309464 bull Species 0.000 description 1
- 239000004927 clay Substances 0.000 description 1
- 239000000470 constituent Substances 0.000 description 1
- 238000001514 detection method Methods 0.000 description 1
- 238000009792 diffusion process Methods 0.000 description 1
- 230000009977 dual effect Effects 0.000 description 1
- 230000000694 effects Effects 0.000 description 1
- 238000005206 flow analysis Methods 0.000 description 1
- 238000001730 gamma-ray spectroscopy Methods 0.000 description 1
- 125000002887 hydroxy group Chemical group [H]O* 0.000 description 1
- 238000012625 in-situ measurement Methods 0.000 description 1
- 238000011065 in-situ storage Methods 0.000 description 1
- 230000006698 induction Effects 0.000 description 1
- 238000011835 investigation Methods 0.000 description 1
- 238000011545 laboratory measurement Methods 0.000 description 1
- 238000000691 measurement method Methods 0.000 description 1
- 239000003345 natural gas Substances 0.000 description 1
- 239000003209 petroleum derivative Substances 0.000 description 1
- 230000000704 physical effect Effects 0.000 description 1
- 238000005293 physical law Methods 0.000 description 1
- 229910052700 potassium Inorganic materials 0.000 description 1
- 230000002062 proliferating effect Effects 0.000 description 1
- 229910052611 pyroxene Inorganic materials 0.000 description 1
- 239000010453 quartz Substances 0.000 description 1
- 238000012552 review Methods 0.000 description 1
- 239000013049 sediment Substances 0.000 description 1
- VYPSYNLAJGMNEJ-UHFFFAOYSA-N silicon dioxide Inorganic materials O=[Si]=O VYPSYNLAJGMNEJ-UHFFFAOYSA-N 0.000 description 1
- 238000004611 spectroscopical analysis Methods 0.000 description 1
- 239000000126 substance Substances 0.000 description 1
- 239000003643 water by type Substances 0.000 description 1
Images


Classifications
-
- G—PHYSICS
- G01—MEASURING; TESTING
- G01N—INVESTIGATING OR ANALYSING MATERIALS BY DETERMINING THEIR CHEMICAL OR PHYSICAL PROPERTIES
- G01N25/00—Investigating or analyzing materials by the use of thermal means
- G01N25/18—Investigating or analyzing materials by the use of thermal means by investigating thermal conductivity
-
- E—FIXED CONSTRUCTIONS
- E21—EARTH OR ROCK DRILLING; MINING
- E21B—EARTH OR ROCK DRILLING; OBTAINING OIL, GAS, WATER, SOLUBLE OR MELTABLE MATERIALS OR A SLURRY OF MINERALS FROM WELLS
- E21B47/00—Survey of boreholes or wells
- E21B47/06—Measuring temperature or pressure
- E21B47/07—Temperature
-
- G—PHYSICS
- G01—MEASURING; TESTING
- G01V—GEOPHYSICS; GRAVITATIONAL MEASUREMENTS; DETECTING MASSES OR OBJECTS; TAGS
- G01V9/00—Prospecting or detecting by methods not provided for in groups G01V1/00 - G01V8/00
- G01V9/005—Prospecting or detecting by methods not provided for in groups G01V1/00 - G01V8/00 by thermal methods, e.g. after generation of heat by chemical reactions
Definitions
- Thermal gradients are commonly used in the oil industry to determine the thermal state of the subsurface. Examples of correlations between variations in thermal gradients and oil and gas horizons in fields within the United States can be found in the literature as far back as the 1920's. More recent examples of such correlations are presented in Meyer, H. J. and McGee, H. W., "Oil and Gas Fields Accompanied by Geothermal Anomolies in Rocky Mountain Region,” Am. Assoc. Petr. Geol. Bull. 69, No. 6, 1986, pp. 933-45. An excellent review of this methodology can be found in Roberts, W. H. III, "Some Uses of Temperature Data in Petroleum Exploration in Unconventional Methods in Exploration for Petroleum and Natural Gas," II, ed. B. M. Gottling, Inst. Study of Earth and Man, SMU Press, Dallas 1981.
- thermal gradient Neither the measurement of thermal gradient nor thermal conductivity in wells has proved to be a consistent locator of hydrocarbons.
- the measurement of thermal gradients and thermal conductivities separately in a well gives inconsistent results for the detection of thermal anomalies associated with oil and gas-bearing horizons for a fundamental scientific reason: each alone does not measure the proper physical parameter.
- the flow of heat from the earth is not measured by either the thermal conductivity or the thermal gradient, but by the product of these two physical properties. Heat flow equals thermal gradient times thermal conductivity at any given depth in a wellbore. If both accurate thermal gradients and thermal conductivities can be ascertained throughout a wellbore, the heat flow at every depth in a well can be calculated.
- heat flow must be constant with depth if a wellbore is in thermal equilibrium. Fluid convection, geopressuring, and oil and gas migration can all produce heat flow that is not constant with depth in a wellbore.
- the thermal gradient at any point in a well may be found to be high because of either low thermal conductivity (e.g., due solely to a lithology change), or because hot, low thermal conductivity fluids have recently migrated into traps penetrated by the wellbore. From the wellbore heat flow, however, it is possible to determine not only the likely locations and possible compositions of hydrocarbons in the vicinity of the well, but also whether fluid flow is active in the region surrounding the wellbore.
- a method of locating oil and gas horizons in a wellbore based on determinations of the heat flows at successive intervals in the wellbore comprises the steps of: obtaining by thermal logging temperatures at successive equal intervals in the wellbore and establishing from said temperatures thermal gradients for said intervals free of drilling-induced thermal disturbances; identifying the mineral abundances surrounding the wellbore at each of said intervals; establishing ideal thermal conductivities for said mineral abundances based on assumptions that sand-rich formations have high thermal conductivities and are water-bearing and that shale-rich formations have low conductivities; determining an ideal heat flow at each interval by multiplying the thermal gradient at such interval by the ideal thermal conductivity of the mineral abundances at the interval; determining the average ideal heat flow for all of the intervals, and identifying the zones of the wellbore exhibiting anomalous ideal heat flows that are higher than the average heat flow.
- the critical beginning of an accurate determination of wellbore heat flow is to log the change in temperature with depth, the thermal gradient, accurately in a well.
- the thermal gradient must be either recorded at two or more different times during a logging operation or at a sufficiently long time after drilling has ceased for the disturbances caused by the drilling procedure to have dissipated.
- Thermal disturbances such as from increased or lost circulation, can be recognized and corrected for if multiple temperature logs exist in a well. Drilling-induced thermal disturbances will be present on both logs, but the differences between the temperatures measured at different times allows for the identification of, and correction for, these effects.
- Phonon conduction is somewhat less accurate, producing values good to perhaps 20%.
- identification of the mineral abundances can, therefore, be based on geochemical logs, photoelectric and density logs or core or cutting samples. Ideal thermal conductivities are established based on the identification of mineral abundances surrounding the wellbore and on the assumptions that sand-rich intervals have high thermal conductivities and have water as the pore fluid, and shale-rich intervals have low thermal conductivities.
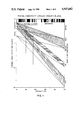
- FIG. 1 is a graph showing the general relationship between lithology, pore fluid composition and thermal conductivity and is prepared from laboratory measurements of core samples;
- FIG. 2 shows at the right a mineralogy model of the well and at the left the thermal conductivity determined from the model
- FIG. 3 shows (left) the thermal conductivity determined from the model (see also FIG. 2) (center), the thermal gradients obtained by thermal logging and (right) the heat flow;
- FIG. 4 shows (left) the results of drill-stem flow tests and (right) hydrocarbon indicators from a Schlumberger analysis made completely independently of the present method.
- Thermal and geochemical logs were run in a thermally stabilized Gulf Coast well off Louisiana.
- the geochemical logging was performed by a Schlumberger GLTTM tool and yielded the mineralogy determinations in volume percents shown in FIG. 2.
- a Schlumberger Auxiliary Measurement Sonde (AMS) was run with the GLTTM to obtain the thermal log (FIG. 3).
- the AMS has been run with an ultra-high resolution temperature tool in Ocean Drilling Program wells and has been found to give reliable temperature and thermal gradient measurements.
- the AMS temperatures are shown as line T in FIG. 3, and the gradients at successive 0.5 foot intervals are shown as line G.
- the mineral volume profiles can be accurate to within ⁇ 5% by volume as long as the initial matrix model includes the correct set of significant minerals and does not attempt to distinguish between minerals with nearly identical chemical formulas (e.g., amphibole and pyroxene).
- the calculation of whole-rock thermal conductivity from the resulting continuous mineral volume curves follows the same technique used for mineral counts from thin section analyses (Williams et al., 1988).
- the mineral volumes are included in a geometric mean model for the thermal conductivity of a crystalline aggregate of known porosity according to the relation
- ⁇ 1 is the thermal conductivity of the first of n constituent minerals and ⁇ 1 is the volume fraction of the first mineral.
- the thermal conductivities of the intervals were calculated from the mineralogy model using the above-described techniques and are plotted in FIGS. 2 and 3. The calculations are based on assumed ideal thermal conductivity values for each principal mineral component of the model. High thermal conductivities are predicted in the sand-rich intervals, and low thermal conductivities are assumed for the shale-rich zones.
- FIG. 1 provides guidance for the selections, as does the knowledge that Gulf Coast sediments have porosities in the range of from 20% to 35% (range marked in FIG. 1). From FIG.
- sandstone lithologies within this range of porosity will have thermal conductivities lower by about 50% for oil-bearing formations and by about 100% for gas-bearing formations, as compared to water-bearing formations.
- the ideal values of thermal conductivity for the sand-rich intervals are based on the assumption that such intervals are water-bearing.
- the shaliness is overcompensated for in the calculations by including the water from hydroxyls that are bound within the clays as additional porosity and by using a thermal conductivity appropriate for an unconsolidated clay.
- Line TC (FIGS. 2 and 3) is a plot of the ideal thermal conductivities at the 0.5 foot intervals of the mineral abundances surrounding the wellbore calculated from the mineralogy model and the assumed ideal conductivities of the constituents of the mineralogy model.
- the heat flow plotted as line HF in FIG. 3 is the simple arithmetic product of the thermal gradient and the ideal thermal conductivity and is an "ideal heat flow" in that it (a) assumes that no oil or gas is present in the formations around the wellbore and (b) compensates for that assumption by assigning low values to shale-rich formations.
- Heat productions were calculated from the absolute abundances of the radiogenic elements, potassium, uranium and thorium, measured by a Natural Gamma Spectroscopy Tool and were found to be unimportant in the well of this example. If important they would be added directly to the wellbore heat flow at each depth.
- thermal conductivities of oil-bearing and gas-bearing formations are considerably lower than the thermal conductivities of minerologically similar formations having saline waters as the pore fluid (FIG. 1). Consequently, the ideal heat flows (FIG. 3) determined at each interval of the well based on assumed high ideal values (water as the pore fluid) of thermal conductivity for the sand-rich mineral components should be artificially high relative to the average heat flow for those intervals where hydrocarbons are present. Also, intervals in gas-prone zones should exhibit ideal heat flows greater than those of oil-bearing formations.
- the plot in FIG. 4 on the far right contains the hydrocarbon-bearing zones predicted by the Schlumberger analysis of the well derived from mineralogy and resistivity logs. This analysis is completely independent of the identification of hydrocarbon-bearing intervals by wellbore heat flow analysis. The two analyses generally agree (e.g., at X200, X400, X600, and X850 feet), but the wellbore heat flow determination suggests that the hydrocarbon-bearing zone picked by Schlumberger at W850 to X050 feet extends only from W975 to X050 feet. In drill-stem flow tests in the well (FIG.
- the interval below Y500 feet contains both lower heat flow and more saline fluids than the interval above this boundary.
- FIG. 3 shows that the lower heat flow is not from lower thermal conductivity, but from lower temperature gradients (a change in the slope of the temperature versus depth curve T can be seen to occur at Y500 feet).
- the interval contains colder, more dense fluids compared to the hotter, lighter pore fluids found above this boundary; this is a classic geopressure indication in the Gulf Coast.
Landscapes
- Life Sciences & Earth Sciences (AREA)
- Physics & Mathematics (AREA)
- Chemical & Material Sciences (AREA)
- Geophysics (AREA)
- Engineering & Computer Science (AREA)
- General Physics & Mathematics (AREA)
- Geology (AREA)
- Mining & Mineral Resources (AREA)
- General Life Sciences & Earth Sciences (AREA)
- Fluid Mechanics (AREA)
- Geochemistry & Mineralogy (AREA)
- Chemical Kinetics & Catalysis (AREA)
- Environmental & Geological Engineering (AREA)
- Health & Medical Sciences (AREA)
- Analytical Chemistry (AREA)
- Biochemistry (AREA)
- General Health & Medical Sciences (AREA)
- Immunology (AREA)
- Pathology (AREA)
- Investigating Or Analyzing Materials Using Thermal Means (AREA)
Abstract
Oil and gas horizons in a wellbore are located by establishing from thermal logs thermal gradients for successive intervals free of drilling-induced thermal disturbances, identifying the mineral abundances surrounding the wellbore at each of said intervals, establishing ideal thermal conductivities for said mineral abundances based on assumptions that sand-rich formations have high thermal conductivities and are water-bearing and that shale-rich formations have low conductivities, determining an ideal heat flow at each interval by multiplying the thermal gradient at such interval by the ideal thermal conductivity of the mineral abundances at the interval, determining the average ideal heat flow for all of the intervals, and identifying the zones of the wellbore exhibiting anomalous ideal heat flows that are higher than the average heat flow.
Description
Thermal gradients are commonly used in the oil industry to determine the thermal state of the subsurface. Examples of correlations between variations in thermal gradients and oil and gas horizons in fields within the United States can be found in the literature as far back as the 1920's. More recent examples of such correlations are presented in Meyer, H. J. and McGee, H. W., "Oil and Gas Fields Accompanied by Geothermal Anomolies in Rocky Mountain Region," Am. Assoc. Petr. Geol. Bull. 69, No. 6, 1986, pp. 933-45. An excellent review of this methodology can be found in Roberts, W. H. III, "Some Uses of Temperature Data in Petroleum Exploration in Unconventional Methods in Exploration for Petroleum and Natural Gas," II, ed. B. M. Gottlieb, Inst. Study of Earth and Man, SMU Press, Dallas 1981.
Though the occurrences of oil and gas production zones are sometimes found associated with thermal gradient changes, the correlation has not proved to be consistent. The drilling history of the well severely disturbs the ambient thermal gradients surrounding the well, and equilibrium corrections that must be made to raw temperature measurements are very complicated. Multiple temperature logs, run at several different times in a well, greatly improve the data quality, but such multiple logs are rarely available.
Several techniques have been proposed to measure the thermal conductivity variations, instead of thermal gradients, of the earth formations and fluids in and around a wellbore. In Smith U.S. Pat. No. 3,864,969 for "Station Measurements of Earth Formation Thermal Conductivity" (1975), it is shown that oil and gas bearing horizons have 50-100% lower thermal conductivities than similar lithogies that are water-bearing (FIG. 1). In Smith U.S. Pat. No. 3,892,128 for "Methods of Thermal Well Logging" (1975), there is described a technique for directly logging thermal conductivity in a well in order to determine the locations of oil and gas bearing formations. A special logging tool with a heat source is dragged up the borehole, and the rate of diffusion of heat from the tool into the rock is measured. Similarly, Young U.S. Pat. No. 4,575,260 for "Thermal Conductivity Probe for Fluid Identification" (1986) describes a heater-probe for a logging tool that measures the thermal conductivity of the wellbore fluid, rather than that of the rock. If hydrocarbons are present in the well, the thermal conductivity probe will detect unusually low thermal conductivities.
Neither the measurement of thermal gradient nor thermal conductivity in wells has proved to be a consistent locator of hydrocarbons. The measurement of thermal gradients and thermal conductivities separately in a well gives inconsistent results for the detection of thermal anomalies associated with oil and gas-bearing horizons for a fundamental scientific reason: each alone does not measure the proper physical parameter. The flow of heat from the earth is not measured by either the thermal conductivity or the thermal gradient, but by the product of these two physical properties. Heat flow equals thermal gradient times thermal conductivity at any given depth in a wellbore. If both accurate thermal gradients and thermal conductivities can be ascertained throughout a wellbore, the heat flow at every depth in a well can be calculated.
Determination of heat flow allows the application of fundamental physical laws to the interpretation of hydrocarbon migration and fluid flow in the subsurface. For example, heat flow must be constant with depth if a wellbore is in thermal equilibrium. Fluid convection, geopressuring, and oil and gas migration can all produce heat flow that is not constant with depth in a wellbore. Thus, the thermal gradient at any point in a well may be found to be high because of either low thermal conductivity (e.g., due solely to a lithology change), or because hot, low thermal conductivity fluids have recently migrated into traps penetrated by the wellbore. From the wellbore heat flow, however, it is possible to determine not only the likely locations and possible compositions of hydrocarbons in the vicinity of the well, but also whether fluid flow is active in the region surrounding the wellbore.
There is provided, according to the present invention, a method of locating oil and gas horizons in a wellbore based on determinations of the heat flows at successive intervals in the wellbore. The method comprises the steps of: obtaining by thermal logging temperatures at successive equal intervals in the wellbore and establishing from said temperatures thermal gradients for said intervals free of drilling-induced thermal disturbances; identifying the mineral abundances surrounding the wellbore at each of said intervals; establishing ideal thermal conductivities for said mineral abundances based on assumptions that sand-rich formations have high thermal conductivities and are water-bearing and that shale-rich formations have low conductivities; determining an ideal heat flow at each interval by multiplying the thermal gradient at such interval by the ideal thermal conductivity of the mineral abundances at the interval; determining the average ideal heat flow for all of the intervals, and identifying the zones of the wellbore exhibiting anomalous ideal heat flows that are higher than the average heat flow.
The critical beginning of an accurate determination of wellbore heat flow is to log the change in temperature with depth, the thermal gradient, accurately in a well. The thermal gradient must be either recorded at two or more different times during a logging operation or at a sufficiently long time after drilling has ceased for the disturbances caused by the drilling procedure to have dissipated. Thermal disturbances, such as from increased or lost circulation, can be recognized and corrected for if multiple temperature logs exist in a well. Drilling-induced thermal disturbances will be present on both logs, but the differences between the temperatures measured at different times allows for the identification of, and correction for, these effects.
Although many methods have been investigated for the determination of thermal conductivities from geophysical logs (e.g., Williams, C. F., Anderson, R. N., and Broglia, C., "In Situ Investigations of Thermal Conductivity, Heat Production, and Past Hydrothermal Circulation in the Cajon Pass Scientific Drill Hole," Geophys. Res. Lett., 15, 9, 985-988, 1988), the most reliable measurement techniques known currently appear to be those derived from mineral abundances determined by geochemical logging using, for example, the Schlumberger Geochemical Logging Tool (GLT™), or when not available, by Phonon Conduction from Photoelectric-Density logs. In Drury, M. J. and Jessop, A. M., "The Estimation of Rock Thermal Conductivity from Mineral Content--An Assessment of Techniques," Zbl. Geol. Paleont, Teil I, 1983, it is shown that thermal conductivities accurate to 15% can be calculated from mineral abundances measured on core or cutting samples. This technique has long been used to place constraints on the thermal conductivity of the mantle, which is critical to models of the thermal history of the earth. In Williams, C. F. and Anderson, R. N., "Geophysical Properties of the Earth's Crust: In situ Measurements from Continental and Ocean Drilling," J. Geophys. Res. Submitted for publication, 1989, it is shown that the determination from mineral abundances from the GLT™ tool produces log-derived thermal conductivities from mineral inversions that are also accurate to approximately 15%. Phonon conduction is somewhat less accurate, producing values good to perhaps 20%. In the present invention, identification of the mineral abundances can, therefore, be based on geochemical logs, photoelectric and density logs or core or cutting samples. Ideal thermal conductivities are established based on the identification of mineral abundances surrounding the wellbore and on the assumptions that sand-rich intervals have high thermal conductivities and have water as the pore fluid, and shale-rich intervals have low thermal conductivities.
An example of the method of the present invention, as applied in a Gulf Coast well, is described below in conjunction with the accompanying drawings.
FIG. 1 is a graph showing the general relationship between lithology, pore fluid composition and thermal conductivity and is prepared from laboratory measurements of core samples;
FIG. 2 shows at the right a mineralogy model of the well and at the left the thermal conductivity determined from the model;
FIG. 3 shows (left) the thermal conductivity determined from the model (see also FIG. 2) (center), the thermal gradients obtained by thermal logging and (right) the heat flow; and
FIG. 4 shows (left) the results of drill-stem flow tests and (right) hydrocarbon indicators from a Schlumberger analysis made completely independently of the present method.
Thermal and geochemical logs were run in a thermally stabilized Gulf Coast well off Louisiana. The geochemical logging was performed by a Schlumberger GLT™ tool and yielded the mineralogy determinations in volume percents shown in FIG. 2. A Schlumberger Auxiliary Measurement Sonde (AMS) was run with the GLT™ to obtain the thermal log (FIG. 3). The AMS has been run with an ultra-high resolution temperature tool in Ocean Drilling Program wells and has been found to give reliable temperature and thermal gradient measurements. The AMS temperatures are shown as line T in FIG. 3, and the gradients at successive 0.5 foot intervals are shown as line G.
Using the techniques described in Herzog R., L. Colson, B. Seeman, M. O'Brien, H. Scott, D. McKeon, P. Wraight, J. Grau, J. Schweitzer, and M. Herron, "Geochemical Logging with Spectrometry Tools," Society of Petroleum Engineers, Paper 16792, 1987, referred to above, a matrix inversion of the elemental abundances was used to calculate the mineralogy model for the well (FIG. 2). The sand-shale sequences that form the prolific hydrocarbon producers in the area can be easily identified from quartz variations in the mineralogy logs.
As Herzog et al. explain, the combination of natural and induced gamma ray spectroscopy logs measures relative concentrations of Ca, Si, Fe, S, Ti, Gd, Na+Mg, and absolute concentrations of K, U, Th, Al. The application of a closure model (a requirement that the weight percent sum of all elements equal 100%) yields absolute weight percent oxides, for all of the measured elements, with acceptable accuracy for most rocks. The oxide data are used to derive a quantitative mineralogical profile through a matrix inversion scheme which solves for mineral abundances in terms of the mineral elemental formulas. The mineral volume profiles can be accurate to within ±5% by volume as long as the initial matrix model includes the correct set of significant minerals and does not attempt to distinguish between minerals with nearly identical chemical formulas (e.g., amphibole and pyroxene). The calculation of whole-rock thermal conductivity from the resulting continuous mineral volume curves follows the same technique used for mineral counts from thin section analyses (Williams et al., 1988). The mineral volumes are included in a geometric mean model for the thermal conductivity of a crystalline aggregate of known porosity according to the relation
λ total=λ.sub.1.sup.φ.sbsp.1 *λ.sub.2.sup.φ.sbsp.2 * . . . *λ.sub.n.sup.100 .sbsp.n
where λ1 is the thermal conductivity of the first of n constituent minerals and φ1 is the volume fraction of the first mineral.
The thermal conductivities of the intervals were calculated from the mineralogy model using the above-described techniques and are plotted in FIGS. 2 and 3. The calculations are based on assumed ideal thermal conductivity values for each principal mineral component of the model. High thermal conductivities are predicted in the sand-rich intervals, and low thermal conductivities are assumed for the shale-rich zones. FIG. 1 provides guidance for the selections, as does the knowledge that Gulf Coast sediments have porosities in the range of from 20% to 35% (range marked in FIG. 1). From FIG. 1, it is to be noted that sandstone lithologies within this range of porosity will have thermal conductivities lower by about 50% for oil-bearing formations and by about 100% for gas-bearing formations, as compared to water-bearing formations. The ideal values of thermal conductivity for the sand-rich intervals are based on the assumption that such intervals are water-bearing. The shaliness is overcompensated for in the calculations by including the water from hydroxyls that are bound within the clays as additional porosity and by using a thermal conductivity appropriate for an unconsolidated clay. The values of ideal thermal conductivity (in W/m°K.) used in this example were as follows: kaolinite--2.8; illite--1.8; smectite--2.0; feldspar--2.2; quartz--7.7, and limestone--3.6.
Line TC (FIGS. 2 and 3) is a plot of the ideal thermal conductivities at the 0.5 foot intervals of the mineral abundances surrounding the wellbore calculated from the mineralogy model and the assumed ideal conductivities of the constituents of the mineralogy model. The heat flow plotted as line HF in FIG. 3 is the simple arithmetic product of the thermal gradient and the ideal thermal conductivity and is an "ideal heat flow" in that it (a) assumes that no oil or gas is present in the formations around the wellbore and (b) compensates for that assumption by assigning low values to shale-rich formations.
Heat productions were calculated from the absolute abundances of the radiogenic elements, potassium, uranium and thorium, measured by a Natural Gamma Spectroscopy Tool and were found to be unimportant in the well of this example. If important they would be added directly to the wellbore heat flow at each depth.
A calculation of the average heat flow for all intervals was found to agree with surface heat flow measurements made in the area by a shipboard surveying team from Lamont-Doherty Geological Observatory (Columbia University). The average heat flow of 36 mW/m2 is shown as solid line AHF in FIG. 3. Below Y500 feet in the well, the average heat flow (26 mW/m2) is clearly lower than the average heat flow above that level. As described below, the change in heat flow below Y500 occurs at the top of geopressure and is caused by fluid convection in the area.
The thermal conductivities of oil-bearing and gas-bearing formations are considerably lower than the thermal conductivities of minerologically similar formations having saline waters as the pore fluid (FIG. 1). Consequently, the ideal heat flows (FIG. 3) determined at each interval of the well based on assumed high ideal values (water as the pore fluid) of thermal conductivity for the sand-rich mineral components should be artificially high relative to the average heat flow for those intervals where hydrocarbons are present. Also, intervals in gas-prone zones should exhibit ideal heat flows greater than those of oil-bearing formations.
Indeed, several hydrocarbon rich zones are predicted by such high heat flow intervals in the wellbore heat flow log (FIG. 3). It is important to note that these intervals do not always correspond to thermal gradient anomalies (FIG. 3). For example, the hydrocarbon-bearing interval at X600-X720 feet is also a thermal gradient anomaly, but that at X150-X250 feet is not (FIG. 3). Even in the region of the well below Y500 feet with lower average heat flow, relatively high heat flow anomalies indicate hydrocarbons are present from Y700 to Y800 feet.
The plot in FIG. 4 on the far right contains the hydrocarbon-bearing zones predicted by the Schlumberger analysis of the well derived from mineralogy and resistivity logs. This analysis is completely independent of the identification of hydrocarbon-bearing intervals by wellbore heat flow analysis. The two analyses generally agree (e.g., at X200, X400, X600, and X850 feet), but the wellbore heat flow determination suggests that the hydrocarbon-bearing zone picked by Schlumberger at W850 to X050 feet extends only from W975 to X050 feet. In drill-stem flow tests in the well (FIG. 4, left), there was no flow at perforations made at W900-W920 and W930-W950 feet, which may have been selected at depths that were too shallow (FIG. 4). Flow-tests at X600-X620 verify predictions from both methods of the presence of abundant hydrocarbons. This interval is characterized by low-above-high heat flow. The low apparent heat flow above X600 is caused, in part, by selection of low thermal conductivity values for wet clays. However, the temperature gradients are low in this shale-rich interval, indicating a possible thermal disturbance from fluid movements, as well. The high apparent heat flow below X600 feet is thought to be indicative of the presence of abundant hydrocarbons, i.e., an anomaly in the ideal heat flow (FIG. 3) resulting from assuming water as the pore fluid in sand-rich intervals.
There is only a small ideal heat flow anomaly to indicate the hydrocarbons found in the flow-tests at Y100 feet. The cause of the small magnitude of the high heat flow anomaly is due to the presence of shales within the sands, which lowers the heat flow. A major producing zone seen in the heat flow at Y250 to Y410 feet was not perforated (see FIG. 4, left). The oil-show at Y710 feet, confirmed by drill-stem flow tests (FIG. 4), is in an interval with a high ideal heat flow anomaly that is much stronger than the hydrocarbon indicator from the Schlumberger analysis at that depth.
The lower average heat flow in the part of the well below Y500 feet is of particular hydrological interest, because thermal convection and fluid migration must be occurring in this interval in order to maintain such a disequilibrium, heat flow contrast across this boundary. Pore fluid salinities, derived from Capture-Sigma measured by the geochemical logging tool and electrical resistivity from the dual induction log, show a significant increase in salinity across this boundary at Y500 feet in the well. Salinities of up to 250,000 ppm are predicted.
The interval below Y500 feet contains both lower heat flow and more saline fluids than the interval above this boundary. FIG. 3 shows that the lower heat flow is not from lower thermal conductivity, but from lower temperature gradients (a change in the slope of the temperature versus depth curve T can be seen to occur at Y500 feet). Thus, the interval contains colder, more dense fluids compared to the hotter, lighter pore fluids found above this boundary; this is a classic geopressure indication in the Gulf Coast.
Claims (6)
1. A method of locating oil and gas horizons in a wellbore comprising the steps of obtaining by thermal logging temperatures at successive intervals in the wellbore and establishing from said temperatures thermal gradients for said intervals free of drilling-induced thermal disturbances, identifying the mineral abundances surrounding the wellbore at each of said intervals, establishing ideal thermal conductivities for said mineral abundances based on assumptions that sand-rich formations have high thermal conductivities and are water-bearing and that shale-rich formations have low conductivities, determining an ideal heat flow at each interval by multiplying the thermal gradient at such interval by the ideal thermal conductivity of the mineral abundances at the interval, determining the average ideal heat flow for all of the intervals, and identifying the zones of the wellbore exhibiting anomalous ideal heat flows that are higher than the average heat flow.
2. The method according to claim 1 wherein the wellbore is thermally logged at a time sufficiently long after drilling has ceased for thermal disturbances caused by drilling to have dissipated.
3. The method according to claim 1 wherein the wellbore is thermally logged at least twice at an interval of time between such logs sufficient for thermal disturbances caused by drilling to partially dissipate during such time interval and the thermal gradients are established by identifying and correcting for drilling-induced disturbances.
4. The method according to claim 1 wherein the mineral abundances are identified from core or cutting samples taken from the wellbore.
5. The method according to claim 1 wherein the mineral abundances are identified by geochemical logging of the wellbore.
6. The method according to claim 5 wherein the ideal thermal conductivities are obtained by calculations from a mineralogy model created from the logs of the mineral abundances.
Priority Applications (3)
| Application Number | Priority Date | Filing Date | Title |
|---|---|---|---|
| US07/322,790 US4947682A (en) | 1989-03-13 | 1989-03-13 | Method of locating oil and gas horizons using a wellbore heat flow log |
| PCT/US1990/001269 WO1990010781A1 (en) | 1989-03-13 | 1990-03-08 | Method of locating oil and gas horizons using a wellbore heat flow log |
| AU54159/90A AU5415990A (en) | 1989-03-13 | 1990-03-08 | Method of locating oil and gas horizons using a wellbore heat flow log |
Applications Claiming Priority (1)
| Application Number | Priority Date | Filing Date | Title |
|---|---|---|---|
| US07/322,790 US4947682A (en) | 1989-03-13 | 1989-03-13 | Method of locating oil and gas horizons using a wellbore heat flow log |
Publications (1)
| Publication Number | Publication Date |
|---|---|
| US4947682A true US4947682A (en) | 1990-08-14 |
Family
ID=23256427
Family Applications (1)
| Application Number | Title | Priority Date | Filing Date |
|---|---|---|---|
| US07/322,790 Expired - Lifetime US4947682A (en) | 1989-03-13 | 1989-03-13 | Method of locating oil and gas horizons using a wellbore heat flow log |
Country Status (3)
| Country | Link |
|---|---|
| US (1) | US4947682A (en) |
| AU (1) | AU5415990A (en) |
| WO (1) | WO1990010781A1 (en) |
Cited By (17)
| Publication number | Priority date | Publication date | Assignee | Title |
|---|---|---|---|---|
| US5375465A (en) * | 1993-04-15 | 1994-12-27 | Royal Wireline, Inc. | Method for gas/liquid well profiling |
| US5743642A (en) * | 1996-06-24 | 1998-04-28 | Fons; Lloyd C. | Method for compensating earth surface temperatures for the skyward effect thereon |
| US5860483A (en) * | 1995-05-24 | 1999-01-19 | Havig; Sven O. | Method for installing electronic equipment below soft earth surface |
| RU2125149C1 (en) * | 1998-06-11 | 1999-01-20 | Вяхирев Рем Иванович | Method for determining lower boundary of occurrence of permafrost ground |
| US6497279B1 (en) * | 1998-08-25 | 2002-12-24 | Sensor Highway Limited | Method of using a heater with a fiber optic string in a wellbore |
| US6769805B2 (en) | 1998-08-25 | 2004-08-03 | Sensor Highway Limited | Method of using a heater with a fiber optic string in a wellbore |
| US6789937B2 (en) * | 2001-11-30 | 2004-09-14 | Schlumberger Technology Corporation | Method of predicting formation temperature |
| RU2329370C1 (en) * | 2006-11-07 | 2008-07-20 | ООО "Ямбурггаздобыча" | Method of permafrost rock bedding delimitation |
| US20100080260A1 (en) * | 2008-09-30 | 2010-04-01 | Schlumberger Technology Corporation | Method of determining thermophysical properties of solid bodies |
| US20120057614A1 (en) * | 2010-09-03 | 2012-03-08 | Randy Allen Normann | Geothermal temperature gradient measurement |
| US8630816B2 (en) | 2008-11-17 | 2014-01-14 | Sensortran, Inc. | High spatial resolution fiber optic temperature sensor |
| US20150025863A1 (en) * | 2013-07-19 | 2015-01-22 | Ingrain, Inc. | Cuttings-based well logging |
| RU2596627C1 (en) * | 2012-08-20 | 2016-09-10 | Статойл Петролеум Ас | Simulation of temperature, limited by geophysical data and kinematic reduction |
| US20160376887A1 (en) * | 2015-06-26 | 2016-12-29 | University Of Louisiana At Lafayette | Method for determining pore pressure in oil and gas wells using basin thermal characteristics |
| CN107762483A (en) * | 2017-11-02 | 2018-03-06 | 中国石油天然气集团公司 | A kind of Fluid Identification Method of coefficient correlation and envelope size based on log |
| CN109854230A (en) * | 2017-11-30 | 2019-06-07 | 中国石油天然气股份有限公司 | Well testing method and device |
| US11060387B2 (en) * | 2017-01-18 | 2021-07-13 | Halliburton Energy Services, Inc. | Determining fluid allocation in a well with a distributed temperature sensing system using data from a distributed acoustic sensing system |
Citations (6)
| Publication number | Priority date | Publication date | Assignee | Title |
|---|---|---|---|---|
| US3217550A (en) * | 1962-06-11 | 1965-11-16 | Geothermal Surveys Inc | Geothermal prospecting |
| US3864969A (en) * | 1973-08-06 | 1975-02-11 | Texaco Inc | Station measurements of earth formation thermal conductivity |
| US3892128A (en) * | 1972-07-17 | 1975-07-01 | Texaco Inc | Methods for thermal well logging |
| US4120199A (en) * | 1977-03-10 | 1978-10-17 | Standard Oil Company (Indiana) | Hydrocarbon remote sensing by thermal gradient measurement |
| US4575260A (en) * | 1984-05-10 | 1986-03-11 | Halliburton Company | Thermal conductivity probe for fluid identification |
| US4676664A (en) * | 1983-07-15 | 1987-06-30 | The Trustees Of Columbia University In The City Of New York | Exploring for subsurface hydrocarbons by sea floor temperature gradients preferably using a multiplexed thermistor probe |
-
1989
- 1989-03-13 US US07/322,790 patent/US4947682A/en not_active Expired - Lifetime
-
1990
- 1990-03-08 WO PCT/US1990/001269 patent/WO1990010781A1/en not_active Ceased
- 1990-03-08 AU AU54159/90A patent/AU5415990A/en not_active Abandoned
Patent Citations (6)
| Publication number | Priority date | Publication date | Assignee | Title |
|---|---|---|---|---|
| US3217550A (en) * | 1962-06-11 | 1965-11-16 | Geothermal Surveys Inc | Geothermal prospecting |
| US3892128A (en) * | 1972-07-17 | 1975-07-01 | Texaco Inc | Methods for thermal well logging |
| US3864969A (en) * | 1973-08-06 | 1975-02-11 | Texaco Inc | Station measurements of earth formation thermal conductivity |
| US4120199A (en) * | 1977-03-10 | 1978-10-17 | Standard Oil Company (Indiana) | Hydrocarbon remote sensing by thermal gradient measurement |
| US4676664A (en) * | 1983-07-15 | 1987-06-30 | The Trustees Of Columbia University In The City Of New York | Exploring for subsurface hydrocarbons by sea floor temperature gradients preferably using a multiplexed thermistor probe |
| US4575260A (en) * | 1984-05-10 | 1986-03-11 | Halliburton Company | Thermal conductivity probe for fluid identification |
Non-Patent Citations (10)
| Title |
|---|
| Drury, M. J. and Jessop, A. M., "The Estimation of Rock Thermal Conductivity from Mineral Content--An Assessment of Techniques," Zbl. Geol. Paleont, Teil I, 1983; pp. 35-48. |
| Drury, M. J. and Jessop, A. M., The Estimation of Rock Thermal Conductivity from Mineral Content An Assessment of Techniques, Zbl. Geol. Paleont, Teil I, 1983; pp. 35 48. * |
| Herzog, R., L. Colson, B. Seeman, M. O Brien, H. Scott, D. McKeon, P. Wraight, J. Grau, J. Schweitzer, and M. Herron, Geochemical Logging with Spectrometry Tools, Society of Petroleum Engineers, Paper 16792, 1987. * |
| Herzog, R., L. Colson, B. Seeman, M. O'Brien, H. Scott, D. McKeon, P. Wraight, J. Grau, J. Schweitzer, and M. Herron, "Geochemical Logging with Spectrometry Tools," Society of Petroleum Engineers, Paper 16792, 1987. |
| Meyer, H. J. and McGee, H. W., "Oil and Gas Fields Accompanied by Geothermal Anomalies in Rocky Mountain Region," Am. Assoc. Petr. Geol. Bull. 69, No. 6, 1986, pp. 933-945. |
| Meyer, H. J. and McGee, H. W., Oil and Gas Fields Accompanied by Geothermal Anomalies in Rocky Mountain Region, Am. Assoc. Petr. Geol. Bull. 69, No. 6, 1986, pp. 933 945. * |
| Roberts, W. H. III, "Some Uses of Temperature Data in Petroleum Exploration in Unconventional Methods in Exploration for Petroleum and Natural Gas," II, ed. B. M. Gottlieb, Inst. Study of Earth and Man, SMU Press, Dallas, 1981, pp. 8-49. |
| Roberts, W. H. III, Some Uses of Temperature Data in Petroleum Exploration in Unconventional Methods in Exploration for Petroleum and Natural Gas, II, ed. B. M. Gottlieb, Inst. Study of Earth and Man, SMU Press, Dallas, 1981, pp. 8 49. * |
| Williams, C. F., Anderson, R. N., and Broglia, C., "In Situ Investigations of Thermal Conductivity, Heat Production, and Past Hydrothermal Circulation in the Cajon Pass Scientific Drill Hole," Geophys. Res. Lett., 15, 9, 1988, pp. 985-988. |
| Williams, C. F., Anderson, R. N., and Broglia, C., In Situ Investigations of Thermal Conductivity, Heat Production, and Past Hydrothermal Circulation in the Cajon Pass Scientific Drill Hole, Geophys. Res. Lett., 15, 9, 1988, pp. 985 988. * |
Cited By (25)
| Publication number | Priority date | Publication date | Assignee | Title |
|---|---|---|---|---|
| US5375465A (en) * | 1993-04-15 | 1994-12-27 | Royal Wireline, Inc. | Method for gas/liquid well profiling |
| US5860483A (en) * | 1995-05-24 | 1999-01-19 | Havig; Sven O. | Method for installing electronic equipment below soft earth surface |
| US6325161B1 (en) | 1995-05-24 | 2001-12-04 | Petroleum Geo-Services (Us), Inc | Method and apparatus for installing electronic equipment below soft earth surface layer |
| US5743642A (en) * | 1996-06-24 | 1998-04-28 | Fons; Lloyd C. | Method for compensating earth surface temperatures for the skyward effect thereon |
| US5964530A (en) * | 1996-06-24 | 1999-10-12 | Fons; Lloyd C. | Method for compensating earth surface temperatures for the skyward effect thereon |
| RU2125149C1 (en) * | 1998-06-11 | 1999-01-20 | Вяхирев Рем Иванович | Method for determining lower boundary of occurrence of permafrost ground |
| US6497279B1 (en) * | 1998-08-25 | 2002-12-24 | Sensor Highway Limited | Method of using a heater with a fiber optic string in a wellbore |
| US6769805B2 (en) | 1998-08-25 | 2004-08-03 | Sensor Highway Limited | Method of using a heater with a fiber optic string in a wellbore |
| US6789937B2 (en) * | 2001-11-30 | 2004-09-14 | Schlumberger Technology Corporation | Method of predicting formation temperature |
| RU2329370C1 (en) * | 2006-11-07 | 2008-07-20 | ООО "Ямбурггаздобыча" | Method of permafrost rock bedding delimitation |
| US8444315B2 (en) * | 2008-09-30 | 2013-05-21 | Schlumberger Technology Corporation | Method of determining thermophysical properties of solid bodies |
| US20100080260A1 (en) * | 2008-09-30 | 2010-04-01 | Schlumberger Technology Corporation | Method of determining thermophysical properties of solid bodies |
| US8630816B2 (en) | 2008-11-17 | 2014-01-14 | Sensortran, Inc. | High spatial resolution fiber optic temperature sensor |
| US20120057614A1 (en) * | 2010-09-03 | 2012-03-08 | Randy Allen Normann | Geothermal temperature gradient measurement |
| US10261974B2 (en) | 2012-08-20 | 2019-04-16 | Statoil Petroleum As | Temperature modeling constrained on geophysical data and kinematic restoration |
| RU2596627C1 (en) * | 2012-08-20 | 2016-09-10 | Статойл Петролеум Ас | Simulation of temperature, limited by geophysical data and kinematic reduction |
| US9791431B2 (en) * | 2013-07-19 | 2017-10-17 | Ingrain, Inc. | Cuttings-based well logging |
| US20150025863A1 (en) * | 2013-07-19 | 2015-01-22 | Ingrain, Inc. | Cuttings-based well logging |
| US20160376887A1 (en) * | 2015-06-26 | 2016-12-29 | University Of Louisiana At Lafayette | Method for determining pore pressure in oil and gas wells using basin thermal characteristics |
| US10563499B2 (en) * | 2015-06-26 | 2020-02-18 | University Of Louisiana At Lafayette | Method for determining pore pressure in oil and gas wells using basin thermal characteristics |
| US11060387B2 (en) * | 2017-01-18 | 2021-07-13 | Halliburton Energy Services, Inc. | Determining fluid allocation in a well with a distributed temperature sensing system using data from a distributed acoustic sensing system |
| CN107762483A (en) * | 2017-11-02 | 2018-03-06 | 中国石油天然气集团公司 | A kind of Fluid Identification Method of coefficient correlation and envelope size based on log |
| CN107762483B (en) * | 2017-11-02 | 2020-10-13 | 中国石油天然气集团公司 | Fluid identification method based on correlation coefficient and envelope area of logging curve |
| CN109854230A (en) * | 2017-11-30 | 2019-06-07 | 中国石油天然气股份有限公司 | Well testing method and device |
| CN109854230B (en) * | 2017-11-30 | 2022-05-10 | 中国石油天然气股份有限公司 | Well testing method and device |
Also Published As
| Publication number | Publication date |
|---|---|
| AU5415990A (en) | 1990-10-09 |
| WO1990010781A1 (en) | 1990-09-20 |
Similar Documents
| Publication | Publication Date | Title |
|---|---|---|
| US4947682A (en) | Method of locating oil and gas horizons using a wellbore heat flow log | |
| US6571619B2 (en) | Real time petrophysical evaluation system | |
| Passey et al. | A practical model for organic richness from porosity and resistivity logs | |
| Andrews-Speed et al. | Temperatures and depth-dependent heat flow in western North Sea | |
| Foster | Estimation of formation pressures from electrical surveys-Offshore Louisiana | |
| Brigaud et al. | Estimating thermal conductivity in sedimentary basins using lithologic data and geophysical well logs | |
| Anderson et al. | Permeability versus depth in the upper oceanic crust: In situ measurements in DSDP hole 504B, eastern equatorial Pacific | |
| He et al. | Heat flow and thermal maturity modelling in the northern carnarvon basin, north west shelf, Australia | |
| US8185314B2 (en) | Method and system for determining dynamic permeability of gas hydrate saturated formations | |
| Charsky et al. | Accurate, direct total organic carbon (TOC) log from a new advanced geochemical spectroscopy tool: Comparison with conventional approaches for TOC estimation | |
| Valley et al. | Stress magnitudes in the Basel enhanced geothermal system | |
| Peters et al. | Criteria to determine borehole formation temperatures for calibration of basin and petroleum system models | |
| Gallardo et al. | Thermal structure of the Anadarko Basin | |
| Majorowicz et al. | Deep subpermafrost thermal regime in the Mackenzie Delta basin, northern Canada; analysis from petroleum bottom-hole temperature data | |
| Lesage et al. | Pore-pressure and fracture-gradient predictions | |
| Morgan et al. | New Geothermal–Gradient Maps for Colorado’s Sedimentary Basins | |
| Opuwari | Petrophysical evaluation of the Albian age gas bearing sandstone reservoirs of the OM field, Orange basin, South Africa | |
| Paillet et al. | Analysis of geophysical well logs obtained in the State 2–14 borehole, Salton Sea geothermal area, California | |
| Byrners et al. | Petrophysics of low-permeability medina sandstone, Northwestern Pennsylvania, Appalachian Basin | |
| Underschultz et al. | Estimating formation water salinity from wireline pressure data: Case study in the Vulcan sub-basin | |
| Thomas et al. | The scope and perspective of ROS measurement and flood monitoring | |
| Iuras et al. | The total organic carbon estimation of Visean organic rich formation with limited logging dataset | |
| Elhaddad et al. | A method for determining fluids contact and identifying types of reservoir fluids in the F3-sandstone reservoir, field case study in Libya | |
| Dolenc et al. | Raft River geoscience case study | |
| Facer | Temperature corrections for bore hole data as part of thermal state, source and maturation investigations of basins |
Legal Events
| Date | Code | Title | Description |
|---|---|---|---|
| AS | Assignment |
Owner name: TRUSTEES OF COLUMBIA UNIVERSITY IN THE CITY OF NEW Free format text: ASSIGNMENT OF ASSIGNORS INTEREST.;ASSIGNORS:ANDERSON, ROGER N.;WILLIAMS, COLIN F.;REEL/FRAME:005079/0204;SIGNING DATES FROM 19890330 TO 19890510 |
|
| STCF | Information on status: patent grant |
Free format text: PATENTED CASE |
|
| FPAY | Fee payment |
Year of fee payment: 4 |
|
| FEPP | Fee payment procedure |
Free format text: PAYOR NUMBER ASSIGNED (ORIGINAL EVENT CODE: ASPN); ENTITY STATUS OF PATENT OWNER: SMALL ENTITY |
|
| FPAY | Fee payment |
Year of fee payment: 8 |
|
| FPAY | Fee payment |
Year of fee payment: 12 |
|
| REMI | Maintenance fee reminder mailed |