US4603585A - Method for representing elastic parameters of object surfaces - Google Patents

Method for representing elastic parameters of object surfaces Download PDF

Info

Publication number
US4603585A
US4603585A US06/712,110 US71211085A US4603585A US 4603585 A US4603585 A US 4603585A US 71211085 A US71211085 A US 71211085A US 4603585 A US4603585 A US 4603585A
Authority
US
United States
Prior art keywords
point
frequency
difference signal
steps
signal
Prior art date
Legal status (The legal status is an assumption and is not a legal conclusion. Google has not performed a legal analysis and makes no representation as to the accuracy of the status listed.)
Expired - Fee Related
Application number
US06/712,110
Inventor
Abdullah Atalar
Current Assignee (The listed assignees may be inaccurate. Google has not performed a legal analysis and makes no representation or warranty as to the accuracy of the list.)
Ernst Leitz Wetzlar GmbH
Original Assignee
Ernst Leitz Wetzlar GmbH
Priority date (The priority date is an assumption and is not a legal conclusion. Google has not performed a legal analysis and makes no representation as to the accuracy of the date listed.)
Filing date
Publication date
Application filed by Ernst Leitz Wetzlar GmbH filed Critical Ernst Leitz Wetzlar GmbH
Assigned to ERNST LEITZ WETZLAR GMBH reassignment ERNST LEITZ WETZLAR GMBH ASSIGNMENT OF ASSIGNORS INTEREST. Assignors: ATALAR, ABDULLAH
Application granted granted Critical
Publication of US4603585A publication Critical patent/US4603585A/en
Anticipated expiration legal-status Critical
Expired - Fee Related legal-status Critical Current

Links

Images

Classifications

    • GPHYSICS
    • G01MEASURING; TESTING
    • G01NINVESTIGATING OR ANALYSING MATERIALS BY DETERMINING THEIR CHEMICAL OR PHYSICAL PROPERTIES
    • G01N29/00Investigating or analysing materials by the use of ultrasonic, sonic or infrasonic waves; Visualisation of the interior of objects by transmitting ultrasonic or sonic waves through the object
    • G01N29/34Generating the ultrasonic, sonic or infrasonic waves, e.g. electronic circuits specially adapted therefor
    • G01N29/348Generating the ultrasonic, sonic or infrasonic waves, e.g. electronic circuits specially adapted therefor with frequency characteristics, e.g. single frequency signals, chirp signals
    • GPHYSICS
    • G01MEASURING; TESTING
    • G01NINVESTIGATING OR ANALYSING MATERIALS BY DETERMINING THEIR CHEMICAL OR PHYSICAL PROPERTIES
    • G01N29/00Investigating or analysing materials by the use of ultrasonic, sonic or infrasonic waves; Visualisation of the interior of objects by transmitting ultrasonic or sonic waves through the object
    • G01N29/04Analysing solids
    • G01N29/041Analysing solids on the surface of the material, e.g. using Lamb, Rayleigh or shear waves
    • GPHYSICS
    • G01MEASURING; TESTING
    • G01NINVESTIGATING OR ANALYSING MATERIALS BY DETERMINING THEIR CHEMICAL OR PHYSICAL PROPERTIES
    • G01N29/00Investigating or analysing materials by the use of ultrasonic, sonic or infrasonic waves; Visualisation of the interior of objects by transmitting ultrasonic or sonic waves through the object
    • G01N29/04Analysing solids
    • G01N29/06Visualisation of the interior, e.g. acoustic microscopy
    • G01N29/0654Imaging
    • G01N29/0681Imaging by acoustic microscopy, e.g. scanning acoustic microscopy
    • GPHYSICS
    • G01MEASURING; TESTING
    • G01NINVESTIGATING OR ANALYSING MATERIALS BY DETERMINING THEIR CHEMICAL OR PHYSICAL PROPERTIES
    • G01N29/00Investigating or analysing materials by the use of ultrasonic, sonic or infrasonic waves; Visualisation of the interior of objects by transmitting ultrasonic or sonic waves through the object
    • G01N29/22Details, e.g. general constructional or apparatus details
    • G01N29/221Arrangements for directing or focusing the acoustical waves
    • GPHYSICS
    • G01MEASURING; TESTING
    • G01NINVESTIGATING OR ANALYSING MATERIALS BY DETERMINING THEIR CHEMICAL OR PHYSICAL PROPERTIES
    • G01N29/00Investigating or analysing materials by the use of ultrasonic, sonic or infrasonic waves; Visualisation of the interior of objects by transmitting ultrasonic or sonic waves through the object
    • G01N29/22Details, e.g. general constructional or apparatus details
    • G01N29/24Probes
    • G01N29/2456Focusing probes
    • GPHYSICS
    • G01MEASURING; TESTING
    • G01NINVESTIGATING OR ANALYSING MATERIALS BY DETERMINING THEIR CHEMICAL OR PHYSICAL PROPERTIES
    • G01N29/00Investigating or analysing materials by the use of ultrasonic, sonic or infrasonic waves; Visualisation of the interior of objects by transmitting ultrasonic or sonic waves through the object
    • G01N29/22Details, e.g. general constructional or apparatus details
    • G01N29/26Arrangements for orientation or scanning by relative movement of the head and the sensor
    • GPHYSICS
    • G01MEASURING; TESTING
    • G01NINVESTIGATING OR ANALYSING MATERIALS BY DETERMINING THEIR CHEMICAL OR PHYSICAL PROPERTIES
    • G01N2291/00Indexing codes associated with group G01N29/00
    • G01N2291/01Indexing codes associated with the measuring variable
    • G01N2291/015Attenuation, scattering
    • GPHYSICS
    • G01MEASURING; TESTING
    • G01NINVESTIGATING OR ANALYSING MATERIALS BY DETERMINING THEIR CHEMICAL OR PHYSICAL PROPERTIES
    • G01N2291/00Indexing codes associated with group G01N29/00
    • G01N2291/04Wave modes and trajectories
    • G01N2291/042Wave modes
    • G01N2291/0423Surface waves, e.g. Rayleigh waves, Love waves
    • GPHYSICS
    • G01MEASURING; TESTING
    • G01NINVESTIGATING OR ANALYSING MATERIALS BY DETERMINING THEIR CHEMICAL OR PHYSICAL PROPERTIES
    • G01N2291/00Indexing codes associated with group G01N29/00
    • G01N2291/04Wave modes and trajectories
    • G01N2291/042Wave modes
    • G01N2291/0426Bulk waves, e.g. quartz crystal microbalance, torsional waves
    • GPHYSICS
    • G01MEASURING; TESTING
    • G01NINVESTIGATING OR ANALYSING MATERIALS BY DETERMINING THEIR CHEMICAL OR PHYSICAL PROPERTIES
    • G01N2291/00Indexing codes associated with group G01N29/00
    • G01N2291/04Wave modes and trajectories
    • G01N2291/044Internal reflections (echoes), e.g. on walls or defects
    • GPHYSICS
    • G01MEASURING; TESTING
    • G01NINVESTIGATING OR ANALYSING MATERIALS BY DETERMINING THEIR CHEMICAL OR PHYSICAL PROPERTIES
    • G01N2291/00Indexing codes associated with group G01N29/00
    • G01N2291/10Number of transducers
    • G01N2291/101Number of transducers one transducer
    • GPHYSICS
    • G01MEASURING; TESTING
    • G01NINVESTIGATING OR ANALYSING MATERIALS BY DETERMINING THEIR CHEMICAL OR PHYSICAL PROPERTIES
    • G01N2291/00Indexing codes associated with group G01N29/00
    • G01N2291/26Scanned objects
    • G01N2291/263Surfaces
    • G01N2291/2632Surfaces flat

Definitions

  • the invention relates to a method for representing elastic parameters of object surfaces by scanning the object surface with a focused acoustic beam and detecting the interference between the ultrasonic rays specularly reflected at the object surface and the ultrasonic rays emitted from the object surface after excitation of surface waves.
  • Scanning of an object surface by means of a focused acoustic beam can be carried out by means of an acoustic microscope operating in a reflection mode.
  • an acoustic lens arrangement is focused onto a certain object plane which is then scanned in a raster-patterned movement perpendicularly to the direction of propagation of the acoustic beam (x/y scanning).
  • the signal reflected by the object is isolated from the emitted signal and used for image representation.
  • V(z) curves obtained by this means are produced by interference of a specularly reflected ultrasonic beam with an ultrasonic beam which is returning to the acoustic lens arrangement, after being laterally offset, as a result of the excitation of surface waves.
  • the respective output voltage at the acoustic transducer is a reflection signal which corresponds to the integration of the acoustic interference field over the area of the transducer.
  • the present invention is directed toward providing a method by means of which the information contained in the image contrast on the distribution of elastic parameters existing in the object surface scanned can be made visible.
  • the method according to the invention utilizes the finding that the curve shapes obtained with the known V(z) measurements essentially depend on the type of the surface wave excited in each case.
  • the amplitude and wavelength of this surface wave is influenced by the elastic characteristics of the material at the object point irradiated.
  • the possible extent of the surface wave is affected by the magnitude of z.
  • different amplitudes and phase relationships are obtained for the ultrasonic beams which are generated by the surface waves, received by the acoustic lens arrangement, and which interfere with the rays specularly reflected at the object surface.
  • the V(z) curves show typical interference maxima and minima.
  • the z-independent image signals are suppressed by taking an image from two object planes and determining the difference between them.
  • the acoustic image then shows the change in contrast between the two images originally taken.
  • the change in contrast thus made visible is a direct image of the distribution of the elastic parameters in the object surface.
  • Both the method involving position change and the method involving frequency change can be carried out in such a manner that initially in each case the object is completely scanned and the images obtained are stored.
  • this requires a relatively large expenditure for providing the necessary memory capacity.
  • very high demands are made on the quality of the image taking since the parameters, which are constant during the image taking, must not change during the scanning which varies with time. For this reason, it is of advantage to carry out the switching-over operations at each scanning point before going to the next scanning point.
  • FIG. 1 shows an acousto-microscopic reflection arrangement and the diagrammatic optical path
  • FIG. 2 shows V(z) curves diagrammatically for various frequencies
  • FIG. 3 shows a circuit arrangement for alternating frequency switching
  • FIG. 4 shows another circuit arrangement for alternating frequency switching
  • FIG. 5 shows a circuit arrangement for generating the amplitude difference including weighting of the measurement pulses
  • FIG. 6 shows another circuit arrangement for forming the difference.
  • FIG. 1 shows a greatly simplified representation of an acousto-microscopic reflection arrangement. It consists of an acoustic lens 1 including a piezoelectric transmitter 2. This is used first for generating a planar ultrasonic wave front indicated by the ray 3. The spherical cavity 4 in the acoustic lens focuses the acoustic beam onto the object 5 to be examined. The intermediate space between the acoustic lens 1 and the object 5 is filled with an immersing medium, not shown in this Figure.
  • the ray 3 impinging on the object surface is specularly reflected at the surface as ray 3'.
  • a part of the ray 3 penetrates into the object and is reflected back out of the focal plane as ray 3" into the acoustic lens.
  • Another ray 3"' is generated by the surface wave 6.
  • all three rays directed towards the acoustic lens correspond to planar soundwaves reaching the transmitter with a mutual offset in phase and interfering with each other.
  • the transmitter integrates the acoustic field and converts it into electric signals.
  • the method operating with frequency switching is hardly influenced by the layer structure below the object surface.
  • the change in frequency influences the depth of penetration of the ray 3 and the focus position
  • the changes in the ray 3" are much smaller than with a change in position.
  • the influence of the change in frequency on the depth of penetration and on the wavelength of the surface wave 6 and thus on the ray 3"' is considerable.
  • the difference signal after frequency switching, formed in accordance with the invention reacts also to smaller changes in the elastic parameters in the object surface. Therefore, this method is more sensitive.
  • FIG. 2 shows the typical variation of a V(z) curve. No interference maxima or minima whatever are observed for positive z values. These appear only for negative z values.
  • the continuous curve is for a frequency f 1 and the dashed curve is for a frequency f 2 .
  • the diagram depicts the dependence of individual signal values V on a change in position or a change in frequency, respectively.
  • the differential image shows only the frequency-dependent parts of the object.
  • the frequency-dependent depth of penetration of the surface wave becomes significant.
  • the resultant image is therefore very sensitively dependent on a layer thickness structure which is of the order of magnitude of the depth of penetration of the surface wave.
  • the f 1 and f 2 pulses are amplified in a power amplifier 15 and are successively conducted via a circulator 16 to the piezoelectric transmitter, not shown, of an acoustic lens 17. After that, the input line is blocked by the circular 16 so that the f 1 and f 2 measurement signals received by the acoustic lens 17 can be fed undisturbed into the receiver section of the circuit arrangement.
  • the signal output C of the intermediate-frequency amplifier 23 appear pulses the amplitude of which represents the acousto-microscopic measurement signal for two different frequencies in alternating sequence. Since the repetition frequency of the pulses is relatively high and a relatively slow mechanical scanning method (x/y scan) is used, the successive pulses can be considered to have originated from the same object point.
  • two sample-and-hold components 50, 51 are inserted into the line C carrying the measurement signal, in such a manner that one samples only the f 1 measurement pulses and the other one only the f 2 measurement pulses.
  • the sample-and-hold components 50, 51 are enabled by two AND gates 52, 53 as a function of the switching signals A and B.
  • the signal A can also be delayed in a delay unit 54 by the transit time between the excitation signal at the acoustic lens 17 and reception of the measurement signal.
  • the analog difference forming circuits according to FIGS. 5 and 6 can also be used for a measurement signal sequence produced with an alternating z position setting at the signal input C.
  • the control signal B defines the respective focus position of the acoustic lens 17 which is suitably generated by appropriate z adjustment of the object stage when the lens is performing the x/y scanning movement.
  • a suitable adjustment is, for example, a piezoelectric adjustment of the object stage in the z direction.
  • the measurement signals can also be suitably converted in each case into digital values and the forming of the difference and possible weighting of the signals carried out in a computer. This will be advantageous especially if the object scanning from one plane or at one frequency is to be followed also by automatic image analysis.

Landscapes

  • Physics & Mathematics (AREA)
  • Health & Medical Sciences (AREA)
  • Life Sciences & Earth Sciences (AREA)
  • Chemical & Material Sciences (AREA)
  • Analytical Chemistry (AREA)
  • Biochemistry (AREA)
  • General Health & Medical Sciences (AREA)
  • General Physics & Mathematics (AREA)
  • Immunology (AREA)
  • Pathology (AREA)
  • Acoustics & Sound (AREA)
  • Investigating Or Analyzing Materials By The Use Of Ultrasonic Waves (AREA)

Abstract

A method for representing elastic parameters of object surfaces by scanning the object surface with a focused acoustic beam and detection of the interferences between the ultrasonic beams specularly reflected at the object surface and the ultrasonic beams emitted from the object surface after excitation of surface waves in which either two raster-shaped scannings of the object surface are carried out at different focus positions relative to the object surface or successive scannings are carried out with acoustic beams of different frequency. Reflection signals associated with identical raster points form a difference signal which is used for representing the image.

Description

BACKGROUND OF THE INVENTION
The invention relates to a method for representing elastic parameters of object surfaces by scanning the object surface with a focused acoustic beam and detecting the interference between the ultrasonic rays specularly reflected at the object surface and the ultrasonic rays emitted from the object surface after excitation of surface waves.
Scanning of an object surface by means of a focused acoustic beam can be carried out by means of an acoustic microscope operating in a reflection mode. In the normal operating mode, an acoustic lens arrangement is focused onto a certain object plane which is then scanned in a raster-patterned movement perpendicularly to the direction of propagation of the acoustic beam (x/y scanning). The signal reflected by the object is isolated from the emitted signal and used for image representation.
Another known operating mode involves scanning the object at a certain place only in the direction of propagation of the acoustic beam (z scanning). In this arrangement, therefore, the ultrasonic focus is continuously shifted into the depth of the object. The so-called V(z) curves obtained by this means are produced by interference of a specularly reflected ultrasonic beam with an ultrasonic beam which is returning to the acoustic lens arrangement, after being laterally offset, as a result of the excitation of surface waves. The respective output voltage at the acoustic transducer is a reflection signal which corresponds to the integration of the acoustic interference field over the area of the transducer. It is known that materials having different elastic parameters display a V(z) dependence which is characteristic of the material. This is why the curves can be used for identifying homogeneous layers of material.
One advantage of acoustical reflection microscopy consists in the fact that layers lying below the object surface can also be imaged if the acoustic beam is focused onto such a plane. If the beam is focused on the object surface, it is assumed that z=0 for the surface. For focus positions below the object surface, z for the surface is designated to be negative. With different negative z values, the contrasts of the acoustic images is determined by the respective local V(z) value because of the abovementioned interference phenomena. This means that the contrast of the acoustic image must contain information on elastic parameters inside the object surface. A detailed discussion of the relationships between V(z) and the acoustic image contrast is contained in J. Appl. Phys. 49 (10), pp. 5130-5139 (1978).
SUMMARY OF THE INVENTION
The present invention is directed toward providing a method by means of which the information contained in the image contrast on the distribution of elastic parameters existing in the object surface scanned can be made visible.
The method according to the invention utilizes the finding that the curve shapes obtained with the known V(z) measurements essentially depend on the type of the surface wave excited in each case. The amplitude and wavelength of this surface wave is influenced by the elastic characteristics of the material at the object point irradiated. The possible extent of the surface wave is affected by the magnitude of z. In this manner, different amplitudes and phase relationships are obtained for the ultrasonic beams which are generated by the surface waves, received by the acoustic lens arrangement, and which interfere with the rays specularly reflected at the object surface. The V(z) curves show typical interference maxima and minima.
This influence on the imaging rays by processes occurring in a thin surface layer of the object is superimposed to a more or less large degree on every acoustic image representation and, as already mentioned, influences the contrast of the image obtained from a certain z plane. According to the invention, the z-independent image signals are suppressed by taking an image from two object planes and determining the difference between them. The acoustic image then shows the change in contrast between the two images originally taken. The change in contrast thus made visible is a direct image of the distribution of the elastic parameters in the object surface.
A more accurate examination of the parameters determining the interference maxima and minima in the V(z) curves shows that these maxima and minima also depend on the frequency of the acoustic beams used for the examination. In particular, it is found that the shape of the curve depends on the product of the ultrasonic frequency f and the relative distance z of the ultrasonic focus from the object surface. For this reason, the invention utilizes the further finding that the elastic parameters can be represented also by keeping z constant and varying the frequency f. Changing the frequency instead of the position is much simpler and can be carried out more rapidly. In addition, it has the advantage that, when the difference is found, the image components to be suppressed originate from the same object plane. In addition, the area of extent of the surface wave is identical with both measurements so that the change in contrast shown has an even closer relationship to the locally existing elastic properties of the material of the object surface.
Both the method involving position change and the method involving frequency change can be carried out in such a manner that initially in each case the object is completely scanned and the images obtained are stored. However, this requires a relatively large expenditure for providing the necessary memory capacity. In addition, very high demands are made on the quality of the image taking since the parameters, which are constant during the image taking, must not change during the scanning which varies with time. For this reason, it is of advantage to carry out the switching-over operations at each scanning point before going to the next scanning point.
When changing the frequency, an additional problem arises from the fact that the total gain in the acoustic microscope used for taking the image varies as a function of the ultrasonic frequency. In order to obtain complete signal cancellation with the frequency-independent parts of the object, the amplitudes of the two images must be suitably weighted in each case.
BRIEF DESCRIPTION OF THE DRAWINGS
In the text which follows, the method according to the invention is explained in greater detail with the assistance of the drawing. In particular, advantageous circuit arrangements for carrying out the method are specified. In detail:
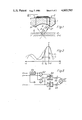
FIG. 1 shows an acousto-microscopic reflection arrangement and the diagrammatic optical path;
FIG. 2 shows V(z) curves diagrammatically for various frequencies;
FIG. 3 shows a circuit arrangement for alternating frequency switching;
FIG. 4 shows another circuit arrangement for alternating frequency switching;
FIG. 5 shows a circuit arrangement for generating the amplitude difference including weighting of the measurement pulses; and
FIG. 6 shows another circuit arrangement for forming the difference.
DETAILED DESCRIPTION OF THE PREFERRED EMBODIMENTS
FIG. 1 shows a greatly simplified representation of an acousto-microscopic reflection arrangement. It consists of an acoustic lens 1 including a piezoelectric transmitter 2. This is used first for generating a planar ultrasonic wave front indicated by the ray 3. The spherical cavity 4 in the acoustic lens focuses the acoustic beam onto the object 5 to be examined. The intermediate space between the acoustic lens 1 and the object 5 is filled with an immersing medium, not shown in this Figure.
The object surface is assumed to be at -z1 and the focus of the acoustic lens 1 in the plane z=0. The ray 3 impinging on the object surface is specularly reflected at the surface as ray 3'. A part of the ray 3 penetrates into the object and is reflected back out of the focal plane as ray 3" into the acoustic lens. Another ray 3"' is generated by the surface wave 6. Within the lens body, all three rays directed towards the acoustic lens correspond to planar soundwaves reaching the transmitter with a mutual offset in phase and interfering with each other. The transmitter integrates the acoustic field and converts it into electric signals.
The events occurring during the irradiation of the object surface will be explained diagrammatically with the aid of the optical path shown in FIG. 1. Only rays falling into the area of the aperture of the acoustic lens are used. The return rays 3', 3", and 3"' mutually interfere and constitute a reflection signal.
It should be noted in this regard that the events connected with the generation of the surface wave 6 are very complex. Also, as shown in the illustration, the area from which rays 3"' can be produced depends on the negative z position of the object surface. The rays 3" are very strongly affected by a layer structure located between the object surface and the focal plane. This is why V(z) curves react very sensitively to variations in layer thickness.
Clearly, the method operating with frequency switching is hardly influenced by the layer structure below the object surface. Although the change in frequency influences the depth of penetration of the ray 3 and the focus position, the changes in the ray 3" are much smaller than with a change in position. However, the influence of the change in frequency on the depth of penetration and on the wavelength of the surface wave 6 and thus on the ray 3"' is considerable. For this reason, the difference signal after frequency switching, formed in accordance with the invention, reacts also to smaller changes in the elastic parameters in the object surface. Therefore, this method is more sensitive.
FIG. 2 shows the typical variation of a V(z) curve. No interference maxima or minima whatever are observed for positive z values. These appear only for negative z values. The continuous curve is for a frequency f1 and the dashed curve is for a frequency f2. The diagram depicts the dependence of individual signal values V on a change in position or a change in frequency, respectively.
If an object surface is arranged at a distance -z1 from the focal plane and a frequency f1 is used, a value v1 is measured. If then the frequency is changed into f2 at the same object position, the measured value will change to V2. The same value V2 is found if frequency f1 is used in object position -z2. The signal change can also be considered to have resulted if the frequency f1 had been maintained but the object moved to position -z2. According to the invention, the difference V2 -V1 is formed and used for image representation. Thus, the highest-contrast representation of the elastic parameters is obtained from the z adjustments in which the V(z) curves have the steepest slope.
The method of frequency switching can also be carried out in the object position z=0. In this case, the differential image shows only the frequency-dependent parts of the object. In this case, the frequency-dependent depth of penetration of the surface wave becomes significant. The resultant image is therefore very sensitively dependent on a layer thickness structure which is of the order of magnitude of the depth of penetration of the surface wave.
The circuit arrangement shown in FIG. 3 provides the possibility of an alternating switching between operating frequencies f1 and f2. It consists of two transducer oscillators 110 and 120 for generating high-frequency oscillations having frequencies f1 and f2. These oscillations are alternately switched to the following line by a following two-way pin switch 13. The pin switch 13 is controlled by rectangular pulses which are fed into the circuit arrangement via an input B. Another pin switch 14 generates from the trains of oscillations short pulses having the frequencies f1, f2. The switch 14 is controlled by rectangular pulses which are fed into the circuit via an input A. The switching signals A are displaced in time by a small amount with respect to the switching edges of the signals B. In practice, the repetition frequency of the switching signals A is about 500 kHz.
The f1 and f2 pulses are amplified in a power amplifier 15 and are successively conducted via a circulator 16 to the piezoelectric transmitter, not shown, of an acoustic lens 17. After that, the input line is blocked by the circular 16 so that the f1 and f2 measurement signals received by the acoustic lens 17 can be fed undisturbed into the receiver section of the circuit arrangement.
The receiver section contains a preamplifier 18 and a subsequent superheterodyne circuit. This circuit consists of a mixing element 19, two local oscillators 20, 21, a two-way pin switch 22 and an intermediate-frequency amplifier 23. In a superheterodyne circuit, the frequency of the local oscillator must be tuned in such a way that the frequency difference between the local oscillator frequency and the transducer oscillator frequency is equal to the intermediate frequency fM of the intermediate-frequency amplifier 23. In the proposed system, this is achieved by inserting two local oscillators 20, 21 having the frequencies f1 ±fM and f2 ±fM which, via the pin switch 22, become active at the mixing element 19 with the same alternating switching sequence B as is used to switch the transmitter oscillators 11, 12. In this manner, the same frequency is always present at the input of the intermediate-frequency amplifier 23. The signal output C is terminated with a high-frequency diode 24 for generating a video signal.
At the signal output C of the intermediate-frequency amplifier 23 appear pulses the amplitude of which represents the acousto-microscopic measurement signal for two different frequencies in alternating sequence. Since the repetition frequency of the pulses is relatively high and a relatively slow mechanical scanning method (x/y scan) is used, the successive pulses can be considered to have originated from the same object point.
In the circuit arrangement shown in FIG. 4, the two transducer oscillators and the two local oscillators are in each case replaced by a voltage-controlled oscillator (VCO) 40, 41. The input signals for controlling the frequency of the oscillators 40, 41 are derived from the frequency switching signal B. The direct-voltage level and the amplitude of the rectangular waves are tuned by interposed amplifiers 42, 43 in such a manner that the frequency difference of the two oscillators is equal to the intermediate frequency fM of the intermediate-frequency amplifier 23.
For generating the amplitude difference of the successive f1 and f2 measurement signal pulses, one of the circuit arrangements shown in FIGS. 5 and 6 can be used.
In FIG. 5, two sample-and-hold components 50, 51 are inserted into the line C carrying the measurement signal, in such a manner that one samples only the f1 measurement pulses and the other one only the f2 measurement pulses. For this purpose, the sample-and-hold components 50, 51 are enabled by two AND gates 52, 53 as a function of the switching signals A and B. The signal A can also be delayed in a delay unit 54 by the transit time between the excitation signal at the acoustic lens 17 and reception of the measurement signal.
The analog measurement signals produced at the output of the sample-and-hold components 50, 51 can be weighted with the assistance of adjustable potentiometers 55, 56. This weighting can be tuned in such a manner that the subsequent subtraction in the difference forming circuit 57 results in 0 for all frequency-independent parts of the object. The necessary weighting can be manually adjusted by observing a line scan (x scan).
In the circuit arrangement shown in FIG. 6, the f1 and f2 measurement pulses are input into a four-quadrant analog multiplier 60. The multiplier is controlled by the frequency switching signal B, the direct-voltage level of which is in turn controlled in a voltage level control element 61 in order to be able to set positive and negative amplitudes for the rectangular wave. In the multiplier 60, the f1 measurement pulses are multiplied by the positive amplitude value of the signal B and the f2 measurement pulses are multiplied by the negative amplitude value of the signal B. Thus the measurement pulses can be given different weighting by shifting the direct-voltage level.
At the output of the multiplier 60, a pulse sequence of alternately positive and negative measurement values is produced which subsequently passes through a low-pass filter 62. This results in the same effect as a difference forming circuit.
Naturally, the analog difference forming circuits according to FIGS. 5 and 6 can also be used for a measurement signal sequence produced with an alternating z position setting at the signal input C. In this arrangement, the control signal B defines the respective focus position of the acoustic lens 17 which is suitably generated by appropriate z adjustment of the object stage when the lens is performing the x/y scanning movement. A suitable adjustment is, for example, a piezoelectric adjustment of the object stage in the z direction.
For many applications, the measurement signals can also be suitably converted in each case into digital values and the forming of the difference and possible weighting of the signals carried out in a computer. This will be advantageous especially if the object scanning from one plane or at one frequency is to be followed also by automatic image analysis.
While several embodiments of the invention have been described, it will be understood that it is capable of further modification, and this application is intended to cover any variations, uses, or adaptations of the invention, following in general the principles of the invention and including such departures from the present disclosure as to come within the knowledge or customary practice in the art.

Claims (18)

What is claimed is:
1. A method of representing elastic parameters of the surface of an object comprising the steps for each point of a predetermined pattern of points on said surface of:
(a) directing a first acoustic beam having a first focus position at said each point;
(b) sensing a first reflection signal;
(c) directing a second acoustic beam having a second focus position different from said first focus position at said each point;
(d) sensing a second reflection signal;
(e) deriving a difference signal having a value indicative of the difference between said first and second reflection signals; and
(f) using said difference signal to represent said elastic parameters at said each point.
2. A method as claimed in claim 1, wherein said steps (a)-(f) are all executed for each point before execution proceeds to a next point.
3. A method as claimed in claim 2, wherein said one of first and second reflection signals for each point is multiplied by a weighting factor prior to derivation of said difference signal for said each point.
4. A method as claimed in claim 3, wherein said first and second focus positions are selected to maximize said difference signal at at least one of said points.
5. A method as claimed in claim 2, wherein said first and second reflection signals are fed directly to a difference-forming circuit.
6. A method as claimed in claim 1, wherein said steps (a) and (b) are both executed for every point in said pattern before execution of any of said steps (c)-(f), and then step (c) and (d) are both executed for every point in said pattern before execution of either of said steps (e) and (f).
7. A method as claimed in claim 6 wherein each of said first reflection signals and each of said second reflection signals are stored.
8. A method as claimed in claim 7 wherein one of said first and second reflection signals for each point is multiplied by a weighting factor prior to derivation of said difference signal for said each point.
9. A method as claimed in claim 6 wherein said first and second focus positions are selected to maximize said difference signal at at least one of said points.
10. A method of representing elastic parameters of the surface of an object comprising the steps for each point of a predetermined pattern of points on said surface of:
(a) directing a first acoustic beam having a first frequency at said each point;
(b) sensing a first reflection signal;
(c) directing a second acoustic beam having a second frequency different from said first frequency at said each point;
(d) sensing a second reflection signal;
(e) deriving a difference signal having a value indicative of the difference between said first and second reflection signals; and
(f) using said difference signal to represent said elastic parameters at said each point.
11. A method as claimed in claim 10 wherein said steps (a)-(f) are all executed for said each point before execution proceeds to a next point.
12. A method as claimed in claim 11 wherein one of said first and second reflection signals for each point is multiplied by a weighting factor prior to derivation of said difference signal for said point.
13. A method as claimed in claim 12 wherein said first and second frequencies are selected to maximize said difference signal at at least one of said points.
14. A method as claimed in claim 11 wherein said first and second reflection signals are fed directly to a difference-forming circuit.
15. A method as claimed in claim 10 wherein said steps (a) and (b) are both executed for every point in said pattern before execution of any of said steps (c)-(f), and then said steps (c) and (d) are executed for every point in said pattern before execution of either of said steps (e) and (f).
16. A method as claimed in claim 15 wherein each of said first reflection signals and each of said second reflection signals are stored.
17. A method as claimed in claim 16 wherein one of said first and second reflection signals for each point is multiplied by a weighting factor prior to derivation of said difference signal for said point.
18. A method as claimed in claim 15 wherein said first and second frequencies are selected to maximize said difference signal at at least one of said points.
US06/712,110 1984-03-17 1985-03-15 Method for representing elastic parameters of object surfaces Expired - Fee Related US4603585A (en)

Applications Claiming Priority (2)

Application Number Priority Date Filing Date Title
DE3409929 1984-03-17
DE19843409929 DE3409929A1 (en) 1984-03-17 1984-03-17 METHOD FOR THE DISPLAY OF ELASTIC PARAMETERS IN OBJECT SURFACES

Publications (1)

Publication Number Publication Date
US4603585A true US4603585A (en) 1986-08-05

Family

ID=6230871

Family Applications (1)

Application Number Title Priority Date Filing Date
US06/712,110 Expired - Fee Related US4603585A (en) 1984-03-17 1985-03-15 Method for representing elastic parameters of object surfaces

Country Status (4)

Country Link
US (1) US4603585A (en)
EP (1) EP0155504B1 (en)
JP (1) JPS60218062A (en)
DE (2) DE3409929A1 (en)

Cited By (5)

* Cited by examiner, † Cited by third party
Publication number Priority date Publication date Assignee Title
US4694699A (en) * 1986-06-30 1987-09-22 Universite De Sherbrooke Acoustic microscopy
US4730494A (en) * 1985-10-07 1988-03-15 Hitachi, Ltd. Method for examining a surface of a sample by means of ultrasound
US5922961A (en) * 1996-05-10 1999-07-13 The United States Of America As Represented By The Secretary Of Commerce Time and polarization resolved acoustic microscope
US20030230144A1 (en) * 2002-06-18 2003-12-18 General Electric Company Ultrasonic transducer
US20070044544A1 (en) * 2005-08-31 2007-03-01 Dmytro Chumakov Method and apparatus for determining surface characteristics by using spm techniques with acoustic excitation and real-time digitizing

Families Citing this family (4)

* Cited by examiner, † Cited by third party
Publication number Priority date Publication date Assignee Title
DE3522491A1 (en) * 1985-06-24 1987-01-02 Leitz Ernst Gmbh ACOUSTIC LENS ARRANGEMENT
US5240370A (en) * 1990-06-01 1993-08-31 Komori Corporation Pile board inserting method and a pile board inserting machine for carrying out the same
DE4224209C2 (en) * 1991-07-23 1996-05-23 Olympus Optical Co Ultrasonic measuring device
GB2373329B (en) * 2000-05-05 2003-03-05 Acoustical Tech Sg Pte Ltd Acoustic microscope

Citations (2)

* Cited by examiner, † Cited by third party
Publication number Priority date Publication date Assignee Title
US4459852A (en) * 1981-07-08 1984-07-17 Noriyoshi Chubachi Acoustic microscope using line-focus acoustic beam
US4503708A (en) * 1983-02-07 1985-03-12 Board Of Trustees Of The Leland Stanford Junior University Reflection acoustic microscope for precision differential phase imaging

Family Cites Families (4)

* Cited by examiner, † Cited by third party
Publication number Priority date Publication date Assignee Title
JPS5325485A (en) * 1976-08-21 1978-03-09 Asahi Chemical Ind Method of inspecting defects of carbon electrode
JPS5788333A (en) * 1980-11-25 1982-06-02 Hitachi Ltd Meausring device for stress distribution
JPS5822978A (en) * 1981-08-04 1983-02-10 Koji Toda Ultrasonic wave device
JPS5883257A (en) * 1981-11-13 1983-05-19 Noritoshi Nakabachi Ultrasonic microscope

Patent Citations (2)

* Cited by examiner, † Cited by third party
Publication number Priority date Publication date Assignee Title
US4459852A (en) * 1981-07-08 1984-07-17 Noriyoshi Chubachi Acoustic microscope using line-focus acoustic beam
US4503708A (en) * 1983-02-07 1985-03-12 Board Of Trustees Of The Leland Stanford Junior University Reflection acoustic microscope for precision differential phase imaging

Cited By (8)

* Cited by examiner, † Cited by third party
Publication number Priority date Publication date Assignee Title
US4730494A (en) * 1985-10-07 1988-03-15 Hitachi, Ltd. Method for examining a surface of a sample by means of ultrasound
US4694699A (en) * 1986-06-30 1987-09-22 Universite De Sherbrooke Acoustic microscopy
US5922961A (en) * 1996-05-10 1999-07-13 The United States Of America As Represented By The Secretary Of Commerce Time and polarization resolved acoustic microscope
US20030230144A1 (en) * 2002-06-18 2003-12-18 General Electric Company Ultrasonic transducer
EP1393821A1 (en) * 2002-06-18 2004-03-03 General Electric Company Ultrasonic transducer
US6952967B2 (en) 2002-06-18 2005-10-11 General Electric Company Ultrasonic transducer
US20070044544A1 (en) * 2005-08-31 2007-03-01 Dmytro Chumakov Method and apparatus for determining surface characteristics by using spm techniques with acoustic excitation and real-time digitizing
US7441446B2 (en) * 2005-08-31 2008-10-28 Advanced Micro Devices, Inc. Method and apparatus for determining surface characteristics by using SPM techniques with acoustic excitation and real-time digitizing

Also Published As

Publication number Publication date
JPS60218062A (en) 1985-10-31
EP0155504B1 (en) 1991-07-17
DE3409929A1 (en) 1985-09-26
EP0155504A2 (en) 1985-09-25
EP0155504A3 (en) 1988-10-19
DE3583447D1 (en) 1991-08-22

Similar Documents

Publication Publication Date Title
US4541281A (en) Ultrasonic microscope system
CA1129539A (en) Ultrasonic imaging system utilizing dynamic and pseudo-dynamic focusing
US4518992A (en) Acoustic imaging system and method
US4378596A (en) Multi-channel sonic receiver with combined time-gain control and heterodyne inputs
EP0642036B1 (en) Ultrasonic diagnostic equipment
US4655083A (en) Surface ultrasonic wave interference microscope
US4442713A (en) Frequency varied ultrasonic imaging array
US4603585A (en) Method for representing elastic parameters of object surfaces
US4503708A (en) Reflection acoustic microscope for precision differential phase imaging
JPH08317926A (en) Ultrasonic tomography device
US4862892A (en) Ultrasonic reflex transmission imaging method and apparatus with artifact removal
US4694699A (en) Acoustic microscopy
US5349862A (en) Apparatus for measuring the velocity of ultrasonic sound in terms of V(Z) characteristics and ultrasonic microscope using that apparatus
US5085081A (en) Ultrasonic imaging apparatus without phase distortion
JPH06114056A (en) Ultrasonic diagnostic equipment
US4491020A (en) Ultrasonic microscope
US4534359A (en) Method and means for determining frequency selective tissue attenuation in a baseband ultrasonic imaging system
US4938225A (en) Ultrasonic echograph utilizing at least one piezoelectric transducer with an associated random phase screen, and method of scanning an object by means of such an echograph
US4386530A (en) Ultrasonic imaging equipment
JPH0464350A (en) Ultrasonic imaging apparatus
US3890829A (en) Method and apparatus for acoustical imaging
JPH0545346A (en) Ultrasonic probe
US4620443A (en) Low frequency acoustic microscope
JPH09108223A (en) Ultrasonic diagnostic device
SU1518784A1 (en) Method of forming acoustic images

Legal Events

Date Code Title Description
AS Assignment

Owner name: ERNST LEITZ WETZLAR GMBH, D-6330 WETZLAR 1, GERMAN

Free format text: ASSIGNMENT OF ASSIGNORS INTEREST.;ASSIGNOR:ATALAR, ABDULLAH;REEL/FRAME:004384/0492

Effective date: 19850306

FEPP Fee payment procedure

Free format text: PAYOR NUMBER ASSIGNED (ORIGINAL EVENT CODE: ASPN); ENTITY STATUS OF PATENT OWNER: LARGE ENTITY

FPAY Fee payment

Year of fee payment: 4

FPAY Fee payment

Year of fee payment: 8

REMI Maintenance fee reminder mailed
LAPS Lapse for failure to pay maintenance fees
FP Lapsed due to failure to pay maintenance fee

Effective date: 19980805

STCH Information on status: patent discontinuation

Free format text: PATENT EXPIRED DUE TO NONPAYMENT OF MAINTENANCE FEES UNDER 37 CFR 1.362