US20100136549A1 - Reproducible quantification of biomarker expression - Google Patents
Reproducible quantification of biomarker expression Download PDFInfo
- Publication number
- US20100136549A1 US20100136549A1 US12/560,129 US56012909A US2010136549A1 US 20100136549 A1 US20100136549 A1 US 20100136549A1 US 56012909 A US56012909 A US 56012909A US 2010136549 A1 US2010136549 A1 US 2010136549A1
- Authority
- US
- United States
- Prior art keywords
- antibody
- biomarker
- sample
- image
- slide
- Prior art date
- Legal status (The legal status is an assumption and is not a legal conclusion. Google has not performed a legal analysis and makes no representation as to the accuracy of the status listed.)
- Granted
Links
- 239000000090 biomarker Substances 0.000 title claims abstract description 105
- 238000011002 quantification Methods 0.000 title abstract description 6
- 238000000034 method Methods 0.000 claims abstract description 112
- 230000001413 cellular effect Effects 0.000 claims description 66
- 238000004458 analytical method Methods 0.000 claims description 47
- 230000003287 optical effect Effects 0.000 claims description 30
- 238000010790 dilution Methods 0.000 claims description 26
- 239000012895 dilution Substances 0.000 claims description 26
- 239000003153 chemical reaction reagent Substances 0.000 claims description 12
- 108090000623 proteins and genes Proteins 0.000 claims description 12
- 102000004169 proteins and genes Human genes 0.000 claims description 11
- 230000004807 localization Effects 0.000 claims description 9
- 238000004891 communication Methods 0.000 claims description 5
- 239000000523 sample Substances 0.000 description 126
- 210000001519 tissue Anatomy 0.000 description 80
- 238000010186 staining Methods 0.000 description 46
- -1 proton ATPase-2 Proteins 0.000 description 43
- 210000004027 cell Anatomy 0.000 description 42
- 101001012157 Homo sapiens Receptor tyrosine-protein kinase erbB-2 Proteins 0.000 description 35
- 102100030086 Receptor tyrosine-protein kinase erbB-2 Human genes 0.000 description 35
- 206010028980 Neoplasm Diseases 0.000 description 28
- 239000000758 substrate Substances 0.000 description 26
- 102000015694 estrogen receptors Human genes 0.000 description 24
- 108010038795 estrogen receptors Proteins 0.000 description 24
- 239000003550 marker Substances 0.000 description 21
- 230000008569 process Effects 0.000 description 20
- 238000012360 testing method Methods 0.000 description 19
- 239000002244 precipitate Substances 0.000 description 18
- FWBHETKCLVMNFS-UHFFFAOYSA-N 4',6-Diamino-2-phenylindol Chemical compound C1=CC(C(=N)N)=CC=C1C1=CC2=CC=C(C(N)=N)C=C2N1 FWBHETKCLVMNFS-UHFFFAOYSA-N 0.000 description 17
- 238000004422 calculation algorithm Methods 0.000 description 17
- 238000009826 distribution Methods 0.000 description 17
- 150000007523 nucleic acids Chemical class 0.000 description 17
- 108010033040 Histones Proteins 0.000 description 16
- 239000000427 antigen Substances 0.000 description 16
- 108091007433 antigens Proteins 0.000 description 16
- 102000036639 antigens Human genes 0.000 description 16
- 238000003556 assay Methods 0.000 description 16
- 102000004190 Enzymes Human genes 0.000 description 15
- 108090000790 Enzymes Proteins 0.000 description 15
- 229940088598 enzyme Drugs 0.000 description 15
- 230000002055 immunohistochemical effect Effects 0.000 description 15
- 230000004083 survival effect Effects 0.000 description 15
- 102000039446 nucleic acids Human genes 0.000 description 14
- 108020004707 nucleic acids Proteins 0.000 description 14
- 108020004414 DNA Proteins 0.000 description 13
- 238000002493 microarray Methods 0.000 description 13
- 210000003719 b-lymphocyte Anatomy 0.000 description 12
- 102000052116 epidermal growth factor receptor activity proteins Human genes 0.000 description 11
- 108700015053 epidermal growth factor receptor activity proteins Proteins 0.000 description 11
- 230000001744 histochemical effect Effects 0.000 description 11
- YOHYSYJDKVYCJI-UHFFFAOYSA-N n-[3-[[6-[3-(trifluoromethyl)anilino]pyrimidin-4-yl]amino]phenyl]cyclopropanecarboxamide Chemical compound FC(F)(F)C1=CC=CC(NC=2N=CN=C(NC=3C=C(NC(=O)C4CC4)C=CC=3)C=2)=C1 YOHYSYJDKVYCJI-UHFFFAOYSA-N 0.000 description 11
- 238000001228 spectrum Methods 0.000 description 11
- YBJHBAHKTGYVGT-ZKWXMUAHSA-N (+)-Biotin Chemical compound N1C(=O)N[C@@H]2[C@H](CCCCC(=O)O)SC[C@@H]21 YBJHBAHKTGYVGT-ZKWXMUAHSA-N 0.000 description 10
- 230000027455 binding Effects 0.000 description 9
- 108010001336 Horseradish Peroxidase Proteins 0.000 description 8
- 102000011782 Keratins Human genes 0.000 description 8
- 108010076876 Keratins Proteins 0.000 description 8
- 201000010099 disease Diseases 0.000 description 8
- 208000037265 diseases, disorders, signs and symptoms Diseases 0.000 description 8
- 239000007850 fluorescent dye Substances 0.000 description 8
- 238000005259 measurement Methods 0.000 description 8
- 239000000203 mixture Substances 0.000 description 8
- 102000005962 receptors Human genes 0.000 description 8
- 108020003175 receptors Proteins 0.000 description 8
- 229920006395 saturated elastomer Polymers 0.000 description 8
- 206010006187 Breast cancer Diseases 0.000 description 7
- 208000026310 Breast neoplasm Diseases 0.000 description 7
- 102000043136 MAP kinase family Human genes 0.000 description 7
- 108091054455 MAP kinase family Proteins 0.000 description 7
- 238000012937 correction Methods 0.000 description 7
- 210000000805 cytoplasm Anatomy 0.000 description 7
- 239000000975 dye Substances 0.000 description 7
- 230000006870 function Effects 0.000 description 7
- 239000000047 product Substances 0.000 description 7
- 102000000905 Cadherin Human genes 0.000 description 6
- 108050007957 Cadherin Proteins 0.000 description 6
- WZUVPPKBWHMQCE-UHFFFAOYSA-N Haematoxylin Chemical compound C12=CC(O)=C(O)C=C2CC2(O)C1C1=CC=C(O)C(O)=C1OC2 WZUVPPKBWHMQCE-UHFFFAOYSA-N 0.000 description 6
- 102100034256 Mucin-1 Human genes 0.000 description 6
- 239000012472 biological sample Substances 0.000 description 6
- 238000003018 immunoassay Methods 0.000 description 6
- 210000003470 mitochondria Anatomy 0.000 description 6
- 210000004940 nucleus Anatomy 0.000 description 6
- 238000012545 processing Methods 0.000 description 6
- 230000035945 sensitivity Effects 0.000 description 6
- 108091006112 ATPases Proteins 0.000 description 5
- 108010051457 Acid Phosphatase Proteins 0.000 description 5
- 102000013563 Acid Phosphatase Human genes 0.000 description 5
- 102000057290 Adenosine Triphosphatases Human genes 0.000 description 5
- 102000002260 Alkaline Phosphatase Human genes 0.000 description 5
- 108020004774 Alkaline Phosphatase Proteins 0.000 description 5
- 102100031480 Dual specificity mitogen-activated protein kinase kinase 1 Human genes 0.000 description 5
- 101710146526 Dual specificity mitogen-activated protein kinase kinase 1 Proteins 0.000 description 5
- 102000003886 Glycoproteins Human genes 0.000 description 5
- 108090000288 Glycoproteins Proteins 0.000 description 5
- 108010008707 Mucin-1 Proteins 0.000 description 5
- 210000001744 T-lymphocyte Anatomy 0.000 description 5
- 229960002685 biotin Drugs 0.000 description 5
- 235000020958 biotin Nutrition 0.000 description 5
- 239000011616 biotin Substances 0.000 description 5
- 210000000481 breast Anatomy 0.000 description 5
- 201000011510 cancer Diseases 0.000 description 5
- 238000006243 chemical reaction Methods 0.000 description 5
- 238000003745 diagnosis Methods 0.000 description 5
- 230000000694 effects Effects 0.000 description 5
- 238000005286 illumination Methods 0.000 description 5
- 238000003384 imaging method Methods 0.000 description 5
- 238000007901 in situ hybridization Methods 0.000 description 5
- JORABGDXCIBAFL-UHFFFAOYSA-M iodonitrotetrazolium chloride Chemical compound [Cl-].C1=CC([N+](=O)[O-])=CC=C1N1[N+](C=2C=CC(I)=CC=2)=NC(C=2C=CC=CC=2)=N1 JORABGDXCIBAFL-UHFFFAOYSA-M 0.000 description 5
- 238000000386 microscopy Methods 0.000 description 5
- 238000010200 validation analysis Methods 0.000 description 5
- GZCWLCBFPRFLKL-UHFFFAOYSA-N 1-prop-2-ynoxypropan-2-ol Chemical compound CC(O)COCC#C GZCWLCBFPRFLKL-UHFFFAOYSA-N 0.000 description 4
- QRXMUCSWCMTJGU-UHFFFAOYSA-N 5-bromo-4-chloro-3-indolyl phosphate Chemical compound C1=C(Br)C(Cl)=C2C(OP(O)(=O)O)=CNC2=C1 QRXMUCSWCMTJGU-UHFFFAOYSA-N 0.000 description 4
- 102100025475 Carcinoembryonic antigen-related cell adhesion molecule 5 Human genes 0.000 description 4
- 102100029855 Caspase-3 Human genes 0.000 description 4
- 102100025064 Cellular tumor antigen p53 Human genes 0.000 description 4
- 101150029707 ERBB2 gene Proteins 0.000 description 4
- 239000004366 Glucose oxidase Substances 0.000 description 4
- 108010015776 Glucose oxidase Proteins 0.000 description 4
- 102100022337 Integrin alpha-V Human genes 0.000 description 4
- 102100023050 Nuclear factor NF-kappa-B p105 subunit Human genes 0.000 description 4
- 108010072866 Prostate-Specific Antigen Proteins 0.000 description 4
- 102100038358 Prostate-specific antigen Human genes 0.000 description 4
- 102000002278 Ribosomal Proteins Human genes 0.000 description 4
- 108010000605 Ribosomal Proteins Proteins 0.000 description 4
- HUXIAXQSTATULQ-UHFFFAOYSA-N [6-bromo-3-[(2-methoxyphenyl)carbamoyl]naphthalen-2-yl] dihydrogen phosphate Chemical compound COC1=CC=CC=C1NC(=O)C1=CC2=CC(Br)=CC=C2C=C1OP(O)(O)=O HUXIAXQSTATULQ-UHFFFAOYSA-N 0.000 description 4
- 230000002583 anti-histone Effects 0.000 description 4
- 238000004364 calculation method Methods 0.000 description 4
- 238000010276 construction Methods 0.000 description 4
- 230000001186 cumulative effect Effects 0.000 description 4
- 238000001514 detection method Methods 0.000 description 4
- 229940116332 glucose oxidase Drugs 0.000 description 4
- 235000019420 glucose oxidase Nutrition 0.000 description 4
- 150000002632 lipids Chemical class 0.000 description 4
- 239000003068 molecular probe Substances 0.000 description 4
- JPXMTWWFLBLUCD-UHFFFAOYSA-N nitro blue tetrazolium(2+) Chemical compound COC1=CC(C=2C=C(OC)C(=CC=2)[N+]=2N(N=C(N=2)C=2C=CC=CC=2)C=2C=CC(=CC=2)[N+]([O-])=O)=CC=C1[N+]1=NC(C=2C=CC=CC=2)=NN1C1=CC=C([N+]([O-])=O)C=C1 JPXMTWWFLBLUCD-UHFFFAOYSA-N 0.000 description 4
- 108090000765 processed proteins & peptides Proteins 0.000 description 4
- 238000012552 review Methods 0.000 description 4
- 238000012549 training Methods 0.000 description 4
- 210000004881 tumor cell Anatomy 0.000 description 4
- 108091032973 (ribonucleotides)n+m Proteins 0.000 description 3
- 108090001008 Avidin Proteins 0.000 description 3
- 108010022366 Carcinoembryonic Antigen Proteins 0.000 description 3
- 108010091675 Cellular Apoptosis Susceptibility Protein Proteins 0.000 description 3
- 108091006146 Channels Proteins 0.000 description 3
- 102000005636 Cyclic AMP Response Element-Binding Protein Human genes 0.000 description 3
- 108010045171 Cyclic AMP Response Element-Binding Protein Proteins 0.000 description 3
- 102100029091 Exportin-2 Human genes 0.000 description 3
- 101710193519 Glial fibrillary acidic protein Proteins 0.000 description 3
- 102100031573 Hematopoietic progenitor cell antigen CD34 Human genes 0.000 description 3
- 101000777663 Homo sapiens Hematopoietic progenitor cell antigen CD34 Proteins 0.000 description 3
- 101001046677 Homo sapiens Integrin alpha-V Proteins 0.000 description 3
- 101000582546 Homo sapiens Methylosome protein 50 Proteins 0.000 description 3
- 102100034069 MAP kinase-activated protein kinase 2 Human genes 0.000 description 3
- 108010041955 MAP-kinase-activated kinase 2 Proteins 0.000 description 3
- 229940124647 MEK inhibitor Drugs 0.000 description 3
- 108091028043 Nucleic acid sequence Proteins 0.000 description 3
- 241000283973 Oryctolagus cuniculus Species 0.000 description 3
- 108091000080 Phosphotransferase Proteins 0.000 description 3
- 102100037422 Receptor-type tyrosine-protein phosphatase C Human genes 0.000 description 3
- 201000000582 Retinoblastoma Diseases 0.000 description 3
- 108010034782 Ribosomal Protein S6 Kinases Proteins 0.000 description 3
- 102000009738 Ribosomal Protein S6 Kinases Human genes 0.000 description 3
- 101150001535 SRC gene Proteins 0.000 description 3
- 102100026144 Transferrin receptor protein 1 Human genes 0.000 description 3
- 102000005789 Vascular Endothelial Growth Factors Human genes 0.000 description 3
- 108010019530 Vascular Endothelial Growth Factors Proteins 0.000 description 3
- 102100023543 Vascular cell adhesion protein 1 Human genes 0.000 description 3
- 230000016571 aggressive behavior Effects 0.000 description 3
- 238000000540 analysis of variance Methods 0.000 description 3
- 230000008901 benefit Effects 0.000 description 3
- 108010005774 beta-Galactosidase Proteins 0.000 description 3
- 150000001720 carbohydrates Chemical class 0.000 description 3
- 235000014633 carbohydrates Nutrition 0.000 description 3
- 239000002771 cell marker Substances 0.000 description 3
- 230000002596 correlated effect Effects 0.000 description 3
- 230000001086 cytosolic effect Effects 0.000 description 3
- 230000003247 decreasing effect Effects 0.000 description 3
- 230000004069 differentiation Effects 0.000 description 3
- 239000000835 fiber Substances 0.000 description 3
- 210000005046 glial fibrillary acidic protein Anatomy 0.000 description 3
- PCHJSUWPFVWCPO-UHFFFAOYSA-N gold Chemical compound [Au] PCHJSUWPFVWCPO-UHFFFAOYSA-N 0.000 description 3
- 239000010931 gold Substances 0.000 description 3
- 229910052737 gold Inorganic materials 0.000 description 3
- 238000009396 hybridization Methods 0.000 description 3
- 238000003364 immunohistochemistry Methods 0.000 description 3
- 102000006495 integrins Human genes 0.000 description 3
- 108010044426 integrins Proteins 0.000 description 3
- 239000000463 material Substances 0.000 description 3
- 239000002609 medium Substances 0.000 description 3
- 201000001441 melanoma Diseases 0.000 description 3
- 210000002569 neuron Anatomy 0.000 description 3
- IPSIPYMEZZPCPY-UHFFFAOYSA-N new fuchsin Chemical compound [Cl-].C1=CC(=[NH2+])C(C)=CC1=C(C=1C=C(C)C(N)=CC=1)C1=CC=C(N)C(C)=C1 IPSIPYMEZZPCPY-UHFFFAOYSA-N 0.000 description 3
- 239000002773 nucleotide Substances 0.000 description 3
- 125000003729 nucleotide group Chemical group 0.000 description 3
- 238000005457 optimization Methods 0.000 description 3
- 239000012188 paraffin wax Substances 0.000 description 3
- 102000020233 phosphotransferase Human genes 0.000 description 3
- 230000009467 reduction Effects 0.000 description 3
- BOLDJAUMGUJJKM-LSDHHAIUSA-N renifolin D Natural products CC(=C)[C@@H]1Cc2c(O)c(O)ccc2[C@H]1CC(=O)c3ccc(O)cc3O BOLDJAUMGUJJKM-LSDHHAIUSA-N 0.000 description 3
- 238000011160 research Methods 0.000 description 3
- 201000009410 rhabdomyosarcoma Diseases 0.000 description 3
- 238000013077 scoring method Methods 0.000 description 3
- 239000000243 solution Substances 0.000 description 3
- 230000009870 specific binding Effects 0.000 description 3
- 238000007619 statistical method Methods 0.000 description 3
- 150000003536 tetrazoles Chemical class 0.000 description 3
- XLYOFNOQVPJJNP-UHFFFAOYSA-N water Substances O XLYOFNOQVPJJNP-UHFFFAOYSA-N 0.000 description 3
- QRXMUCSWCMTJGU-UHFFFAOYSA-L (5-bromo-4-chloro-1h-indol-3-yl) phosphate Chemical compound C1=C(Br)C(Cl)=C2C(OP([O-])(=O)[O-])=CNC2=C1 QRXMUCSWCMTJGU-UHFFFAOYSA-L 0.000 description 2
- KJCVRFUGPWSIIH-UHFFFAOYSA-N 1-naphthol Chemical compound C1=CC=C2C(O)=CC=CC2=C1 KJCVRFUGPWSIIH-UHFFFAOYSA-N 0.000 description 2
- AYOFRULTZJKQEA-UHFFFAOYSA-N 1-phenylhexa-1,3,5-trienylbenzene Chemical compound C=1C=CC=CC=1C(=CC=CC=C)C1=CC=CC=C1 AYOFRULTZJKQEA-UHFFFAOYSA-N 0.000 description 2
- VCESGVLABVSDRO-UHFFFAOYSA-L 2-[4-[4-[3,5-bis(4-nitrophenyl)tetrazol-2-ium-2-yl]-3-methoxyphenyl]-2-methoxyphenyl]-3,5-bis(4-nitrophenyl)tetrazol-2-ium;dichloride Chemical compound [Cl-].[Cl-].COC1=CC(C=2C=C(OC)C(=CC=2)[N+]=2N(N=C(N=2)C=2C=CC(=CC=2)[N+]([O-])=O)C=2C=CC(=CC=2)[N+]([O-])=O)=CC=C1[N+]1=NC(C=2C=CC(=CC=2)[N+]([O-])=O)=NN1C1=CC=C([N+]([O-])=O)C=C1 VCESGVLABVSDRO-UHFFFAOYSA-L 0.000 description 2
- XZKIHKMTEMTJQX-UHFFFAOYSA-N 4-Nitrophenyl Phosphate Chemical compound OP(O)(=O)OC1=CC=C([N+]([O-])=O)C=C1 XZKIHKMTEMTJQX-UHFFFAOYSA-N 0.000 description 2
- FTOAOBMCPZCFFF-UHFFFAOYSA-N 5,5-diethylbarbituric acid Chemical compound CCC1(CC)C(=O)NC(=O)NC1=O FTOAOBMCPZCFFF-UHFFFAOYSA-N 0.000 description 2
- AQSOTOUQTVJNMY-UHFFFAOYSA-N 7-(dimethylamino)-4-hydroxy-3-oxophenoxazin-10-ium-1-carboxylic acid;chloride Chemical compound [Cl-].OC(=O)C1=CC(=O)C(O)=C2OC3=CC(N(C)C)=CC=C3[NH+]=C21 AQSOTOUQTVJNMY-UHFFFAOYSA-N 0.000 description 2
- MPVDXIMFBOLMNW-ISLYRVAYSA-N 7-hydroxy-8-[(E)-phenyldiazenyl]naphthalene-1,3-disulfonic acid Chemical compound OC1=CC=C2C=C(S(O)(=O)=O)C=C(S(O)(=O)=O)C2=C1\N=N\C1=CC=CC=C1 MPVDXIMFBOLMNW-ISLYRVAYSA-N 0.000 description 2
- 102100026802 72 kDa type IV collagenase Human genes 0.000 description 2
- 102100035248 Alpha-(1,3)-fucosyltransferase 4 Human genes 0.000 description 2
- 208000024827 Alzheimer disease Diseases 0.000 description 2
- CIWBSHSKHKDKBQ-JLAZNSOCSA-N Ascorbic acid Chemical compound OC[C@H](O)[C@H]1OC(=O)C(O)=C1O CIWBSHSKHKDKBQ-JLAZNSOCSA-N 0.000 description 2
- 102100026189 Beta-galactosidase Human genes 0.000 description 2
- 102100032912 CD44 antigen Human genes 0.000 description 2
- 102100025222 CD63 antigen Human genes 0.000 description 2
- 102100037904 CD9 antigen Human genes 0.000 description 2
- 241000283707 Capra Species 0.000 description 2
- 108090000397 Caspase 3 Proteins 0.000 description 2
- 102100023344 Centromere protein F Human genes 0.000 description 2
- 102000011022 Chorionic Gonadotropin Human genes 0.000 description 2
- 108010062540 Chorionic Gonadotropin Proteins 0.000 description 2
- 108090000197 Clusterin Proteins 0.000 description 2
- 102000003780 Clusterin Human genes 0.000 description 2
- 108010035532 Collagen Proteins 0.000 description 2
- 102000008186 Collagen Human genes 0.000 description 2
- 206010009944 Colon cancer Diseases 0.000 description 2
- 108050006400 Cyclin Proteins 0.000 description 2
- 108010058546 Cyclin D1 Proteins 0.000 description 2
- 102000003915 DNA Topoisomerases Human genes 0.000 description 2
- 108090000323 DNA Topoisomerases Proteins 0.000 description 2
- 102100035186 DNA excision repair protein ERCC-1 Human genes 0.000 description 2
- 102100033215 DNA nucleotidylexotransferase Human genes 0.000 description 2
- 102100023471 E-selectin Human genes 0.000 description 2
- 102000001301 EGF receptor Human genes 0.000 description 2
- 108060006698 EGF receptor Proteins 0.000 description 2
- 102100025137 Early activation antigen CD69 Human genes 0.000 description 2
- 101710128765 Enhancer of filamentation 1 Proteins 0.000 description 2
- 108010007457 Extracellular Signal-Regulated MAP Kinases Proteins 0.000 description 2
- 102100024165 G1/S-specific cyclin-D1 Human genes 0.000 description 2
- 102000001267 GSK3 Human genes 0.000 description 2
- 108060006662 GSK3 Proteins 0.000 description 2
- 241000287828 Gallus gallus Species 0.000 description 2
- 102000053171 Glial Fibrillary Acidic Human genes 0.000 description 2
- WQZGKKKJIJFFOK-GASJEMHNSA-N Glucose Natural products OC[C@H]1OC(O)[C@H](O)[C@@H](O)[C@@H]1O WQZGKKKJIJFFOK-GASJEMHNSA-N 0.000 description 2
- 108010051975 Glycogen Synthase Kinase 3 beta Proteins 0.000 description 2
- 102100038104 Glycogen synthase kinase-3 beta Human genes 0.000 description 2
- 102100036698 Golgi reassembly-stacking protein 1 Human genes 0.000 description 2
- 102100041033 Golgin subfamily B member 1 Human genes 0.000 description 2
- 102100033636 Histone H3.2 Human genes 0.000 description 2
- 208000017604 Hodgkin disease Diseases 0.000 description 2
- 208000010747 Hodgkins lymphoma Diseases 0.000 description 2
- 102100030234 Homeobox protein cut-like 1 Human genes 0.000 description 2
- 101001022185 Homo sapiens Alpha-(1,3)-fucosyltransferase 4 Proteins 0.000 description 2
- 101000868273 Homo sapiens CD44 antigen Proteins 0.000 description 2
- 101000934368 Homo sapiens CD63 antigen Proteins 0.000 description 2
- 101000859758 Homo sapiens Cartilage-associated protein Proteins 0.000 description 2
- 101000793880 Homo sapiens Caspase-3 Proteins 0.000 description 2
- 101000721661 Homo sapiens Cellular tumor antigen p53 Proteins 0.000 description 2
- 101000916686 Homo sapiens Cytohesin-interacting protein Proteins 0.000 description 2
- 101000876529 Homo sapiens DNA excision repair protein ERCC-1 Proteins 0.000 description 2
- 101000934374 Homo sapiens Early activation antigen CD69 Proteins 0.000 description 2
- 101001072488 Homo sapiens Golgi reassembly-stacking protein 1 Proteins 0.000 description 2
- 101000726740 Homo sapiens Homeobox protein cut-like 1 Proteins 0.000 description 2
- 101000620359 Homo sapiens Melanocyte protein PMEL Proteins 0.000 description 2
- 101000761460 Homo sapiens Protein CASP Proteins 0.000 description 2
- 101000738771 Homo sapiens Receptor-type tyrosine-protein phosphatase C Proteins 0.000 description 2
- 101000650817 Homo sapiens Semaphorin-4D Proteins 0.000 description 2
- 101000611023 Homo sapiens Tumor necrosis factor receptor superfamily member 6 Proteins 0.000 description 2
- 101000680608 Homo sapiens tRNA (uracil-5-)-methyltransferase homolog A Proteins 0.000 description 2
- 108060003951 Immunoglobulin Proteins 0.000 description 2
- 108010040765 Integrin alphaV Proteins 0.000 description 2
- 102000008607 Integrin beta3 Human genes 0.000 description 2
- 102100037877 Intercellular adhesion molecule 1 Human genes 0.000 description 2
- 102100035133 Lysosome-associated membrane glycoprotein 1 Human genes 0.000 description 2
- 102100022430 Melanocyte protein PMEL Human genes 0.000 description 2
- 101000761459 Mesocricetus auratus Calcium-dependent serine proteinase Proteins 0.000 description 2
- 102100024193 Mitogen-activated protein kinase 1 Human genes 0.000 description 2
- 238000000342 Monte Carlo simulation Methods 0.000 description 2
- 108010063954 Mucins Proteins 0.000 description 2
- 102000015728 Mucins Human genes 0.000 description 2
- 102000016943 Muramidase Human genes 0.000 description 2
- 108010014251 Muramidase Proteins 0.000 description 2
- 101100346932 Mus musculus Muc1 gene Chemical group 0.000 description 2
- 108010062010 N-Acetylmuramoyl-L-alanine Amidase Proteins 0.000 description 2
- 102000003729 Neprilysin Human genes 0.000 description 2
- 108090000028 Neprilysin Proteins 0.000 description 2
- 108010032605 Nerve Growth Factor Receptors Proteins 0.000 description 2
- 102000007339 Nerve Growth Factor Receptors Human genes 0.000 description 2
- 102000008763 Neurofilament Proteins Human genes 0.000 description 2
- 108010088373 Neurofilament Proteins Proteins 0.000 description 2
- YHIPILPTUVMWQT-UHFFFAOYSA-N Oplophorus luciferin Chemical compound C1=CC(O)=CC=C1CC(C(N1C=C(N2)C=3C=CC(O)=CC=3)=O)=NC1=C2CC1=CC=CC=C1 YHIPILPTUVMWQT-UHFFFAOYSA-N 0.000 description 2
- 229910019142 PO4 Inorganic materials 0.000 description 2
- 108010011536 PTEN Phosphohydrolase Proteins 0.000 description 2
- 102100032543 Phosphatidylinositol 3,4,5-trisphosphate 3-phosphatase and dual-specificity protein phosphatase PTEN Human genes 0.000 description 2
- 102000012288 Phosphopyruvate Hydratase Human genes 0.000 description 2
- 108010022181 Phosphopyruvate Hydratase Proteins 0.000 description 2
- 229920001213 Polysorbate 20 Polymers 0.000 description 2
- 102100036691 Proliferating cell nuclear antigen Human genes 0.000 description 2
- 108091008611 Protein Kinase B Proteins 0.000 description 2
- 102000003923 Protein Kinase C Human genes 0.000 description 2
- 102100033810 RAC-alpha serine/threonine-protein kinase Human genes 0.000 description 2
- 102100024908 Ribosomal protein S6 kinase beta-1 Human genes 0.000 description 2
- 102100027744 Semaphorin-4D Human genes 0.000 description 2
- 102100029064 Serine/threonine-protein kinase WNK1 Human genes 0.000 description 2
- 101710123496 Spindolin Proteins 0.000 description 2
- 108010090804 Streptavidin Proteins 0.000 description 2
- 102000016266 T-Cell Antigen Receptors Human genes 0.000 description 2
- 108010092262 T-Cell Antigen Receptors Proteins 0.000 description 2
- 108010033576 Transferrin Receptors Proteins 0.000 description 2
- 102100040403 Tumor necrosis factor receptor superfamily member 6 Human genes 0.000 description 2
- 102000007537 Type II DNA Topoisomerases Human genes 0.000 description 2
- 108010046308 Type II DNA Topoisomerases Proteins 0.000 description 2
- DRTQHJPVMGBUCF-XVFCMESISA-N Uridine Chemical compound O[C@@H]1[C@H](O)[C@@H](CO)O[C@H]1N1C(=O)NC(=O)C=C1 DRTQHJPVMGBUCF-XVFCMESISA-N 0.000 description 2
- 108010000134 Vascular Cell Adhesion Molecule-1 Proteins 0.000 description 2
- IOMLBTHPCVDRHM-UHFFFAOYSA-N [3-[(2,4-dimethylphenyl)carbamoyl]naphthalen-2-yl] dihydrogen phosphate Chemical compound CC1=CC(C)=CC=C1NC(=O)C1=CC2=CC=CC=C2C=C1OP(O)(O)=O IOMLBTHPCVDRHM-UHFFFAOYSA-N 0.000 description 2
- RZUBARUFLYGOGC-MTHOTQAESA-L acid fuchsin Chemical compound [Na+].[Na+].[O-]S(=O)(=O)C1=C(N)C(C)=CC(C(=C\2C=C(C(=[NH2+])C=C/2)S([O-])(=O)=O)\C=2C=C(C(N)=CC=2)S([O-])(=O)=O)=C1 RZUBARUFLYGOGC-MTHOTQAESA-L 0.000 description 2
- DPKHZNPWBDQZCN-UHFFFAOYSA-N acridine orange free base Chemical compound C1=CC(N(C)C)=CC2=NC3=CC(N(C)C)=CC=C3C=C21 DPKHZNPWBDQZCN-UHFFFAOYSA-N 0.000 description 2
- 229940037003 alum Drugs 0.000 description 2
- 230000003321 amplification Effects 0.000 description 2
- 230000002529 anti-mitochondrial effect Effects 0.000 description 2
- 230000006907 apoptotic process Effects 0.000 description 2
- 238000013459 approach Methods 0.000 description 2
- DZBUGLKDJFMEHC-UHFFFAOYSA-N benzoquinolinylidene Natural products C1=CC=CC2=CC3=CC=CC=C3N=C21 DZBUGLKDJFMEHC-UHFFFAOYSA-N 0.000 description 2
- HUTDDBSSHVOYJR-UHFFFAOYSA-H bis[(2-oxo-1,3,2$l^{5},4$l^{2}-dioxaphosphaplumbetan-2-yl)oxy]lead Chemical compound [Pb+2].[Pb+2].[Pb+2].[O-]P([O-])([O-])=O.[O-]P([O-])([O-])=O HUTDDBSSHVOYJR-UHFFFAOYSA-H 0.000 description 2
- 230000000903 blocking effect Effects 0.000 description 2
- 210000004369 blood Anatomy 0.000 description 2
- 239000008280 blood Substances 0.000 description 2
- 210000000170 cell membrane Anatomy 0.000 description 2
- 108010031377 centromere protein F Proteins 0.000 description 2
- 230000008859 change Effects 0.000 description 2
- 238000012512 characterization method Methods 0.000 description 2
- 239000007795 chemical reaction product Substances 0.000 description 2
- 229920001436 collagen Polymers 0.000 description 2
- 208000029742 colonic neoplasm Diseases 0.000 description 2
- 230000000875 corresponding effect Effects 0.000 description 2
- 108010072268 cyclin-dependent kinase-activating kinase Proteins 0.000 description 2
- 238000011161 development Methods 0.000 description 2
- 230000018109 developmental process Effects 0.000 description 2
- 239000003814 drug Substances 0.000 description 2
- 210000002889 endothelial cell Anatomy 0.000 description 2
- 230000002255 enzymatic effect Effects 0.000 description 2
- YQGOJNYOYNNSMM-UHFFFAOYSA-N eosin Chemical compound [Na+].OC(=O)C1=CC=CC=C1C1=C2C=C(Br)C(=O)C(Br)=C2OC2=C(Br)C(O)=C(Br)C=C21 YQGOJNYOYNNSMM-UHFFFAOYSA-N 0.000 description 2
- 210000003743 erythrocyte Anatomy 0.000 description 2
- 230000005284 excitation Effects 0.000 description 2
- 239000008103 glucose Substances 0.000 description 2
- 210000003714 granulocyte Anatomy 0.000 description 2
- 108091008039 hormone receptors Proteins 0.000 description 2
- 229940084986 human chorionic gonadotropin Drugs 0.000 description 2
- 238000010166 immunofluorescence Methods 0.000 description 2
- 238000003125 immunofluorescent labeling Methods 0.000 description 2
- 102000018358 immunoglobulin Human genes 0.000 description 2
- 238000012309 immunohistochemistry technique Methods 0.000 description 2
- 239000003112 inhibitor Substances 0.000 description 2
- 235000010335 lysozyme Nutrition 0.000 description 2
- 108010053687 macrogolgin Proteins 0.000 description 2
- 229960000901 mepacrine Drugs 0.000 description 2
- 238000012986 modification Methods 0.000 description 2
- 230000004048 modification Effects 0.000 description 2
- 210000001616 monocyte Anatomy 0.000 description 2
- 210000000663 muscle cell Anatomy 0.000 description 2
- 210000000066 myeloid cell Anatomy 0.000 description 2
- VMGAPWLDMVPYIA-HIDZBRGKSA-N n'-amino-n-iminomethanimidamide Chemical compound N\N=C\N=N VMGAPWLDMVPYIA-HIDZBRGKSA-N 0.000 description 2
- NFVJNJQRWPQVOA-UHFFFAOYSA-N n-[2-chloro-5-(trifluoromethyl)phenyl]-2-[3-(4-ethyl-5-ethylsulfanyl-1,2,4-triazol-3-yl)piperidin-1-yl]acetamide Chemical compound CCN1C(SCC)=NN=C1C1CN(CC(=O)NC=2C(=CC=C(C=2)C(F)(F)F)Cl)CCC1 NFVJNJQRWPQVOA-UHFFFAOYSA-N 0.000 description 2
- 210000005044 neurofilament Anatomy 0.000 description 2
- 229930027945 nicotinamide-adenine dinucleotide Natural products 0.000 description 2
- 238000010606 normalization Methods 0.000 description 2
- 238000003199 nucleic acid amplification method Methods 0.000 description 2
- 210000003463 organelle Anatomy 0.000 description 2
- 102000002574 p38 Mitogen-Activated Protein Kinases Human genes 0.000 description 2
- 108010068338 p38 Mitogen-Activated Protein Kinases Proteins 0.000 description 2
- 230000007170 pathology Effects 0.000 description 2
- NBIIXXVUZAFLBC-UHFFFAOYSA-K phosphate Chemical compound [O-]P([O-])([O-])=O NBIIXXVUZAFLBC-UHFFFAOYSA-K 0.000 description 2
- 239000010452 phosphate Substances 0.000 description 2
- 210000004180 plasmocyte Anatomy 0.000 description 2
- 235000010486 polyoxyethylene sorbitan monolaurate Nutrition 0.000 description 2
- 239000000256 polyoxyethylene sorbitan monolaurate Substances 0.000 description 2
- 108090000468 progesterone receptors Proteins 0.000 description 2
- 102000003998 progesterone receptors Human genes 0.000 description 2
- 238000004393 prognosis Methods 0.000 description 2
- INCIMLINXXICKS-UHFFFAOYSA-M pyronin Y Chemical compound [Cl-].C1=CC(=[N+](C)C)C=C2OC3=CC(N(C)C)=CC=C3C=C21 INCIMLINXXICKS-UHFFFAOYSA-M 0.000 description 2
- 238000004445 quantitative analysis Methods 0.000 description 2
- GPKJTRJOBQGKQK-UHFFFAOYSA-N quinacrine Chemical compound C1=C(OC)C=C2C(NC(C)CCCN(CC)CC)=C(C=CC(Cl)=C3)C3=NC2=C1 GPKJTRJOBQGKQK-UHFFFAOYSA-N 0.000 description 2
- 238000000611 regression analysis Methods 0.000 description 2
- 238000005204 segregation Methods 0.000 description 2
- QZAYGJVTTNCVMB-UHFFFAOYSA-N serotonin Chemical compound C1=C(O)C=C2C(CCN)=CNC2=C1 QZAYGJVTTNCVMB-UHFFFAOYSA-N 0.000 description 2
- 210000000813 small intestine Anatomy 0.000 description 2
- LPXPTNMVRIOKMN-UHFFFAOYSA-M sodium nitrite Chemical compound [Na+].[O-]N=O LPXPTNMVRIOKMN-UHFFFAOYSA-M 0.000 description 2
- 241000894007 species Species 0.000 description 2
- 102100022348 tRNA (uracil-5-)-methyltransferase homolog A Human genes 0.000 description 2
- 125000003831 tetrazolyl group Chemical group 0.000 description 2
- 229960005356 urokinase Drugs 0.000 description 2
- DIGQNXIGRZPYDK-WKSCXVIASA-N (2R)-6-amino-2-[[2-[[(2S)-2-[[2-[[(2R)-2-[[(2S)-2-[[(2R,3S)-2-[[2-[[(2S)-2-[[2-[[(2S)-2-[[(2S)-2-[[(2R)-2-[[(2S,3S)-2-[[(2R)-2-[[(2S)-2-[[(2S)-2-[[(2S)-2-[[2-[[(2S)-2-[[(2R)-2-[[2-[[2-[[2-[(2-amino-1-hydroxyethylidene)amino]-3-carboxy-1-hydroxypropylidene]amino]-1-hydroxy-3-sulfanylpropylidene]amino]-1-hydroxyethylidene]amino]-1-hydroxy-3-sulfanylpropylidene]amino]-1,3-dihydroxypropylidene]amino]-1-hydroxyethylidene]amino]-1-hydroxypropylidene]amino]-1,3-dihydroxypropylidene]amino]-1,3-dihydroxypropylidene]amino]-1-hydroxy-3-sulfanylpropylidene]amino]-1,3-dihydroxybutylidene]amino]-1-hydroxy-3-sulfanylpropylidene]amino]-1-hydroxypropylidene]amino]-1,3-dihydroxypropylidene]amino]-1-hydroxyethylidene]amino]-1,5-dihydroxy-5-iminopentylidene]amino]-1-hydroxy-3-sulfanylpropylidene]amino]-1,3-dihydroxybutylidene]amino]-1-hydroxy-3-sulfanylpropylidene]amino]-1,3-dihydroxypropylidene]amino]-1-hydroxyethylidene]amino]-1-hydroxy-3-sulfanylpropylidene]amino]-1-hydroxyethylidene]amino]hexanoic acid Chemical compound C[C@@H]([C@@H](C(=N[C@@H](CS)C(=N[C@@H](C)C(=N[C@@H](CO)C(=NCC(=N[C@@H](CCC(=N)O)C(=NC(CS)C(=N[C@H]([C@H](C)O)C(=N[C@H](CS)C(=N[C@H](CO)C(=NCC(=N[C@H](CS)C(=NCC(=N[C@H](CCCCN)C(=O)O)O)O)O)O)O)O)O)O)O)O)O)O)O)N=C([C@H](CS)N=C([C@H](CO)N=C([C@H](CO)N=C([C@H](C)N=C(CN=C([C@H](CO)N=C([C@H](CS)N=C(CN=C(C(CS)N=C(C(CC(=O)O)N=C(CN)O)O)O)O)O)O)O)O)O)O)O)O DIGQNXIGRZPYDK-WKSCXVIASA-N 0.000 description 1
- XUHRVZXFBWDCFB-QRTDKPMLSA-N (3R)-4-[[(3S,6S,9S,12R,15S,18R,21R,24R,27R,28R)-12-(3-amino-3-oxopropyl)-6-[(2S)-butan-2-yl]-3-(2-carboxyethyl)-18-(hydroxymethyl)-28-methyl-9,15,21,24-tetrakis(2-methylpropyl)-2,5,8,11,14,17,20,23,26-nonaoxo-1-oxa-4,7,10,13,16,19,22,25-octazacyclooctacos-27-yl]amino]-3-[[(2R)-2-[[(3S)-3-hydroxydecanoyl]amino]-4-methylpentanoyl]amino]-4-oxobutanoic acid Chemical compound CCCCCCC[C@H](O)CC(=O)N[C@H](CC(C)C)C(=O)N[C@H](CC(O)=O)C(=O)N[C@@H]1[C@@H](C)OC(=O)[C@H](CCC(O)=O)NC(=O)[C@@H](NC(=O)[C@H](CC(C)C)NC(=O)[C@@H](CCC(N)=O)NC(=O)[C@H](CC(C)C)NC(=O)[C@@H](CO)NC(=O)[C@@H](CC(C)C)NC(=O)[C@@H](CC(C)C)NC1=O)[C@@H](C)CC XUHRVZXFBWDCFB-QRTDKPMLSA-N 0.000 description 1
- GEYOCULIXLDCMW-UHFFFAOYSA-N 1,2-phenylenediamine Chemical compound NC1=CC=CC=C1N GEYOCULIXLDCMW-UHFFFAOYSA-N 0.000 description 1
- KCVIRDLVBXYYKD-UHFFFAOYSA-O 1-nitrotetrazol-2-ium Chemical compound [O-][N+](=O)[NH+]1C=NN=N1 KCVIRDLVBXYYKD-UHFFFAOYSA-O 0.000 description 1
- 108010020567 12E7 Antigen Proteins 0.000 description 1
- VGIRNWJSIRVFRT-UHFFFAOYSA-N 2',7'-difluorofluorescein Chemical compound OC(=O)C1=CC=CC=C1C1=C2C=C(F)C(=O)C=C2OC2=CC(O)=C(F)C=C21 VGIRNWJSIRVFRT-UHFFFAOYSA-N 0.000 description 1
- PRDFBSVERLRRMY-UHFFFAOYSA-N 2'-(4-ethoxyphenyl)-5-(4-methylpiperazin-1-yl)-2,5'-bibenzimidazole Chemical compound C1=CC(OCC)=CC=C1C1=NC2=CC=C(C=3NC4=CC(=CC=C4N=3)N3CCN(C)CC3)C=C2N1 PRDFBSVERLRRMY-UHFFFAOYSA-N 0.000 description 1
- FFRBMBIXVSCUFS-UHFFFAOYSA-N 2,4-dinitro-1-naphthol Chemical compound C1=CC=C2C(O)=C([N+]([O-])=O)C=C([N+]([O-])=O)C2=C1 FFRBMBIXVSCUFS-UHFFFAOYSA-N 0.000 description 1
- HWTAKVLMACWHLD-UHFFFAOYSA-N 2-(9h-carbazol-1-yl)ethanamine Chemical compound C12=CC=CC=C2NC2=C1C=CC=C2CCN HWTAKVLMACWHLD-UHFFFAOYSA-N 0.000 description 1
- RUVJFMSQTCEAAB-UHFFFAOYSA-M 2-[3-[5,6-dichloro-1,3-bis[[4-(chloromethyl)phenyl]methyl]benzimidazol-2-ylidene]prop-1-enyl]-3-methyl-1,3-benzoxazol-3-ium;chloride Chemical compound [Cl-].O1C2=CC=CC=C2[N+](C)=C1C=CC=C(N(C1=CC(Cl)=C(Cl)C=C11)CC=2C=CC(CCl)=CC=2)N1CC1=CC=C(CCl)C=C1 RUVJFMSQTCEAAB-UHFFFAOYSA-M 0.000 description 1
- KISWVXRQTGLFGD-UHFFFAOYSA-N 2-[[2-[[6-amino-2-[[2-[[2-[[5-amino-2-[[2-[[1-[2-[[6-amino-2-[(2,5-diamino-5-oxopentanoyl)amino]hexanoyl]amino]-5-(diaminomethylideneamino)pentanoyl]pyrrolidine-2-carbonyl]amino]-3-hydroxypropanoyl]amino]-5-oxopentanoyl]amino]-5-(diaminomethylideneamino)p Chemical compound C1CCN(C(=O)C(CCCN=C(N)N)NC(=O)C(CCCCN)NC(=O)C(N)CCC(N)=O)C1C(=O)NC(CO)C(=O)NC(CCC(N)=O)C(=O)NC(CCCN=C(N)N)C(=O)NC(CO)C(=O)NC(CCCCN)C(=O)NC(C(=O)NC(CC(C)C)C(O)=O)CC1=CC=C(O)C=C1 KISWVXRQTGLFGD-UHFFFAOYSA-N 0.000 description 1
- UAIUNKRWKOVEES-UHFFFAOYSA-N 3,3',5,5'-tetramethylbenzidine Chemical compound CC1=C(N)C(C)=CC(C=2C=C(C)C(N)=C(C)C=2)=C1 UAIUNKRWKOVEES-UHFFFAOYSA-N 0.000 description 1
- JRBJSXQPQWSCCF-UHFFFAOYSA-N 3,3'-Dimethoxybenzidine Chemical compound C1=C(N)C(OC)=CC(C=2C=C(OC)C(N)=CC=2)=C1 JRBJSXQPQWSCCF-UHFFFAOYSA-N 0.000 description 1
- AZKSAVLVSZKNRD-UHFFFAOYSA-M 3-(4,5-dimethylthiazol-2-yl)-2,5-diphenyltetrazolium bromide Chemical compound [Br-].S1C(C)=C(C)N=C1[N+]1=NC(C=2C=CC=CC=2)=NN1C1=CC=CC=C1 AZKSAVLVSZKNRD-UHFFFAOYSA-M 0.000 description 1
- KIWODJBCHRADND-UHFFFAOYSA-N 3-anilino-4-[1-[3-(1-imidazolyl)propyl]-3-indolyl]pyrrole-2,5-dione Chemical compound O=C1NC(=O)C(C=2C3=CC=CC=C3N(CCCN3C=NC=C3)C=2)=C1NC1=CC=CC=C1 KIWODJBCHRADND-UHFFFAOYSA-N 0.000 description 1
- KJDSORYAHBAGPP-UHFFFAOYSA-N 4-(3,4-diaminophenyl)benzene-1,2-diamine;hydron;tetrachloride Chemical compound Cl.Cl.Cl.Cl.C1=C(N)C(N)=CC=C1C1=CC=C(N)C(N)=C1 KJDSORYAHBAGPP-UHFFFAOYSA-N 0.000 description 1
- CXNVOWPRHWWCQR-UHFFFAOYSA-N 4-Chloro-ortho-toluidine Chemical compound CC1=CC(Cl)=CC=C1N CXNVOWPRHWWCQR-UHFFFAOYSA-N 0.000 description 1
- AXDJCCTWPBKUKL-UHFFFAOYSA-N 4-[(4-aminophenyl)-(4-imino-3-methylcyclohexa-2,5-dien-1-ylidene)methyl]aniline;hydron;chloride Chemical compound Cl.C1=CC(=N)C(C)=CC1=C(C=1C=CC(N)=CC=1)C1=CC=C(N)C=C1 AXDJCCTWPBKUKL-UHFFFAOYSA-N 0.000 description 1
- LVSPDZAGCBEQAV-UHFFFAOYSA-N 4-chloronaphthalen-1-ol Chemical compound C1=CC=C2C(O)=CC=C(Cl)C2=C1 LVSPDZAGCBEQAV-UHFFFAOYSA-N 0.000 description 1
- 102100033400 4F2 cell-surface antigen heavy chain Human genes 0.000 description 1
- 102100022464 5'-nucleotidase Human genes 0.000 description 1
- 102100030310 5,6-dihydroxyindole-2-carboxylic acid oxidase Human genes 0.000 description 1
- OPIFSICVWOWJMJ-AEOCFKNESA-N 5-bromo-4-chloro-3-indolyl beta-D-galactoside Chemical compound O[C@@H]1[C@@H](O)[C@@H](O)[C@@H](CO)O[C@H]1OC1=CNC2=CC=C(Br)C(Cl)=C12 OPIFSICVWOWJMJ-AEOCFKNESA-N 0.000 description 1
- WOVKYSAHUYNSMH-RRKCRQDMSA-N 5-bromodeoxyuridine Chemical compound C1[C@H](O)[C@@H](CO)O[C@H]1N1C(=O)NC(=O)C(Br)=C1 WOVKYSAHUYNSMH-RRKCRQDMSA-N 0.000 description 1
- IHHSSHCBRVYGJX-UHFFFAOYSA-N 6-chloro-2-methoxyacridin-9-amine Chemical compound C1=C(Cl)C=CC2=C(N)C3=CC(OC)=CC=C3N=C21 IHHSSHCBRVYGJX-UHFFFAOYSA-N 0.000 description 1
- CJIJXIFQYOPWTF-UHFFFAOYSA-N 7-hydroxycoumarin Natural products O1C(=O)C=CC2=CC(O)=CC=C21 CJIJXIFQYOPWTF-UHFFFAOYSA-N 0.000 description 1
- 101710151806 72 kDa type IV collagenase Proteins 0.000 description 1
- FWEOQOXTVHGIFQ-UHFFFAOYSA-N 8-anilinonaphthalene-1-sulfonic acid Chemical compound C=12C(S(=O)(=O)O)=CC=CC2=CC=CC=1NC1=CC=CC=C1 FWEOQOXTVHGIFQ-UHFFFAOYSA-N 0.000 description 1
- OXEUETBFKVCRNP-UHFFFAOYSA-N 9-ethyl-3-carbazolamine Chemical compound NC1=CC=C2N(CC)C3=CC=CC=C3C2=C1 OXEUETBFKVCRNP-UHFFFAOYSA-N 0.000 description 1
- 108010082775 97-kDa Golgi complex autoantigen Proteins 0.000 description 1
- 102100026445 A-kinase anchor protein 17A Human genes 0.000 description 1
- 102100031585 ADP-ribosyl cyclase/cyclic ADP-ribose hydrolase 1 Human genes 0.000 description 1
- 102100033793 ALK tyrosine kinase receptor Human genes 0.000 description 1
- 101710168331 ALK tyrosine kinase receptor Proteins 0.000 description 1
- 102000012440 Acetylcholinesterase Human genes 0.000 description 1
- 108010022752 Acetylcholinesterase Proteins 0.000 description 1
- 108010085238 Actins Proteins 0.000 description 1
- 102000007469 Actins Human genes 0.000 description 1
- 102100026423 Adhesion G protein-coupled receptor E5 Human genes 0.000 description 1
- 239000000275 Adrenocorticotropic Hormone Substances 0.000 description 1
- 108010000239 Aequorin Proteins 0.000 description 1
- 101710186708 Agglutinin Proteins 0.000 description 1
- 102100024321 Alkaline phosphatase, placental type Human genes 0.000 description 1
- 102100022524 Alpha-1-antichymotrypsin Human genes 0.000 description 1
- 102100022712 Alpha-1-antitrypsin Human genes 0.000 description 1
- 102000003730 Alpha-catenin Human genes 0.000 description 1
- 108090000020 Alpha-catenin Proteins 0.000 description 1
- 102100026277 Alpha-galactosidase A Human genes 0.000 description 1
- 102100024075 Alpha-internexin Human genes 0.000 description 1
- 102100026882 Alpha-synuclein Human genes 0.000 description 1
- 102100022749 Aminopeptidase N Human genes 0.000 description 1
- 102000013455 Amyloid beta-Peptides Human genes 0.000 description 1
- 108010090849 Amyloid beta-Peptides Proteins 0.000 description 1
- 101710137189 Amyloid-beta A4 protein Proteins 0.000 description 1
- 102100022704 Amyloid-beta precursor protein Human genes 0.000 description 1
- 101710151993 Amyloid-beta precursor protein Proteins 0.000 description 1
- 102100032187 Androgen receptor Human genes 0.000 description 1
- 102100033897 Ankyrin repeat and SOCS box protein 1 Human genes 0.000 description 1
- 102100021253 Antileukoproteinase Human genes 0.000 description 1
- 102000009333 Apolipoprotein D Human genes 0.000 description 1
- 108010025614 Apolipoproteins D Proteins 0.000 description 1
- 102100021569 Apoptosis regulator Bcl-2 Human genes 0.000 description 1
- 101100086317 Arabidopsis thaliana RABA4B gene Proteins 0.000 description 1
- 102100025218 B-cell differentiation antigen CD72 Human genes 0.000 description 1
- 102100038080 B-cell receptor CD22 Human genes 0.000 description 1
- 102100024222 B-lymphocyte antigen CD19 Human genes 0.000 description 1
- 102100022005 B-lymphocyte antigen CD20 Human genes 0.000 description 1
- 102100037152 BAG family molecular chaperone regulator 1 Human genes 0.000 description 1
- 101710089792 BAG family molecular chaperone regulator 1 Proteins 0.000 description 1
- 108700034663 BCL2-associated athanogene 1 Proteins 0.000 description 1
- WOVKYSAHUYNSMH-UHFFFAOYSA-N BROMODEOXYURIDINE Natural products C1C(O)C(CO)OC1N1C(=O)NC(=O)C(Br)=C1 WOVKYSAHUYNSMH-UHFFFAOYSA-N 0.000 description 1
- 102100021663 Baculoviral IAP repeat-containing protein 5 Human genes 0.000 description 1
- 102100032412 Basigin Human genes 0.000 description 1
- 102100023994 Beta-1,3-galactosyltransferase 6 Human genes 0.000 description 1
- 102100029945 Beta-galactoside alpha-2,6-sialyltransferase 1 Human genes 0.000 description 1
- ZOXJGFHDIHLPTG-UHFFFAOYSA-N Boron Chemical compound [B] ZOXJGFHDIHLPTG-UHFFFAOYSA-N 0.000 description 1
- 102100036166 C-X-C chemokine receptor type 1 Human genes 0.000 description 1
- 102100028989 C-X-C chemokine receptor type 2 Human genes 0.000 description 1
- YDNKGFDKKRUKPY-JHOUSYSJSA-N C16 ceramide Natural products CCCCCCCCCCCCCCCC(=O)N[C@@H](CO)[C@H](O)C=CCCCCCCCCCCCCC YDNKGFDKKRUKPY-JHOUSYSJSA-N 0.000 description 1
- 102100032957 C5a anaphylatoxin chemotactic receptor 1 Human genes 0.000 description 1
- 102100024217 CAMPATH-1 antigen Human genes 0.000 description 1
- VYLJAYXZTOTZRR-BTPDVQIOSA-N CC(C)(O)[C@H]1CC[C@@]2(C)[C@H]1CC[C@]1(C)[C@@H]2CC[C@@H]2[C@@]3(C)CCCC(C)(C)[C@@H]3[C@@H](O)[C@H](O)[C@@]12C Chemical compound CC(C)(O)[C@H]1CC[C@@]2(C)[C@H]1CC[C@]1(C)[C@@H]2CC[C@@H]2[C@@]3(C)CCCC(C)(C)[C@@H]3[C@@H](O)[C@H](O)[C@@]12C VYLJAYXZTOTZRR-BTPDVQIOSA-N 0.000 description 1
- 102100037917 CD109 antigen Human genes 0.000 description 1
- 102100035893 CD151 antigen Human genes 0.000 description 1
- 102100024210 CD166 antigen Human genes 0.000 description 1
- 102100027207 CD27 antigen Human genes 0.000 description 1
- 102000049320 CD36 Human genes 0.000 description 1
- 108010045374 CD36 Antigens Proteins 0.000 description 1
- 101150013553 CD40 gene Proteins 0.000 description 1
- 102100036008 CD48 antigen Human genes 0.000 description 1
- 108010065524 CD52 Antigen Proteins 0.000 description 1
- 102100022002 CD59 glycoprotein Human genes 0.000 description 1
- 102100025221 CD70 antigen Human genes 0.000 description 1
- 102100027221 CD81 antigen Human genes 0.000 description 1
- 102100027217 CD82 antigen Human genes 0.000 description 1
- 102100035793 CD83 antigen Human genes 0.000 description 1
- 102000024905 CD99 Human genes 0.000 description 1
- 108060001253 CD99 Proteins 0.000 description 1
- 102000009728 CDC2 Protein Kinase Human genes 0.000 description 1
- 108010034798 CDC2 Protein Kinase Proteins 0.000 description 1
- 108091007914 CDKs Proteins 0.000 description 1
- 102100029758 Cadherin-4 Human genes 0.000 description 1
- 101100381481 Caenorhabditis elegans baz-2 gene Proteins 0.000 description 1
- 101100220616 Caenorhabditis elegans chk-2 gene Proteins 0.000 description 1
- 102100021851 Calbindin Human genes 0.000 description 1
- 241000189662 Calla Species 0.000 description 1
- 101710167800 Capsid assembly scaffolding protein Proteins 0.000 description 1
- 101710205625 Capsid protein p24 Proteins 0.000 description 1
- 102100024533 Carcinoembryonic antigen-related cell adhesion molecule 1 Human genes 0.000 description 1
- 102100025466 Carcinoembryonic antigen-related cell adhesion molecule 3 Human genes 0.000 description 1
- 102100025473 Carcinoembryonic antigen-related cell adhesion molecule 6 Human genes 0.000 description 1
- 102100025470 Carcinoembryonic antigen-related cell adhesion molecule 8 Human genes 0.000 description 1
- 102100032616 Caspase-2 Human genes 0.000 description 1
- 108090000552 Caspase-2 Proteins 0.000 description 1
- 102100026548 Caspase-8 Human genes 0.000 description 1
- 108090000538 Caspase-8 Proteins 0.000 description 1
- 102000016362 Catenins Human genes 0.000 description 1
- 108010067316 Catenins Proteins 0.000 description 1
- 102000003908 Cathepsin D Human genes 0.000 description 1
- 108090000258 Cathepsin D Proteins 0.000 description 1
- 102100023126 Cell surface glycoprotein MUC18 Human genes 0.000 description 1
- 101710163595 Chaperone protein DnaK Proteins 0.000 description 1
- 108010058699 Choline O-acetyltransferase Proteins 0.000 description 1
- 102100023460 Choline O-acetyltransferase Human genes 0.000 description 1
- 102100031699 Choline transporter-like protein 1 Human genes 0.000 description 1
- 108010038447 Chromogranin A Proteins 0.000 description 1
- 102000010792 Chromogranin A Human genes 0.000 description 1
- RURLVUZRUFHCJO-UHFFFAOYSA-N Chromomycin A3 Natural products COC(C1Cc2cc3cc(OC4CC(OC(=O)C)C(OC5CC(O)C(OC)C(C)O5)C(C)O4)c(C)c(O)c3c(O)c2C(=O)C1OC6CC(OC7CC(C)(O)C(OC(=O)C)C(C)O7)C(O)C(C)O6)C(=O)C(O)C(C)O RURLVUZRUFHCJO-UHFFFAOYSA-N 0.000 description 1
- 241000675108 Citrus tangerina Species 0.000 description 1
- 102100040484 Claspin Human genes 0.000 description 1
- 101710117926 Claspin Proteins 0.000 description 1
- 102100025877 Complement component C1q receptor Human genes 0.000 description 1
- 102100025680 Complement decay-accelerating factor Human genes 0.000 description 1
- 102100030886 Complement receptor type 1 Human genes 0.000 description 1
- 102100032768 Complement receptor type 2 Human genes 0.000 description 1
- 102400000739 Corticotropin Human genes 0.000 description 1
- 101800000414 Corticotropin Proteins 0.000 description 1
- 102000005417 Crk Associated Substrate Protein Human genes 0.000 description 1
- 108010031504 Crk Associated Substrate Protein Proteins 0.000 description 1
- 108010068192 Cyclin A Proteins 0.000 description 1
- 108010060385 Cyclin B1 Proteins 0.000 description 1
- 108010058544 Cyclin D2 Proteins 0.000 description 1
- 108010058545 Cyclin D3 Proteins 0.000 description 1
- 108090000257 Cyclin E Proteins 0.000 description 1
- 102000003909 Cyclin E Human genes 0.000 description 1
- 102000002431 Cyclin G Human genes 0.000 description 1
- 108090000404 Cyclin G1 Proteins 0.000 description 1
- 102100025191 Cyclin-A2 Human genes 0.000 description 1
- 102100024458 Cyclin-dependent kinase inhibitor 2A Human genes 0.000 description 1
- 108090000266 Cyclin-dependent kinases Proteins 0.000 description 1
- 102000003903 Cyclin-dependent kinases Human genes 0.000 description 1
- 102100028202 Cytochrome c oxidase subunit 6C Human genes 0.000 description 1
- 102000000634 Cytochrome c oxidase subunit IV Human genes 0.000 description 1
- 108090000365 Cytochrome-c oxidases Proteins 0.000 description 1
- 102100039061 Cytokine receptor common subunit beta Human genes 0.000 description 1
- 102100026234 Cytokine receptor common subunit gamma Human genes 0.000 description 1
- NBSCHQHZLSJFNQ-QTVWNMPRSA-N D-Mannose-6-phosphate Chemical compound OC1O[C@H](COP(O)(O)=O)[C@@H](O)[C@H](O)[C@@H]1O NBSCHQHZLSJFNQ-QTVWNMPRSA-N 0.000 description 1
- 108010008286 DNA nucleotidylexotransferase Proteins 0.000 description 1
- 102100022307 DNA polymerase alpha catalytic subunit Human genes 0.000 description 1
- 102000052510 DNA-Binding Proteins Human genes 0.000 description 1
- 101710096438 DNA-binding protein Proteins 0.000 description 1
- 102000000541 Defensins Human genes 0.000 description 1
- 108010002069 Defensins Proteins 0.000 description 1
- 101710088194 Dehydrogenase Proteins 0.000 description 1
- 108020005199 Dehydrogenases Proteins 0.000 description 1
- 102100036912 Desmin Human genes 0.000 description 1
- 108010044052 Desmin Proteins 0.000 description 1
- 102000028526 Dihydrolipoamide Dehydrogenase Human genes 0.000 description 1
- 108010028127 Dihydrolipoamide Dehydrogenase Proteins 0.000 description 1
- 102100025012 Dipeptidyl peptidase 4 Human genes 0.000 description 1
- 101000782852 Drosophila melanogaster Acetylcholine receptor subunit beta-like 2 Proteins 0.000 description 1
- 102100023266 Dual specificity mitogen-activated protein kinase kinase 2 Human genes 0.000 description 1
- 101710146529 Dual specificity mitogen-activated protein kinase kinase 2 Proteins 0.000 description 1
- 108010024212 E-Selectin Proteins 0.000 description 1
- 238000002965 ELISA Methods 0.000 description 1
- 102100023078 Early endosome antigen 1 Human genes 0.000 description 1
- 102100029722 Ectonucleoside triphosphate diphosphohydrolase 1 Human genes 0.000 description 1
- 108010014258 Elastin Proteins 0.000 description 1
- 102000016942 Elastin Human genes 0.000 description 1
- 102100037241 Endoglin Human genes 0.000 description 1
- 101800003838 Epidermal growth factor Proteins 0.000 description 1
- 108010066687 Epithelial Cell Adhesion Molecule Proteins 0.000 description 1
- 102000018651 Epithelial Cell Adhesion Molecule Human genes 0.000 description 1
- OTMSDBZUPAUEDD-UHFFFAOYSA-N Ethane Chemical group CC OTMSDBZUPAUEDD-UHFFFAOYSA-N 0.000 description 1
- 208000006168 Ewing Sarcoma Diseases 0.000 description 1
- 108010000722 Excitatory Amino Acid Transporter 1 Proteins 0.000 description 1
- 102100031563 Excitatory amino acid transporter 1 Human genes 0.000 description 1
- 102100026693 FAS-associated death domain protein Human genes 0.000 description 1
- 108010077716 Fas-Associated Death Domain Protein Proteins 0.000 description 1
- 102100037362 Fibronectin Human genes 0.000 description 1
- 108010067306 Fibronectins Proteins 0.000 description 1
- VWWQXMAJTJZDQX-UHFFFAOYSA-N Flavine adenine dinucleotide Natural products C1=NC2=C(N)N=CN=C2N1C(C(O)C1O)OC1COP(O)(=O)OP(O)(=O)OCC(O)C(O)C(O)CN1C2=NC(=O)NC(=O)C2=NC2=C1C=C(C)C(C)=C2 VWWQXMAJTJZDQX-UHFFFAOYSA-N 0.000 description 1
- 102100037813 Focal adhesion kinase 1 Human genes 0.000 description 1
- 102100027581 Forkhead box protein P3 Human genes 0.000 description 1
- 102100024185 G1/S-specific cyclin-D2 Human genes 0.000 description 1
- 102100037859 G1/S-specific cyclin-D3 Human genes 0.000 description 1
- 102100032340 G2/mitotic-specific cyclin-B1 Human genes 0.000 description 1
- 108010093031 Galactosidases Proteins 0.000 description 1
- 102000002464 Galactosidases Human genes 0.000 description 1
- 102100021260 Galactosylgalactosylxylosylprotein 3-beta-glucuronosyltransferase 1 Human genes 0.000 description 1
- 108010066371 Galactosylxylosylprotein 3-beta-galactosyltransferase Proteins 0.000 description 1
- 108010001517 Galectin 3 Proteins 0.000 description 1
- 102100039558 Galectin-3 Human genes 0.000 description 1
- 102000009338 Gastric Mucins Human genes 0.000 description 1
- 108010009066 Gastric Mucins Proteins 0.000 description 1
- 102100039289 Glial fibrillary acidic protein Human genes 0.000 description 1
- 102100030651 Glutamate receptor 2 Human genes 0.000 description 1
- 101710087631 Glutamate receptor 2 Proteins 0.000 description 1
- 102100032563 Golgin subfamily A member 1 Human genes 0.000 description 1
- 102100032564 Golgin subfamily A member 2 Human genes 0.000 description 1
- 108010074556 Golgin subfamily A member 2 Proteins 0.000 description 1
- 102100039622 Granulocyte colony-stimulating factor receptor Human genes 0.000 description 1
- 102100028113 Granulocyte-macrophage colony-stimulating factor receptor subunit alpha Human genes 0.000 description 1
- 102000001398 Granzyme Human genes 0.000 description 1
- 108060005986 Granzyme Proteins 0.000 description 1
- 108010043121 Green Fluorescent Proteins Proteins 0.000 description 1
- 102000004144 Green Fluorescent Proteins Human genes 0.000 description 1
- 102100033067 Growth factor receptor-bound protein 2 Human genes 0.000 description 1
- 102100030595 HLA class II histocompatibility antigen gamma chain Human genes 0.000 description 1
- 101710178376 Heat shock 70 kDa protein Proteins 0.000 description 1
- 101710152018 Heat shock cognate 70 kDa protein Proteins 0.000 description 1
- 102100022623 Hepatocyte growth factor receptor Human genes 0.000 description 1
- 102100026122 High affinity immunoglobulin gamma Fc receptor I Human genes 0.000 description 1
- 108010088652 Histocompatibility Antigens Class I Proteins 0.000 description 1
- 102000008949 Histocompatibility Antigens Class I Human genes 0.000 description 1
- 102000017286 Histone H2A Human genes 0.000 description 1
- 108050005231 Histone H2A Proteins 0.000 description 1
- 102100034533 Histone H2AX Human genes 0.000 description 1
- 101710195517 Histone H2AX Proteins 0.000 description 1
- 101710103773 Histone H2B Proteins 0.000 description 1
- 102100021639 Histone H2B type 1-K Human genes 0.000 description 1
- 102000006947 Histones Human genes 0.000 description 1
- 102100027893 Homeobox protein Nkx-2.1 Human genes 0.000 description 1
- 101000800023 Homo sapiens 4F2 cell-surface antigen heavy chain Proteins 0.000 description 1
- 101000678236 Homo sapiens 5'-nucleotidase Proteins 0.000 description 1
- 101000718019 Homo sapiens A-kinase anchor protein 17A Proteins 0.000 description 1
- 101000777636 Homo sapiens ADP-ribosyl cyclase/cyclic ADP-ribose hydrolase 1 Proteins 0.000 description 1
- 101000718243 Homo sapiens Adhesion G protein-coupled receptor E5 Proteins 0.000 description 1
- 101000718525 Homo sapiens Alpha-galactosidase A Proteins 0.000 description 1
- 101000757160 Homo sapiens Aminopeptidase N Proteins 0.000 description 1
- 101000925496 Homo sapiens Ankyrin repeat and SOCS box protein 1 Proteins 0.000 description 1
- 101000971171 Homo sapiens Apoptosis regulator Bcl-2 Proteins 0.000 description 1
- 101000934359 Homo sapiens B-cell differentiation antigen CD72 Proteins 0.000 description 1
- 101000884305 Homo sapiens B-cell receptor CD22 Proteins 0.000 description 1
- 101000980825 Homo sapiens B-lymphocyte antigen CD19 Proteins 0.000 description 1
- 101000897405 Homo sapiens B-lymphocyte antigen CD20 Proteins 0.000 description 1
- 101000863864 Homo sapiens Beta-galactoside alpha-2,6-sialyltransferase 1 Proteins 0.000 description 1
- 101000947174 Homo sapiens C-X-C chemokine receptor type 1 Proteins 0.000 description 1
- 101000916059 Homo sapiens C-X-C chemokine receptor type 2 Proteins 0.000 description 1
- 101000867983 Homo sapiens C5a anaphylatoxin chemotactic receptor 1 Proteins 0.000 description 1
- 101000738399 Homo sapiens CD109 antigen Proteins 0.000 description 1
- 101000914511 Homo sapiens CD27 antigen Proteins 0.000 description 1
- 101000716130 Homo sapiens CD48 antigen Proteins 0.000 description 1
- 101000897400 Homo sapiens CD59 glycoprotein Proteins 0.000 description 1
- 101000934356 Homo sapiens CD70 antigen Proteins 0.000 description 1
- 101000914479 Homo sapiens CD81 antigen Proteins 0.000 description 1
- 101000914469 Homo sapiens CD82 antigen Proteins 0.000 description 1
- 101000946856 Homo sapiens CD83 antigen Proteins 0.000 description 1
- 101000981093 Homo sapiens Carcinoembryonic antigen-related cell adhesion molecule 1 Proteins 0.000 description 1
- 101000914337 Homo sapiens Carcinoembryonic antigen-related cell adhesion molecule 3 Proteins 0.000 description 1
- 101000914324 Homo sapiens Carcinoembryonic antigen-related cell adhesion molecule 5 Proteins 0.000 description 1
- 101000914326 Homo sapiens Carcinoembryonic antigen-related cell adhesion molecule 6 Proteins 0.000 description 1
- 101000914320 Homo sapiens Carcinoembryonic antigen-related cell adhesion molecule 8 Proteins 0.000 description 1
- 101000940912 Homo sapiens Choline transporter-like protein 1 Proteins 0.000 description 1
- 101000933665 Homo sapiens Complement component C1q receptor Proteins 0.000 description 1
- 101000856022 Homo sapiens Complement decay-accelerating factor Proteins 0.000 description 1
- 101000727061 Homo sapiens Complement receptor type 1 Proteins 0.000 description 1
- 101000941929 Homo sapiens Complement receptor type 2 Proteins 0.000 description 1
- 101000861049 Homo sapiens Cytochrome c oxidase subunit 6C Proteins 0.000 description 1
- 101001033280 Homo sapiens Cytokine receptor common subunit beta Proteins 0.000 description 1
- 101000908391 Homo sapiens Dipeptidyl peptidase 4 Proteins 0.000 description 1
- 101000622123 Homo sapiens E-selectin Proteins 0.000 description 1
- 101001050162 Homo sapiens Early endosome antigen 1 Proteins 0.000 description 1
- 101001012447 Homo sapiens Ectonucleoside triphosphate diphosphohydrolase 1 Proteins 0.000 description 1
- 101000881679 Homo sapiens Endoglin Proteins 0.000 description 1
- 101000878536 Homo sapiens Focal adhesion kinase 1 Proteins 0.000 description 1
- 101000861452 Homo sapiens Forkhead box protein P3 Proteins 0.000 description 1
- 101000894906 Homo sapiens Galactosylgalactosylxylosylprotein 3-beta-glucuronosyltransferase 1 Proteins 0.000 description 1
- 101000655398 Homo sapiens General transcription factor IIH subunit 2 Proteins 0.000 description 1
- 101000746364 Homo sapiens Granulocyte colony-stimulating factor receptor Proteins 0.000 description 1
- 101000916625 Homo sapiens Granulocyte-macrophage colony-stimulating factor receptor subunit alpha Proteins 0.000 description 1
- 101000871017 Homo sapiens Growth factor receptor-bound protein 2 Proteins 0.000 description 1
- 101001082627 Homo sapiens HLA class II histocompatibility antigen gamma chain Proteins 0.000 description 1
- 101000972946 Homo sapiens Hepatocyte growth factor receptor Proteins 0.000 description 1
- 101000913074 Homo sapiens High affinity immunoglobulin gamma Fc receptor I Proteins 0.000 description 1
- 101000878602 Homo sapiens Immunoglobulin alpha Fc receptor Proteins 0.000 description 1
- 101001043761 Homo sapiens Inhibitor of nuclear factor kappa-B kinase subunit epsilon Proteins 0.000 description 1
- 101001078158 Homo sapiens Integrin alpha-1 Proteins 0.000 description 1
- 101001078133 Homo sapiens Integrin alpha-2 Proteins 0.000 description 1
- 101000994378 Homo sapiens Integrin alpha-3 Proteins 0.000 description 1
- 101000994375 Homo sapiens Integrin alpha-4 Proteins 0.000 description 1
- 101000994369 Homo sapiens Integrin alpha-5 Proteins 0.000 description 1
- 101000994365 Homo sapiens Integrin alpha-6 Proteins 0.000 description 1
- 101001046687 Homo sapiens Integrin alpha-E Proteins 0.000 description 1
- 101001078143 Homo sapiens Integrin alpha-IIb Proteins 0.000 description 1
- 101001046686 Homo sapiens Integrin alpha-M Proteins 0.000 description 1
- 101000935043 Homo sapiens Integrin beta-1 Proteins 0.000 description 1
- 101000935040 Homo sapiens Integrin beta-2 Proteins 0.000 description 1
- 101001015004 Homo sapiens Integrin beta-3 Proteins 0.000 description 1
- 101001015006 Homo sapiens Integrin beta-4 Proteins 0.000 description 1
- 101000599852 Homo sapiens Intercellular adhesion molecule 1 Proteins 0.000 description 1
- 101000599858 Homo sapiens Intercellular adhesion molecule 2 Proteins 0.000 description 1
- 101000599862 Homo sapiens Intercellular adhesion molecule 3 Proteins 0.000 description 1
- 101001001420 Homo sapiens Interferon gamma receptor 1 Proteins 0.000 description 1
- 101000840293 Homo sapiens Interferon-induced protein 44 Proteins 0.000 description 1
- 101001057504 Homo sapiens Interferon-stimulated gene 20 kDa protein Proteins 0.000 description 1
- 101001076422 Homo sapiens Interleukin-1 receptor type 2 Proteins 0.000 description 1
- 101001055144 Homo sapiens Interleukin-2 receptor subunit alpha Proteins 0.000 description 1
- 101000960936 Homo sapiens Interleukin-5 receptor subunit alpha Proteins 0.000 description 1
- 101001018097 Homo sapiens L-selectin Proteins 0.000 description 1
- 101000605020 Homo sapiens Large neutral amino acids transporter small subunit 1 Proteins 0.000 description 1
- 101000777628 Homo sapiens Leukocyte antigen CD37 Proteins 0.000 description 1
- 101000984196 Homo sapiens Leukocyte immunoglobulin-like receptor subfamily A member 5 Proteins 0.000 description 1
- 101000984190 Homo sapiens Leukocyte immunoglobulin-like receptor subfamily B member 1 Proteins 0.000 description 1
- 101000868279 Homo sapiens Leukocyte surface antigen CD47 Proteins 0.000 description 1
- 101000980823 Homo sapiens Leukocyte surface antigen CD53 Proteins 0.000 description 1
- 101000608935 Homo sapiens Leukosialin Proteins 0.000 description 1
- 101001064870 Homo sapiens Lon protease homolog, mitochondrial Proteins 0.000 description 1
- 101000878605 Homo sapiens Low affinity immunoglobulin epsilon Fc receptor Proteins 0.000 description 1
- 101000917826 Homo sapiens Low affinity immunoglobulin gamma Fc region receptor II-a Proteins 0.000 description 1
- 101000917824 Homo sapiens Low affinity immunoglobulin gamma Fc region receptor II-b Proteins 0.000 description 1
- 101000917858 Homo sapiens Low affinity immunoglobulin gamma Fc region receptor III-A Proteins 0.000 description 1
- 101000917839 Homo sapiens Low affinity immunoglobulin gamma Fc region receptor III-B Proteins 0.000 description 1
- 101001063392 Homo sapiens Lymphocyte function-associated antigen 3 Proteins 0.000 description 1
- 101001023379 Homo sapiens Lysosome-associated membrane glycoprotein 1 Proteins 0.000 description 1
- 101000604993 Homo sapiens Lysosome-associated membrane glycoprotein 2 Proteins 0.000 description 1
- 101000916644 Homo sapiens Macrophage colony-stimulating factor 1 receptor Proteins 0.000 description 1
- 101001106413 Homo sapiens Macrophage-stimulating protein receptor Proteins 0.000 description 1
- 101000934372 Homo sapiens Macrosialin Proteins 0.000 description 1
- 101001008874 Homo sapiens Mast/stem cell growth factor receptor Kit Proteins 0.000 description 1
- 101000990902 Homo sapiens Matrix metalloproteinase-9 Proteins 0.000 description 1
- 101000961414 Homo sapiens Membrane cofactor protein Proteins 0.000 description 1
- 101000946889 Homo sapiens Monocyte differentiation antigen CD14 Proteins 0.000 description 1
- 101001133056 Homo sapiens Mucin-1 Proteins 0.000 description 1
- 101000934338 Homo sapiens Myeloid cell surface antigen CD33 Proteins 0.000 description 1
- 101001023043 Homo sapiens Myoblast determination protein 1 Proteins 0.000 description 1
- 101000589002 Homo sapiens Myogenin Proteins 0.000 description 1
- 101000971513 Homo sapiens Natural killer cells antigen CD94 Proteins 0.000 description 1
- 101000581981 Homo sapiens Neural cell adhesion molecule 1 Proteins 0.000 description 1
- 101000979249 Homo sapiens Neuromodulin Proteins 0.000 description 1
- 101000622137 Homo sapiens P-selectin Proteins 0.000 description 1
- 101001071312 Homo sapiens Platelet glycoprotein IX Proteins 0.000 description 1
- 101001070790 Homo sapiens Platelet glycoprotein Ib alpha chain Proteins 0.000 description 1
- 101001070786 Homo sapiens Platelet glycoprotein Ib beta chain Proteins 0.000 description 1
- 101001033026 Homo sapiens Platelet glycoprotein V Proteins 0.000 description 1
- 101001126417 Homo sapiens Platelet-derived growth factor receptor alpha Proteins 0.000 description 1
- 101000692455 Homo sapiens Platelet-derived growth factor receptor beta Proteins 0.000 description 1
- 101000617708 Homo sapiens Pregnancy-specific beta-1-glycoprotein 1 Proteins 0.000 description 1
- 101000583175 Homo sapiens Prolactin-inducible protein Proteins 0.000 description 1
- 101001043564 Homo sapiens Prolow-density lipoprotein receptor-related protein 1 Proteins 0.000 description 1
- 101001074727 Homo sapiens Ribonucleoside-diphosphate reductase large subunit Proteins 0.000 description 1
- 101000633778 Homo sapiens SLAM family member 5 Proteins 0.000 description 1
- 101000739767 Homo sapiens Semaphorin-7A Proteins 0.000 description 1
- 101000595531 Homo sapiens Serine/threonine-protein kinase pim-1 Proteins 0.000 description 1
- 101001001648 Homo sapiens Serine/threonine-protein kinase pim-2 Proteins 0.000 description 1
- 101000884271 Homo sapiens Signal transducer CD24 Proteins 0.000 description 1
- 101000946860 Homo sapiens T-cell surface glycoprotein CD3 epsilon chain Proteins 0.000 description 1
- 101000596234 Homo sapiens T-cell surface protein tactile Proteins 0.000 description 1
- 101000914514 Homo sapiens T-cell-specific surface glycoprotein CD28 Proteins 0.000 description 1
- 101000914484 Homo sapiens T-lymphocyte activation antigen CD80 Proteins 0.000 description 1
- 101000800116 Homo sapiens Thy-1 membrane glycoprotein Proteins 0.000 description 1
- 101000835093 Homo sapiens Transferrin receptor protein 1 Proteins 0.000 description 1
- 101000801228 Homo sapiens Tumor necrosis factor receptor superfamily member 1A Proteins 0.000 description 1
- 101000801232 Homo sapiens Tumor necrosis factor receptor superfamily member 1B Proteins 0.000 description 1
- 101000851376 Homo sapiens Tumor necrosis factor receptor superfamily member 8 Proteins 0.000 description 1
- 101000851370 Homo sapiens Tumor necrosis factor receptor superfamily member 9 Proteins 0.000 description 1
- 101000760337 Homo sapiens Urokinase plasminogen activator surface receptor Proteins 0.000 description 1
- 101000622304 Homo sapiens Vascular cell adhesion protein 1 Proteins 0.000 description 1
- 101710146024 Horcolin Proteins 0.000 description 1
- 241000701806 Human papillomavirus Species 0.000 description 1
- 102000038455 IGF Type 1 Receptor Human genes 0.000 description 1
- 108010031794 IGF Type 1 Receptor Proteins 0.000 description 1
- 108010031792 IGF Type 2 Receptor Proteins 0.000 description 1
- 108091058560 IL8 Proteins 0.000 description 1
- 102100038005 Immunoglobulin alpha Fc receptor Human genes 0.000 description 1
- 102100022516 Immunoglobulin superfamily member 2 Human genes 0.000 description 1
- 102100021857 Inhibitor of nuclear factor kappa-B kinase subunit epsilon Human genes 0.000 description 1
- 229930010555 Inosine Natural products 0.000 description 1
- UGQMRVRMYYASKQ-KQYNXXCUSA-N Inosine Chemical compound O[C@@H]1[C@H](O)[C@@H](CO)O[C@H]1N1C2=NC=NC(O)=C2N=C1 UGQMRVRMYYASKQ-KQYNXXCUSA-N 0.000 description 1
- 108010001127 Insulin Receptor Proteins 0.000 description 1
- 102100036721 Insulin receptor Human genes 0.000 description 1
- 102100025087 Insulin receptor substrate 1 Human genes 0.000 description 1
- 101710201824 Insulin receptor substrate 1 Proteins 0.000 description 1
- 108090000723 Insulin-Like Growth Factor I Proteins 0.000 description 1
- 102000004218 Insulin-Like Growth Factor I Human genes 0.000 description 1
- 102000048143 Insulin-Like Growth Factor II Human genes 0.000 description 1
- 108090001117 Insulin-Like Growth Factor II Proteins 0.000 description 1
- 102100025323 Integrin alpha-1 Human genes 0.000 description 1
- 102100025305 Integrin alpha-2 Human genes 0.000 description 1
- 102100032819 Integrin alpha-3 Human genes 0.000 description 1
- 102100032818 Integrin alpha-4 Human genes 0.000 description 1
- 102100032817 Integrin alpha-5 Human genes 0.000 description 1
- 102100032816 Integrin alpha-6 Human genes 0.000 description 1
- 102100022341 Integrin alpha-E Human genes 0.000 description 1
- 102100025306 Integrin alpha-IIb Human genes 0.000 description 1
- 102100022338 Integrin alpha-M Human genes 0.000 description 1
- 102100022297 Integrin alpha-X Human genes 0.000 description 1
- 108010047852 Integrin alphaVbeta3 Proteins 0.000 description 1
- 102100025304 Integrin beta-1 Human genes 0.000 description 1
- 102100025390 Integrin beta-2 Human genes 0.000 description 1
- 102100032999 Integrin beta-3 Human genes 0.000 description 1
- 102100033000 Integrin beta-4 Human genes 0.000 description 1
- 102100033010 Integrin beta-5 Human genes 0.000 description 1
- 102000012355 Integrin beta1 Human genes 0.000 description 1
- 108010022222 Integrin beta1 Proteins 0.000 description 1
- 108010020950 Integrin beta3 Proteins 0.000 description 1
- 108010064593 Intercellular Adhesion Molecule-1 Proteins 0.000 description 1
- 102100037872 Intercellular adhesion molecule 2 Human genes 0.000 description 1
- 102100037871 Intercellular adhesion molecule 3 Human genes 0.000 description 1
- 102100029604 Interferon alpha-inducible protein 27, mitochondrial Human genes 0.000 description 1
- 102100035678 Interferon gamma receptor 1 Human genes 0.000 description 1
- 102100029607 Interferon-induced protein 44 Human genes 0.000 description 1
- 102100027268 Interferon-stimulated gene 20 kDa protein Human genes 0.000 description 1
- 102100026017 Interleukin-1 receptor type 2 Human genes 0.000 description 1
- 108010038453 Interleukin-2 Receptors Proteins 0.000 description 1
- 102000010789 Interleukin-2 Receptors Human genes 0.000 description 1
- 102100026879 Interleukin-2 receptor subunit beta Human genes 0.000 description 1
- 102100033493 Interleukin-3 receptor subunit alpha Human genes 0.000 description 1
- 102100039078 Interleukin-4 receptor subunit alpha Human genes 0.000 description 1
- 102100039881 Interleukin-5 receptor subunit alpha Human genes 0.000 description 1
- 102000004889 Interleukin-6 Human genes 0.000 description 1
- 108090001005 Interleukin-6 Proteins 0.000 description 1
- 102100037792 Interleukin-6 receptor subunit alpha Human genes 0.000 description 1
- 102100037795 Interleukin-6 receptor subunit beta Human genes 0.000 description 1
- 102100021593 Interleukin-7 receptor subunit alpha Human genes 0.000 description 1
- 102000004890 Interleukin-8 Human genes 0.000 description 1
- 108090001007 Interleukin-8 Proteins 0.000 description 1
- 108700003486 Jagged-1 Proteins 0.000 description 1
- 238000010824 Kaplan-Meier survival analysis Methods 0.000 description 1
- 102100023972 Keratin, type II cytoskeletal 8 Human genes 0.000 description 1
- 108010070511 Keratin-8 Proteins 0.000 description 1
- 102100033467 L-selectin Human genes 0.000 description 1
- QIVBCDIJIAJPQS-VIFPVBQESA-N L-tryptophane Chemical compound C1=CC=C2C(C[C@H](N)C(O)=O)=CNC2=C1 QIVBCDIJIAJPQS-VIFPVBQESA-N 0.000 description 1
- OUYCCCASQSFEME-QMMMGPOBSA-N L-tyrosine Chemical compound OC(=O)[C@@H](N)CC1=CC=C(O)C=C1 OUYCCCASQSFEME-QMMMGPOBSA-N 0.000 description 1
- 101150118523 LYS4 gene Proteins 0.000 description 1
- 102000008201 Lamin Type A Human genes 0.000 description 1
- 108010021099 Lamin Type A Proteins 0.000 description 1
- 102100038204 Large neutral amino acids transporter small subunit 1 Human genes 0.000 description 1
- 101710189395 Lectin Proteins 0.000 description 1
- 101000839464 Leishmania braziliensis Heat shock 70 kDa protein Proteins 0.000 description 1
- 102000002704 Leucyl aminopeptidase Human genes 0.000 description 1
- 108010004098 Leucyl aminopeptidase Proteins 0.000 description 1
- 108010013709 Leukocyte Common Antigens Proteins 0.000 description 1
- 102100031586 Leukocyte antigen CD37 Human genes 0.000 description 1
- 102100025574 Leukocyte immunoglobulin-like receptor subfamily A member 5 Human genes 0.000 description 1
- 102100032913 Leukocyte surface antigen CD47 Human genes 0.000 description 1
- 102100024221 Leukocyte surface antigen CD53 Human genes 0.000 description 1
- 102100039564 Leukosialin Human genes 0.000 description 1
- 102100038007 Low affinity immunoglobulin epsilon Fc receptor Human genes 0.000 description 1
- 102100029204 Low affinity immunoglobulin gamma Fc region receptor II-a Human genes 0.000 description 1
- 102100029193 Low affinity immunoglobulin gamma Fc region receptor III-A Human genes 0.000 description 1
- 102100029185 Low affinity immunoglobulin gamma Fc region receptor III-B Human genes 0.000 description 1
- 108060001084 Luciferase Proteins 0.000 description 1
- 239000005089 Luciferase Substances 0.000 description 1
- 102100030984 Lymphocyte function-associated antigen 3 Human genes 0.000 description 1
- 101710116782 Lysosome-associated membrane glycoprotein 1 Proteins 0.000 description 1
- 102100038225 Lysosome-associated membrane glycoprotein 2 Human genes 0.000 description 1
- 102000016200 MART-1 Antigen Human genes 0.000 description 1
- 108010010995 MART-1 Antigen Proteins 0.000 description 1
- 101800000695 MLL cleavage product C180 Proteins 0.000 description 1
- 102100028198 Macrophage colony-stimulating factor 1 receptor Human genes 0.000 description 1
- 102100021435 Macrophage-stimulating protein receptor Human genes 0.000 description 1
- 102100025136 Macrosialin Human genes 0.000 description 1
- 102000019218 Mannose-6-phosphate receptors Human genes 0.000 description 1
- 101710179758 Mannose-specific lectin Proteins 0.000 description 1
- 101710150763 Mannose-specific lectin 1 Proteins 0.000 description 1
- 101710150745 Mannose-specific lectin 2 Proteins 0.000 description 1
- 102100027754 Mast/stem cell growth factor receptor Kit Human genes 0.000 description 1
- 102000000380 Matrix Metalloproteinase 1 Human genes 0.000 description 1
- 108010016113 Matrix Metalloproteinase 1 Proteins 0.000 description 1
- 108010016165 Matrix Metalloproteinase 2 Proteins 0.000 description 1
- 102000002274 Matrix Metalloproteinases Human genes 0.000 description 1
- 108010000684 Matrix Metalloproteinases Proteins 0.000 description 1
- 102100030412 Matrix metalloproteinase-9 Human genes 0.000 description 1
- 102100039373 Membrane cofactor protein Human genes 0.000 description 1
- 102000003735 Mesothelin Human genes 0.000 description 1
- 108090000015 Mesothelin Proteins 0.000 description 1
- 102000003792 Metallothionein Human genes 0.000 description 1
- 108090000157 Metallothionein Proteins 0.000 description 1
- 241001465754 Metazoa Species 0.000 description 1
- PQMWYJDJHJQZDE-UHFFFAOYSA-M Methantheline bromide Chemical compound [Br-].C1=CC=C2C(C(=O)OCC[N+](C)(CC)CC)C3=CC=CC=C3OC2=C1 PQMWYJDJHJQZDE-UHFFFAOYSA-M 0.000 description 1
- 102100025825 Methylated-DNA-protein-cysteine methyltransferase Human genes 0.000 description 1
- 208000009795 Microphthalmos Diseases 0.000 description 1
- 102000003794 Mini-chromosome maintenance proteins Human genes 0.000 description 1
- 108090000159 Mini-chromosome maintenance proteins Proteins 0.000 description 1
- 102000004232 Mitogen-Activated Protein Kinase Kinases Human genes 0.000 description 1
- 108090000744 Mitogen-Activated Protein Kinase Kinases Proteins 0.000 description 1
- 102100035877 Monocyte differentiation antigen CD14 Human genes 0.000 description 1
- 101100381525 Mus musculus Bcl6 gene Proteins 0.000 description 1
- 101100390562 Mus musculus Fen1 gene Proteins 0.000 description 1
- 101001096236 Mus musculus Prolactin-inducible protein homolog Proteins 0.000 description 1
- 102000047918 Myelin Basic Human genes 0.000 description 1
- 101710107068 Myelin basic protein Proteins 0.000 description 1
- 102100025243 Myeloid cell surface antigen CD33 Human genes 0.000 description 1
- 102100038610 Myeloperoxidase Human genes 0.000 description 1
- 108090000235 Myeloperoxidases Proteins 0.000 description 1
- 102100035077 Myoblast determination protein 1 Human genes 0.000 description 1
- 102100032970 Myogenin Human genes 0.000 description 1
- 102100030856 Myoglobin Human genes 0.000 description 1
- 108010062374 Myoglobin Proteins 0.000 description 1
- BKAYIFDRRZZKNF-VIFPVBQESA-N N-acetylcarnosine Chemical compound CC(=O)NCCC(=O)N[C@H](C(O)=O)CC1=CN=CN1 BKAYIFDRRZZKNF-VIFPVBQESA-N 0.000 description 1
- CRJGESKKUOMBCT-VQTJNVASSA-N N-acetylsphinganine Chemical compound CCCCCCCCCCCCCCC[C@@H](O)[C@H](CO)NC(C)=O CRJGESKKUOMBCT-VQTJNVASSA-N 0.000 description 1
- 108050000637 N-cadherin Proteins 0.000 description 1
- 102000006746 NADH Dehydrogenase Human genes 0.000 description 1
- 108010086428 NADH Dehydrogenase Proteins 0.000 description 1
- 102000011324 NDRG Human genes 0.000 description 1
- 108050001500 NDRG Proteins 0.000 description 1
- 102100021462 Natural killer cells antigen CD94 Human genes 0.000 description 1
- 102100023195 Nephrin Human genes 0.000 description 1
- 102100027347 Neural cell adhesion molecule 1 Human genes 0.000 description 1
- 108090000556 Neuregulin-1 Proteins 0.000 description 1
- 102400000058 Neuregulin-1 Human genes 0.000 description 1
- 206010029260 Neuroblastoma Diseases 0.000 description 1
- 102100023206 Neuromodulin Human genes 0.000 description 1
- 102000019315 Nicotinic acetylcholine receptors Human genes 0.000 description 1
- 108050006807 Nicotinic acetylcholine receptors Proteins 0.000 description 1
- 238000010826 Nissl staining Methods 0.000 description 1
- 108090000163 Nuclear pore complex proteins Proteins 0.000 description 1
- 102000003789 Nuclear pore complex proteins Human genes 0.000 description 1
- 108091034117 Oligonucleotide Proteins 0.000 description 1
- 206010033128 Ovarian cancer Diseases 0.000 description 1
- 206010061535 Ovarian neoplasm Diseases 0.000 description 1
- 102100023472 P-selectin Human genes 0.000 description 1
- 102100034925 P-selectin glycoprotein ligand 1 Human genes 0.000 description 1
- 206010061902 Pancreatic neoplasm Diseases 0.000 description 1
- 108090000445 Parathyroid hormone Proteins 0.000 description 1
- 102000018546 Paxillin Human genes 0.000 description 1
- ACNHBCIZLNNLRS-UHFFFAOYSA-N Paxilline 1 Natural products N1C2=CC=CC=C2C2=C1C1(C)C3(C)CCC4OC(C(C)(O)C)C(=O)C=C4C3(O)CCC1C2 ACNHBCIZLNNLRS-UHFFFAOYSA-N 0.000 description 1
- 102000035195 Peptidases Human genes 0.000 description 1
- 108091005804 Peptidases Proteins 0.000 description 1
- 108091093037 Peptide nucleic acid Proteins 0.000 description 1
- 102100028465 Peripherin Human genes 0.000 description 1
- 108010003081 Peripherins Proteins 0.000 description 1
- 102000001105 Phosphofructokinases Human genes 0.000 description 1
- 108010069341 Phosphofructokinases Proteins 0.000 description 1
- 101710177166 Phosphoprotein Proteins 0.000 description 1
- 102000009097 Phosphorylases Human genes 0.000 description 1
- 108010073135 Phosphorylases Proteins 0.000 description 1
- 108010004729 Phycoerythrin Proteins 0.000 description 1
- 102100024616 Platelet endothelial cell adhesion molecule Human genes 0.000 description 1
- 102100036851 Platelet glycoprotein IX Human genes 0.000 description 1
- 102100034173 Platelet glycoprotein Ib alpha chain Human genes 0.000 description 1
- 102100034168 Platelet glycoprotein Ib beta chain Human genes 0.000 description 1
- 102100038411 Platelet glycoprotein V Human genes 0.000 description 1
- 102100030485 Platelet-derived growth factor receptor alpha Human genes 0.000 description 1
- 102100026547 Platelet-derived growth factor receptor beta Human genes 0.000 description 1
- 102100029740 Poliovirus receptor Human genes 0.000 description 1
- 102000012338 Poly(ADP-ribose) Polymerases Human genes 0.000 description 1
- 108010061844 Poly(ADP-ribose) Polymerases Proteins 0.000 description 1
- 229920000776 Poly(Adenosine diphosphate-ribose) polymerase Polymers 0.000 description 1
- 108010071690 Prealbumin Proteins 0.000 description 1
- 102100022024 Pregnancy-specific beta-1-glycoprotein 1 Human genes 0.000 description 1
- 102100033237 Pro-epidermal growth factor Human genes 0.000 description 1
- 101710127372 Probable head completion protein 2 Proteins 0.000 description 1
- 102100036829 Probable peptidyl-tRNA hydrolase Human genes 0.000 description 1
- 101710184309 Probable sucrose-6-phosphate hydrolase Proteins 0.000 description 1
- 102100030350 Prolactin-inducible protein Human genes 0.000 description 1
- 102100021923 Prolow-density lipoprotein receptor-related protein 1 Human genes 0.000 description 1
- 206010060862 Prostate cancer Diseases 0.000 description 1
- 208000000236 Prostatic Neoplasms Diseases 0.000 description 1
- 102100035703 Prostatic acid phosphatase Human genes 0.000 description 1
- 239000004365 Protease Substances 0.000 description 1
- 102100032702 Protein jagged-1 Human genes 0.000 description 1
- 108700037966 Protein jagged-1 Proteins 0.000 description 1
- 101100119953 Pyrococcus furiosus (strain ATCC 43587 / DSM 3638 / JCM 8422 / Vc1) fen gene Proteins 0.000 description 1
- 108010086890 R-cadherin Proteins 0.000 description 1
- 101100372762 Rattus norvegicus Flt1 gene Proteins 0.000 description 1
- 102100020718 Receptor-type tyrosine-protein kinase FLT3 Human genes 0.000 description 1
- 102100039808 Receptor-type tyrosine-protein phosphatase eta Human genes 0.000 description 1
- 208000006265 Renal cell carcinoma Diseases 0.000 description 1
- 108010093560 Rezafungin Proteins 0.000 description 1
- 102100036320 Ribonucleoside-diphosphate reductase large subunit Human genes 0.000 description 1
- 108010041388 Ribonucleotide Reductases Proteins 0.000 description 1
- 102000000505 Ribonucleotide Reductases Human genes 0.000 description 1
- 240000007651 Rubus glaucus Species 0.000 description 1
- 235000011034 Rubus glaucus Nutrition 0.000 description 1
- 235000009122 Rubus idaeus Nutrition 0.000 description 1
- 102000013674 S-100 Human genes 0.000 description 1
- 108700021018 S100 Proteins 0.000 description 1
- 102100029216 SLAM family member 5 Human genes 0.000 description 1
- 108091006232 SLC7A5 Proteins 0.000 description 1
- 108010082545 Secretory Leukocyte Peptidase Inhibitor Proteins 0.000 description 1
- 102100037545 Semaphorin-7A Human genes 0.000 description 1
- 102100023085 Serine/threonine-protein kinase mTOR Human genes 0.000 description 1
- 102100036077 Serine/threonine-protein kinase pim-1 Human genes 0.000 description 1
- 102100036120 Serine/threonine-protein kinase pim-2 Human genes 0.000 description 1
- 102100038081 Signal transducer CD24 Human genes 0.000 description 1
- 108010074687 Signaling Lymphocytic Activation Molecule Family Member 1 Proteins 0.000 description 1
- 102100029215 Signaling lymphocytic activation molecule Human genes 0.000 description 1
- 101710149279 Small delta antigen Proteins 0.000 description 1
- 102000019259 Succinate Dehydrogenase Human genes 0.000 description 1
- 108010012901 Succinate Dehydrogenase Proteins 0.000 description 1
- 102400000472 Sucrase Human genes 0.000 description 1
- 101710112652 Sucrose-6-phosphate hydrolase Proteins 0.000 description 1
- 108010002687 Survivin Proteins 0.000 description 1
- 102000001435 Synapsin Human genes 0.000 description 1
- 108050009621 Synapsin Proteins 0.000 description 1
- 108090001076 Synaptophysin Proteins 0.000 description 1
- 102000004874 Synaptophysin Human genes 0.000 description 1
- 108010057722 Synaptosomal-Associated Protein 25 Proteins 0.000 description 1
- 102100030552 Synaptosomal-associated protein 25 Human genes 0.000 description 1
- 102100035721 Syndecan-1 Human genes 0.000 description 1
- 102100037220 Syndecan-4 Human genes 0.000 description 1
- 108010055215 Syndecan-4 Proteins 0.000 description 1
- 102100035794 T-cell surface glycoprotein CD3 epsilon chain Human genes 0.000 description 1
- 102100035268 T-cell surface protein tactile Human genes 0.000 description 1
- 102100027213 T-cell-specific surface glycoprotein CD28 Human genes 0.000 description 1
- 102100027222 T-lymphocyte activation antigen CD80 Human genes 0.000 description 1
- 108010065917 TOR Serine-Threonine Kinases Proteins 0.000 description 1
- 101710164270 Tail knob protein gp9 Proteins 0.000 description 1
- 102000006463 Talin Human genes 0.000 description 1
- 108010083809 Talin Proteins 0.000 description 1
- 102100024547 Tensin-1 Human genes 0.000 description 1
- 108010088950 Tensins Proteins 0.000 description 1
- 102100024554 Tetranectin Human genes 0.000 description 1
- 108700031954 Tgfb1i1/Leupaxin/TGFB1I1 Proteins 0.000 description 1
- 108010022394 Threonine synthase Proteins 0.000 description 1
- 102100033523 Thy-1 membrane glycoprotein Human genes 0.000 description 1
- 102000005497 Thymidylate Synthase Human genes 0.000 description 1
- 108010057966 Thyroid Nuclear Factor 1 Proteins 0.000 description 1
- MZZINWWGSYUHGU-UHFFFAOYSA-J ToTo-1 Chemical compound [I-].[I-].[I-].[I-].C12=CC=CC=C2C(C=C2N(C3=CC=CC=C3S2)C)=CC=[N+]1CCC[N+](C)(C)CCC[N+](C)(C)CCC[N+](C1=CC=CC=C11)=CC=C1C=C1N(C)C2=CC=CC=C2S1 MZZINWWGSYUHGU-UHFFFAOYSA-J 0.000 description 1
- 102000040945 Transcription factor Human genes 0.000 description 1
- 108091023040 Transcription factor Proteins 0.000 description 1
- 102100029290 Transthyretin Human genes 0.000 description 1
- 239000007983 Tris buffer Substances 0.000 description 1
- QIVBCDIJIAJPQS-UHFFFAOYSA-N Tryptophan Natural products C1=CC=C2C(CC(N)C(O)=O)=CNC2=C1 QIVBCDIJIAJPQS-UHFFFAOYSA-N 0.000 description 1
- 102000005506 Tryptophan Hydroxylase Human genes 0.000 description 1
- 108010031944 Tryptophan Hydroxylase Proteins 0.000 description 1
- 102100031988 Tumor necrosis factor ligand superfamily member 6 Human genes 0.000 description 1
- 108050002568 Tumor necrosis factor ligand superfamily member 6 Proteins 0.000 description 1
- 102100033732 Tumor necrosis factor receptor superfamily member 1A Human genes 0.000 description 1
- 102100033733 Tumor necrosis factor receptor superfamily member 1B Human genes 0.000 description 1
- 102100022153 Tumor necrosis factor receptor superfamily member 4 Human genes 0.000 description 1
- 102100040245 Tumor necrosis factor receptor superfamily member 5 Human genes 0.000 description 1
- 102100036857 Tumor necrosis factor receptor superfamily member 8 Human genes 0.000 description 1
- 102100036856 Tumor necrosis factor receptor superfamily member 9 Human genes 0.000 description 1
- 102100039094 Tyrosinase Human genes 0.000 description 1
- 108060008724 Tyrosinase Proteins 0.000 description 1
- 108091000117 Tyrosine 3-Monooxygenase Proteins 0.000 description 1
- 102000048218 Tyrosine 3-monooxygenases Human genes 0.000 description 1
- 102100021125 Tyrosine-protein kinase ZAP-70 Human genes 0.000 description 1
- 108090000848 Ubiquitin Proteins 0.000 description 1
- 102000044159 Ubiquitin Human genes 0.000 description 1
- 102100024689 Urokinase plasminogen activator surface receptor Human genes 0.000 description 1
- 102000003990 Urokinase-type plasminogen activator Human genes 0.000 description 1
- 108090000435 Urokinase-type plasminogen activator Proteins 0.000 description 1
- 102100035071 Vimentin Human genes 0.000 description 1
- 108010065472 Vimentin Proteins 0.000 description 1
- GRRMZXFOOGQMFA-UHFFFAOYSA-J YoYo-1 Chemical compound [I-].[I-].[I-].[I-].C12=CC=CC=C2C(C=C2N(C3=CC=CC=C3O2)C)=CC=[N+]1CCC[N+](C)(C)CCC[N+](C)(C)CCC[N+](C1=CC=CC=C11)=CC=C1C=C1N(C)C2=CC=CC=C2O1 GRRMZXFOOGQMFA-UHFFFAOYSA-J 0.000 description 1
- 108010046882 ZAP-70 Protein-Tyrosine Kinase Proteins 0.000 description 1
- JLCPHMBAVCMARE-UHFFFAOYSA-N [3-[[3-[[3-[[3-[[3-[[3-[[3-[[3-[[3-[[3-[[3-[[5-(2-amino-6-oxo-1H-purin-9-yl)-3-[[3-[[3-[[3-[[3-[[3-[[5-(2-amino-6-oxo-1H-purin-9-yl)-3-[[5-(2-amino-6-oxo-1H-purin-9-yl)-3-hydroxyoxolan-2-yl]methoxy-hydroxyphosphoryl]oxyoxolan-2-yl]methoxy-hydroxyphosphoryl]oxy-5-(5-methyl-2,4-dioxopyrimidin-1-yl)oxolan-2-yl]methoxy-hydroxyphosphoryl]oxy-5-(6-aminopurin-9-yl)oxolan-2-yl]methoxy-hydroxyphosphoryl]oxy-5-(6-aminopurin-9-yl)oxolan-2-yl]methoxy-hydroxyphosphoryl]oxy-5-(6-aminopurin-9-yl)oxolan-2-yl]methoxy-hydroxyphosphoryl]oxy-5-(6-aminopurin-9-yl)oxolan-2-yl]methoxy-hydroxyphosphoryl]oxyoxolan-2-yl]methoxy-hydroxyphosphoryl]oxy-5-(5-methyl-2,4-dioxopyrimidin-1-yl)oxolan-2-yl]methoxy-hydroxyphosphoryl]oxy-5-(4-amino-2-oxopyrimidin-1-yl)oxolan-2-yl]methoxy-hydroxyphosphoryl]oxy-5-(5-methyl-2,4-dioxopyrimidin-1-yl)oxolan-2-yl]methoxy-hydroxyphosphoryl]oxy-5-(5-methyl-2,4-dioxopyrimidin-1-yl)oxolan-2-yl]methoxy-hydroxyphosphoryl]oxy-5-(6-aminopurin-9-yl)oxolan-2-yl]methoxy-hydroxyphosphoryl]oxy-5-(6-aminopurin-9-yl)oxolan-2-yl]methoxy-hydroxyphosphoryl]oxy-5-(4-amino-2-oxopyrimidin-1-yl)oxolan-2-yl]methoxy-hydroxyphosphoryl]oxy-5-(4-amino-2-oxopyrimidin-1-yl)oxolan-2-yl]methoxy-hydroxyphosphoryl]oxy-5-(4-amino-2-oxopyrimidin-1-yl)oxolan-2-yl]methoxy-hydroxyphosphoryl]oxy-5-(6-aminopurin-9-yl)oxolan-2-yl]methoxy-hydroxyphosphoryl]oxy-5-(4-amino-2-oxopyrimidin-1-yl)oxolan-2-yl]methyl [5-(6-aminopurin-9-yl)-2-(hydroxymethyl)oxolan-3-yl] hydrogen phosphate Polymers Cc1cn(C2CC(OP(O)(=O)OCC3OC(CC3OP(O)(=O)OCC3OC(CC3O)n3cnc4c3nc(N)[nH]c4=O)n3cnc4c3nc(N)[nH]c4=O)C(COP(O)(=O)OC3CC(OC3COP(O)(=O)OC3CC(OC3COP(O)(=O)OC3CC(OC3COP(O)(=O)OC3CC(OC3COP(O)(=O)OC3CC(OC3COP(O)(=O)OC3CC(OC3COP(O)(=O)OC3CC(OC3COP(O)(=O)OC3CC(OC3COP(O)(=O)OC3CC(OC3COP(O)(=O)OC3CC(OC3COP(O)(=O)OC3CC(OC3COP(O)(=O)OC3CC(OC3COP(O)(=O)OC3CC(OC3COP(O)(=O)OC3CC(OC3COP(O)(=O)OC3CC(OC3COP(O)(=O)OC3CC(OC3COP(O)(=O)OC3CC(OC3CO)n3cnc4c(N)ncnc34)n3ccc(N)nc3=O)n3cnc4c(N)ncnc34)n3ccc(N)nc3=O)n3ccc(N)nc3=O)n3ccc(N)nc3=O)n3cnc4c(N)ncnc34)n3cnc4c(N)ncnc34)n3cc(C)c(=O)[nH]c3=O)n3cc(C)c(=O)[nH]c3=O)n3ccc(N)nc3=O)n3cc(C)c(=O)[nH]c3=O)n3cnc4c3nc(N)[nH]c4=O)n3cnc4c(N)ncnc34)n3cnc4c(N)ncnc34)n3cnc4c(N)ncnc34)n3cnc4c(N)ncnc34)O2)c(=O)[nH]c1=O JLCPHMBAVCMARE-UHFFFAOYSA-N 0.000 description 1
- WLKAMFOFXYCYDK-UHFFFAOYSA-N [5-amino-4-[[3-[(2-amino-4-azaniumyl-5-methylphenyl)diazenyl]-4-methylphenyl]diazenyl]-2-methylphenyl]azanium;dichloride Chemical compound [Cl-].[Cl-].CC1=CC=C(N=NC=2C(=CC([NH3+])=C(C)C=2)N)C=C1N=NC1=CC(C)=C([NH3+])C=C1N WLKAMFOFXYCYDK-UHFFFAOYSA-N 0.000 description 1
- XJLXINKUBYWONI-DQQFMEOOSA-N [[(2r,3r,4r,5r)-5-(6-aminopurin-9-yl)-3-hydroxy-4-phosphonooxyoxolan-2-yl]methoxy-hydroxyphosphoryl] [(2s,3r,4s,5s)-5-(3-carbamoylpyridin-1-ium-1-yl)-3,4-dihydroxyoxolan-2-yl]methyl phosphate Chemical compound NC(=O)C1=CC=C[N+]([C@@H]2[C@H]([C@@H](O)[C@H](COP([O-])(=O)OP(O)(=O)OC[C@@H]3[C@H]([C@@H](OP(O)(O)=O)[C@@H](O3)N3C4=NC=NC(N)=C4N=C3)O)O2)O)=C1 XJLXINKUBYWONI-DQQFMEOOSA-N 0.000 description 1
- 239000008351 acetate buffer Substances 0.000 description 1
- DGOBMKYRQHEFGQ-UHFFFAOYSA-L acid green 5 Chemical compound [Na+].[Na+].C=1C=C(C(=C2C=CC(C=C2)=[N+](CC)CC=2C=C(C=CC=2)S([O-])(=O)=O)C=2C=CC(=CC=2)S([O-])(=O)=O)C=CC=1N(CC)CC1=CC=CC(S([O-])(=O)=O)=C1 DGOBMKYRQHEFGQ-UHFFFAOYSA-L 0.000 description 1
- 230000003213 activating effect Effects 0.000 description 1
- 230000001154 acute effect Effects 0.000 description 1
- 230000006978 adaptation Effects 0.000 description 1
- 239000002671 adjuvant Substances 0.000 description 1
- 239000000910 agglutinin Substances 0.000 description 1
- 150000001299 aldehydes Chemical class 0.000 description 1
- 108010091628 alpha 1-Antichymotrypsin Proteins 0.000 description 1
- 108010050122 alpha 1-Antitrypsin Proteins 0.000 description 1
- 229940024142 alpha 1-antitrypsin Drugs 0.000 description 1
- 102000013640 alpha-Crystallin B Chain Human genes 0.000 description 1
- 108010051585 alpha-Crystallin B Chain Proteins 0.000 description 1
- 108010026331 alpha-Fetoproteins Proteins 0.000 description 1
- 102000013529 alpha-Fetoproteins Human genes 0.000 description 1
- 108090000185 alpha-Synuclein Proteins 0.000 description 1
- AWUCVROLDVIAJX-UHFFFAOYSA-N alpha-glycerophosphate Natural products OCC(O)COP(O)(O)=O AWUCVROLDVIAJX-UHFFFAOYSA-N 0.000 description 1
- 108010011385 alpha-internexin Proteins 0.000 description 1
- WLDHEUZGFKACJH-UHFFFAOYSA-K amaranth Chemical compound [Na+].[Na+].[Na+].C12=CC=C(S([O-])(=O)=O)C=C2C=C(S([O-])(=O)=O)C(O)=C1N=NC1=CC=C(S([O-])(=O)=O)C2=CC=CC=C12 WLDHEUZGFKACJH-UHFFFAOYSA-K 0.000 description 1
- UYJXRRSPUVSSMN-UHFFFAOYSA-P ammonium sulfide Chemical compound [NH4+].[NH4+].[S-2] UYJXRRSPUVSSMN-UHFFFAOYSA-P 0.000 description 1
- DZHSAHHDTRWUTF-SIQRNXPUSA-N amyloid-beta polypeptide 42 Chemical compound C([C@@H](C(=O)N[C@@H](C)C(=O)N[C@@H](CCC(O)=O)C(=O)N[C@@H](CC(O)=O)C(=O)N[C@H](C(=O)NCC(=O)N[C@@H](CO)C(=O)N[C@@H](CC(N)=O)C(=O)N[C@@H](CCCCN)C(=O)NCC(=O)N[C@@H](C)C(=O)N[C@H](C(=O)N[C@@H]([C@@H](C)CC)C(=O)NCC(=O)N[C@@H](CC(C)C)C(=O)N[C@@H](CCSC)C(=O)N[C@@H](C(C)C)C(=O)NCC(=O)NCC(=O)N[C@@H](C(C)C)C(=O)N[C@@H](C(C)C)C(=O)N[C@@H]([C@@H](C)CC)C(=O)N[C@@H](C)C(O)=O)[C@@H](C)CC)C(C)C)NC(=O)[C@H](CC=1C=CC=CC=1)NC(=O)[C@@H](NC(=O)[C@H](CC(C)C)NC(=O)[C@H](CCCCN)NC(=O)[C@H](CCC(N)=O)NC(=O)[C@H](CC=1N=CNC=1)NC(=O)[C@H](CC=1N=CNC=1)NC(=O)[C@@H](NC(=O)[C@H](CCC(O)=O)NC(=O)[C@H](CC=1C=CC(O)=CC=1)NC(=O)CNC(=O)[C@H](CO)NC(=O)[C@H](CC(O)=O)NC(=O)[C@H](CC=1N=CNC=1)NC(=O)[C@H](CCCNC(N)=N)NC(=O)[C@H](CC=1C=CC=CC=1)NC(=O)[C@H](CCC(O)=O)NC(=O)[C@H](C)NC(=O)[C@@H](N)CC(O)=O)C(C)C)C(C)C)C1=CC=CC=C1 DZHSAHHDTRWUTF-SIQRNXPUSA-N 0.000 description 1
- 108010080146 androgen receptors Proteins 0.000 description 1
- 230000033115 angiogenesis Effects 0.000 description 1
- 230000002494 anti-cea effect Effects 0.000 description 1
- 229940046836 anti-estrogen Drugs 0.000 description 1
- 230000001833 anti-estrogenic effect Effects 0.000 description 1
- 229930185229 antidesmin Natural products 0.000 description 1
- 239000003418 antiprogestin Substances 0.000 description 1
- 230000001640 apoptogenic effect Effects 0.000 description 1
- 238000000149 argon plasma sintering Methods 0.000 description 1
- JPIYZTWMUGTEHX-UHFFFAOYSA-N auramine O free base Chemical compound C1=CC(N(C)C)=CC=C1C(=N)C1=CC=C(N(C)C)C=C1 JPIYZTWMUGTEHX-UHFFFAOYSA-N 0.000 description 1
- GOOXRYWLNNXLFL-UHFFFAOYSA-H azane oxygen(2-) ruthenium(3+) ruthenium(4+) hexachloride Chemical compound N.N.N.N.N.N.N.N.N.N.N.N.N.N.[O--].[O--].[Cl-].[Cl-].[Cl-].[Cl-].[Cl-].[Cl-].[Ru+3].[Ru+3].[Ru+4] GOOXRYWLNNXLFL-UHFFFAOYSA-H 0.000 description 1
- OHDRQQURAXLVGJ-HLVWOLMTSA-N azane;(2e)-3-ethyl-2-[(e)-(3-ethyl-6-sulfo-1,3-benzothiazol-2-ylidene)hydrazinylidene]-1,3-benzothiazole-6-sulfonic acid Chemical compound [NH4+].[NH4+].S/1C2=CC(S([O-])(=O)=O)=CC=C2N(CC)C\1=N/N=C1/SC2=CC(S([O-])(=O)=O)=CC=C2N1CC OHDRQQURAXLVGJ-HLVWOLMTSA-N 0.000 description 1
- 229960002319 barbital Drugs 0.000 description 1
- 102000005936 beta-Galactosidase Human genes 0.000 description 1
- DRTQHJPVMGBUCF-PSQAKQOGSA-N beta-L-uridine Natural products O[C@H]1[C@@H](O)[C@H](CO)O[C@@H]1N1C(=O)NC(=O)C=C1 DRTQHJPVMGBUCF-PSQAKQOGSA-N 0.000 description 1
- 102000009732 beta-microseminoprotein Human genes 0.000 description 1
- 108010020169 beta-microseminoprotein Proteins 0.000 description 1
- 210000000601 blood cell Anatomy 0.000 description 1
- 210000001185 bone marrow Anatomy 0.000 description 1
- 229910052796 boron Inorganic materials 0.000 description 1
- 210000004556 brain Anatomy 0.000 description 1
- 229940045348 brown mixture Drugs 0.000 description 1
- 229950004398 broxuridine Drugs 0.000 description 1
- 108060001061 calbindin Proteins 0.000 description 1
- DEGAKNSWVGKMLS-UHFFFAOYSA-N calcein Chemical compound O1C(=O)C2=CC=CC=C2C21C1=CC(CN(CC(O)=O)CC(O)=O)=C(O)C=C1OC1=C2C=C(CN(CC(O)=O)CC(=O)O)C(O)=C1 DEGAKNSWVGKMLS-UHFFFAOYSA-N 0.000 description 1
- BQRGNLJZBFXNCZ-UHFFFAOYSA-N calcein am Chemical compound O1C(=O)C2=CC=CC=C2C21C1=CC(CN(CC(=O)OCOC(C)=O)CC(=O)OCOC(C)=O)=C(OC(C)=O)C=C1OC1=C2C=C(CN(CC(=O)OCOC(C)=O)CC(=O)OCOC(=O)C)C(OC(C)=O)=C1 BQRGNLJZBFXNCZ-UHFFFAOYSA-N 0.000 description 1
- 230000022131 cell cycle Effects 0.000 description 1
- 230000004663 cell proliferation Effects 0.000 description 1
- 210000002421 cell wall Anatomy 0.000 description 1
- 229940106189 ceramide Drugs 0.000 description 1
- ZVEQCJWYRWKARO-UHFFFAOYSA-N ceramide Natural products CCCCCCCCCCCCCCC(O)C(=O)NC(CO)C(O)C=CCCC=C(C)CCCCCCCCC ZVEQCJWYRWKARO-UHFFFAOYSA-N 0.000 description 1
- 101150113535 chek1 gene Proteins 0.000 description 1
- 125000003636 chemical group Chemical group 0.000 description 1
- ZYVSOIYQKUDENJ-WKSBCEQHSA-N chromomycin A3 Chemical compound O([C@@H]1C[C@@H](O[C@H](C)[C@@H]1OC(C)=O)OC=1C=C2C=C3C[C@H]([C@@H](C(=O)C3=C(O)C2=C(O)C=1C)O[C@@H]1O[C@H](C)[C@@H](O)[C@H](O[C@@H]2O[C@H](C)[C@@H](O)[C@H](O[C@@H]3O[C@@H](C)[C@H](OC(C)=O)[C@@](C)(O)C3)C2)C1)[C@H](OC)C(=O)[C@@H](O)[C@@H](C)O)[C@@H]1C[C@@H](O)[C@@H](OC)[C@@H](C)O1 ZYVSOIYQKUDENJ-WKSBCEQHSA-N 0.000 description 1
- 238000007621 cluster analysis Methods 0.000 description 1
- 230000000295 complement effect Effects 0.000 description 1
- 102000006834 complement receptors Human genes 0.000 description 1
- 108010047295 complement receptors Proteins 0.000 description 1
- 239000002131 composite material Substances 0.000 description 1
- 230000001010 compromised effect Effects 0.000 description 1
- 238000012790 confirmation Methods 0.000 description 1
- 238000010219 correlation analysis Methods 0.000 description 1
- IDLFZVILOHSSID-OVLDLUHVSA-N corticotropin Chemical compound C([C@@H](C(=O)N[C@@H](CO)C(=O)N[C@@H](CCSC)C(=O)N[C@@H](CCC(O)=O)C(=O)N[C@@H](CC=1NC=NC=1)C(=O)N[C@@H](CC=1C=CC=CC=1)C(=O)N[C@@H](CCCNC(N)=N)C(=O)N[C@@H](CC=1C2=CC=CC=C2NC=1)C(=O)NCC(=O)N[C@@H](CCCCN)C(=O)N1[C@@H](CCC1)C(=O)N[C@@H](C(C)C)C(=O)NCC(=O)N[C@@H](CCCCN)C(=O)N[C@@H](CCCCN)C(=O)N[C@@H](CCCNC(N)=N)C(=O)N[C@@H](CCCNC(N)=N)C(=O)N1[C@@H](CCC1)C(=O)N[C@@H](C(C)C)C(=O)N[C@@H](CCCCN)C(=O)N[C@@H](C(C)C)C(=O)N[C@@H](CC=1C=CC(O)=CC=1)C(=O)N1[C@@H](CCC1)C(=O)N[C@@H](CC(N)=O)C(=O)NCC(=O)N[C@@H](C)C(=O)N[C@@H](CCC(O)=O)C(=O)N[C@@H](CC(O)=O)C(=O)N[C@@H](CCC(O)=O)C(=O)N[C@@H](CO)C(=O)N[C@@H](C)C(=O)N[C@@H](CCC(O)=O)C(=O)N[C@@H](C)C(=O)N[C@@H](CC=1C=CC=CC=1)C(=O)N1[C@@H](CCC1)C(=O)N[C@@H](CC(C)C)C(=O)N[C@@H](CCC(O)=O)C(=O)N[C@@H](CC=1C=CC=CC=1)C(O)=O)NC(=O)[C@@H](N)CO)C1=CC=C(O)C=C1 IDLFZVILOHSSID-OVLDLUHVSA-N 0.000 description 1
- 229960000258 corticotropin Drugs 0.000 description 1
- 238000002790 cross-validation Methods 0.000 description 1
- 125000004122 cyclic group Chemical group 0.000 description 1
- 230000000093 cytochemical effect Effects 0.000 description 1
- 210000004395 cytoplasmic granule Anatomy 0.000 description 1
- RGWHQCVHVJXOKC-SHYZEUOFSA-J dCTP(4-) Chemical compound O=C1N=C(N)C=CN1[C@@H]1O[C@H](COP([O-])(=O)OP([O-])(=O)OP([O-])([O-])=O)[C@@H](O)C1 RGWHQCVHVJXOKC-SHYZEUOFSA-J 0.000 description 1
- 238000007405 data analysis Methods 0.000 description 1
- 230000034994 death Effects 0.000 description 1
- 230000007423 decrease Effects 0.000 description 1
- 210000004443 dendritic cell Anatomy 0.000 description 1
- 230000008021 deposition Effects 0.000 description 1
- 210000005045 desmin Anatomy 0.000 description 1
- OVTCUIZCVUGJHS-UHFFFAOYSA-N dipyrrin Chemical compound C=1C=CNC=1C=C1C=CC=N1 OVTCUIZCVUGJHS-UHFFFAOYSA-N 0.000 description 1
- YSYZSUYFGCLJJB-UHFFFAOYSA-L disodium;(5-bromo-6-chloro-1h-indol-3-yl) phosphate Chemical compound [Na+].[Na+].ClC1=C(Br)C=C2C(OP([O-])(=O)[O-])=CNC2=C1 YSYZSUYFGCLJJB-UHFFFAOYSA-L 0.000 description 1
- YJHDFAAFYNRKQE-YHPRVSEPSA-L disodium;5-[[4-anilino-6-[bis(2-hydroxyethyl)amino]-1,3,5-triazin-2-yl]amino]-2-[(e)-2-[4-[[4-anilino-6-[bis(2-hydroxyethyl)amino]-1,3,5-triazin-2-yl]amino]-2-sulfonatophenyl]ethenyl]benzenesulfonate Chemical compound [Na+].[Na+].N=1C(NC=2C=C(C(\C=C\C=3C(=CC(NC=4N=C(N=C(NC=5C=CC=CC=5)N=4)N(CCO)CCO)=CC=3)S([O-])(=O)=O)=CC=2)S([O-])(=O)=O)=NC(N(CCO)CCO)=NC=1NC1=CC=CC=C1 YJHDFAAFYNRKQE-YHPRVSEPSA-L 0.000 description 1
- 229940079593 drug Drugs 0.000 description 1
- 239000003596 drug target Substances 0.000 description 1
- 238000003708 edge detection Methods 0.000 description 1
- 229920002549 elastin Polymers 0.000 description 1
- 210000002472 endoplasmic reticulum Anatomy 0.000 description 1
- 230000003511 endothelial effect Effects 0.000 description 1
- 238000005516 engineering process Methods 0.000 description 1
- SEACYXSIPDVVMV-UHFFFAOYSA-L eosin Y Chemical compound [Na+].[Na+].[O-]C(=O)C1=CC=CC=C1C1=C2C=C(Br)C(=O)C(Br)=C2OC2=C(Br)C([O-])=C(Br)C=C21 SEACYXSIPDVVMV-UHFFFAOYSA-L 0.000 description 1
- 229940116977 epidermal growth factor Drugs 0.000 description 1
- 108010087914 epidermal growth factor receptor VIII Proteins 0.000 description 1
- 210000002919 epithelial cell Anatomy 0.000 description 1
- 210000000981 epithelium Anatomy 0.000 description 1
- 239000000328 estrogen antagonist Substances 0.000 description 1
- ZMMJGEGLRURXTF-UHFFFAOYSA-N ethidium bromide Chemical compound [Br-].C12=CC(N)=CC=C2C2=CC=C(N)C=C2[N+](CC)=C1C1=CC=CC=C1 ZMMJGEGLRURXTF-UHFFFAOYSA-N 0.000 description 1
- 229960005542 ethidium bromide Drugs 0.000 description 1
- IDAQSADEMXDTKN-UHFFFAOYSA-L ethyl green Chemical compound [Cl-].[Br-].C1=CC([N+](C)(C)CC)=CC=C1C(C=1C=CC(=CC=1)N(C)C)=C1C=CC(=[N+](C)C)C=C1 IDAQSADEMXDTKN-UHFFFAOYSA-L 0.000 description 1
- 238000011156 evaluation Methods 0.000 description 1
- 238000010195 expression analysis Methods 0.000 description 1
- 229950003499 fibrin Drugs 0.000 description 1
- GNBHRKFJIUUOQI-UHFFFAOYSA-N fluorescein Chemical compound O1C(=O)C2=CC=CC=C2C21C1=CC=C(O)C=C1OC1=CC(O)=CC=C21 GNBHRKFJIUUOQI-UHFFFAOYSA-N 0.000 description 1
- 238000000799 fluorescence microscopy Methods 0.000 description 1
- 238000013467 fragmentation Methods 0.000 description 1
- 238000006062 fragmentation reaction Methods 0.000 description 1
- 239000005090 green fluorescent protein Substances 0.000 description 1
- CNKHSLKYRMDDNQ-UHFFFAOYSA-N halofenozide Chemical compound C=1C=CC=CC=1C(=O)N(C(C)(C)C)NC(=O)C1=CC=C(Cl)C=C1 CNKHSLKYRMDDNQ-UHFFFAOYSA-N 0.000 description 1
- 210000002443 helper t lymphocyte Anatomy 0.000 description 1
- 210000003494 hepatocyte Anatomy 0.000 description 1
- 238000012203 high throughput assay Methods 0.000 description 1
- VYLJAYXZTOTZRR-UHFFFAOYSA-N hopane-6alpha,7beta,22-triol Natural products C12CCC3C4(C)CCCC(C)(C)C4C(O)C(O)C3(C)C1(C)CCC1C2(C)CCC1C(C)(O)C VYLJAYXZTOTZRR-UHFFFAOYSA-N 0.000 description 1
- 229940088597 hormone Drugs 0.000 description 1
- 239000005556 hormone Substances 0.000 description 1
- 238000001794 hormone therapy Methods 0.000 description 1
- 235000020256 human milk Nutrition 0.000 description 1
- 210000004251 human milk Anatomy 0.000 description 1
- 229910052739 hydrogen Inorganic materials 0.000 description 1
- 239000001257 hydrogen Substances 0.000 description 1
- 201000010759 hypertrophy of breast Diseases 0.000 description 1
- 210000003016 hypothalamus Anatomy 0.000 description 1
- 238000003709 image segmentation Methods 0.000 description 1
- 239000012216 imaging agent Substances 0.000 description 1
- 210000002861 immature t-cell Anatomy 0.000 description 1
- 229940099472 immunoglobulin a Drugs 0.000 description 1
- 229940027941 immunoglobulin g Drugs 0.000 description 1
- 238000011532 immunohistochemical staining Methods 0.000 description 1
- 238000012744 immunostaining Methods 0.000 description 1
- 238000000338 in vitro Methods 0.000 description 1
- 238000011065 in-situ storage Methods 0.000 description 1
- 239000000411 inducer Substances 0.000 description 1
- 229960003786 inosine Drugs 0.000 description 1
- 108010021518 integrin beta5 Proteins 0.000 description 1
- 210000005049 internexin Anatomy 0.000 description 1
- 230000000968 intestinal effect Effects 0.000 description 1
- 229940029329 intrinsic factor Drugs 0.000 description 1
- 208000030776 invasive breast carcinoma Diseases 0.000 description 1
- 206010073095 invasive ductal breast carcinoma Diseases 0.000 description 1
- 201000010985 invasive ductal carcinoma Diseases 0.000 description 1
- 235000011073 invertase Nutrition 0.000 description 1
- 102000007236 involucrin Human genes 0.000 description 1
- 108010033564 involucrin Proteins 0.000 description 1
- 238000012804 iterative process Methods 0.000 description 1
- 238000003064 k means clustering Methods 0.000 description 1
- RLJMLMKIBZAXJO-UHFFFAOYSA-N lead nitrate Chemical compound [O-][N+](=O)O[Pb]O[N+]([O-])=O RLJMLMKIBZAXJO-UHFFFAOYSA-N 0.000 description 1
- 229940056932 lead sulfide Drugs 0.000 description 1
- 229910052981 lead sulfide Inorganic materials 0.000 description 1
- 208000032839 leukemia Diseases 0.000 description 1
- 210000000265 leukocyte Anatomy 0.000 description 1
- 239000003446 ligand Substances 0.000 description 1
- 238000012417 linear regression Methods 0.000 description 1
- 210000005229 liver cell Anatomy 0.000 description 1
- 238000007477 logistic regression Methods 0.000 description 1
- DLBFLQKQABVKGT-UHFFFAOYSA-L lucifer yellow dye Chemical compound [Li+].[Li+].[O-]S(=O)(=O)C1=CC(C(N(C(=O)NN)C2=O)=O)=C3C2=CC(S([O-])(=O)=O)=CC3=C1N DLBFLQKQABVKGT-UHFFFAOYSA-L 0.000 description 1
- 238000004020 luminiscence type Methods 0.000 description 1
- 210000004698 lymphocyte Anatomy 0.000 description 1
- 230000002132 lysosomal effect Effects 0.000 description 1
- 210000003712 lysosome Anatomy 0.000 description 1
- 230000001868 lysosomic effect Effects 0.000 description 1
- 229960000274 lysozyme Drugs 0.000 description 1
- 239000004325 lysozyme Substances 0.000 description 1
- 210000002540 macrophage Anatomy 0.000 description 1
- 208000015486 malignant pancreatic neoplasm Diseases 0.000 description 1
- 239000011159 matrix material Substances 0.000 description 1
- 210000003593 megakaryocyte Anatomy 0.000 description 1
- 210000004379 membrane Anatomy 0.000 description 1
- 239000012528 membrane Substances 0.000 description 1
- 102000006240 membrane receptors Human genes 0.000 description 1
- 108020004084 membrane receptors Proteins 0.000 description 1
- QSHDDOUJBYECFT-UHFFFAOYSA-N mercury Chemical compound [Hg] QSHDDOUJBYECFT-UHFFFAOYSA-N 0.000 description 1
- 229910052753 mercury Inorganic materials 0.000 description 1
- 229910052751 metal Inorganic materials 0.000 description 1
- 239000002184 metal Substances 0.000 description 1
- 229910001507 metal halide Inorganic materials 0.000 description 1
- 150000005309 metal halides Chemical class 0.000 description 1
- DWCZIOOZPIDHAB-UHFFFAOYSA-L methyl green Chemical compound [Cl-].[Cl-].C1=CC(N(C)C)=CC=C1C(C=1C=CC(=CC=1)[N+](C)(C)C)=C1C=CC(=[N+](C)C)C=C1 DWCZIOOZPIDHAB-UHFFFAOYSA-L 0.000 description 1
- 125000002496 methyl group Chemical group [H]C([H])([H])* 0.000 description 1
- 108040008770 methylated-DNA-[protein]-cysteine S-methyltransferase activity proteins Proteins 0.000 description 1
- CXKWCBBOMKCUKX-UHFFFAOYSA-M methylene blue Chemical compound [Cl-].C1=CC(N(C)C)=CC2=[S+]C3=CC(N(C)C)=CC=C3N=C21 CXKWCBBOMKCUKX-UHFFFAOYSA-M 0.000 description 1
- 229960000907 methylthioninium chloride Drugs 0.000 description 1
- 238000012775 microarray technology Methods 0.000 description 1
- 238000001000 micrograph Methods 0.000 description 1
- 201000010478 microphthalmia Diseases 0.000 description 1
- 108010071421 milk fat globule Proteins 0.000 description 1
- 230000033607 mismatch repair Effects 0.000 description 1
- 230000002438 mitochondrial effect Effects 0.000 description 1
- 230000011278 mitosis Effects 0.000 description 1
- 238000010369 molecular cloning Methods 0.000 description 1
- 239000012120 mounting media Substances 0.000 description 1
- 230000036457 multidrug resistance Effects 0.000 description 1
- 229940051921 muramidase Drugs 0.000 description 1
- 210000001087 myotubule Anatomy 0.000 description 1
- CTIQLGJVGNGFEW-UHFFFAOYSA-L naphthol yellow S Chemical compound [Na+].[Na+].C1=C(S([O-])(=O)=O)C=C2C([O-])=C([N+]([O-])=O)C=C([N+]([O-])=O)C2=C1 CTIQLGJVGNGFEW-UHFFFAOYSA-L 0.000 description 1
- 108010027531 nephrin Proteins 0.000 description 1
- 230000001537 neural effect Effects 0.000 description 1
- 108010091047 neurofilament protein H Proteins 0.000 description 1
- 210000004498 neuroglial cell Anatomy 0.000 description 1
- PGSADBUBUOPOJS-UHFFFAOYSA-N neutral red Chemical compound Cl.C1=C(C)C(N)=CC2=NC3=CC(N(C)C)=CC=C3N=C21 PGSADBUBUOPOJS-UHFFFAOYSA-N 0.000 description 1
- 210000000440 neutrophil Anatomy 0.000 description 1
- VVGIYYKRAMHVLU-UHFFFAOYSA-N newbouldiamide Natural products CCCCCCCCCCCCCCCCCCCC(O)C(O)C(O)C(CO)NC(=O)CCCCCCCCCCCCCCCCC VVGIYYKRAMHVLU-UHFFFAOYSA-N 0.000 description 1
- BOPGDPNILDQYTO-NNYOXOHSSA-N nicotinamide-adenine dinucleotide Chemical compound C1=CCC(C(=O)N)=CN1[C@H]1[C@H](O)[C@H](O)[C@@H](COP(O)(=O)OP(O)(=O)OC[C@@H]2[C@H]([C@@H](O)[C@@H](O2)N2C3=NC=NC(N)=C3N=C2)O)O1 BOPGDPNILDQYTO-NNYOXOHSSA-N 0.000 description 1
- 229960002378 oftasceine Drugs 0.000 description 1
- 102000027450 oncoproteins Human genes 0.000 description 1
- 108091008819 oncoproteins Proteins 0.000 description 1
- 238000001543 one-way ANOVA Methods 0.000 description 1
- 238000012634 optical imaging Methods 0.000 description 1
- 230000002611 ovarian Effects 0.000 description 1
- 210000000496 pancreas Anatomy 0.000 description 1
- 201000002528 pancreatic cancer Diseases 0.000 description 1
- 208000008443 pancreatic carcinoma Diseases 0.000 description 1
- 230000001717 pathogenic effect Effects 0.000 description 1
- 239000013610 patient sample Substances 0.000 description 1
- ACNHBCIZLNNLRS-UBGQALKQSA-N paxilline Chemical compound N1C2=CC=CC=C2C2=C1[C@]1(C)[C@@]3(C)CC[C@@H]4O[C@H](C(C)(O)C)C(=O)C=C4[C@]3(O)CC[C@H]1C2 ACNHBCIZLNNLRS-UBGQALKQSA-N 0.000 description 1
- 239000000816 peptidomimetic Substances 0.000 description 1
- 210000005047 peripherin Anatomy 0.000 description 1
- DHRLEVQXOMLTIM-UHFFFAOYSA-N phosphoric acid;trioxomolybdenum Chemical compound O=[Mo](=O)=O.O=[Mo](=O)=O.O=[Mo](=O)=O.O=[Mo](=O)=O.O=[Mo](=O)=O.O=[Mo](=O)=O.O=[Mo](=O)=O.O=[Mo](=O)=O.O=[Mo](=O)=O.O=[Mo](=O)=O.O=[Mo](=O)=O.O=[Mo](=O)=O.OP(O)(O)=O DHRLEVQXOMLTIM-UHFFFAOYSA-N 0.000 description 1
- 108060006184 phycobiliprotein Proteins 0.000 description 1
- INAAIJLSXJJHOZ-UHFFFAOYSA-N pibenzimol Chemical compound C1CN(C)CCN1C1=CC=C(N=C(N2)C=3C=C4NC(=NC4=CC=3)C=3C=CC(O)=CC=3)C2=C1 INAAIJLSXJJHOZ-UHFFFAOYSA-N 0.000 description 1
- OXNIZHLAWKMVMX-UHFFFAOYSA-N picric acid Chemical compound OC1=C([N+]([O-])=O)C=C([N+]([O-])=O)C=C1[N+]([O-])=O OXNIZHLAWKMVMX-UHFFFAOYSA-N 0.000 description 1
- 230000001817 pituitary effect Effects 0.000 description 1
- 108010031345 placental alkaline phosphatase Proteins 0.000 description 1
- 102000004401 podocalyxin Human genes 0.000 description 1
- 108090000917 podocalyxin Proteins 0.000 description 1
- 102000040430 polynucleotide Human genes 0.000 description 1
- 108091033319 polynucleotide Proteins 0.000 description 1
- 239000002157 polynucleotide Substances 0.000 description 1
- 238000013105 post hoc analysis Methods 0.000 description 1
- 238000002360 preparation method Methods 0.000 description 1
- 230000003623 progesteronic effect Effects 0.000 description 1
- XJMOSONTPMZWPB-UHFFFAOYSA-M propidium iodide Chemical compound [I-].[I-].C12=CC(N)=CC=C2C2=CC=C(N)C=C2[N+](CCC[N+](C)(CC)CC)=C1C1=CC=CC=C1 XJMOSONTPMZWPB-UHFFFAOYSA-M 0.000 description 1
- 108010043671 prostatic acid phosphatase Proteins 0.000 description 1
- 230000005855 radiation Effects 0.000 description 1
- 230000035806 respiratory chain Effects 0.000 description 1
- 230000004044 response Effects 0.000 description 1
- PYWVYCXTNDRMGF-UHFFFAOYSA-N rhodamine B Chemical compound [Cl-].C=12C=CC(=[N+](CC)CC)C=C2OC2=CC(N(CC)CC)=CC=C2C=1C1=CC=CC=C1C(O)=O PYWVYCXTNDRMGF-UHFFFAOYSA-N 0.000 description 1
- HOZOZZFCZRXYEK-HNHWXVNLSA-M scopolamine butylbromide Chemical compound [Br-].C1([C@@H](CO)C(=O)OC2C[C@@H]3[N+]([C@H](C2)[C@@H]2[C@H]3O2)(C)CCCC)=CC=CC=C1 HOZOZZFCZRXYEK-HNHWXVNLSA-M 0.000 description 1
- 229940076279 serotonin Drugs 0.000 description 1
- 125000005630 sialyl group Chemical group 0.000 description 1
- AWUCVROLDVIAJX-GSVOUGTGSA-N sn-glycerol 3-phosphate Chemical compound OC[C@@H](O)COP(O)(O)=O AWUCVROLDVIAJX-GSVOUGTGSA-N 0.000 description 1
- 235000010288 sodium nitrite Nutrition 0.000 description 1
- 230000003595 spectral effect Effects 0.000 description 1
- 238000010561 standard procedure Methods 0.000 description 1
- 210000000130 stem cell Anatomy 0.000 description 1
- 102000013498 tau Proteins Human genes 0.000 description 1
- 108010026424 tau Proteins Proteins 0.000 description 1
- 108010013645 tetranectin Proteins 0.000 description 1
- MUUHXGOJWVMBDY-UHFFFAOYSA-L tetrazolium blue Chemical compound [Cl-].[Cl-].COC1=CC(C=2C=C(OC)C(=CC=2)[N+]=2N(N=C(N=2)C=2C=CC=CC=2)C=2C=CC=CC=2)=CC=C1[N+]1=NC(C=2C=CC=CC=2)=NN1C1=CC=CC=C1 MUUHXGOJWVMBDY-UHFFFAOYSA-L 0.000 description 1
- MPLHNVLQVRSVEE-UHFFFAOYSA-N texas red Chemical compound [O-]S(=O)(=O)C1=CC(S(Cl)(=O)=O)=CC=C1C(C1=CC=2CCCN3CCCC(C=23)=C1O1)=C2C1=C(CCC1)C3=[N+]1CCCC3=C2 MPLHNVLQVRSVEE-UHFFFAOYSA-N 0.000 description 1
- 230000001225 therapeutic effect Effects 0.000 description 1
- 102000004217 thyroid hormone receptors Human genes 0.000 description 1
- 108090000721 thyroid hormone receptors Proteins 0.000 description 1
- 239000012859 tissue stain Substances 0.000 description 1
- 229950003937 tolonium Drugs 0.000 description 1
- HNONEKILPDHFOL-UHFFFAOYSA-M tolonium chloride Chemical compound [Cl-].C1=C(C)C(N)=CC2=[S+]C3=CC(N(C)C)=CC=C3N=C21 HNONEKILPDHFOL-UHFFFAOYSA-M 0.000 description 1
- 238000012546 transfer Methods 0.000 description 1
- 238000002834 transmittance Methods 0.000 description 1
- 229960000575 trastuzumab Drugs 0.000 description 1
- LENZDBCJOHFCAS-UHFFFAOYSA-N tris Chemical compound OCC(N)(CO)CO LENZDBCJOHFCAS-UHFFFAOYSA-N 0.000 description 1
- 230000005641 tunneling Effects 0.000 description 1
- 239000010981 turquoise Substances 0.000 description 1
- 108010014402 tyrosinase-related protein-1 Proteins 0.000 description 1
- OUYCCCASQSFEME-UHFFFAOYSA-N tyrosine Natural products OC(=O)C(N)CC1=CC=C(O)C=C1 OUYCCCASQSFEME-UHFFFAOYSA-N 0.000 description 1
- ORHBXUUXSCNDEV-UHFFFAOYSA-N umbelliferone Chemical compound C1=CC(=O)OC2=CC(O)=CC=C21 ORHBXUUXSCNDEV-UHFFFAOYSA-N 0.000 description 1
- HFTAFOQKODTIJY-UHFFFAOYSA-N umbelliferone Natural products Cc1cc2C=CC(=O)Oc2cc1OCC=CC(C)(C)O HFTAFOQKODTIJY-UHFFFAOYSA-N 0.000 description 1
- DRTQHJPVMGBUCF-UHFFFAOYSA-N uracil arabinoside Natural products OC1C(O)C(CO)OC1N1C(=O)NC(=O)C=C1 DRTQHJPVMGBUCF-UHFFFAOYSA-N 0.000 description 1
- 229940045145 uridine Drugs 0.000 description 1
- VBEQCZHXXJYVRD-GACYYNSASA-N uroanthelone Chemical compound C([C@@H](C(=O)N[C@H](C(=O)N[C@@H](CS)C(=O)N[C@@H](CC(N)=O)C(=O)N[C@@H](CS)C(=O)N[C@H](C(=O)N[C@@H]([C@@H](C)CC)C(=O)NCC(=O)N[C@@H](CC=1C=CC(O)=CC=1)C(=O)N[C@@H](CO)C(=O)NCC(=O)N[C@@H](CC(O)=O)C(=O)N[C@@H](CCCNC(N)=N)C(=O)N[C@@H](CS)C(=O)N[C@@H](CCC(N)=O)C(=O)N[C@@H]([C@@H](C)O)C(=O)N[C@@H](CCCNC(N)=N)C(=O)N[C@@H](CC(O)=O)C(=O)N[C@@H](CC(C)C)C(=O)N[C@@H](CCCNC(N)=N)C(=O)N[C@@H](CC=1C2=CC=CC=C2NC=1)C(=O)N[C@@H](CC=1C2=CC=CC=C2NC=1)C(=O)N[C@@H](CCC(O)=O)C(=O)N[C@@H](CC(C)C)C(=O)N[C@@H](CCCNC(N)=N)C(O)=O)C(C)C)[C@@H](C)O)NC(=O)[C@H](CO)NC(=O)[C@H](CC(O)=O)NC(=O)[C@H](CC(C)C)NC(=O)[C@H](CO)NC(=O)[C@H](CCC(O)=O)NC(=O)[C@@H](NC(=O)[C@H](CC=1NC=NC=1)NC(=O)[C@H](CCSC)NC(=O)[C@H](CS)NC(=O)[C@@H](NC(=O)CNC(=O)CNC(=O)[C@H](CC(N)=O)NC(=O)[C@H](CC(C)C)NC(=O)[C@H](CS)NC(=O)[C@H](CC=1C=CC(O)=CC=1)NC(=O)CNC(=O)[C@H](CC(O)=O)NC(=O)[C@H](CC=1C=CC(O)=CC=1)NC(=O)[C@H](CO)NC(=O)[C@H](CO)NC(=O)[C@H]1N(CCC1)C(=O)[C@H](CS)NC(=O)CNC(=O)[C@H]1N(CCC1)C(=O)[C@H](CC=1C=CC(O)=CC=1)NC(=O)[C@H](CO)NC(=O)[C@@H](N)CC(N)=O)C(C)C)[C@@H](C)CC)C1=CC=C(O)C=C1 VBEQCZHXXJYVRD-GACYYNSASA-N 0.000 description 1
- 108090000195 villin Proteins 0.000 description 1
- 210000005048 vimentin Anatomy 0.000 description 1
- 238000001429 visible spectrum Methods 0.000 description 1
- 108010047303 von Willebrand Factor Proteins 0.000 description 1
- 102100036537 von Willebrand factor Human genes 0.000 description 1
- 229960001134 von willebrand factor Drugs 0.000 description 1
- HBOMLICNUCNMMY-XLPZGREQSA-N zidovudine Chemical compound O=C1NC(=O)C(C)=CN1[C@@H]1O[C@H](CO)[C@@H](N=[N+]=[N-])C1 HBOMLICNUCNMMY-XLPZGREQSA-N 0.000 description 1
- 229960002555 zidovudine Drugs 0.000 description 1
Images


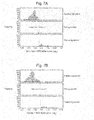


Classifications
-
- G—PHYSICS
- G06—COMPUTING; CALCULATING OR COUNTING
- G06T—IMAGE DATA PROCESSING OR GENERATION, IN GENERAL
- G06T7/00—Image analysis
- G06T7/0002—Inspection of images, e.g. flaw detection
- G06T7/0012—Biomedical image inspection
-
- G—PHYSICS
- G06—COMPUTING; CALCULATING OR COUNTING
- G06T—IMAGE DATA PROCESSING OR GENERATION, IN GENERAL
- G06T7/00—Image analysis
- G06T7/40—Analysis of texture
- G06T7/41—Analysis of texture based on statistical description of texture
- G06T7/44—Analysis of texture based on statistical description of texture using image operators, e.g. filters, edge density metrics or local histograms
-
- G—PHYSICS
- G06—COMPUTING; CALCULATING OR COUNTING
- G06V—IMAGE OR VIDEO RECOGNITION OR UNDERSTANDING
- G06V20/00—Scenes; Scene-specific elements
- G06V20/60—Type of objects
- G06V20/69—Microscopic objects, e.g. biological cells or cellular parts
- G06V20/698—Matching; Classification
-
- G—PHYSICS
- G16—INFORMATION AND COMMUNICATION TECHNOLOGY [ICT] SPECIALLY ADAPTED FOR SPECIFIC APPLICATION FIELDS
- G16B—BIOINFORMATICS, i.e. INFORMATION AND COMMUNICATION TECHNOLOGY [ICT] SPECIALLY ADAPTED FOR GENETIC OR PROTEIN-RELATED DATA PROCESSING IN COMPUTATIONAL MOLECULAR BIOLOGY
- G16B40/00—ICT specially adapted for biostatistics; ICT specially adapted for bioinformatics-related machine learning or data mining, e.g. knowledge discovery or pattern finding
- G16B40/30—Unsupervised data analysis
-
- G—PHYSICS
- G16—INFORMATION AND COMMUNICATION TECHNOLOGY [ICT] SPECIALLY ADAPTED FOR SPECIFIC APPLICATION FIELDS
- G16B—BIOINFORMATICS, i.e. INFORMATION AND COMMUNICATION TECHNOLOGY [ICT] SPECIALLY ADAPTED FOR GENETIC OR PROTEIN-RELATED DATA PROCESSING IN COMPUTATIONAL MOLECULAR BIOLOGY
- G16B45/00—ICT specially adapted for bioinformatics-related data visualisation, e.g. displaying of maps or networks
-
- G—PHYSICS
- G16—INFORMATION AND COMMUNICATION TECHNOLOGY [ICT] SPECIALLY ADAPTED FOR SPECIFIC APPLICATION FIELDS
- G16B—BIOINFORMATICS, i.e. INFORMATION AND COMMUNICATION TECHNOLOGY [ICT] SPECIALLY ADAPTED FOR GENETIC OR PROTEIN-RELATED DATA PROCESSING IN COMPUTATIONAL MOLECULAR BIOLOGY
- G16B5/00—ICT specially adapted for modelling or simulations in systems biology, e.g. gene-regulatory networks, protein interaction networks or metabolic networks
-
- G—PHYSICS
- G06—COMPUTING; CALCULATING OR COUNTING
- G06T—IMAGE DATA PROCESSING OR GENERATION, IN GENERAL
- G06T2207/00—Indexing scheme for image analysis or image enhancement
- G06T2207/30—Subject of image; Context of image processing
- G06T2207/30004—Biomedical image processing
- G06T2207/30024—Cell structures in vitro; Tissue sections in vitro
Definitions
- the present invention relates to the field of automated biomarker expression analysis in tissue samples using algorithms to enhance operator-independent analysis and assay result reproducibility for greater predictive value in diagnostic assays.
- IHC tests have shown clinical utility (e.g., Her2/HercepTest), the value of these tests have recently been shown to be compromised by the site at which the test is performed.
- Two recent studies examining the reproducibility of Her2 testing has shown that there may be as much as 20% error between local and central lab testing (Perez et al. J. Clinic. One. (2006) 24:3032-8; Paik S et al. Benefit from adjuvant trastuzumab may not be confined to patients with IHC 3+ and/or FISH positive tumors: Central testing results from NSABP B-31 (2007) 25:511-22).
- Tissue microarray technology offers the opportunity for high throughput analysis of tissue samples (Konen, J. et al., Nat. Med. 4:844-7 (1998); Kallioniemi, O. P. et al., Hum. Mol. Genet. 10:657-62 (2001); Rimm, D. L. et al., Cancer J. 7:24-31 (2001)).
- tissue microarrays can provide critical information for identifying and validating drug targets and prognostic markers (e.g. estrogen receptor (ER) and HER2/neu), as well as candidate therapeutics.
- prognostic markers e.g. estrogen receptor (ER) and HER2/neu
- the present invention provides for the first time fully automated standardization of in situ biomarker quantification that minimizes lab-to-lab, machine-to-machine, operator-to-operator, and day-to-day staining variations.
- the present invention relates to the reproducible quantification of biomarker expression from tissue samples, whole tissue sections (WTS) as well as tissue microarrays (TMAs), so as to reduce variability between runs or batches due to differences in operators, equipment, facilities, and other factors.
- WTS whole tissue sections
- TMAs tissue microarrays
- the systems and processes described herein provide the automated localization and quantitation of biomarkers with normalization of scores for greater reproducibility between runs, regardless of location, operator or instrument variability.
- One embodiment of the invention relates to a method of reproducibly quantifying biomarker expression in a slide-mounted tissue sample comprising (a) obtaining a slide-mounted tissue sample, which has been stained to permit localization of at least one cellular compartment and at least one biomarker, (b) obtaining one or more pixel-comprised images of the stained tissue sample using a standardized optical system that includes a light source, (c) automatically analyzing one or more data sets derived from the image pixels to differentiate data signal from noise, (d) automatically analyzing one or more data sets derived from the image pixels to differentiate data signal attributable to each of said at least one cellular compartment, (e) optionally automatically analyzing one or more data sets derived from the image pixels to differentiate data signal attributable to said at least one biomarker for each of said at least one cellular compartment, (f) quantifying the amount of biomarker expressed in each of said at least one cellular compartment; whereby the biomarker expression in the slide-mounted tissue sample is quantified reproducibly.
- the standardized optical system includes a light source whose intensity and optical path variability have been normalized.
- the standardized optical system allows for automatic adjustment of exposure time to provide an optimized dynamic range of data captured in the image pixels.
- each automatic analysis step is carried out in an unsupervised manner.
- the data signal attributable to two or more cellular compartments is differentiated.
- the amount of biomarker expressed in each of two or more cellular compartments is quantified.
- the data signal attributable to two or more cellular compartments is differentiated with a confidence interval of about 95%.
- the method further comprises assessing the quality of the one or more slide-mounted tissue samples or the one or more pixel-comprised images or one or more magnified portions thereof.
- the method provides a reproducible cutpoint determination.
- the method provides a greater than 85% concordance for sample classification from one run to another for each sample. In a further embodiment, the method provides a greater than 90% concordance for sample classification from one run to another for each sample.
- the method provides a quantified measure of biomarker expression having a level of reproducibility above 80 percent. In a further embodiment, the method provides a quantified measure of biomarker expression having a level of reproducibility above 90 percent. In a further embodiment, the method provides a quantified measure of biomarker protein expression having a level of reproducibility above 95 percent.
- the method provides a quantified measure of biomarker expression having a level of reproducibility falling in the range of about 90 to about 97 percent.
- the method provides a quantified measure of biomarker expression having a coefficient of variation (% CV) below 20 percent. In a further embodiment, the method provides a quantified measure of biomarker expression having a coefficient of variation (% CV) below 10 percent. In a further embodiment, the method provides a quantified measure of biomarker expression having a coefficient of variation (% CV) below 5 percent. In a further embodiment, the method provides a quantified measure of biomarker expression having a coefficient of variation (% CV) falling in the range of about 4 to about 7 percent.
- the slide-mounted tissue sample has been stained with an optimal dilution of one or more reagents.
- said optimal dilution produces one or more pixel-comprised images having an optimal dynamic range metric.
- the method of the present invention is implemented by a computer.
- the present invention is directed to a computer readable medium comprising the computer readable instructions stored thereon for execution by a processor to perform the method described herein.
- the present invention is directed to an electromagnetic signal carrying computer-readable instructions for implementing the method described herein.
- the invention is also directed to a computer readable medium having computer readable instructions stored thereon for execution by a processor to perform a method of reproducibly quantifying biomarker expression in a slide-mounted tissue sample comprising: (a) acquiring one or more pixel-comprised images of a slide-mounted tissue sample, which has been stained to permit localization of at least one cellular compartment and at least one biomarker using a standardized optical system that includes a light source; (b) automatically analyzing one or more data sets derived from the image pixels to differentiate data signal from noise; (c) automatically analyzing one or more data sets derived from the image pixels to differentiate data signal attributable to each of said at least one cellular compartment; and (d) quantifying the amount of biomarker expressed in each of said at least one cellular compartment, whereby the biomarker expression in the slide-mounted tissue sample is quantified reproducibly.
- the computer readable instructions stored thereon for execution by a processor further comprises instructions to perform a method that includes, prior to said quantifying step, an optional step of automatically analyzing one or more data sets derived from the image pixels to differentiate data signal attributable to said at least one biomarker for each of said at least one cellular compartment.
- a system for reproducibly quantifying biomarker expression in a slide-mounted tissue sample comprising: (a) one or more lenses configured to magnify at least a portion of a slide-mounted tissue sample, which has been stained to permit localization of at least one cellular compartment and at least one biomarker; (b) a standardized optical system, including a light source and an image sensor in optical communication with said one or more lenses, the standardized optical system obtaining one or more pixel-comprised images of the stained tissue sample; (c) a processor module in communications with the standardized optical system, the processor module configured to: (i) automatically analyze one or more data sets derived from the image pixels to differentiate data signal from noise, (ii) automatically analyze one or more data sets derived from the image pixels to differentiate data signal attributable to each of said at least one cellular compartment, and (iii) quantify the amount of biomarker expressed in each of said at least one cellular compartment, whereby the biomarker expression in the slide-mounted tissue sample is quantified reproducibly
- the processor module is further configured to optionally automatically analyze one or more data sets derived from the image pixels to differentiate data signal attributable to said at least one biomarker for each of said at least one cellular compartment. Such analysis is preferably performed prior to the quantification step (iii).
- FIG. 1 shows an embodiment of a process for reproducibly quantifying an amount of a biomarker expressed in each of one or more cellular components of a slide-mounted biological sample containing cells, such as a tissue sample from a patient.
- FIG. 2 shows an embodiment of a process for image processing steps to reproducibly quantifying an amount of a biomarker expressed in each of one or more cellular components of a slide-mounted biological sample containing cells.
- FIG. 3 is a box plot of Log 2 -transformed HER2 AQUA® scores (y-axis) categorized by traditional IHC scoring (x-axis) for 543 cases with both AQUA® and IHC scoring information.
- One-way ANOVA analysis for comparison of means across all categories was significant (P ⁇ 0.001).
- Post-hoc analysis using Tamhane's T2 statistic for multiple comparisons shows significant differences between each category (all P-values ⁇ 0.05).
- FIGS. 4A-C show box plots comparing normalized Log 2 -transformed HER2 AQUA® scores across instruments (A), operators (B), and staining runs (C) for 583 cases with indicated averaged % CV for all cases.
- FIGS. 6A-F show 2 ⁇ 2 contingency tables comparing positive (POS) v. negative (NEG) population segregation based on X-tile cut-points generated for the reference (e.g., Instrument 1 ) for each indicated instrument set (A, B), operator set (C, D), and run set (E, F). Also shown are overall concordance, positive agreement, and negative agreement rates with 95% confidence intervals.
- POS positive
- NEG negative
- FIGS. 7A-C are frequency distributions separated into negative agreement, positive agreement, and non-agreement cases for (A) instrument 2 (AQUA® scores) to instrument 1 (cut-point); (B) operator 2 (AQUA® scores) to operator 1 (cut-point); and (C) run 2 (AQUA® scores) to run 1 (cut-point) to demonstrate where disagreement occurs within the population of breast cancer cases. Cases which disagree reside in and around the indicated cut-points and do not span over the entire distribution.
- FIGS. 8A-D illustrate the analytical performance of AQUA® analysis and EGFR assay.
- A Box plot of log(2) transformed AQUA® scores of HER2 for 748 cases across 3 staining days (D), machines (M), and operators (O) with indicated % CV.
- C Box plot of log 2 transformed AQUA® scores of EGFR for 40 tumors from (B) with indicated % CV.
- D Box plot of log 2 transformed AQUA® scores of EGFR for 35 cell lines (2 ⁇ redundant) from (B) with indicated % CV.
- FIGS. 9A-D show the results from Example 4, below.
- FIGS. 9A-C are box plots of the Allred score from three pathologists compared to the AQUA® score generated for the same samples.
- FIG. 9D is a table showing the correlation between the Allred and AQUA® scoring for each pathologist.
- FIGS. 10A-B show the (A) clustering of patients based on AQUA® scores and (B) survival of the clustered groups, as described in Example 4.
- FIGS. 11A-B compare the five year disease specific survival using the Allred scoring (A) and AQUA® scoring (B).
- FIGS. 12A-B illustrates the comparison of ER expression scores determined by 3 pathologists reading the same TMA slide using the Allred score method (A) and the comparison of ER expression AQUA scores determined by 3 PM-2000 instruments reading the same TMA slide (B).
- FIG. 1 shows a process for reproducibly quantifying an amount of a biomarker expressed in each of one or more cellular components of a slide-mounted biological sample containing cells, such as a tissue sample from a patient.
- the process 100 is initiated by obtaining a stained, slide-mounted biological sample containing cells 105 , in which the stain has been applied in a manner to permit localization of at least one cellular compartment and at least one biomarker.
- the at least one cellular compartment includes, but is not limited to, a cytoplasm, a nucleus, and a cell wall.
- the at least one biomarker may include a biomarker labeled or detected via a CY5 fluorescent signal, used to detect a tumor cell. Examples include but are not limited to HER2, ER, PR, EGFR, ERCC1, TS and the like.
- the process 100 continues by obtaining a pixel-comprised image or set of images of the stained tissue sample 110 .
- the pixel-comprised image or set of images may be taken using a standardized optical system, such as an optical microscope system, that includes a light source.
- the pixel-comprised image may be obtained through the standardized optical system using a digital image sensor, such as a digital camera.
- the digital image may be taken by an analogue camera, whereby the resulting analogue image or film is digitized by a digital scanner or equivalent means.
- the camera may be mounted directly or indirectly to a microscope to obtain a pixel-comprised image in the form of a micrograph.
- the camera may rely on a direct connection to a video out line on an existing imaging system.
- the light source includes light with wavelengths in one or more of the visible spectrum, the infrared (IR) spectrum, and the ultraviolet (UV) spectrum.
- the camera may be a video camera or a time-lapse photographic sequence, providing real-time and elapsed time images that contain dynamic cellular activity.
- the pixel-comprised image obtained by the process 100 is then analyzed to derive one or more data sets from the image pixels to differentiate a data signal from noise 115 .
- This analysis can be performed automatically, for example, using a processor.
- the processor may include one or more computer processors, controllable according to a preprogrammed instruction set.
- differentiating a data signal from noise includes a statistical analysis of the signal, for example an unsupervised cluster analysis resulting in segregation of pixels with signal from pixels having signal attributable to noise.
- differentiating a data signal from noise may include subtracting a focused image of the slide-mounted tissue sample from a defocused image of the slide-mounted tissue sample.
- the defocused image may include an image focused just below the slide-mounted tissue sample. In general, defocusing an image acts like a spatial low pass filter, allowing for a background measurement to which the data signal may be compared.
- the pixel-comprised image obtained by the process 100 is analyzed to derive one or more data sets from the image pixels to differentiate data signals attributable to each of at least one cellular compartment 120 .
- This analysis can also be performed automatically, for example, using a preprogrammed computer or a dedicated special purpose processor.
- differentiation may depend on a fluorescence attributable to a marker or stain applied to the slide-mounted sample.
- the fluorescence of stains directed to the at least one cellular compartment varies in wavelength.
- a blue fluorescence may be associated with a nucleus receptor (DAPI)
- a green fluorescence may be associated with a cell cytoplasm receptor (cytokeratin)
- a red fluorescence may be associated with a cell membrane receptor (alpha-catenin).
- the stain is applied in a manner to permit localization of at least one cellular compartment and at least one biomarker.
- the at least one biomarker previously described in 105 , is used to detect a tumor cell or a target protein or a target antigen and may be an indication of a tumor cell in the slide-mounted tissue sample.
- the process 100 includes a step to associate or otherwise to correlate the previously differentiated data signals attributable to each of at least one cellular compartments 120 with the detected tumor cell or tumor mask. In doing so, the one or more data sets derived from the image pixels are automatically analyzed to differentiate a data signal attributable to at least one biomarker for each of the at least one cellular compartment 125 .
- the process 100 reproducibly quantifies the amount of biomarker expressed in at least one of the at least one cellular compartment for the slide-mounted tissue sample 130 .
- FIG. 2 shows a detailed process 200 for image processing steps to reproducibly quantifying an amount of a biomarker expressed in each of one or more cellular components of a slide-mounted sample.
- the process 200 is initiated by obtaining a digital image of a stained tissue sample 205 .
- the digital image is obtained in a manner similar to that described in steps 105 , 110 in method 100 .
- the process 200 directs the image quality to be tested for signal integrity 210 , sample integrity 215 , and image integrity 220 .
- the digital image may be removed from analysis or may be flagged for a manual review of the digital image by the operator 225 to either accept the digital image for analysis or to remove the digital image from analysis 226 .
- signal integrity includes a cellular compartmentalization, a fluorescence intensity, and a saturated pixel percentage assessment. Saturation may be assessed by determining that a predetermined number of pixels in the pixel-comprised image are represented by data and data structures that include a maximum or near maximum value.
- Sample integrity includes a determination that a sufficient sample of interest (e.g., tumor tissue) is present for analysis.
- Image integrity includes, for example, a detection of any out of focus images, and in the case of TMAs, analysis and detection of any split images.
- any cell containing sample may be analyzed by the methods of the present invention.
- the sample may be prepared from tissues collected from patients.
- the sample may be a cell containing biological sample such as a blood sample, bone marrow sample, or a cell line.
- the samples may be whole-tissue or TMA sections on microscope slides.
- tissue microrarrays TMAs
- samples may be arranged as “spots” or “histospots” on a slide, with each histopot corresponding to a particular sample.
- TMAs tissue microrarrays
- a biomarker is a molecule that may be measured in a biological sample as an indicator of tissue type, normal or pathogenic processes or a response to a therapeutic intervention.
- the biomarker is selected from the group consisting of: a protein, a peptide, a nucleic acid, a lipid and a carbohydrate. More particularly, the biomarker may be a protein. Certain markers are characteristic of particular cells, while other markers have been identified as being associated with a particular disease or condition. Examples of known prognostic markers include enzymatic markers such as, for example, galactosyl transferase II, neuron specific enolase, proton ATPase-2, and acid phosphatase.
- Hormone or hormone receptor markers include human chorionic gonadotropin (HCG), adrenocorticotropic hormone, carcinoembryonic antigen (CEA), prostate-specific antigen (PSA), estrogen receptor, progesterone receptor, androgen receptor, gC1q-R/p33 complement receptor, IL-2 receptor, p75 neurotrophin receptor, PTH receptor, thyroid hormone receptor, and insulin receptor.
- HCG human chorionic gonadotropin
- CEA carcinoembryonic antigen
- PSA prostate-specific antigen
- estrogen receptor progesterone receptor
- androgen receptor gC1q-R/p33 complement receptor
- IL-2 receptor p75 neurotrophin receptor
- PTH receptor thyroid hormone receptor
- insulin receptor insulin receptor
- Lymphoid markers include alpha-1-antichymotrypsin, alpha-1-antitrypsin, B cell marker, bcl-2, bcl-6, B lymphocyte antigen 36 kD, BM1 (myeloid marker), BM2 (myeloid marker), galectin-3, granzyme B, HLA class I Antigen, HLA class II (DP) antigen, HLA class II (DQ) antigen, HLA class II (DR) antigen, human neutrophil defensins, immunoglobulin A, immunoglobulin D, immunoglobulin G, immunoglobulin M, kappa light chain, kappa light chain, lambda light chain, lymphocyte/histocyte antigen, macrophage marker, muramidase (lysozyme), p80 anaplastic lymphoma kinase, plasma cell marker, secretory leukocyte protease inhibitor, T cell antigen receptor (JOVI 1), T cell antigen receptor (JOVI 3), terminal
- Tumor markers include alpha fetoprotein, apolipoprotein D, BAG-1 (RAP46 protein), CA19-9 (sialyl lewisa), CA50 (carcinoma associated mucin antigen), CA125 (ovarian cancer antigen), CA242 (tumour associated mucin antigen), chromogranin A, clusterin (apolipoprotein J), epithelial membrane antigen, epithelial-related antigen, epithelial specific antigen, epidermal growth factor receptor, estrogen receptor (ER), gross cystic disease fluid protein-15, hepatocyte specific antigen, HER2, heregulin, human gastric mucin, human milk fat globule, MAGE-1, matrix metalloproteinases, melan A, melanoma marker (HMB45), mesothelin, metallothionein, microphthalmia transcription factor (MITF), Muc-1 core glycoprotein.
- HMB45 melanoma marker
- MITF microphthalmia transcription factor
- Cell cycle associated markers include apoptosis protease activating factor-1, bcl-w, bcl-x, bromodeoxyuridine, CAK (cdk-activating kinase), cellular apoptosis susceptibility protein (CAS), caspase 2, caspase 8, CPP32 (caspase-3), CPP32 (caspase-3), cyclin dependent kinases, cyclin A, cyclin B1, cyclin D1, cyclin D2, cyclin D3, cyclin E, cyclin G, DNA fragmentation factor (N-terminus), Fas (CD95), Fas-associated death domain protein, Fas ligand, Fen-1, IPO-38, Mc1-1, minichromosome maintenance proteins, mismatch repair protein (MSH2), poly (ADP-Ribose) polymerase, proliferating cell nuclear antigen, p16 protein, p27 protein, p34cdc2, p57 protein (Kip2), p105
- Neural tissue and tumour markers include alpha B crystallin, alpha-internexin, alpha synuclein, amyloid precursor protein, beta amyloid, calbindin, choline acetyltransferase, excitatory amino acid transporter 1, GAP43, glial fibrillary acidic protein, glutamate receptor 2, myelin basic protein, nerve growth factor receptor (gp75), neuroblastoma marker, neurofilament 68 kD, neurofilament 160 kD, neurofilament 200 kD, neuron specific enolase, nicotinic acetylcholine receptor alpha4, nicotinic acetylcholine receptor beta2, peripherin, protein gene product 9, S-100 protein, serotonin, SNAP-25, synapsin I, synaptophysin, tau, tryptophan hydroxylase, tyrosine hydroxylase, ubiquitin.
- Cluster differentiation markers include CD1a, CD1b, CD1c, CD1d, CD1e, CD2, CD3delta, CD3epsilon, CD3gamma, CD4, CD5, CD6, CD7, CD8alpha, CD8beta, CD9, CD10, CD11a, CD11b, CD11c, CDw12, CD13, CD14, CD15, CD15s, CD16a, CD16b, CDw17, CD18, CD19, CD20, CD21, CD22, CD23, CD24, CD25, CD26, CD27, CD28, CD29, CD30, CD31, CD32, CD33, CD34, CD35, CD36, CD37, CD38, CD39, CD40, CD41, CD42a, CD42b, CD42c, CD42d, CD43, CD44, CD44R, CD45, CD46, CD47, CD48, CD49a, CD49b, CD49c, CD49d, CD49e, CD49f, CD50, CD51, CD52
- centromere protein-F CENP-F
- giantin involucrin
- LAP-70 LAP-70
- mucin nuclear pore complex proteins
- p180 lamellar body protein ran, r
- cathepsin D Ps2 protein
- Her2-neu P53
- S100 epithelial marker antigen
- EMA epithelial marker antigen
- Cell containing samples may be stained using any reagent or biomarker label, such as dyes or stains, histochemicals, or immunohistochemicals that directly react with the specific biomarkers or with various types of cells or cellular compartments. Not all stains/reagents are compatible. Therefore the type of stains employed and their sequence of application should be well considered, but can be readily determined by one of skill in the art.
- Histochemicals may be chromophores detectable by transmittance microscopy or fluorophores detectable by fluorescence microscopy.
- cell containing samples may be incubated with a solution comprising at least one histochemical, which will directly react with or bind to chemical groups of the target.
- a cell containing sample may be incubated with a mixture of at least one histochemical that stains a component of interest and another histochemical that acts as a counterstain and binds a region outside the component of interest.
- mixtures of multiple probes may be used in the staining, and provide a way to identify the positions of specific probes. Procedures for staining cell containing samples are well known in the art.
- chromophores that may be used as histological imaging agents (stains or counterstains) and their target cells, cellular compartments, or cellular components: Eosin (alkaline cellular components, cytoplasm), Hematoxylin (nucleic acids), Orange G (red blood, pancreas, and pituitary cells), Light Green SF (collagen), Romanowsky-Giemsa (overall cell morphology), May-Grunwald (blood cells), Blue Counterstain (Trevigen), Ethyl Green (CAS) (amyloid), Feulgen-Naphthol Yellow S (DNA), Giemsa (differentially stains various cellular compartments), Methyl Green (amyloid), pyronin (nucleic acids), Naphthol-Yellow (red blood cells), Neutral Red (nuclei), Papanicolaou stain (which typically includes a mixture of Hematoxylin, Eosin Y, Orange
- DAPI 4′,6-diamidino-2-phenylindole
- Eosin alkaline cellular components, cytoplasm
- Hoechst 33258 and Hoechst 33342 two bisbenzimides
- Propidium Iodide N-phenylindole
- Spectrum Orange N-phenylindole
- Green N-phenylindole
- Quinacrine N-phenylindole
- Fluorescein-phalloidin actin fibers
- Chromomycin A 3 nucleic acids
- Acriflavine-Feulgen reaction nucleic acid
- Auramine O-Feulgen reaction Ethidium Bromide (nucleic acids).
- Nissl stains neutralized DNA fluorophores
- high affinity DNA fluorophores such as POPO, BOBO, YOYO and TOTO and others
- Green Fluorescent Protein fused to DNA binding protein such as histones, ACMA, Quinacrine and Acridine Orange.
- a wide variety of proprietary fluorescent organelle-specific probes are commercially available, and include mitochondria-specific probes (MitoFluor and MitoTracker dyes), endoplasmic reticulum (ER) and Golgi probes (ER-Tracker and various ceramide conjugates), and lysosomal probes (LysoTracker dyes). These probes, as well as many nonproprietary fluorescent histochemicals, are available from and extensively described in the Handbook of Fluorescent Probes and Research Products 8 th Ed. (2001), available from Molecular Probes, Eugene, Oreg.
- Each cell containing sample may be co-incubated with appropriate substrates for an enzyme that is a cellular component of interest and appropriate reagents that yield colored precipitates at the sites of enzyme activity.
- enzyme histochemical stains are specific for the particular target enzyme. Staining with enzyme histochemical stains may be used to define a cellular component or a particular type of cell. Alternatively, enzyme histochemical stains may be used diagnostically to quantitate the amount of enzyme activity in cells.
- enzyme histochemical stains may be used diagnostically to quantitate the amount of enzyme activity in cells.
- Acid phosphatases may be detected through several methods.
- Gomori method for acid phosphatase a cell preparation is incubated with glycerophosphate and lead nitrate. The enzyme liberates phosphate, which combines with lead to produce lead phosphate, a colorless precipitate. The tissue is then immersed in a solution of ammonium sulfide, which reacts with lead phosphate to form lead sulfide, a black precipitate.
- cells may be incubated with a solution comprising pararosanilin-HCl, sodium nitrite, napthol ASB1 phosphate (substrate), and veronal acetate buffer. This method produces a red precipitate in the areas of acid phosphatase activity. Owing to their characteristic content of acid phosphatase, lysosomes can be distinguished from other cytoplasmic granules and organelles through the use of this assay.
- Dehydrogenases may be localized by incubating cells with an appropriate substrate for the species of dehydrogenase and tetrazole.
- the enzyme transfers hydrogen ions from the substrate to tetrazole, reducing tetrazole to formazan, a dark precipitate.
- NADH dehydrogenase is a component of complex I of the respiratory chain and is localized predominantly to the mitochondria.
- ATPases muscle fibers
- succinate dehydrogenases mitochondrial dehydrogenases
- mitochondriachrome c oxidases mitochondrial dehydrogenases
- phosphorylases mitochondrial dehydrogenases
- phosphofructokinases mitochondrial cholinesterases
- acetyl cholinesterases nerve cells
- lactases small intestine
- leucine aminopeptidases liver cells
- myodenylate deaminases muscle cells
- NADH diaphorases erythrocytes
- sucrases small intestine
- Immunohistochemistry is among the most sensitive and specific histochemical techniques.
- Each sample t may be combined with a labeled binding composition comprising a specifically binding probe.
- Various labels may be employed, such as fluorophores, or enzymes that produce a product that absorbs light or fluoresces.
- a wide variety of labels are known that provide for strong signals in relation to a single binding event.
- Multiple probes used in the staining may be labeled with more than one distinguishable fluorescent label. These color differences provide a way to identify the positions of specific probes.
- the method of preparing conjugates of fluorophores and proteins, such as antibodies, is extensively described in the literature and does not require exemplification here.
- exemplary primary antibodies which are known to specifically bind cellular components and are presently employed as components in immunohistochemical stains used for research and, in limited cases, for diagnosis of various diseases, include, for example, anti-estrogen receptor antibody (breast cancer), anti-progesterone receptor antibody (breast cancer), anti-p53 antibody (multiple cancers), anti-Her-2/neu antibody (multiple cancers), anti-EGFR antibody (epidermal growth factor, multiple cancers), anti-cathepsin D antibody (breast and other cancers), anti-Bcl-2 antibody (apoptotic cells), anti-E-cadherin antibody, anti-CA125 antibody (ovarian and other cancers), anti-CA15-3 antibody (breast cancer), anti-CA19-9 antibody (colon cancer), anti-c-erbB-2 antibody, anti-P-glycoprotein antibody (MDR, multi-drug resistance), anti-CEA antibody (carcinoembryonic antigen),
- MDR multi-drug resistance
- anti-Cardiotin (R2G) antibody anti-Cathepsin D antibody; Chicken polyclonal antibody to Galactosidase alpha; anti-c-Met antibody; anti-CREB antibody; anti-COX6C antibody; anti-Cyclin D1 Ab-4 antibody; anti-Cytokeratin antibody; anti-Desmin antibody; anti-DHP (1-6 Diphenyl-1,3,5-Hexatriene) antibody; DSB-X Biotin Goat Anti Chicken antibody; anti-E-Cadherin antibody; anti-EEA1 antibody; anti-EGFR antibody; anti-EMA (Epithelial Membrane Antigen) antibody; anti-ER (Estrogen Receptor) antibody; anti-ERB3 antibody; anti-ERCC1 ERK (Pan ERK) antibody; anti-E-Selectin antibody; anti-FAK antibody; anti-Fibronectin antibody; FITC-Goat Anti Mouse IgM antibody; anti-FOXP3 antibody
- Fluorophores that may be conjugated to a primary antibody include but are not limited to Fluorescein, Rhodamine, Texas Red, Cy2, Cy3, Cy5, VECTOR Red, ELFTM (Enzyme-Labeled Fluorescence), Cy0, Cy0.5, Cy1, Cy1.5, Cy3, Cy3.5, Cy5, Cy7, Fluor X, Calcein, Calcein-AM, CRYPTOFLUORTM'S, Orange (42 kDa), Tangerine (35 kDa), Gold (31 kDa), Red (42 kDa), Crimson (40 kDa), BHMP, BHDMAP, Br-Oregon, Lucifer Yellow, Alexa dye family, N-[6-(7-nitrobenz-2-oxa-1,3-diazol-4-yl)-amino]caproyl] (NBD), BODIPYTM, boron dipyrromethene difluoride, Oregon Green, MITOTRACKERTM Red, DiOC 7 (3), DiIC 18
- Further amplification of the signal can be achieved by using combinations of specific binding members, such as antibodies and anti-antibodies, where the anti-antibodies bind to a conserved region of the target antibody probe, particularly where the antibodies are from different species.
- specific binding ligand-receptor pairs such as biotin-streptavidin, may be used, where the primary antibody is conjugated to one member of the pair and the other member is labeled with a detectable probe.
- the first binding member binds to the cellular component and serves to provide for secondary binding, where the secondary binding member may or may not include a label, which may further provide for tertiary binding where the tertiary binding member will provide a label.
- the secondary antibody, avidin, strepavidin or biotin are each independently labeled with a detectable moiety, which can be an enzyme directing a colorimetric reaction of a substrate having a substantially non-soluble color reaction product, a fluorescent dye (stain), a luminescent dye or a non-fluorescent dye. Examples concerning each of these options are listed below.
- any enzyme that (i) can be conjugated to or bind indirectly to (e.g., via conjugated avidin, strepavidin, biotin, secondary antibody) a primary antibody, and (ii) uses a soluble substrate to provide an insoluble product (precipitate) could be used.
- the enzyme employed can be, for example, alkaline phosphatase, horseradish peroxidase, beta-galactosidase and/or glucose oxidase; and the substrate can respectively be an alkaline phosphatase, horseradish peroxidase, beta.-galactosidase or glucose oxidase substrate.
- Alkaline phosphatase (AP) substrates include, but are not limited to, AP-Blue substrate (blue precipitate, Zymed catalog p. 61); AP-Orange substrate (orange, precipitate, Zymed), AP-Red substrate (red, red precipitate, Zymed), 5-bromo, 4-chloro, 3-indolyphosphate (BCIP substrate, turquoise precipitate), 5-bromo, 4-chloro, 3-indolyl phosphate/nitroblue tetrazolium/iodonitrotetrazolium (BCIP/INT substrate, yellow-brown precipitate, Biomeda), 5-bromo, 4-chloro, 3-indolyphosphate/nitroblue tetrazolium (BCIP/NBT substrate, blue/purple), 5-bromo, 4-chloro, 3-indolyl phosphate/nitroblue tetrazolium/iodonitrotetrazolium (BCIP/NBT/INT, brown precipitate, DAKO, Fast
- Horseradish Peroxidase (HRP, sometimes abbreviated PO) substrates include, but are not limited to, 2,2′ Azino-di-3-ethylbenz-thiazoline sulfonate (ABTS, green, water soluble), aminoethyl carbazole, 3-amino, 9-ethylcarbazole AEC (3A9EC, red).
- ABTS 2,2′ Azino-di-3-ethylbenz-thiazoline sulfonate
- aminoethyl carbazole aminoethyl carbazole
- 3-amino 9-ethylcarbazole AEC (3A9EC, red).
- Alpha-naphthol pyronin (red), 4-chloro-1-naphthol (4C1N, blue, blue-black), 3,3′-diaminobenzidine tetrahydrochloride (DAB, brown), ortho-dianisidine (green), o-phenylene diamine (OPD, brown, water soluble), TACS Blue (blue), TACS Red (red), 3,3′,5,5′Tetramethylbenzidine (TMB, green or green/blue), TRUE BLUETM (blue), VECTORTM VIP (purple), VECTORTM SG (smoky blue-gray), and Zymed Blue HRP substrate (vivid blue).
- Glucose oxidase (GO) substrates include, but are not limited to, nitroblue tetrazolium (NBT, purple precipitate), tetranitroblue tetrazolium (TNBT, black precipitate), 2-(4-iodophenyl)-5-(4-nitorphenyl)-3-phenyltetrazolium chloride (INT, red or orange precipitate), Tetrazolium blue (blue), Nitrotetrazolium violet (violet), and 3-(4,5-dimethylthiazol-2-yl)-2,5-diphenyltetrazolium bromide (MTT, purple). All tetrazolium substrates require glucose as a co-substrate. The glucose gets oxidized and the tetrazolium salt gets reduced and forms an insoluble formazan that forms the color precipitate.
- Beta-galactosidase substrates include, but are not limited to, 5-bromo-4-chloro-3-indoyl beta-D-galactopyranoside (X-gal, blue precipitate).
- X-gal 5-bromo-4-chloro-3-indoyl beta-D-galactopyranoside
- the precipitates associated with each of the substrates listed have unique detectable spectral signatures (components).
- the enzyme can also be directed at catalyzing a luminescence reaction of a substrate, such as, but not limited to, luciferase and aequorin, having a substantially non-soluble reaction product capable of luminescencing or of directing a second reaction of a second substrate, such as but not limited to, luciferine and ATP or coelenterazine and Ca. 2+ , having a luminescencing product.
- a substrate such as, but not limited to, luciferase and aequorin
- a substantially non-soluble reaction product capable of luminescencing capable of luminescencing
- a second reaction of a second substrate such as but not limited to, luciferine and ATP or coelenterazine and Ca. 2+ , having a luminescencing product.
- Nucleic acid biomarkers may be detected using in-situ hybridization (ISH).
- a nucleic acid sequence probe is synthesized and labeled with either a fluorescent probe or one member of a ligand:receptor pair, such as biotin/avidin, labeled with a detectable moiety. Exemplary probes and moieties are described in the preceding section.
- the sequence probe is complementary to a target nucleotide sequence in the cell. Each cell or cellular compartment containing the target nucleotide sequence may bind the labeled probe.
- Probes used in the analysis may be either DNA or RNA oligonucleotides or polynucleotides and may contain not only naturally occurring nucleotides but their analogs such as dioxygenin dCTP, biotin dcTP 7-azaguanosine, azidothymidine, inosine, or uridine.
- Other useful probes include peptide probes and analogues thereof, branched gene DNA, peptidomimetics, peptide nucleic acids, and/or antibodies. Probes should have sufficient complementarity to the target nucleic acid sequence of interest so that stable and specific binding occurs between the target nucleic acid sequence and the probe. The degree of homology required for stable hybridization varies with the stringency of the hybridization.
- the optimal dilution of a reagent used in the present assays may be quantitatively and automatically determined.
- multiple dilution sets are imaged, where each of the dilution sets consist of a different respective dilution value and a respective arrangement of immunoassay staining intensity values.
- a respective dynamic range metric is determined for each of the multiple dilution sets relative to the respective arrangement of immunoassay staining intensity values.
- a dilution set having the numerically optimal dynamic range metric is selected and the dilution value of that dilution set is selected as being representative of an optimal dilution level of the reagent for use in the present invention.
- a slide-mounted tissue sample is stained with one of the dilution series of the primary antibody utilizing common immunohistochemistry techniques described above.
- the resulting stained specimens are each imaged using a system for viewing the detectable signal and acquiring an image, such as a digital image of the staining. Methods for image acquisition are described in more detail below.
- the images thus obtained are then used by the method of the invention for quantitatively determining the optimal concentration of the reagent for use in the present invention.
- Each tissue sample set includes a multiple different tissue samples prepared with respective titer dilution, such that different tissue sample sets have different respective titer dilutions.
- a quantitative analysis is performed of the pixelized images of the multiple tissue sample sets.
- a dynamic range metric and a specificity of staining are each calculated.
- the dynamic range metric is an average absolute deviation.
- the data is log transformed, and the dynamic range metric is a weighted combination of a standard deviation, a variance, and a swing ratio. The specificity of staining is calculated to maximize specific signal while minimizing noise.
- the specificity of staining may be computed by summing each of a set of immunoassay staining intensity values associated with a stain-specific compartment and then computing a stain specific average for the stain-specific compartment, and also summing each of a set of immunoassay staining intensity values associated with a non-stain specific compartment and then computing a non-stain-specific average.
- the stain specific average can be divided by the non-stain specific average to produce the specificity of staining, or a Signal to Noise Metric. In such an embodiment, a numerically large sensitivity of staining value is optimal.
- the non-stain specific average is divided by the stain specific average to produce the sensitivity of staining.
- a numerically small sensitivity of staining value is optimal.
- the dynamic range metric and sensitivity of staining can be combined with one another to generate a combination value for each dilution set.
- the resulting combination values are used to select the dilution set with the most numerically optimal combination value.
- a dilution value representative of an optimal dilution of a reagent is associated with the selected dilution set.
- the process performs multiple comparisons to attempt to identify multiple stain specific and non-stain specific compartments.
- any optical or non-optical imaging device can be used to detect the stain or biomarker label, such as, for example, upright or inverted optical microscopes, scanning confocal microscopes, cameras, scanning or tunneling electron microscopes, scanning probe microscopes, and imaging infrared detectors etc.
- the imaging device is a microscope system that includes an illumination source configured to illuminate a target sample, optics configured to produce a magnified image of the illuminated target sample, and a detector, such as a digital camera, configured to capture a digital image of the magnified image.
- Quantitative results can be obtained through manipulation of the captured digital images.
- image manipulation can include image processing techniques known to those skilled in the art.
- one or more of such image capture and image manipulation is accomplished with the aid of a processor.
- the processor can include a computer implementing pre-programmed instructions.
- a tissue sample or tissue microarray can be imaged as follows: a user places the microarray on a sample stage. The user adjusts the sample stage so that the first region of interest or first histospot is at the center of the field of view and focused on by the CCD camera.
- the objective lens should be adjusted to the appropriate resolution, for example, a 0.6 millimeter sample can be viewed at 10 ⁇ magnification.
- the sample generally correspond to areas of higher light intensity than the surrounding paraffin, as assessed through various means including signals derived from the visible light scattering of stained tissues, tissue autofluorescence or from a fluorescent tag.
- a computer can acquire a low-resolution image (e.g.
- a computer automatically translates sample stage by an amount approximately equal to a field of view. The computer then acquires a second low-resolution image. This process is repeated until the computer has acquired images of the entire tissue sample or microarray. Using commercially available software, the computer then generates a composite image of the entire tissue sample or microarray.
- a system intrinsic factor can be determined to account for intensity variability of the excitation source and device variability, e.g., along the optical path.
- a measurement of the intensity of the excitation light source may also be obtained for example by using an inline lamp intensity measuring tool.
- a measurement of a standard or a calibration sample, e.g, a calibration microscope slide may be obtained using the particular system to define one or more optical path factors.
- Use of such a calibration slide is particularly useful for fluorescence-based IHC applications, in which sample fluorescent regions of the calibration slide emit radiation within respective bandwidths. The fluoresced emissions allow for characterization of an optical path at each of the one or more respective wavelengths. These measurement can be obtained simultaneously or separately.
- the system also optionally includes a calibration device configured to redirect a standardized sample of the illumination source to the detector, although it has been found that the methods of the present invention do not require the use of such device.
- a system processor is configured to determine a correction factor for a given microscope.
- the correction factor can be determined from a measurement of the standardized sample of the illumination source obtained using the calibration device.
- the correction factor can be used (e.g., by the processor) to correct for any variations in intensity of a detected image of the target sample.
- a calibration cube factor CC
- a light source factor is determined by summing the pixel intensities of a captured image of the calibration surface.
- the optical path factor (OP) is the quotient of the average total light intensity of 16 images taken for each cube/sample combination.
- the CC and OP factors are intrinsic to the specific hardware system being studied and need only be calculated once or at an interval where one would suspect some type of modification in the optics has occurred.
- Standardized AQUA® score Raw AQUA® score*CC factor*LS factor*OP factor
- a system processor is configured with instructions (e.g., software) for obtaining the calibration factor.
- the system processor is configured with instructions for using the correction factor to correct detected images.
- Such calibration is useful to reduce variability in intensity of the illumination source within the same microscope system, as may occur over time, and between quantitative results obtained using different microscope systems and/or different illumination sources.
- the dynamic range of pixel intensity data from the collected image may be optionally optimized to further reduce run-to-run variations, especially due to staining intensity and equipment differences that affect exposure times.
- the process includes capturing an image of a subject within the field of view of a camera at a first exposure time, resulting in a captured image comprising a predetermined number of pixels, wherein each pixel has an intensity value.
- a frequency distribution of pixel intensities of the captured image is queried to determine a region of the greatest frequency occurrence of the pixel intensities of the frequency distribution.
- Exposure time is then adjusted from the first exposure time to shift that region of highest frequency distribution toward the middle of the range of intensity values.
- the center of mass (COM) of a histogram, or frequency distribution is determined from which an adjusted exposure time is calculated to achieve an optimized dynamic range of pixel intensities.
- a second image of the subject can then be captured at the adjusted exposure time resulting in an image having an optimal dynamic range.
- One correction technique is to iteratively acquire a new image at a longer or shorter exposure time than that of the previous image until saturated pixels are minimized and the optimal dynamic range is achieved. This iterative process allows for a quick adjustment in exposure time to bring the pixel intensities down within the range of detection to optimize exposure and dynamic range. However this simplistic approach may also cause the system to overcorrect for saturated pixels and set the new exposure time too low. Therefore it is desirable to modify the aggressiveness of the correction to the exposure time to be proportional to how many pixels are saturated in the previous image.
- E is the new exposure time
- E′ is the currently set exposure time
- A is an aggression level
- SL is the saturation limit
- CCD x and CCD y represent the pixel dimensions of the captured image
- P is the count of pixels at maximum intensity.
- the aggression level, A may vary but, generally, the values that one would want to choose would depend upon the amount by which images tend to be over saturated.
- a value of zero (0) for A represents a minimum value for which the exposure time would be halved.
- a practical maximum value for A is about 10, after which the exposure time will not change enough for the algorithm to be useful.
- the value for A can fall in the range of about 0 ⁇ A ⁇ 4.5. More preferably, A is set at about 3.5.
- the procedure of reducing exposure time to ensure the image is not overexposed is typically a multi-step process.
- a 256 bin histogram is generated first for an 8-bit per pixel image obtained from the camera at the current exposure time, E′. The number of saturated pixels are identified and compared to a predetermined saturation threshold value. Then, if the image is at or below the saturation limit, the over-exposure procedure is exited. However, if the image is over exposed, the exposure time is decreased. The new, decreased exposure time can vary based upon the number of currently over exposed pixels.
- a value S can be determined as
- E ⁇ E′ ⁇ 0.5E′ e.g., the exposure time would be halved.
- the minimum amount of change to the current exposure time occurs when the number of over saturated pixels is very nearly equal to the saturation limit, in which case E ⁇ E′ ⁇ 0.088E′.
- the procedure of reducing exposure time can be repeated in an iterative manner until the amount of overexposure is within a chosen threshold, or until a maximum number of iterations has been accomplished. In either instance the over-exposure correction routine is then exited.
- An alternative and equally viable process for correcting for overexposure is to acquire a new image at a minimum exposure time, then proceed with optimizing the exposure time by calculating the COM and bringing it within range of the midpoint, as described above.
- the quality of the image may be automatically assessed and optimized to reduce variations due to one or more factors selected from stain uniformity, stain quality, tissue sufficiency, tissue sample position, signal saturation, focus, and signal intensity.
- images can be corrected for false readings due to no sample, too little sample, debris, multiple sample or “split image” (in the case of TMA analysis) and poor focus such that invalid images may be excluded from subsequent data analysis.
- Each stain may be validated independently from other stains on the same or different images.
- the intensity values of vertical columns of the image pixels are combined along the respective column and plotted across the x-axis.
- the combination can be a straightforward addition of pixel intensity values along the column.
- the combination can be a statistically arrived at value, such as an average intensity value of all of the pixels in the column. For example, with an image using 8 bits to represent intensity, there are 256 possible pixel intensity values for each pixel.
- the pixel intensity values span a range from black (e.g., “0”) to white (e.g., “255”). Values in between black and white are associated with varying shades of gray.
- the relative maximum intensity values, or peak values may be compared between different regions of the image to determine stain uniformity and positional bias. If a bias is found, the image may be excluded from further analysis.
- the staining intensity of the compartment specific stain inside the compartment is measured by analyzing pixels intensity of the digital image that are identified as part of the compartment.
- total stain intensity within the nuclear cellular compartment may be formulated as a combination, such as a sum of the intensities of pixels identified as representing nuclei.
- Total stain intensity outside of the nuclear cellular compartment can be similarly formulated as a sum of the intensities of pixels identified as not nuclear.
- the two values for nuclei and non-nuclear are compared. For example, the two values can be combined in a ratio, the single value of the ratio indicative of the comparison.
- the combined nuclei intensity can be divided by the combined non-nuclear intensity by the image processing program to provide a tissue stain quality ratio.
- a low ratio such as a ratio approaching 1, is indicative of poor staining quality or poor tissue integrity.
- An acceptable minimum staining quality threshold can be fixed or settable by a user. Such samples identified as failing to meet the minimum staining threshold can be excluded from the data set and from further analysis by the validation program.
- Tissue sufficiency may be analyzed by counting the pixels of an image with signal intensities above a threshold intensity then determining if the total number of positive pixels meets a minimum criterion for sufficient tissue. Likewise, the percent positive pixels to the total may be used as the criterion.
- tissue sample position may be assessed by calculating the average pixel intensity in each of multiple different sections identified within the field of view. Individual samples or histospots must be identified to determine position, which may be used by comparing the position of the edge of the sample with the center of the sample. The sample edge is determined based on pixel intensity of rectangular areas to assess if the centered properly, and the central pixel intensity is measured to determine if the edges are not due more than one sample. Sample edge detection may be performed using a discrete differentiation operator, such as a Sobel edge detector, or any other number of edge detectors well-known in the art. Incorrectly positioned samples or split spots containing more than one target may then be identified and excluded from further analysis.
- a discrete differentiation operator such as a Sobel edge detector, or any other number of edge detectors well-known in the art.
- Focus of the sample may be assessed, such as by determining a kurtosis value for the pixel intensities of the image.
- the staining intensity values of pixels in a digitized image can be plotted in a histogram.
- the distribution can be analyzed as an indication of focus.
- An in focus image will typically have a pixel intensity distribution with a relatively sharp, defined peak (higher kurtosis) compared to an out of focus image which will have a pixel intensity distribution with a flattened peak (lower kurtosis).
- the sharpness or flatness of such a distribution can be represented in a single value, such as a kurtosis value.
- a higher kurtosis value is indicative of a relatively sharp defined peak; whereas, a lower kurtosis value is indicative of a flattened peak.
- Kurtosis is a measure of whether the data are peaked or flat relative to a normal distribution. That is, data sets with high kurtosis tend to have a distinct peak near the mean, decline rather rapidly, and have heavy tails. Data sets with low kurtosis tend to have a flat top near the mean rather than a sharp peak. For univariate data Y 1 , Y 2 , . . . , Y N , the formula for kurtosis is:
- Signal intensity may be assessed by sorting the signal intensity data measured from images acquired in each relevant channel for each histospot and identifying the number of samples with low staining intensities. Such samples may be excluded from further analysis.
- tissue samples are stained with markers that define, for example, the cellular compartments of interest and the specific target (or targets) being studied.
- Pixel-based local assignment for compartmentalization of expression is the key algorithm that functions to effectively segment image pixels for the purpose of expression compartmentalization.
- a critical step in this algorithm is the setting of intensity thresholds that are used to delineate background or non-specific pixels from signal-specific pixels. Images that have been “masked” in this way are subsequently combined in a mutually-exclusive fashion such that pixels above the thresholds are assigned to specific cellular compartments. Once pixels have been assigned to each compartment, the signal for the target biomarker can then be averaged over all of the pixels assigned to a given compartment, which is the AQUA® score for that sample.
- a tumor-specific mask may be generated by manually thresholding the image of a marker (cytokeratin) that differentiates tumor from surrounding stroma and/or leukocytes. This creates a binary mask (each pixel is either ‘on’ or ‘off’). Thresholding levels are verified, and adjusted if necessary, by checking a small sample of images and then remaining images are automatically masked using the single determined threshold value. All subsequent image manipulations involve only image information from the masked area. Off target specific images may be clustered to iteratively adjust pixel intensities of nonstandard masked targets.
- the dilate image processing technique allows for a spatial low pass filter to fill in nearest-neighbor pixels that are surrounded by pixels included in the mask.
- the erode image processing technique allows for a spatial high pass filter to remove pixels that are not contiguous with the mask or that form structures that are contrary to structures expected for a given slide-mounted tissue sample. Such adjustments allow inclusion of valid but nonconforming samples that may otherwise be excluded from further analysis.
- the signal to noise ratio may be enhanced by correcting for background noise.
- two images one in-focus, one out of focus, e.g., taken 6 ⁇ m deeper into the sample
- the out of focus image acts as a spatial low pass filter that provides a background value.
- percentage of the out-of-focus image is subtracted from the in-focus image, based on a pixel-by-pixel analysis of the two images, such as by using an algorithm called RESA (Rapid Exponential Subtraction Algorithm).
- RESA Rapid Exponential Subtraction Algorithm
- the RESA algorithm enhances the interface between areas of higher intensity staining and adjacent areas of lower intensity staining, allowing easier assignment of pixels to background and adjacent compartments.
- the PLACE algorithm assigns each pixel in the image to a specific cellular compartment. Pixels that cannot be accurately assigned to a compartment within a user-defined degree of confidence are discarded. For example, pixels where the nuclear and cytoplasmic pixel intensities are too similar to be accurately assigned are negated (for example, comprising ⁇ 8% of the total pixels).
- T i is the i th target intensity, also known as power density, and C, is the i th cell compartment probability.
- the AQUA® score may be automatically normalized, for example, by clustering, to assign pixels to a particular cellular compartment based on intensity data. This clustering allows for further removal of background noise, assignment of specific pixels to a given compartment and probabilistic assignment of pixels to each compartment where there may be overlapping signals. Once pixels are assigned to each compartment (or discarded in the case of noise) the associated target signals can be measured, for example summed and a score calculated.
- pixel assignment is preferentially determined on an image-to-image basis, rather than setting universal criteria.
- pixel assignment is also a function of other compartment images such that consideration is given to the status of pixels in other compartment images.
- one image is of a first stain that specifically labels a first compartment (e.g., a Cy3/cytokeratin image, representing the cytoplasmic compartment) and a second image is of a second stain that specifically labels a second compartment (e.g., DAPI image, representing the nuclear compartment) and pixel assignments are based on four criteria:
- first stain e.g., Cy3
- second stain e.g., DAPI
- FIRST COMPARTMENT e.g., CYTOPLASMIC
- Clustering is a mathematical algorithmic function whereby centroids within data sets are defined by relative distances of each data point to one another, as determined, for example, by Euclidean or log-likelihood distance. While not wishing to be bound by theory, it is believed that clustering pixel intensities from at least two images (e.g., DAPI and Cy3), could result in centroids that define pixels as described, at least, by the above criteria. Because clustering is objective and can be performed individually on each image, clustering is a reliable method for assignment of pixels to compartments, independent of operator intervention.
- pixels containing signal indicative of both the first and second stain are assigned to compartments by the following method. Every pixel in acquired images has three attributes intensity contribution from compartment marker A, intensity contribution from compartment marker B and an intensity contribution from the target or biomarker of interest. These intensities are measured in their respective fluorescence channels per the experimental configuration. To avoid experimental bias, the target intensity is not manipulated in this current method. Thus, the data for the two compartment attributes can be illustrated in a two dimensional plot schematically.
- Pixels with a strong bias towards either of the axes can be assigned to that compartment (e.g., pixels in regions A and B could be absolutely assigned to compartments A and B respectively). Pixels near the origin represent low intensities for both channels and can be discarded as background along with outlier pixels that have high intensity but similar values. Pixels that remain in region A/B can then be assigned to each compartment based on probability. This assignment allows target signal in those pixels to be distributed across both compartments based on the probability characterization.
- clustering is used to determine three centroids in the data. This method is fully automated and does not require any operator decisions to proceed. The analysis is accomplished by performing k-means clustering on three centroids using Euclidean distances.
- a pixel is defined as background if its distance to the origin is less than twice that of the background centroid distance to the origin.
- a pixel is define as an outlier if its intensity exceeds the value defines by the line or plane defined by the outermost centroids;
- Pixels in regions A and B are assigned exclusively to those two compartments;
- Pixels in the triangular region A/B are then assigned a probability value that allows them to essentially be distributed in multiple compartments.
- This probability value can be calculated based on distance from the two regions A and B, or, using a shape function that will also assign a probability of each pixel having a contribution from the background region by examining each pixel's distance from the three vertices given by the centroids; (iv) With all pixels assigned, the associated target scores can be summed up for each compartment and a score calculated using standard methods:
- Int is the intensity of the pixel
- P is the probability of the pixel being assigned to a particular compartment (ranging from 0 to 1).
- Cutpoints are established using algorithms to separate samples into groups with specific features, such as samples containing tissues with different biomarker expression levels for one or more biomarker, as described in more detail in McCabe et al., J. Natl. Canc. Inst. (2005) 97(24):1808-1815, which is hereby incorporated by reference in its entirety.
- intra-group variation is minimized, differences between groups are maximized and more easily identified. For instance, a high expression level of a biomarker, represented by a high AQUA® score, may be more tightly correlated with aggressive disease and reduced survival, whereas a lower AQUA® score is not.
- AQUA® scores generated using the methods of the invention provide a reliable assay for comparing sample groups such that the biomarker may be more specifically correlated with the particular characteristics, leading to more reliable diagnosis and prognosis estimation on an individual sample.
- the data signal attributed to two or more cell compartments can be more reliably distinguished.
- data signal can be distinguished with at least about 90% confidence interval.
- the data signal can be distinguished with about a 95% confidence interval.
- the data signal can be distinguished with about a 99% confidence interval.
- the normalized AQUA® score provides a more reproducible cutpoint determination, leading to greater agreement of sample classification between runs.
- the assay provides for a greater than 85% concordance for sample classification from one run to another for each sample. In a further embodiment, the assay provides for a greater than 90% concordance for sample classification from one run to another for each sample. In a further embodiment, the assay provides for a greater than 95% concordance for sample classification from one run to another for each sample. In a further embodiment, the assay provides for a greater than 99% concordance for sample classification from one run to another for each sample.
- the normalized AQUA® score provides a more reproducible quantified measure of biomarker expression.
- the quantified measure of biomarker expression level has a reproducibility above 80%.
- the quantified measure of biomarker expression level has a reproducibility above 90%.
- the quantified measure of biomarker expression level has a reproducibility above 95%.
- the quantified measure of biomarker expression level has a reproducibility above 99%.
- the quantified measure of biomarker expression level has a reproducibility from about 85% to about 99%.
- the quantified measure of biomarker expression level has a reproducibility from about 90% to about 99%.
- the quantified measure of biomarker expression level has a reproducibility from about 90% to about 97%.
- the normalized AQUA® score provides a quantified measure of biomarker expression having a coefficient of variation (% CV) below 20%. In a further embodiment, the normalized AQUA® score provides a quantified measure of biomarker expression having a coefficient of variation (% CV) below 10%. In a further embodiment, the normalized AQUA® score provides a quantified measure of biomarker expression having a coefficient of variation (% CV) below 5%. In a further embodiment, the normalized AQUA® score provides a quantified measure of biomarker expression having a coefficient of variation (% CV) from about 1% to about 20%.
- the normalized AQUA® score provides a quantified measure of biomarker expression having a coefficient of variation (% CV) from about 5% to about 15%. In a further embodiment, the normalized AQUA® score provides a quantified measure of biomarker expression having a coefficient of variation (% CV) from about 4% to about 7%.
- normalized AQUA® scores provides a reliable assay for comparing sample groups such that the biomarker may be more specifically correlated with the particular characteristics, leading to more reliable diagnosis and prognosis estimation.
- TMA tissue microarray
- YTMA49 Chromagen-based immunohistochemical staining and scoring for cases in YTMA49 was performed previously as described (Camp R L, et al. Cancer Res. (2003) 63:1445-1448, which is hereby incorporated by reference in its entirety). YTMA49 was stained using a modified indirect immunofluorescence protocol (Camp R L, et al. Nat. Med. (2002) 8:1323-1327, which is hereby incorporated by reference in its entirety). In brief, pre-cut paraffin-coated tissue microarray slides were de-paraffinized and antigen-retrieved by heat-induced epitope retrieval in 10 mM Tris (pH 9.0).
- the PM2000TM system commercialized by HistoRx, Inc. (New Haven, Conn.), is based on a system described previously (Camp et al., 2002, supra). In brief, it is comprised of the Olympus BX51 epi-fluorescence microscope (Olympus America, Inc., Center Valley, Pa.) which is equipped with a motorized nosepiece to control selection of objectives (e.g., 4 ⁇ , 10 ⁇ , 20 ⁇ , 40 ⁇ , and 60 ⁇ ); a motorized filter turret to control selection of different filter cubes (e.g., DAPI, Cy2, Cy3, Cy5, and Cy7 or equivalent wavelengths); a motorized stage to control stage movements (Prior Scientific Inc., Rockland, Mass.); an X-Cite 120 mercury/metal halide light source (EXFO Life Sciences & Industrial Division, Ontario, Candada); and a QUANTFIRE monochromatic digital camera (Optronics, Inc., Goleta, Calif.).
- CC factor calibration cube factor
- LS factor light source factor
- OP factor Cy5 optical path factor
- the light source factor is calculated for each histospot acquired and is the total light intensity as measured by the calibration cube divided into a constant (100,000).
- the optical path factor accounts for the amount of light passed through a specific microscope objective/filter combination relative to the measured incoming light intensity. For these measurements, a standard sample is required that can be transferred between different machines and maintain reproducibility in its construction. A commercially available blue fluorescent standard slide was selected for this purpose (Omega Optical Inc., Brattleboro, Vt.). Standardization was performed as described herein previously.
- AQUA® scores were Log 2 transformed. Statistical analysis and output was performed using SPSS 15.0 (SPSS Inc, Chicago, Il.) unless otherwise noted. Optimal cut-points for continuous HER2 AQUA® data for 5-year disease-specific death were generated as a function of survival using the software package X-Tile as described previously (Camp R L, et al., Clin. Cancer Res. (2004) 10:7252-7259, which is hereby incorporated by reference in its entirety). X-tile performs Monte Carlo simulations (e.g. cross-validation (Raeside DE. Phys Med Biol.
- Fluorescent stains were multiplexed to compartmentalize and measure expression of specific biomarkers.
- HER2 only pixels (Cy5) within the cytokeratin-derived (epithelium specific) compartment (Cy3) were considered for analysis, thus differentiating tumor from stromal HER2 signal as well as membrane/cytoplasm from nuclear HER2 signal.
- cytokeratin pixels that coincided with cytokeratin pixels were used to generate an AQUA® score.
- HER2 AQUA® scores showed a moderate, but highly significant correlation with categorical IHC scoring methods (0, +1, +2, and +3) with Spearman's Rho value of 0.46 (P ⁇ 0.001). Multinomial regression analysis (for comparison of categorical versus continuous data) showed a highly significant correlation (P ⁇ 0.001) with a pseudo-R value of 0.56.
- FIG. 3 categorizes HER2 AQUA® scores as a function of IHC scores using a box plot. Although there was a highly significant difference in population mean (ANOVA P ⁇ 0.001), because AQUA® provides a continuous expression score, significant overlap of AQUA® scores was observed across the range of traditional categorical scoring.
- FIG. 4 gives box plots showing normalized AQUA® score distributions for each indicated acquisition parameter (instrument ( FIG. 4A ), operator ( FIG. 4B ), and independent staining runs ( FIG. 4C )).
- % CV percent coefficient of variation
- a critical parameter for HER2 testing in the clinical laboratory is the ability to reproducibly classify patients as positive or negative.
- survival as a surrogate marker for positive/negative classification 22
- an optimal AQUA® score cut-point was established using X-tile 19 for normalized HER2 AQUA® scores produced for instrument 1 , operator 1 , and staining run 1 .
- the methods of the present invention were applied to the evaluation of the biomarker EGFR in breast cancer tissue sections.
- a TMA cohort of 748 specimens was analyzed for HER2 expression by normalized AQUA® analysis across three instruments, 3 operators, and 3 separate staining runs with an average % CV of 4.3%.
- Preliminary analytical performance assessment was performed with EGFR PharmDx (Dako). As FIGS.
- Each ‘sample’ refers to the average of the scores from the five-fold redundant TMA spots cored from the associated whole tissue section sample used in previous testing (with a range of Allred scores).
- % CV values for mean AQUAS score values are in the 4-6.5% range and do not vary significantly across the range of ER expression.
- the % CV variations observed within a single sample at a single site is the result of indicative of marker heterogeneity within the sample, not measurement error.
- AQUA® scores To demonstrate the utility of AQUA® scores, a comparison study was performed to examine the relationship between breast tissue immunofluorescently stained then scored using AQUAnalysisTM and breast tissue chromogencially stained then scored using the Allred method.
- a tissue microarray cohort of 669 patients was obtained from the Yale University Tissue Microarray Facility consisting of samples from the Yale University Department of Pathology tissue archives collected between 1961 and 1983.
- Allred scoring and AQUA® scoring was highly correlative (p ⁇ 0.001) for all pathologists by non-parametric correlation analysis (Spearman's Rho, FIG. 9D ). Multinomial logistic regression analysis demonstrated a significant (p ⁇ 0.001) and direct (pseudo R 2 ) relationship between Allred scoring and AQUA® scoring for all pathologists (see FIG. 9 ).
- a cut point is applied to the data.
- a cut point of 3 was used such that scores ⁇ 3 (0 or 2) were considered negative and scores ⁇ 3 were considered positive. See, e.g., Harvey et al, supra.
- This cut point was applied to the individual results of each of the manually scored pathologist data sets and a consensus score was generated. Samples where at least one pathologist could not provide a score were eliminated from the consensus. If scores did not agree, the majority score was used. As a result of this, it was observed that pathologists demonstrated universal agreement for positive/negative classification 91% of the time for 523 cases.
- an unsupervised Bayesian clustering algorithm based on log-likelihood distances was applied using the commercially available software program, SPSS(SPSS, Inc. Chicago, II). For this algorithm, patients were grouped based on cluster membership of AQUA® scores. When the clustering was performed, four clusters are manifested in the data (see FIG. 10A ). Analogous to Allred scoring, survival was used to determine positive and negative classification between expression groups. As shown in FIG. 10B , three (clusters 2-4) show improved survival whereas cluster 1 show decreased survival. Therefore, patients in cluster 1 were considered ER negative and all others ER positive.
- a single TMA slide described in Examples 3 and 4 was stained for ER expression using conventional chromogenic immunohistochemistry techniques as previously described and independently evaluated by three pathologists using light microscopy and scored by the Allred method ( FIG. 12A ).
- a second, serial section, TMA slide was stained for AQUA® analysis (fluorescent immunohistochemistry) of ER expression and the same slide was analyzed on three independent instruments by AQUA® analysis ( FIG. 12B ).
- Examination of the results obtained by each pathologist vs. each other pathologist shown as scatterplots shows that while overall concordance is high, there are samples considered positive by one pathologist that are considered negative by another. These patients would receive different treatment (hormonal therapy) depending on which pathologist read their ER results.
Landscapes
- Engineering & Computer Science (AREA)
- Physics & Mathematics (AREA)
- Health & Medical Sciences (AREA)
- Life Sciences & Earth Sciences (AREA)
- Theoretical Computer Science (AREA)
- Medical Informatics (AREA)
- General Health & Medical Sciences (AREA)
- Bioinformatics & Cheminformatics (AREA)
- Computer Vision & Pattern Recognition (AREA)
- Biophysics (AREA)
- Evolutionary Biology (AREA)
- Biotechnology (AREA)
- Spectroscopy & Molecular Physics (AREA)
- Bioinformatics & Computational Biology (AREA)
- Data Mining & Analysis (AREA)
- General Physics & Mathematics (AREA)
- Evolutionary Computation (AREA)
- Public Health (AREA)
- Molecular Biology (AREA)
- Software Systems (AREA)
- Artificial Intelligence (AREA)
- Bioethics (AREA)
- Epidemiology (AREA)
- Databases & Information Systems (AREA)
- Nuclear Medicine, Radiotherapy & Molecular Imaging (AREA)
- Quality & Reliability (AREA)
- Radiology & Medical Imaging (AREA)
- Probability & Statistics with Applications (AREA)
- Biomedical Technology (AREA)
- Multimedia (AREA)
- Physiology (AREA)
- Investigating Or Analysing Biological Materials (AREA)
Abstract
Description
- The present application claims priority benefit under 35 U.S.C. §119(e) of U.S. Pat. Appl. No. 61/097,415, filed Sep. 16, 2008, the disclosure of which is hereby incorporated by reference in its entirety.
- The present invention relates to the field of automated biomarker expression analysis in tissue samples using algorithms to enhance operator-independent analysis and assay result reproducibility for greater predictive value in diagnostic assays.
- To date, biomarker assessment on tissue sections relies on traditional cytochemical and immunohistochemical (IHC) techniques which were largely developed before large scale and high throughput assays were available. A significant drawback to traditional methods is the subjective nature of the test, and lack of standardization. Although IHC tests have shown clinical utility (e.g., Her2/HercepTest), the value of these tests have recently been shown to be compromised by the site at which the test is performed. Two recent studies examining the reproducibility of Her2 testing has shown that there may be as much as 20% error between local and central lab testing (Perez et al. J. Clinic. One. (2006) 24:3032-8; Paik S et al. Benefit from adjuvant trastuzumab may not be confined to patients with
IHC 3+ and/or FISH positive tumors: Central testing results from NSABP B-31 (2007) 25:511-22). - Tissue microarray technology offers the opportunity for high throughput analysis of tissue samples (Konen, J. et al., Nat. Med. 4:844-7 (1998); Kallioniemi, O. P. et al., Hum. Mol. Genet. 10:657-62 (2001); Rimm, D. L. et al., Cancer J. 7:24-31 (2001)). For example, the ability to rapidly perform large scale studies using tissue microarrays can provide critical information for identifying and validating drug targets and prognostic markers (e.g. estrogen receptor (ER) and HER2/neu), as well as candidate therapeutics.
- The present invention provides for the first time fully automated standardization of in situ biomarker quantification that minimizes lab-to-lab, machine-to-machine, operator-to-operator, and day-to-day staining variations.
- The present invention relates to the reproducible quantification of biomarker expression from tissue samples, whole tissue sections (WTS) as well as tissue microarrays (TMAs), so as to reduce variability between runs or batches due to differences in operators, equipment, facilities, and other factors. The systems and processes described herein provide the automated localization and quantitation of biomarkers with normalization of scores for greater reproducibility between runs, regardless of location, operator or instrument variability.
- One embodiment of the invention relates to a method of reproducibly quantifying biomarker expression in a slide-mounted tissue sample comprising (a) obtaining a slide-mounted tissue sample, which has been stained to permit localization of at least one cellular compartment and at least one biomarker, (b) obtaining one or more pixel-comprised images of the stained tissue sample using a standardized optical system that includes a light source, (c) automatically analyzing one or more data sets derived from the image pixels to differentiate data signal from noise, (d) automatically analyzing one or more data sets derived from the image pixels to differentiate data signal attributable to each of said at least one cellular compartment, (e) optionally automatically analyzing one or more data sets derived from the image pixels to differentiate data signal attributable to said at least one biomarker for each of said at least one cellular compartment, (f) quantifying the amount of biomarker expressed in each of said at least one cellular compartment; whereby the biomarker expression in the slide-mounted tissue sample is quantified reproducibly.
- In one embodiment, the standardized optical system includes a light source whose intensity and optical path variability have been normalized. In a further embodiment, the standardized optical system allows for automatic adjustment of exposure time to provide an optimized dynamic range of data captured in the image pixels.
- In one embodiment, each automatic analysis step is carried out in an unsupervised manner.
- In one embodiment, the data signal attributable to two or more cellular compartments is differentiated.
- In one embodiment, the amount of biomarker expressed in each of two or more cellular compartments is quantified.
- In one embodiment, the data signal attributable to two or more cellular compartments is differentiated with a confidence interval of about 95%.
- In one embodiment, the method further comprises assessing the quality of the one or more slide-mounted tissue samples or the one or more pixel-comprised images or one or more magnified portions thereof.
- In one embodiment, the method provides a reproducible cutpoint determination.
- In one embodiment, the method provides a greater than 85% concordance for sample classification from one run to another for each sample. In a further embodiment, the method provides a greater than 90% concordance for sample classification from one run to another for each sample.
- In one embodiment, the method provides a quantified measure of biomarker expression having a level of reproducibility above 80 percent. In a further embodiment, the method provides a quantified measure of biomarker expression having a level of reproducibility above 90 percent. In a further embodiment, the method provides a quantified measure of biomarker protein expression having a level of reproducibility above 95 percent.
- In one embodiment, the method provides a quantified measure of biomarker expression having a level of reproducibility falling in the range of about 90 to about 97 percent.
- In one embodiment, the method provides a quantified measure of biomarker expression having a coefficient of variation (% CV) below 20 percent. In a further embodiment, the method provides a quantified measure of biomarker expression having a coefficient of variation (% CV) below 10 percent. In a further embodiment, the method provides a quantified measure of biomarker expression having a coefficient of variation (% CV) below 5 percent. In a further embodiment, the method provides a quantified measure of biomarker expression having a coefficient of variation (% CV) falling in the range of about 4 to about 7 percent.
- In one embodiment, the slide-mounted tissue sample has been stained with an optimal dilution of one or more reagents. In a further embodiment, said optimal dilution produces one or more pixel-comprised images having an optimal dynamic range metric.
- In one embodiment, the method of the present invention is implemented by a computer. In another embodiment, the present invention is directed to a computer readable medium comprising the computer readable instructions stored thereon for execution by a processor to perform the method described herein. In another embodiment, the present invention is directed to an electromagnetic signal carrying computer-readable instructions for implementing the method described herein. The invention is also directed to a computer readable medium having computer readable instructions stored thereon for execution by a processor to perform a method of reproducibly quantifying biomarker expression in a slide-mounted tissue sample comprising: (a) acquiring one or more pixel-comprised images of a slide-mounted tissue sample, which has been stained to permit localization of at least one cellular compartment and at least one biomarker using a standardized optical system that includes a light source; (b) automatically analyzing one or more data sets derived from the image pixels to differentiate data signal from noise; (c) automatically analyzing one or more data sets derived from the image pixels to differentiate data signal attributable to each of said at least one cellular compartment; and (d) quantifying the amount of biomarker expressed in each of said at least one cellular compartment, whereby the biomarker expression in the slide-mounted tissue sample is quantified reproducibly. In a preferred embodiment of the computer readable medium, the computer readable instructions stored thereon for execution by a processor further comprises instructions to perform a method that includes, prior to said quantifying step, an optional step of automatically analyzing one or more data sets derived from the image pixels to differentiate data signal attributable to said at least one biomarker for each of said at least one cellular compartment. In yet another embodiment of the invention, a system for reproducibly quantifying biomarker expression in a slide-mounted tissue sample comprising: (a) one or more lenses configured to magnify at least a portion of a slide-mounted tissue sample, which has been stained to permit localization of at least one cellular compartment and at least one biomarker; (b) a standardized optical system, including a light source and an image sensor in optical communication with said one or more lenses, the standardized optical system obtaining one or more pixel-comprised images of the stained tissue sample; (c) a processor module in communications with the standardized optical system, the processor module configured to: (i) automatically analyze one or more data sets derived from the image pixels to differentiate data signal from noise, (ii) automatically analyze one or more data sets derived from the image pixels to differentiate data signal attributable to each of said at least one cellular compartment, and (iii) quantify the amount of biomarker expressed in each of said at least one cellular compartment, whereby the biomarker expression in the slide-mounted tissue sample is quantified reproducibly. In a preferred embodiment of the system, the processor module is further configured to optionally automatically analyze one or more data sets derived from the image pixels to differentiate data signal attributable to said at least one biomarker for each of said at least one cellular compartment. Such analysis is preferably performed prior to the quantification step (iii).
- Other features, objects and advantages of the invention will be apparent from the following figures, detailed description and the claims.
-
FIG. 1 shows an embodiment of a process for reproducibly quantifying an amount of a biomarker expressed in each of one or more cellular components of a slide-mounted biological sample containing cells, such as a tissue sample from a patient. -
FIG. 2 shows an embodiment of a process for image processing steps to reproducibly quantifying an amount of a biomarker expressed in each of one or more cellular components of a slide-mounted biological sample containing cells. -
FIG. 3 is a box plot of Log2-transformed HER2 AQUA® scores (y-axis) categorized by traditional IHC scoring (x-axis) for 543 cases with both AQUA® and IHC scoring information. One-way ANOVA analysis for comparison of means across all categories was significant (P<0.001). Post-hoc analysis using Tamhane's T2 statistic for multiple comparisons shows significant differences between each category (all P-values <0.05). -
FIGS. 4A-C show box plots comparing normalized Log2-transformed HER2 AQUA® scores across instruments (A), operators (B), and staining runs (C) for 583 cases with indicated averaged % CV for all cases. -
FIGS. 5A-C show Kaplan-Meier 5-year disease-specific survival analysis plots for (A) X-tile determined cut-point forinstrument 1 HER2 AQUA® scores dividing the population into HER2 low (84.5%) and HER2 high (15.5%) showing a significant [Monte Carlo P<0.001; training/validation P=0.002] 17.8% reduction in cumulative survival from 75.7−57.9%. This cut-point was applied to instrument 2 (B) and instrument 3 (C) with significance (P<0.001 and P=0.004 respectively) and equivalent curve shape and composition for instrument 2 [HER2 low (83.6%); HER2 high (16.4%); 15.4% reduction in cumulative survival from 75.5−60.1%] and instrument 3 [HER2 low (84.9%); HER2 high (14.1%); 13.5% reduction in cumulative survival from 74.9−61.4%]. -
FIGS. 6A-F show 2×2 contingency tables comparing positive (POS) v. negative (NEG) population segregation based on X-tile cut-points generated for the reference (e.g., Instrument 1) for each indicated instrument set (A, B), operator set (C, D), and run set (E, F). Also shown are overall concordance, positive agreement, and negative agreement rates with 95% confidence intervals. -
FIGS. 7A-C are frequency distributions separated into negative agreement, positive agreement, and non-agreement cases for (A) instrument 2 (AQUA® scores) to instrument 1 (cut-point); (B) operator 2 (AQUA® scores) to operator 1 (cut-point); and (C) run 2 (AQUA® scores) to run 1 (cut-point) to demonstrate where disagreement occurs within the population of breast cancer cases. Cases which disagree reside in and around the indicated cut-points and do not span over the entire distribution. -
FIGS. 8A-D illustrate the analytical performance of AQUA® analysis and EGFR assay. (A) Box plot of log(2) transformed AQUA® scores of HER2 for 748 cases across 3 staining days (D), machines (M), and operators (O) with indicated % CV. (B). Linear regression analysis for EGFR AQUA® scores generated on test array of breast tumor, normal and cell line controls (n=152) across 3 slides and 3 staining days with indicated average R values and slopes. (C) Box plot of log2 transformed AQUA® scores of EGFR for 40 tumors from (B) with indicated % CV. (D) Box plot of log2 transformed AQUA® scores of EGFR for 35 cell lines (2× redundant) from (B) with indicated % CV. -
FIGS. 9A-D show the results from Example 4, below.FIGS. 9A-C are box plots of the Allred score from three pathologists compared to the AQUA® score generated for the same samples.FIG. 9D is a table showing the correlation between the Allred and AQUA® scoring for each pathologist. -
FIGS. 10A-B show the (A) clustering of patients based on AQUA® scores and (B) survival of the clustered groups, as described in Example 4. -
FIGS. 11A-B compare the five year disease specific survival using the Allred scoring (A) and AQUA® scoring (B). -
FIGS. 12A-B illustrates the comparison of ER expression scores determined by 3 pathologists reading the same TMA slide using the Allred score method (A) and the comparison of ER expression AQUA scores determined by 3 PM-2000 instruments reading the same TMA slide (B). - Unless defined otherwise, all technical and scientific terms used herein generally have the same meaning as commonly understood by one of ordinary skill in the art to which this invention belongs. As used in this specification and the appended claims, the singular forms “a”, “an” and “the” include plural referents unless the content clearly dictates otherwise. For example, reference to “a cell” includes a combination of two or more cells, and the like. Generally, the nomenclature used herein and the laboratory procedures in cell biology, immunohistochemistry, and imaging (e.g., cells and tissue) described below are those well known and commonly employed in the art.
- It should be appreciated that the particular implementations shown and described herein are examples of the present invention and are not intended to otherwise limit the scope of the present invention in any way. Further, the techniques are suitable for applications in teleconferencing, robotics vision, unmanned vehicles, or any other similar applications.
- Techniques suitable for use in the present invention can also be found in co-pending U.S. application Ser. Nos. 12/153,171, filed May 14, 2008; U.S. application Ser. No. 12/139,370, filed Jun. 13, 1008; U.S. application Ser. No. 12/186,294, filed Aug. 5, 2008; U.S. application Ser. No. 12/188,133, filed Aug. 7, 2008; and U.S. application Ser. No. 12/201,753, filed Aug. 29, 2008, each of which is hereby incorporated by reference in its entirety.
-
FIG. 1 shows a process for reproducibly quantifying an amount of a biomarker expressed in each of one or more cellular components of a slide-mounted biological sample containing cells, such as a tissue sample from a patient. Theprocess 100 is initiated by obtaining a stained, slide-mounted biologicalsample containing cells 105, in which the stain has been applied in a manner to permit localization of at least one cellular compartment and at least one biomarker. The at least one cellular compartment includes, but is not limited to, a cytoplasm, a nucleus, and a cell wall. The at least one biomarker may include a biomarker labeled or detected via a CY5 fluorescent signal, used to detect a tumor cell. Examples include but are not limited to HER2, ER, PR, EGFR, ERCC1, TS and the like. - The
process 100 continues by obtaining a pixel-comprised image or set of images of thestained tissue sample 110. The pixel-comprised image or set of images may be taken using a standardized optical system, such as an optical microscope system, that includes a light source. The pixel-comprised image may be obtained through the standardized optical system using a digital image sensor, such as a digital camera. In some embodiments, the digital image may be taken by an analogue camera, whereby the resulting analogue image or film is digitized by a digital scanner or equivalent means. In at least some embodiments, the camera may be mounted directly or indirectly to a microscope to obtain a pixel-comprised image in the form of a micrograph. Alternately or in addition to, the camera may rely on a direct connection to a video out line on an existing imaging system. In some embodiments, the light source includes light with wavelengths in one or more of the visible spectrum, the infrared (IR) spectrum, and the ultraviolet (UV) spectrum. The camera may be a video camera or a time-lapse photographic sequence, providing real-time and elapsed time images that contain dynamic cellular activity. - The pixel-comprised image obtained by the
process 100 is then analyzed to derive one or more data sets from the image pixels to differentiate a data signal fromnoise 115. This analysis can be performed automatically, for example, using a processor. The processor may include one or more computer processors, controllable according to a preprogrammed instruction set. In some embodiments differentiating a data signal from noise includes a statistical analysis of the signal, for example an unsupervised cluster analysis resulting in segregation of pixels with signal from pixels having signal attributable to noise. In some embodiments, differentiating a data signal from noise may include subtracting a focused image of the slide-mounted tissue sample from a defocused image of the slide-mounted tissue sample. In some embodiments, the defocused image may include an image focused just below the slide-mounted tissue sample. In general, defocusing an image acts like a spatial low pass filter, allowing for a background measurement to which the data signal may be compared. - Next, the pixel-comprised image obtained by the
process 100 is analyzed to derive one or more data sets from the image pixels to differentiate data signals attributable to each of at least onecellular compartment 120. This analysis can also be performed automatically, for example, using a preprogrammed computer or a dedicated special purpose processor. In some embodiments, differentiation may depend on a fluorescence attributable to a marker or stain applied to the slide-mounted sample. In some embodiments, the fluorescence of stains directed to the at least one cellular compartment varies in wavelength. In some embodiments, a blue fluorescence may be associated with a nucleus receptor (DAPI), a green fluorescence may be associated with a cell cytoplasm receptor (cytokeratin), and a red fluorescence may be associated with a cell membrane receptor (alpha-catenin). - Preferably, the stain is applied in a manner to permit localization of at least one cellular compartment and at least one biomarker. In some embodiments, the at least one biomarker, previously described in 105, is used to detect a tumor cell or a target protein or a target antigen and may be an indication of a tumor cell in the slide-mounted tissue sample. The
process 100 includes a step to associate or otherwise to correlate the previously differentiated data signals attributable to each of at least onecellular compartments 120 with the detected tumor cell or tumor mask. In doing so, the one or more data sets derived from the image pixels are automatically analyzed to differentiate a data signal attributable to at least one biomarker for each of the at least onecellular compartment 125. Theprocess 100 reproducibly quantifies the amount of biomarker expressed in at least one of the at least one cellular compartment for the slide-mountedtissue sample 130. -
FIG. 2 shows adetailed process 200 for image processing steps to reproducibly quantifying an amount of a biomarker expressed in each of one or more cellular components of a slide-mounted sample. Theprocess 200 is initiated by obtaining a digital image of astained tissue sample 205. The digital image is obtained in a manner similar to that described insteps method 100. Next, theprocess 200 directs the image quality to be tested forsignal integrity 210,sample integrity 215, andimage integrity 220. If any one or more image quality tests ofsignal integrity 210,sample integrity 215, andimage integrity 220 fail, the digital image may be removed from analysis or may be flagged for a manual review of the digital image by theoperator 225 to either accept the digital image for analysis or to remove the digital image fromanalysis 226. - Passing image quality tests for
signal integrity 210,sample integrity 215, andimage integrity 220 or passing a manual review of thedigital image 225 identifies the digital image as a candidate for further image processing inprocess 200. Failure to pass image quality tests for any one or more ofsignal integrity 210,sample integrity 215, andimage integrity 220 and failing to pass a manual review of thedigital image 225 identifies the digital image as low quality, and the digital image is rejected. Briefly, signal integrity includes a cellular compartmentalization, a fluorescence intensity, and a saturated pixel percentage assessment. Saturation may be assessed by determining that a predetermined number of pixels in the pixel-comprised image are represented by data and data structures that include a maximum or near maximum value. Sample integrity includes a determination that a sufficient sample of interest (e.g., tumor tissue) is present for analysis. Image integrity includes, for example, a detection of any out of focus images, and in the case of TMAs, analysis and detection of any split images. - While the invention has been described in connection with the specific embodiments thereof, it will be understood that it is capable of further modification. Furthermore, this application is intended to cover any variations, uses, or adaptations of the invention, including such departures from the present disclosure as come within known or customary practice in the art to which the invention pertains, and as fall within the scope of the appended claims.
- All publications, patents, and patent applications mentioned in this specification are herein incorporated by reference to the same extent as if each individual publication, patent, or patent application was specifically and individually indicated to be incorporated by reference.
- 1. Samples
- Any cell containing sample may be analyzed by the methods of the present invention. For example, the sample may be prepared from tissues collected from patients. Alternatively, the sample may be a cell containing biological sample such as a blood sample, bone marrow sample, or a cell line. The samples may be whole-tissue or TMA sections on microscope slides. Particularly when using tissue microrarrays (TMAs), samples may be arranged as “spots” or “histospots” on a slide, with each histopot corresponding to a particular sample. Such methods for preparing slide mounted tissue samples are well known in the art and suitable for use in the present invention.
- 2. Biomarkers
- As used herein, a biomarker is a molecule that may be measured in a biological sample as an indicator of tissue type, normal or pathogenic processes or a response to a therapeutic intervention. In a particular embodiment, the biomarker is selected from the group consisting of: a protein, a peptide, a nucleic acid, a lipid and a carbohydrate. More particularly, the biomarker may be a protein. Certain markers are characteristic of particular cells, while other markers have been identified as being associated with a particular disease or condition. Examples of known prognostic markers include enzymatic markers such as, for example, galactosyl transferase II, neuron specific enolase, proton ATPase-2, and acid phosphatase. Hormone or hormone receptor markers include human chorionic gonadotropin (HCG), adrenocorticotropic hormone, carcinoembryonic antigen (CEA), prostate-specific antigen (PSA), estrogen receptor, progesterone receptor, androgen receptor, gC1q-R/p33 complement receptor, IL-2 receptor, p75 neurotrophin receptor, PTH receptor, thyroid hormone receptor, and insulin receptor.
- Lymphoid markers include alpha-1-antichymotrypsin, alpha-1-antitrypsin, B cell marker, bcl-2, bcl-6, B lymphocyte antigen 36 kD, BM1 (myeloid marker), BM2 (myeloid marker), galectin-3, granzyme B, HLA class I Antigen, HLA class II (DP) antigen, HLA class II (DQ) antigen, HLA class II (DR) antigen, human neutrophil defensins, immunoglobulin A, immunoglobulin D, immunoglobulin G, immunoglobulin M, kappa light chain, kappa light chain, lambda light chain, lymphocyte/histocyte antigen, macrophage marker, muramidase (lysozyme), p80 anaplastic lymphoma kinase, plasma cell marker, secretory leukocyte protease inhibitor, T cell antigen receptor (JOVI 1), T cell antigen receptor (JOVI 3), terminal deoxynucleotidyl transferase, unclustered B cell marker.
- Tumor markers include alpha fetoprotein, apolipoprotein D, BAG-1 (RAP46 protein), CA19-9 (sialyl lewisa), CA50 (carcinoma associated mucin antigen), CA125 (ovarian cancer antigen), CA242 (tumour associated mucin antigen), chromogranin A, clusterin (apolipoprotein J), epithelial membrane antigen, epithelial-related antigen, epithelial specific antigen, epidermal growth factor receptor, estrogen receptor (ER), gross cystic disease fluid protein-15, hepatocyte specific antigen, HER2, heregulin, human gastric mucin, human milk fat globule, MAGE-1, matrix metalloproteinases, melan A, melanoma marker (HMB45), mesothelin, metallothionein, microphthalmia transcription factor (MITF), Muc-1 core glycoprotein. Muc-1 glycoprotein, Muc-2 glycoprotein, Muc-5AC glycoprotein, Muc-6 glycoprotein, myeloperoxidase, Myf-3 (Rhabdomyosarcoma marker), Myf-4 (Rhabdomyosarcoma marker), MyoD1 (Rhabdomyosarcoma marker), myoglobin, nm23 protein, placental alkaline phosphatase, prealbumin, progesterone receptor, prostate specific antigen, prostatic acid phosphatase, prostatic inhibin peptide, PTEN, renal cell carcinoma marker, small intestinal mucinous antigen, tetranectin, thyroid transcription factor-1, tissue inhibitor of matrix metalloproteinase 1, tissue inhibitor of matrix metalloproteinase 2, tyrosinase, tyrosinase-related protein-1, villin, von Willebrand factor, CD34, CD34, Class II, CD51 Ab-1, CD63, CD69, Chk1, Chk2, claspin C-met, COX6C, CREB, Cyclin D1, Cytokeratin, Cytokeratin 8, DAPI, Desmin, DHP (1-6 Diphenyl-1,3,5-Hexatriene), E-Cadherin, EEA1, EGFR, EGFRvIII, EMA (Epithelial Membrane Antigen), ER, ERB3, ERCC1, ERK, E-Selectin, FAK, Fibronectin, FOXP3, Gamma-H2AX, GB3, GFAP, Giantin, GM130, Golgin 97, GRB2, GRP78BiP, GSK3 Beta, HER-2, Histone 3, Histone 3_K14-Ace [Anti-acetyl-Histone H3 (Lys 14)], Histone 3_K18-Ace [Histone H3-Acetyl Lys 18), Histone 3_K27-TriMe, [Histone H3 (trimethyl K27)], Histone 3_K4-diMe [Anti-dimethyl-Histone H3 (Lys 4)], Histone 3_K9-Ace [Acetyl-Histone H3 (Lys 9)], Histone 3_K9-triMe [Histone 3-trimethyl Lys 9], Histone 3_S10-Phos [Anti-Phospho Histone H3 (Ser 10), Mitosis Marker], Histone 4, Histone H2A.X—5139-Phos [Phospho Histone H2A.X (Ser139)antibody], Histone H2B, Histone H3_DiMethyl K4, Histone H4_TriMethyl K20-Chip grad, HSP70, Urokinase, VEGF R1, ICAM-1, IGF-1, IGF-1R, IGF-1 Receptor Beta, IGF-II, IGF-IIR, IKB-Alpha IKKE, IL6, IL8, Integrin alpha V beta 3, Integrin alpha V beta6, Integrin Alpha V/CD51, integrin B5, integrin B6, Integrin B8, Integrin Beta 1(CD 29), Integrin beta 3, Integrin beta 5 integrinB6, IRS-1, Jagged 1, Anti-protein kinase C Beta2, LAMP-1, Light Chain Ab-4 (Cocktail), Lambda Light Chain, kappa light chain, M6P, Mach 2, MAPKAPK-2, MEK 1, MEK 1/2 (Ps222), MEK 2, MEK1/2 (47E6), MEK1/2 Blocking Peptide, MET/HGFR, MGMT, Mitochondrial Antigen, Mitotracker Green F M, MMP-2, MMP9, E-cadherin, mTOR, ATPase, N-Cadherin, Nephrin, NFKB, NFKB p105/p50, NF-KB P65, Notch 1, Notch 2, Notch 3, OxPhos Complex IV, p130Cas, p38 MAPK, p44/42 MAPK antibody, P504S, P53, P70, P70 S6K, Pan Cadherin, Paxillin, P-Cadherin, PDI, pEGFR, Phospho AKT, Phospho CREB, phospho EGF Receptor, Phospho GSK3 Beta, Phospho H3, Phospho HSP-70, Phospho MAPKAPK-2, Phospho MEK1/2, phospho p38 MAP Kinase, Phospho p44/42 MAPK, Phospho p53, Phospho PKC, Phospho S6 Ribosomal Protein, Phospho Src, phospho-Akt, Phospho-Bad, Phospho-IKB-a, phospho-mTOR, Phospho-NF-kappaB p65, Phospho-p38, Phospho-p44/42 MAPK, Phospho-p70 S6 Kinase, Phospho-Rb, phospho-Smad2, PIM1, PIM2, PKC β, Podocalyxin, PR, PTEN, R1, Rb 4H1, R-Cadherin, ribonucleotide Reductase, RRM1, RRM11, SLC7A5, NDRG, HTF9C, HTF9C, CEACAM, p33, S6 Ribosomal Protein, Src, Survivin, Synapopodin, Syndecan 4, Talin, Tensin, Thymidylate Synthase, Tuberlin, VCAM-1, VEGF, Vimentin, Agglutinin, YES, ZAP-70 and ZEB.
- Cell cycle associated markers include apoptosis protease activating factor-1, bcl-w, bcl-x, bromodeoxyuridine, CAK (cdk-activating kinase), cellular apoptosis susceptibility protein (CAS),
caspase 2,caspase 8, CPP32 (caspase-3), CPP32 (caspase-3), cyclin dependent kinases, cyclin A, cyclin B1, cyclin D1, cyclin D2, cyclin D3, cyclin E, cyclin G, DNA fragmentation factor (N-terminus), Fas (CD95), Fas-associated death domain protein, Fas ligand, Fen-1, IPO-38, Mc1-1, minichromosome maintenance proteins, mismatch repair protein (MSH2), poly (ADP-Ribose) polymerase, proliferating cell nuclear antigen, p16 protein, p27 protein, p34cdc2, p57 protein (Kip2), p105 protein,Stat 1 alpha, topoisomerase I, topoisomerase II alpha, topoisomerase III alpha, topoisomerase II beta. - Neural tissue and tumour markers include alpha B crystallin, alpha-internexin, alpha synuclein, amyloid precursor protein, beta amyloid, calbindin, choline acetyltransferase, excitatory
amino acid transporter 1, GAP43, glial fibrillary acidic protein,glutamate receptor 2, myelin basic protein, nerve growth factor receptor (gp75), neuroblastoma marker, neurofilament 68 kD, neurofilament 160 kD,neurofilament 200 kD, neuron specific enolase, nicotinic acetylcholine receptor alpha4, nicotinic acetylcholine receptor beta2, peripherin,protein gene product 9, S-100 protein, serotonin, SNAP-25, synapsin I, synaptophysin, tau, tryptophan hydroxylase, tyrosine hydroxylase, ubiquitin. - Cluster differentiation markers include CD1a, CD1b, CD1c, CD1d, CD1e, CD2, CD3delta, CD3epsilon, CD3gamma, CD4, CD5, CD6, CD7, CD8alpha, CD8beta, CD9, CD10, CD11a, CD11b, CD11c, CDw12, CD13, CD14, CD15, CD15s, CD16a, CD16b, CDw17, CD18, CD19, CD20, CD21, CD22, CD23, CD24, CD25, CD26, CD27, CD28, CD29, CD30, CD31, CD32, CD33, CD34, CD35, CD36, CD37, CD38, CD39, CD40, CD41, CD42a, CD42b, CD42c, CD42d, CD43, CD44, CD44R, CD45, CD46, CD47, CD48, CD49a, CD49b, CD49c, CD49d, CD49e, CD49f, CD50, CD51, CD52, CD53, CD54, CD55, CD56, CD57, CD58, CD59, CDw60, CD61, CD62E, CD62L, CD62P, CD63, CD64, CD65, CD65s, CD66a, CD66b, CD66c, CD66d, CD66e, CD66f, CD68, CD69, CD70, CD71, CD72, CD73, CD74, CDw75, CDw76, CD77, CD79a, CD79b, CD80, CD81, CD82, CD83, CD84, CD85, CD86, CD87, CD88, CD89, CD90, CD91, CDw92, CDw93, CD94, CD95, CD96, CD97, CD98, CD99, CD100, CD101, CD102, CD103, CD104, CD105, CD106, CD107a, CD107b, CDw108, CD109, CD114, CD115, CD116, CD117, CDw119, CD120a, CD120b, CD121a, CDw121b, CD122, CD123, CD124, CDw125, CD126, CD127, CDw128a, CDw128b, CD130, CDw131, CD132, CD134, CD135, CDw136, CDw137, CD138, CD139, CD140a, CD140b, CD141, CD142, CD143, CD144, CDw145, CD146, CD147, CD148, CDw149, CDw150, CD151, CD152, CD153, CD154, CD155, CD156, CD157, CD158a, CD158b, CD161, CD162, CD163, CD164, CD165, CD166, and TCR-zeta.
- Other cellular markers include centromere protein-F (CENP-F), giantin, involucrin, lamin A&C [XB 10], LAP-70, mucin, nuclear pore complex proteins, p180 lamellar body protein, ran, r, cathepsin D, Ps2 protein, Her2-neu, P53, S100, epithelial marker antigen (EMA), TdT, MB2, MB3, PCNA, and Ki67.
- 3. Tissue Staining
- Cell containing samples may be stained using any reagent or biomarker label, such as dyes or stains, histochemicals, or immunohistochemicals that directly react with the specific biomarkers or with various types of cells or cellular compartments. Not all stains/reagents are compatible. Therefore the type of stains employed and their sequence of application should be well considered, but can be readily determined by one of skill in the art. Such histochemicals may be chromophores detectable by transmittance microscopy or fluorophores detectable by fluorescence microscopy. In general, cell containing samples may be incubated with a solution comprising at least one histochemical, which will directly react with or bind to chemical groups of the target. Some histochemicals must be co-incubated with a mordant or metal to allow staining. A cell containing sample may be incubated with a mixture of at least one histochemical that stains a component of interest and another histochemical that acts as a counterstain and binds a region outside the component of interest. Alternatively, mixtures of multiple probes may be used in the staining, and provide a way to identify the positions of specific probes. Procedures for staining cell containing samples are well known in the art.
- The following, non-limiting list provides exemplary chromophores that may be used as histological imaging agents (stains or counterstains) and their target cells, cellular compartments, or cellular components: Eosin (alkaline cellular components, cytoplasm), Hematoxylin (nucleic acids), Orange G (red blood, pancreas, and pituitary cells), Light Green SF (collagen), Romanowsky-Giemsa (overall cell morphology), May-Grunwald (blood cells), Blue Counterstain (Trevigen), Ethyl Green (CAS) (amyloid), Feulgen-Naphthol Yellow S (DNA), Giemsa (differentially stains various cellular compartments), Methyl Green (amyloid), pyronin (nucleic acids), Naphthol-Yellow (red blood cells), Neutral Red (nuclei), Papanicolaou stain (which typically includes a mixture of Hematoxylin, Eosin Y, Orange G and Bismarck Brown mixture (overall cell morphology), Red Counterstain B (Trevigen), Red Counterstain C (Trevigen), Sirius Red (amyloid), Feulgen reagent (pararosanilin) (DNA), Gallocyanin chrom-alum (DNA), Gallocyanin chrom-alum and Naphthol Yellow S (DNA), Methyl Green-Pyronin Y (DNA), Thionin-Feulgen reagent (DNA), Acridine Orange (DNA), Methylene Blue (RNA and DNA), Toluidine Blue (RNA and DNA), Alcian blue (carbohydrates), Ruthenium Red (carbohydrates), Sudan Black (lipids), Sudan IV (lipids), Oil Red-O (lipids), Van Gieson's trichrome stain (acid fuchsin and picric acid mixture) (muscle cells), Masson trichrome stain (hematoxylin, acid fuchsin, and Light Green mixture) (stains collagen, cytoplasm, nucleioli differently), Aldehyde Fuchsin (elastin fibers), and Weigert stain (differentiates reticular and collagenous fibers). A comprehensive list of such stains, their description, and general use is given in R. D. Lillie, “Conn's Biological Stains”, 8th ed., Williams and Wilkins Company, Baltimore, Md. (1969). Suitable mordants and compositions of the preceding are well-known to one of skill in the art.
- The following, non-limiting list provides exemplary fluorescent histological stains and their target cells, cellular compartments, or cellular components if applicable: 4′,6-diamidino-2-phenylindole (DAPI) (nucleic acids), Eosin (alkaline cellular components, cytoplasm), Hoechst 33258 and Hoechst 33342 (two bisbenzimides) (nucleic acids), Propidium Iodide (nucleic acids), Spectrum Orange (nucleic acids), Spectrum Green (nucleic acids), Quinacrine (nucleic acids), Fluorescein-phalloidin (actin fibers), Chromomycin A 3 (nucleic acids), Acriflavine-Feulgen reaction (nucleic acid), Auramine O-Feulgen reaction (nucleic acids), Ethidium Bromide (nucleic acids). Nissl stains (neurons), high affinity DNA fluorophores such as POPO, BOBO, YOYO and TOTO and others, and Green Fluorescent Protein fused to DNA binding protein, such as histones, ACMA, Quinacrine and Acridine Orange.
- A wide variety of proprietary fluorescent organelle-specific probes are commercially available, and include mitochondria-specific probes (MitoFluor and MitoTracker dyes), endoplasmic reticulum (ER) and Golgi probes (ER-Tracker and various ceramide conjugates), and lysosomal probes (LysoTracker dyes). These probes, as well as many nonproprietary fluorescent histochemicals, are available from and extensively described in the Handbook of Fluorescent Probes and
Research Products 8th Ed. (2001), available from Molecular Probes, Eugene, Oreg. - Each cell containing sample may be co-incubated with appropriate substrates for an enzyme that is a cellular component of interest and appropriate reagents that yield colored precipitates at the sites of enzyme activity. Such enzyme histochemical stains are specific for the particular target enzyme. Staining with enzyme histochemical stains may be used to define a cellular component or a particular type of cell. Alternatively, enzyme histochemical stains may be used diagnostically to quantitate the amount of enzyme activity in cells. A wide variety of enzymatic substrates and detection assays are known and described in the art.
- Acid phosphatases may be detected through several methods. In the Gomori method for acid phosphatase, a cell preparation is incubated with glycerophosphate and lead nitrate. The enzyme liberates phosphate, which combines with lead to produce lead phosphate, a colorless precipitate. The tissue is then immersed in a solution of ammonium sulfide, which reacts with lead phosphate to form lead sulfide, a black precipitate. Alternatively, cells may be incubated with a solution comprising pararosanilin-HCl, sodium nitrite, napthol ASB1 phosphate (substrate), and veronal acetate buffer. This method produces a red precipitate in the areas of acid phosphatase activity. Owing to their characteristic content of acid phosphatase, lysosomes can be distinguished from other cytoplasmic granules and organelles through the use of this assay.
- Dehydrogenases may be localized by incubating cells with an appropriate substrate for the species of dehydrogenase and tetrazole. The enzyme transfers hydrogen ions from the substrate to tetrazole, reducing tetrazole to formazan, a dark precipitate. For example, NADH dehydrogenase is a component of complex I of the respiratory chain and is localized predominantly to the mitochondria.
- Other enzymes for which well-known staining techniques have been developed, and their primary cellular locations or activities, include but are not limited to the following: ATPases (muscle fibers), succinate dehydrogenases (mitochondria), cytochrome c oxidases (mitochondria), phosphorylases (mitochondria), phosphofructokinases (mitochondria), acetyl cholinesterases (nerve cells), lactases (small intestine), leucine aminopeptidases (liver cells), myodenylate deaminases (muscle cells), NADH diaphorases (erythrocytes), and sucrases (small intestine).
- Immunohistochemistry is among the most sensitive and specific histochemical techniques. Each sample t may be combined with a labeled binding composition comprising a specifically binding probe. Various labels may be employed, such as fluorophores, or enzymes that produce a product that absorbs light or fluoresces. A wide variety of labels are known that provide for strong signals in relation to a single binding event. Multiple probes used in the staining may be labeled with more than one distinguishable fluorescent label. These color differences provide a way to identify the positions of specific probes. The method of preparing conjugates of fluorophores and proteins, such as antibodies, is extensively described in the literature and does not require exemplification here.
- Although there are at least 120,000 commercially available antibodies, exemplary primary antibodies, which are known to specifically bind cellular components and are presently employed as components in immunohistochemical stains used for research and, in limited cases, for diagnosis of various diseases, include, for example, anti-estrogen receptor antibody (breast cancer), anti-progesterone receptor antibody (breast cancer), anti-p53 antibody (multiple cancers), anti-Her-2/neu antibody (multiple cancers), anti-EGFR antibody (epidermal growth factor, multiple cancers), anti-cathepsin D antibody (breast and other cancers), anti-Bcl-2 antibody (apoptotic cells), anti-E-cadherin antibody, anti-CA125 antibody (ovarian and other cancers), anti-CA15-3 antibody (breast cancer), anti-CA19-9 antibody (colon cancer), anti-c-erbB-2 antibody, anti-P-glycoprotein antibody (MDR, multi-drug resistance), anti-CEA antibody (carcinoembryonic antigen), anti-retinoblastoma protein (Rb) antibody, anti-ras oneoprotein (p21) antibody, anti-Lewis X (also called CD15) antibody, anti-Ki-67 antibody (cellular proliferation), anti-PCNA (multiple cancers) antibody, anti-CD3 antibody (T-cells), anti-CD4 antibody (helper T cells), anti-CD5 antibody (T cells), anti-CD7 antibody (thymocytes, immature T cells, NK killer cells), anti-CD8 antibody (suppressor T cells), anti-CD9/p24 antibody (ALL), anti-CD10 (also called CALLA) antibody (common acute lymphoblasic leukemia), anti-CD11c antibody (Monocytes, granulocytes, AML), anti-CD13 antibody (myelomonocytic cells, AML), anti-CD14 antibody (mature monocytes, granulocytes), anti-CD15 antibody (Hodgkin's disease), anti-CD19 antibody (B cells), anti-CD20 antibody (B cells), anti-CD22 antibody (B cells), anti-CD23 antibody (activated B cells, CLL), anti-CD30 antibody (activated T and B cells, Hodgkin's disease), anti-CD31 antibody (angiogenesis marker), anti-CD33 antibody (myeloid cells, AML), anti-CD34 antibody (endothelial stem cells, stromal tumors), anti-CD35 antibody (dendritic cells), anti-CD38 antibody (plasma cells, activated T, B, and myeloid cells), anti-CD 41 antibody (platelets, megakaryocytes), anti-LCA/CD45 antibody (leukocyte common antigen), anti-CD45RO antibody (helper, inducer T cells), anti-CD45RA antibody (B cells), anti-CD39, CD100 antibody, anti-CD95/Fas antibody (apoptosis), anti-CD99 antibody (Ewings Sarcoma marker, MIC2 gene product), anti-CD106 antibody (VCAM-1; activated endothelial cells), anti-ubiquitin antibody (Alzheimer's disease), anti-CD71 (transferrin receptor) antibody, anti-c-myc (oncoprotein and a hapten) antibody, anti-cytokeratins (transferrin receptor) antibody, anti-vimentins (endothelial cells) antibody (B and T cells), anti-HPV proteins (human papillomavirus) antibody, anti-kappa light chains antibody (B cell), anti-lambda light chains antibody (B cell), anti-melanosomes (HMB45) antibody (melanoma), anti-prostate specific antigen (PSA) antibody (prostate cancer), anti-S-100 antibody (melanoma, salvary, glial cells), anti-tau antigen antibody (Alzheimer's disease), anti-fibrin antibody (epithelial cells), anti-keratins antibody, anti-cytokeratin antibody (tumor), anti-alpha-catenin (cell membrane), anti-Tn-antigen antibody (colon carcinoma, adenocarcinomas, and pancreatic cancer); anti-1,8-ANS (1-Anilino Naphthalene-8-Sulphonic Acid) antibody; anti-C4 antibody; anti-2C4 CASP Grade antibody; anti-2C4 CASP a antibody; anti-HER-2 antibody; anti-Alpha B Crystallin antibody; anti-Alpha Galactosidase A antibody; anti-alpha-Catenin antibody; anti-human VEGF R1 (Flt-1) antibody; anti-integrin B5 antibody; anti-integrin beta 6 antibody; anti-phospho-SRC antibody; anti-Bak antibody; anti-BCL-2 antibody; anti-BCL-6 antibody; anti-Beta Catanin antibody; anti-Beta Catenin antibody; anti-Integrin alpha V beta 3 antibody; anti-c ErbB-2 Ab-12 antibody; anti-Calnexin antibody; anti-Calreticulin antibody; anti-Calreticulin antibody; anti-CAM5.2 (Anti-Cytokeratin Low mol. Wt.) antibody; anti-Cardiotin (R2G) antibody; anti-Cathepsin D antibody; Chicken polyclonal antibody to Galactosidase alpha; anti-c-Met antibody; anti-CREB antibody; anti-COX6C antibody; anti-Cyclin D1 Ab-4 antibody; anti-Cytokeratin antibody; anti-Desmin antibody; anti-DHP (1-6 Diphenyl-1,3,5-Hexatriene) antibody; DSB-X Biotin Goat Anti Chicken antibody; anti-E-Cadherin antibody; anti-EEA1 antibody; anti-EGFR antibody; anti-EMA (Epithelial Membrane Antigen) antibody; anti-ER (Estrogen Receptor) antibody; anti-ERB3 antibody; anti-ERCC1 ERK (Pan ERK) antibody; anti-E-Selectin antibody; anti-FAK antibody; anti-Fibronectin antibody; FITC-Goat Anti Mouse IgM antibody; anti-FOXP3 antibody; anti-GB3 antibody; anti-GFAP (Glial Fibrillary Acidic Protein) antibody; anti-Giantin antibody; anti-GM130 antibody; anti-Goat a h Met antibody; anti-Golgin 97 antibody; anti-GRB2 antibody; anti-GRP78BiP antibody; anti-GSK-3Beta antibody; anti-Hepatocyte antibody; anti-HER-2 antibody; anti-HER-3 antibody; anti-Histone 3 antibody; anti-Histone 4 antibody; anti-Histone H2A X antibody; anti-Histone H2B antibody; anti-HSP70 antibody; anti-ICAM-1 antibody; anti-IGF-1 antibody; anti-IGF-1 Receptor antibody; anti-IGF-1 Receptor Beta antibody; anti-IGF-II antibody; anti-IKB-Alpha antibody; anti-IL6 antibody; anti-IL8 antibody; anti-Integrin beta 3 antibody; anti-Integrin beta 5 antibody; anti-Integrin b8 antibody; anti-Jagged 1 antibody; anti-protein kinase C Beta2 antibody; anti-LAMP-1 antibody; anti-M6P (Mannose 6-Phosphate Receptor) antibody; anti-MAPKAPK-2 antibody; anti-MEK 1 antibody; anti-MEK 2 antibody; anti-Mitochondrial Antigen antibody; anti-Mitochondrial Marker antibody; anti-Mitotracker Green FM antibody; anti-MMP-2 antibody; anti-MMP9 antibody; anti-Na+/K ATPase antibody; anti-Na+/K ATPase Alpha 1 antibody; anti-Na+/K ATPase Alpha 3 antibody; anti-N-Cadherin antibody; anti-Nephrin antibody; anti-NF-KB p50 antibody; anti-NF-KB P65 antibody; anti-Notch 1 antibody; anti-OxPhos Complex IV—Alexa488 Conjugate antibody; anti-p130Cas antibody; anti-P38 MAPK antibody; anti-p44/42 MAPK antibody; anti-P504S Clone 13H4 antibody; anti-P53 antibody; anti-P70 S6K antibody; anti-P70 phospho kinase blocking peptide antibody; anti-Pan Cadherin antibody; anti-Paxillin antibody; anti-P-Cadherin antibody; anti-PDI antibody; anti-Phospho AKT antibody; anti-Phospho CREB antibody; anti-Phospho GSK-3-beta antibody; anti-Phospho GSK-3 Beta antibody; anti-Phospho H3 antibody; anti-Phospho MAPKAPK-2 antibody; anti-Phospho MEK antibody; anti-Phospho p44/42 MAPK antibody; anti-Phospho p53 antibody; anti-Phospho-NF-KB p65 antibody; anti-Phospho-p70 S6 Kinase antibody; anti-Phospho PKC (Pan) antibody; anti-Phospho S6 Ribosomal Protein antibody; anti-Phospho Src antibody; anti-Phospho-Bad antibody; anti-Phospho-HSP27 antibody; anti-Phospho-IKB-a antibody; anti-Phospho-p44/42 MAPK antibody; anti-Phospho-p70 S6 Kinase antibody; anti-Phospho-Rb (Ser807/811) (Retinoblastoma) antibody; anti-Phsopho HSP-7 antibody; anti-Phsopho-p38 antibody; anti-Pim-1 antibody; anti-Pim-2 antibody; anti-PKC β antibody; anti-PKC β11 antibody; anti-Podocalyxin antibody; anti-PR antibody; anti-PTEN antibody; anti-R1 antibody; anti-Rb 4H1(Retinoblastoma) antibody; anti-R-Cadherin antibody; anti-RRM1 antibody; anti-S6 Ribosomal Protein antibody; anti-S-100 antibody; anti-Synaptopodin antibody; anti-Synaptopodin antibody; anti-Syndecan 4 antibody; anti-Talin antibody; anti-Tensin antibody; anti-Tuberlin antibody; anti-Urokinase antibody; anti-VCAM-1 antibody; anti-VEGF antibody; anti-Vimentin antibody; anti-ZAP-70 antibody; and anti-ZEB.
- Fluorophores that may be conjugated to a primary antibody include but are not limited to Fluorescein, Rhodamine, Texas Red, Cy2, Cy3, Cy5, VECTOR Red, ELF™ (Enzyme-Labeled Fluorescence), Cy0, Cy0.5, Cy1, Cy1.5, Cy3, Cy3.5, Cy5, Cy7, Fluor X, Calcein, Calcein-AM, CRYPTOFLUOR™'S, Orange (42 kDa), Tangerine (35 kDa), Gold (31 kDa), Red (42 kDa), Crimson (40 kDa), BHMP, BHDMAP, Br-Oregon, Lucifer Yellow, Alexa dye family, N-[6-(7-nitrobenz-2-oxa-1,3-diazol-4-yl)-amino]caproyl] (NBD), BODIPY™, boron dipyrromethene difluoride, Oregon Green, MITOTRACKER™ Red, DiOC7 (3), DiIC18, Phycoerythrin, Phycobiliproteins BPE (240 kDa) RPE (240 kDa) CPC (264 kDa) APC (104 kDa), Spectrum Blue, Spectrum Aqua, Spectrum Green, Spectrum Gold, Spectrum Orange, Spectrum Red, NADH, NADPH, FAD, Infra-Red (IR) Dyes, Cyclic GDP-Ribose (cGDPR), Calcofluor White, Lissamine, Umbelliferone, Tyrosine and Tryptophan. A wide variety of other fluorescent probes are available from and/or extensively described in the Handbook of Fluorescent Probes and
Research Products 8th Ed. (2001), available from Molecular Probes, Eugene, Oreg., as well as many other manufacturers. - Further amplification of the signal can be achieved by using combinations of specific binding members, such as antibodies and anti-antibodies, where the anti-antibodies bind to a conserved region of the target antibody probe, particularly where the antibodies are from different species. Alternatively specific binding ligand-receptor pairs, such as biotin-streptavidin, may be used, where the primary antibody is conjugated to one member of the pair and the other member is labeled with a detectable probe. Thus, one effectively builds a sandwich of binding members, where the first binding member binds to the cellular component and serves to provide for secondary binding, where the secondary binding member may or may not include a label, which may further provide for tertiary binding where the tertiary binding member will provide a label.
- The secondary antibody, avidin, strepavidin or biotin are each independently labeled with a detectable moiety, which can be an enzyme directing a colorimetric reaction of a substrate having a substantially non-soluble color reaction product, a fluorescent dye (stain), a luminescent dye or a non-fluorescent dye. Examples concerning each of these options are listed below.
- In principle, any enzyme that (i) can be conjugated to or bind indirectly to (e.g., via conjugated avidin, strepavidin, biotin, secondary antibody) a primary antibody, and (ii) uses a soluble substrate to provide an insoluble product (precipitate) could be used.
- The enzyme employed can be, for example, alkaline phosphatase, horseradish peroxidase, beta-galactosidase and/or glucose oxidase; and the substrate can respectively be an alkaline phosphatase, horseradish peroxidase, beta.-galactosidase or glucose oxidase substrate.
- Alkaline phosphatase (AP) substrates include, but are not limited to, AP-Blue substrate (blue precipitate, Zymed catalog p. 61); AP-Orange substrate (orange, precipitate, Zymed), AP-Red substrate (red, red precipitate, Zymed), 5-bromo, 4-chloro, 3-indolyphosphate (BCIP substrate, turquoise precipitate), 5-bromo, 4-chloro, 3-indolyl phosphate/nitroblue tetrazolium/iodonitrotetrazolium (BCIP/INT substrate, yellow-brown precipitate, Biomeda), 5-bromo, 4-chloro, 3-indolyphosphate/nitroblue tetrazolium (BCIP/NBT substrate, blue/purple), 5-bromo, 4-chloro, 3-indolyl phosphate/nitroblue tetrazolium/iodonitrotetrazolium (BCIP/NBT/INT, brown precipitate, DAKO, Fast Red (Red), Magenta-phos (magenta), Naphthol AS-BI-phosphate (NABP)/Fast Red TR (Red), Naphthol AS-BI-phosphate (NABP)/New Fuchsin (Red), Naphthol AS-MX-phosphate (NAMP)/New Fuchsin (Red), New Fuchsin AP substrate (red), p-Nitrophenyl phosphate (PNPP, Yellow, water soluble), VECTOR™ Black (black), VECTOR™ Blue (blue), VECTOR™ Red (red), Vega Red (raspberry red color).
- Horseradish Peroxidase (HRP, sometimes abbreviated PO) substrates include, but are not limited to, 2,2′ Azino-di-3-ethylbenz-thiazoline sulfonate (ABTS, green, water soluble), aminoethyl carbazole, 3-amino, 9-ethylcarbazole AEC (3A9EC, red). Alpha-naphthol pyronin (red), 4-chloro-1-naphthol (4C1N, blue, blue-black), 3,3′-diaminobenzidine tetrahydrochloride (DAB, brown), ortho-dianisidine (green), o-phenylene diamine (OPD, brown, water soluble), TACS Blue (blue), TACS Red (red), 3,3′,5,5′Tetramethylbenzidine (TMB, green or green/blue), TRUE BLUE™ (blue), VECTOR™ VIP (purple), VECTOR™ SG (smoky blue-gray), and Zymed Blue HRP substrate (vivid blue).
- Glucose oxidase (GO) substrates, include, but are not limited to, nitroblue tetrazolium (NBT, purple precipitate), tetranitroblue tetrazolium (TNBT, black precipitate), 2-(4-iodophenyl)-5-(4-nitorphenyl)-3-phenyltetrazolium chloride (INT, red or orange precipitate), Tetrazolium blue (blue), Nitrotetrazolium violet (violet), and 3-(4,5-dimethylthiazol-2-yl)-2,5-diphenyltetrazolium bromide (MTT, purple). All tetrazolium substrates require glucose as a co-substrate. The glucose gets oxidized and the tetrazolium salt gets reduced and forms an insoluble formazan that forms the color precipitate.
- Beta-galactosidase substrates, include, but are not limited to, 5-bromo-4-chloro-3-indoyl beta-D-galactopyranoside (X-gal, blue precipitate). The precipitates associated with each of the substrates listed have unique detectable spectral signatures (components).
- The enzyme can also be directed at catalyzing a luminescence reaction of a substrate, such as, but not limited to, luciferase and aequorin, having a substantially non-soluble reaction product capable of luminescencing or of directing a second reaction of a second substrate, such as but not limited to, luciferine and ATP or coelenterazine and Ca.2+, having a luminescencing product.
- The following references, which are incorporated herein in their entireties, provide additional examples: J. M Elias (1990) Immunohistopathology: A practical approach to diagnosis. ASCP Press (American Society of Clinical Pathologists), Chicago; J. F. McGinty, F. E. Bloom (1983) Double immunostaining reveals distinctions among opioidpeptidergic neurons in the medial basal hypothalamus. Brain Res. 278: 145-153; and T. Jowett (1997) Tissue In situ Hybridization: Methods in Animal Development. John Wiley & Sons, Inc., New York; J Histochem Cytochem 1997 December 45(12):1629-1641.
- Nucleic acid biomarkers may be detected using in-situ hybridization (ISH). In general, a nucleic acid sequence probe is synthesized and labeled with either a fluorescent probe or one member of a ligand:receptor pair, such as biotin/avidin, labeled with a detectable moiety. Exemplary probes and moieties are described in the preceding section. The sequence probe is complementary to a target nucleotide sequence in the cell. Each cell or cellular compartment containing the target nucleotide sequence may bind the labeled probe. Probes used in the analysis may be either DNA or RNA oligonucleotides or polynucleotides and may contain not only naturally occurring nucleotides but their analogs such as dioxygenin dCTP, biotin dcTP 7-azaguanosine, azidothymidine, inosine, or uridine. Other useful probes include peptide probes and analogues thereof, branched gene DNA, peptidomimetics, peptide nucleic acids, and/or antibodies. Probes should have sufficient complementarity to the target nucleic acid sequence of interest so that stable and specific binding occurs between the target nucleic acid sequence and the probe. The degree of homology required for stable hybridization varies with the stringency of the hybridization. Conventional methodologies for ISH, hybridization and probe selection are described in Leitch, et al. In Situ Hybridization: a practical guide, Oxford BIOS Scientific Publishers, Microscopy Handbooks v. 27 (1994); and Sambrook, J., Fritsch, E. F., Maniatis, T., Molecular Cloning: A Laboratory Manual, Cold Spring Harbor Press (1989).
- In one embodiment, the optimal dilution of a reagent used in the present assays, such as a staining or IHC reagent, described herein may be quantitatively and automatically determined. In one embodiment, multiple dilution sets are imaged, where each of the dilution sets consist of a different respective dilution value and a respective arrangement of immunoassay staining intensity values. A respective dynamic range metric is determined for each of the multiple dilution sets relative to the respective arrangement of immunoassay staining intensity values. Having found the respective dynamic range metric, a dilution set having the numerically optimal dynamic range metric is selected and the dilution value of that dilution set is selected as being representative of an optimal dilution level of the reagent for use in the present invention.
- For example, a slide-mounted tissue sample is stained with one of the dilution series of the primary antibody utilizing common immunohistochemistry techniques described above. The resulting stained specimens are each imaged using a system for viewing the detectable signal and acquiring an image, such as a digital image of the staining. Methods for image acquisition are described in more detail below. The images thus obtained are then used by the method of the invention for quantitatively determining the optimal concentration of the reagent for use in the present invention. Each tissue sample set includes a multiple different tissue samples prepared with respective titer dilution, such that different tissue sample sets have different respective titer dilutions. A quantitative analysis is performed of the pixelized images of the multiple tissue sample sets.
- For each dilution set of the multiple dilution sets, a dynamic range metric and a specificity of staining are each calculated. In one embodiment of the present invention, the dynamic range metric is an average absolute deviation. In another embodiment of the present invention, the data is log transformed, and the dynamic range metric is a weighted combination of a standard deviation, a variance, and a swing ratio. The specificity of staining is calculated to maximize specific signal while minimizing noise. The specificity of staining may be computed by summing each of a set of immunoassay staining intensity values associated with a stain-specific compartment and then computing a stain specific average for the stain-specific compartment, and also summing each of a set of immunoassay staining intensity values associated with a non-stain specific compartment and then computing a non-stain-specific average. Following the calculation of these two averages, the stain specific average can be divided by the non-stain specific average to produce the specificity of staining, or a Signal to Noise Metric. In such an embodiment, a numerically large sensitivity of staining value is optimal. In another embodiment the non-stain specific average is divided by the stain specific average to produce the sensitivity of staining. In such an embodiment, a numerically small sensitivity of staining value is optimal. Following the calculation of the dynamic range metric and sensitivity of staining for each of the dilution sets, the dynamic range metric and sensitivity of staining can be combined with one another to generate a combination value for each dilution set. The resulting combination values are used to select the dilution set with the most numerically optimal combination value. Associated with the selected dilution set is a dilution value representative of an optimal dilution of a reagent. Optionally, the process performs multiple comparisons to attempt to identify multiple stain specific and non-stain specific compartments.
- 4. Instrument Standardization and Image Collection
- Once the sample has been stained, any optical or non-optical imaging device can be used to detect the stain or biomarker label, such as, for example, upright or inverted optical microscopes, scanning confocal microscopes, cameras, scanning or tunneling electron microscopes, scanning probe microscopes, and imaging infrared detectors etc.
- In one embodiment, the imaging device is a microscope system that includes an illumination source configured to illuminate a target sample, optics configured to produce a magnified image of the illuminated target sample, and a detector, such as a digital camera, configured to capture a digital image of the magnified image. Quantitative results can be obtained through manipulation of the captured digital images. Such image manipulation can include image processing techniques known to those skilled in the art. In at least some embodiments, one or more of such image capture and image manipulation is accomplished with the aid of a processor. The processor can include a computer implementing pre-programmed instructions.
- For example, a tissue sample or tissue microarray can be imaged as follows: a user places the microarray on a sample stage. The user adjusts the sample stage so that the first region of interest or first histospot is at the center of the field of view and focused on by the CCD camera. The objective lens should be adjusted to the appropriate resolution, for example, a 0.6 millimeter sample can be viewed at 10× magnification. If paraffin mounted, the sample generally correspond to areas of higher light intensity than the surrounding paraffin, as assessed through various means including signals derived from the visible light scattering of stained tissues, tissue autofluorescence or from a fluorescent tag. A computer can acquire a low-resolution image (e.g. 64 pixel×64 pixel with 16 bit resolution) using computer software (Softworx 2.5, Applied Precision, Issaquah, Wash.) and an imaging platform (e.g., Deltavision). A computer automatically translates sample stage by an amount approximately equal to a field of view. The computer then acquires a second low-resolution image. This process is repeated until the computer has acquired images of the entire tissue sample or microarray. Using commercially available software, the computer then generates a composite image of the entire tissue sample or microarray.
- To optionally standardize quantitative results obtained using a particular system, a system intrinsic factor can be determined to account for intensity variability of the excitation source and device variability, e.g., along the optical path. In order to achieve this, a measurement of the intensity of the excitation light source may also be obtained for example by using an inline lamp intensity measuring tool. Also a measurement of a standard or a calibration sample, e.g, a calibration microscope slide may be obtained using the particular system to define one or more optical path factors. Use of such a calibration slide is particularly useful for fluorescence-based IHC applications, in which sample fluorescent regions of the calibration slide emit radiation within respective bandwidths. The fluoresced emissions allow for characterization of an optical path at each of the one or more respective wavelengths. These measurement can be obtained simultaneously or separately.
- The system also optionally includes a calibration device configured to redirect a standardized sample of the illumination source to the detector, although it has been found that the methods of the present invention do not require the use of such device. In at least some embodiments a system processor is configured to determine a correction factor for a given microscope. The correction factor can be determined from a measurement of the standardized sample of the illumination source obtained using the calibration device. The correction factor can be used (e.g., by the processor) to correct for any variations in intensity of a detected image of the target sample. For example, a calibration cube factor (CC) is determined by comparison to a universal standard cube. A light source factor (LS) is determined by summing the pixel intensities of a captured image of the calibration surface. The optical path factor (OP) is the quotient of the average total light intensity of 16 images taken for each cube/sample combination. The CC and OP factors are intrinsic to the specific hardware system being studied and need only be calculated once or at an interval where one would suspect some type of modification in the optics has occurred.
- The standardized AQUA® score is shown below:
-
Standardized AQUA® score=Raw AQUA® score*CC factor*LS factor*OP factor - where the CC and OP factors are defined upon system set-up/construction and the LS factor is measured simultaneously.
- In some embodiments, a system processor is configured with instructions (e.g., software) for obtaining the calibration factor. Alternatively or in addition, the system processor is configured with instructions for using the correction factor to correct detected images. Such calibration is useful to reduce variability in intensity of the illumination source within the same microscope system, as may occur over time, and between quantitative results obtained using different microscope systems and/or different illumination sources.
- 5. Image Optimization
- a. Exposure Time
- The dynamic range of pixel intensity data from the collected image may be optionally optimized to further reduce run-to-run variations, especially due to staining intensity and equipment differences that affect exposure times. The process includes capturing an image of a subject within the field of view of a camera at a first exposure time, resulting in a captured image comprising a predetermined number of pixels, wherein each pixel has an intensity value. A frequency distribution of pixel intensities of the captured image is queried to determine a region of the greatest frequency occurrence of the pixel intensities of the frequency distribution. Exposure time is then adjusted from the first exposure time to shift that region of highest frequency distribution toward the middle of the range of intensity values. In other words, the center of mass (COM) of a histogram, or frequency distribution is determined from which an adjusted exposure time is calculated to achieve an optimized dynamic range of pixel intensities. A second image of the subject can then be captured at the adjusted exposure time resulting in an image having an optimal dynamic range.
- There are various ways to correct exposure for the methods described herein. One correction technique is to iteratively acquire a new image at a longer or shorter exposure time than that of the previous image until saturated pixels are minimized and the optimal dynamic range is achieved. This iterative process allows for a quick adjustment in exposure time to bring the pixel intensities down within the range of detection to optimize exposure and dynamic range. However this simplistic approach may also cause the system to overcorrect for saturated pixels and set the new exposure time too low. Therefore it is desirable to modify the aggressiveness of the correction to the exposure time to be proportional to how many pixels are saturated in the previous image.
- To achieve this the new exposure time may be calculated as:
-
- where E is the new exposure time, E′ is the currently set exposure time, A is an aggression level, SL is the saturation limit, CCDx and CCDy represent the pixel dimensions of the captured image, and P is the count of pixels at maximum intensity. The aggression level, A, may vary but, generally, the values that one would want to choose would depend upon the amount by which images tend to be over saturated. A value of zero (0) for A represents a minimum value for which the exposure time would be halved. A practical maximum value for A is about 10, after which the exposure time will not change enough for the algorithm to be useful. In a preferred embodiment of the invention, the value for A can fall in the range of about 0≦A≦4.5. More preferably, A is set at about 3.5.
- The procedure of reducing exposure time to ensure the image is not overexposed is typically a multi-step process. In an exemplary embodiment, a 256 bin histogram is generated first for an 8-bit per pixel image obtained from the camera at the current exposure time, E′. The number of saturated pixels are identified and compared to a predetermined saturation threshold value. Then, if the image is at or below the saturation limit, the over-exposure procedure is exited. However, if the image is over exposed, the exposure time is decreased. The new, decreased exposure time can vary based upon the number of currently over exposed pixels. In an exemplary embodiment, a value S can be determined as
-
- in which A is an “aggression level” currently defined at 3.5 and M is the count of pixels at maximum intensity. Then, the next exposure time E is derived as follows:
-
E=E′−E 0.5 1+S - When the number of over exposed pixels is much greater than the saturation limit, E≈E′−0.5E′ (e.g., the exposure time would be halved). The minimum amount of change to the current exposure time occurs when the number of over saturated pixels is very nearly equal to the saturation limit, in which case E≈E′−0.088E′. Thus, because the algorithm is exited when the image is at or below the saturation limit, the number of saturated pixels will never equal the saturation limit. The procedure of reducing exposure time can be repeated in an iterative manner until the amount of overexposure is within a chosen threshold, or until a maximum number of iterations has been accomplished. In either instance the over-exposure correction routine is then exited.
- An alternative and equally viable process for correcting for overexposure is to acquire a new image at a minimum exposure time, then proceed with optimizing the exposure time by calculating the COM and bringing it within range of the midpoint, as described above.
- b. Image Validation
- The quality of the image may be automatically assessed and optimized to reduce variations due to one or more factors selected from stain uniformity, stain quality, tissue sufficiency, tissue sample position, signal saturation, focus, and signal intensity. Thus, images can be corrected for false readings due to no sample, too little sample, debris, multiple sample or “split image” (in the case of TMA analysis) and poor focus such that invalid images may be excluded from subsequent data analysis. Each stain may be validated independently from other stains on the same or different images. These assessments and optimizations may be performed automatically by an image-processing program with particular threshold values fixed in the program or provided by the user.
- To optionally determine stain uniformity across the slide or at least the imaged portion of the slide, the intensity values of vertical columns of the image pixels are combined along the respective column and plotted across the x-axis. The combination can be a straightforward addition of pixel intensity values along the column. Alternatively or in addition, the combination can be a statistically arrived at value, such as an average intensity value of all of the pixels in the column. For example, with an image using 8 bits to represent intensity, there are 256 possible pixel intensity values for each pixel. The pixel intensity values span a range from black (e.g., “0”) to white (e.g., “255”). Values in between black and white are associated with varying shades of gray. The relative maximum intensity values, or peak values, may be compared between different regions of the image to determine stain uniformity and positional bias. If a bias is found, the image may be excluded from further analysis.
- To optionally determine stain quality, the staining intensity of the compartment specific stain inside the compartment is measured by analyzing pixels intensity of the digital image that are identified as part of the compartment. For example to measure the stain quality of a nuclear stain, total stain intensity within the nuclear cellular compartment may be formulated as a combination, such as a sum of the intensities of pixels identified as representing nuclei. Total stain intensity outside of the nuclear cellular compartment can be similarly formulated as a sum of the intensities of pixels identified as not nuclear. The two values for nuclei and non-nuclear are compared. For example, the two values can be combined in a ratio, the single value of the ratio indicative of the comparison. For example, the combined nuclei intensity can be divided by the combined non-nuclear intensity by the image processing program to provide a tissue stain quality ratio. A low ratio, such as a ratio approaching 1, is indicative of poor staining quality or poor tissue integrity. An acceptable minimum staining quality threshold can be fixed or settable by a user. Such samples identified as failing to meet the minimum staining threshold can be excluded from the data set and from further analysis by the validation program.
- Tissue sufficiency may be analyzed by counting the pixels of an image with signal intensities above a threshold intensity then determining if the total number of positive pixels meets a minimum criterion for sufficient tissue. Likewise, the percent positive pixels to the total may be used as the criterion.
- When analyzing tissue microarrays, tissue sample position may be assessed by calculating the average pixel intensity in each of multiple different sections identified within the field of view. Individual samples or histospots must be identified to determine position, which may be used by comparing the position of the edge of the sample with the center of the sample. The sample edge is determined based on pixel intensity of rectangular areas to assess if the centered properly, and the central pixel intensity is measured to determine if the edges are not due more than one sample. Sample edge detection may be performed using a discrete differentiation operator, such as a Sobel edge detector, or any other number of edge detectors well-known in the art. Incorrectly positioned samples or split spots containing more than one target may then be identified and excluded from further analysis.
- Focus of the sample may be assessed, such as by determining a kurtosis value for the pixel intensities of the image. The staining intensity values of pixels in a digitized image can be plotted in a histogram. The distribution can be analyzed as an indication of focus. An in focus image will typically have a pixel intensity distribution with a relatively sharp, defined peak (higher kurtosis) compared to an out of focus image which will have a pixel intensity distribution with a flattened peak (lower kurtosis). The sharpness or flatness of such a distribution can be represented in a single value, such as a kurtosis value. A higher kurtosis value is indicative of a relatively sharp defined peak; whereas, a lower kurtosis value is indicative of a flattened peak.
- Kurtosis is a measure of whether the data are peaked or flat relative to a normal distribution. That is, data sets with high kurtosis tend to have a distinct peak near the mean, decline rather rapidly, and have heavy tails. Data sets with low kurtosis tend to have a flat top near the mean rather than a sharp peak. For univariate data Y1, Y2, . . . , YN, the formula for kurtosis is:
-
- where
Y is the mean, s is the standard deviation, and N is the number of data points. Excess kurtosis can be defined as -
- so that the standard normal distribution has a kurtosis of zero. Positive kurtosis indicates a “peaked” distribution and negative kurtosis indicates a “flat” distribution. Images with negative kurtosis may then be excluded from further analysis.
- Signal intensity may be assessed by sorting the signal intensity data measured from images acquired in each relevant channel for each histospot and identifying the number of samples with low staining intensities. Such samples may be excluded from further analysis.
- 6. AQUA® Scoring
- Once the image is optimized and validated, with any invalid histospots or images removed, the image is virtually masked, three dimensional approximations of cells in the sample may be generated, and biomarkers are associated with subcellular compartments of individual cells. One such algorithm for automatically performing these tasks is the Automated QUantitative Analysis platform (AQUA® platform). This technique is also described in U.S. Pat. No. 7,219,016 and Camp et al., 2002 Nature Medicine 8(11)1323-1327 which are both specifically incorporated herein by reference in their entirety. However, for the first time, automation of each step is described herein, increasing the ease and reproducibility of this analysis.
- In one embodiment tissue samples are stained with markers that define, for example, the cellular compartments of interest and the specific target (or targets) being studied. Pixel-based local assignment for compartmentalization of expression (PLACE) is the key algorithm that functions to effectively segment image pixels for the purpose of expression compartmentalization. A critical step in this algorithm is the setting of intensity thresholds that are used to delineate background or non-specific pixels from signal-specific pixels. Images that have been “masked” in this way are subsequently combined in a mutually-exclusive fashion such that pixels above the thresholds are assigned to specific cellular compartments. Once pixels have been assigned to each compartment, the signal for the target biomarker can then be averaged over all of the pixels assigned to a given compartment, which is the AQUA® score for that sample.
- For example, a tumor-specific mask may be generated by manually thresholding the image of a marker (cytokeratin) that differentiates tumor from surrounding stroma and/or leukocytes. This creates a binary mask (each pixel is either ‘on’ or ‘off’). Thresholding levels are verified, and adjusted if necessary, by checking a small sample of images and then remaining images are automatically masked using the single determined threshold value. All subsequent image manipulations involve only image information from the masked area. Off target specific images may be clustered to iteratively adjust pixel intensities of nonstandard masked targets. The dilate image processing technique allows for a spatial low pass filter to fill in nearest-neighbor pixels that are surrounded by pixels included in the mask. The erode image processing technique allows for a spatial high pass filter to remove pixels that are not contiguous with the mask or that form structures that are contrary to structures expected for a given slide-mounted tissue sample. Such adjustments allow inclusion of valid but nonconforming samples that may otherwise be excluded from further analysis.
- Next, the signal to noise ratio may be enhanced by correcting for background noise. For example, two images (one in-focus, one out of focus, e.g., taken 6 μm deeper into the sample) are taken of the compartment-specific tags and the target marker. The out of focus image acts as a spatial low pass filter that provides a background value. For example, percentage of the out-of-focus image is subtracted from the in-focus image, based on a pixel-by-pixel analysis of the two images, such as by using an algorithm called RESA (Rapid Exponential Subtraction Algorithm). The RESA algorithm enhances the interface between areas of higher intensity staining and adjacent areas of lower intensity staining, allowing easier assignment of pixels to background and adjacent compartments. Finally, the PLACE algorithm assigns each pixel in the image to a specific cellular compartment. Pixels that cannot be accurately assigned to a compartment within a user-defined degree of confidence are discarded. For example, pixels where the nuclear and cytoplasmic pixel intensities are too similar to be accurately assigned are negated (for example, comprising <8% of the total pixels). Once each pixel is assigned to a cellular compartment (or excluded as described above), the signal in each location is summed to generate the AQUA® score for that sample, as shown in the following equation:
-
- where AQ is the raw AQUA® score, Ti is the ith target intensity, also known as power density, and C, is the ith cell compartment probability. These data are saved and can subsequently be expressed either as a percentage of total signal or as the average signal intensity per compartment area.
- Preferably, the AQUA® score may be automatically normalized, for example, by clustering, to assign pixels to a particular cellular compartment based on intensity data. This clustering allows for further removal of background noise, assignment of specific pixels to a given compartment and probabilistic assignment of pixels to each compartment where there may be overlapping signals. Once pixels are assigned to each compartment (or discarded in the case of noise) the associated target signals can be measured, for example summed and a score calculated.
- The assignment is preferentially determined on an image-to-image basis, rather than setting universal criteria. Furthermore, pixel assignment (e.g., Cy3/Cytokeratin pixels to cytoplasm) is also a function of other compartment images such that consideration is given to the status of pixels in other compartment images. In one embodiment one image is of a first stain that specifically labels a first compartment (e.g., a Cy3/cytokeratin image, representing the cytoplasmic compartment) and a second image is of a second stain that specifically labels a second compartment (e.g., DAPI image, representing the nuclear compartment) and pixel assignments are based on four criteria:
- 1.) Low intensity in both first and second image (e.g., DAPI and Cy3): BACKGROUND: REMOVE
- 2.) High second stain (e.g., DAPI) intensity relative to first stain (Cy3) intensity: SECOND COMPARTMENT (e.g., NUCLEAR)
- 3.) High first stain (e.g., Cy3) intensity relative to second stain (e.g., DAPI) intensity: FIRST COMPARTMENT (e.g., CYTOPLASMIC)
- 4.) High second stain and first stain (e.g., DAPI and Cy3) intensity: INDETERMINANT: REMOVE
- Clustering is a mathematical algorithmic function whereby centroids within data sets are defined by relative distances of each data point to one another, as determined, for example, by Euclidean or log-likelihood distance. While not wishing to be bound by theory, it is believed that clustering pixel intensities from at least two images (e.g., DAPI and Cy3), could result in centroids that define pixels as described, at least, by the above criteria. Because clustering is objective and can be performed individually on each image, clustering is a reliable method for assignment of pixels to compartments, independent of operator intervention.
- In another embodiment, pixels containing signal indicative of both the first and second stain are assigned to compartments by the following method. Every pixel in acquired images has three attributes intensity contribution from compartment marker A, intensity contribution from compartment marker B and an intensity contribution from the target or biomarker of interest. These intensities are measured in their respective fluorescence channels per the experimental configuration. To avoid experimental bias, the target intensity is not manipulated in this current method. Thus, the data for the two compartment attributes can be illustrated in a two dimensional plot schematically.
- Pixels with a strong bias towards either of the axes can be assigned to that compartment (e.g., pixels in regions A and B could be absolutely assigned to compartments A and B respectively). Pixels near the origin represent low intensities for both channels and can be discarded as background along with outlier pixels that have high intensity but similar values. Pixels that remain in region A/B can then be assigned to each compartment based on probability. This assignment allows target signal in those pixels to be distributed across both compartments based on the probability characterization.
- To define the regions described above, for example, for every image, clustering is used to determine three centroids in the data. This method is fully automated and does not require any operator decisions to proceed. The analysis is accomplished by performing k-means clustering on three centroids using Euclidean distances.
- The data are then analyzed as follows: (i) Background and outlier pixels are discarded from further calculation. A pixel is defined as background if its distance to the origin is less than twice that of the background centroid distance to the origin. A pixel is define as an outlier if its intensity exceeds the value defines by the line or plane defined by the outermost centroids; (ii) Pixels in regions A and B are assigned exclusively to those two compartments; (iii) Pixels in the triangular region A/B are then assigned a probability value that allows them to essentially be distributed in multiple compartments. This probability value can be calculated based on distance from the two regions A and B, or, using a shape function that will also assign a probability of each pixel having a contribution from the background region by examining each pixel's distance from the three vertices given by the centroids; (iv) With all pixels assigned, the associated target scores can be summed up for each compartment and a score calculated using standard methods:
-
- where Int is the intensity of the pixel, P is the probability of the pixel being assigned to a particular compartment (ranging from 0 to 1).
- Cutpoints are established using algorithms to separate samples into groups with specific features, such as samples containing tissues with different biomarker expression levels for one or more biomarker, as described in more detail in McCabe et al., J. Natl. Canc. Inst. (2005) 97(24):1808-1815, which is hereby incorporated by reference in its entirety. By reducing sample biomarker quantification results using the methods of the present invention, intra-group variation is minimized, differences between groups are maximized and more easily identified. For instance, a high expression level of a biomarker, represented by a high AQUA® score, may be more tightly correlated with aggressive disease and reduced survival, whereas a lower AQUA® score is not. By reliably distinguishing the two groups, the correlation between a biomarker and disease becomes more clear. Thus, AQUA® scores generated using the methods of the invention provide a reliable assay for comparing sample groups such that the biomarker may be more specifically correlated with the particular characteristics, leading to more reliable diagnosis and prognosis estimation on an individual sample.
- 7. Reproducibility
- Because the variability of AQUA® scores is reduced through automatic instrument standardization, such as exposure optimization, as well as through normalization of the raw AQUA® scores by clustering, as well as by optionally improved image validation, the sensitivity and reproducibility of the assay is enhanced. For example, in one embodiment, the data signal attributed to two or more cell compartments can be more reliably distinguished. In a further embodiment data signal can be distinguished with at least about 90% confidence interval. In a further embodiment, the data signal can be distinguished with about a 95% confidence interval. In a further embodiment, the data signal can be distinguished with about a 99% confidence interval.
- The normalized AQUA® score provides a more reproducible cutpoint determination, leading to greater agreement of sample classification between runs. In one embodiment, the assay provides for a greater than 85% concordance for sample classification from one run to another for each sample. In a further embodiment, the assay provides for a greater than 90% concordance for sample classification from one run to another for each sample. In a further embodiment, the assay provides for a greater than 95% concordance for sample classification from one run to another for each sample. In a further embodiment, the assay provides for a greater than 99% concordance for sample classification from one run to another for each sample.
- The normalized AQUA® score provides a more reproducible quantified measure of biomarker expression. In one embodiment, the quantified measure of biomarker expression level has a reproducibility above 80%. In a further embodiment, the quantified measure of biomarker expression level has a reproducibility above 90%. In a further embodiment, the quantified measure of biomarker expression level has a reproducibility above 95%. In a further embodiment, the quantified measure of biomarker expression level has a reproducibility above 99%. In a further embodiment, the quantified measure of biomarker expression level has a reproducibility from about 85% to about 99%. In a further embodiment, the quantified measure of biomarker expression level has a reproducibility from about 90% to about 99%. In a further embodiment, the quantified measure of biomarker expression level has a reproducibility from about 90% to about 97%.
- In one embodiment, the normalized AQUA® score provides a quantified measure of biomarker expression having a coefficient of variation (% CV) below 20%. In a further embodiment, the normalized AQUA® score provides a quantified measure of biomarker expression having a coefficient of variation (% CV) below 10%. In a further embodiment, the normalized AQUA® score provides a quantified measure of biomarker expression having a coefficient of variation (% CV) below 5%. In a further embodiment, the normalized AQUA® score provides a quantified measure of biomarker expression having a coefficient of variation (% CV) from about 1% to about 20%. In a further embodiment, the normalized AQUA® score provides a quantified measure of biomarker expression having a coefficient of variation (% CV) from about 5% to about 15%. In a further embodiment, the normalized AQUA® score provides a quantified measure of biomarker expression having a coefficient of variation (% CV) from about 4% to about 7%.
- Thus, normalized AQUA® scores provides a reliable assay for comparing sample groups such that the biomarker may be more specifically correlated with the particular characteristics, leading to more reliable diagnosis and prognosis estimation.
- Materials and Methods
- Cohort Description and TMA Construction
- A large breast cancer cohort in tissue microarray (TMA) format was employed in these studies in order to test standardization techniques. This cohort from the Yale Tissue Microarray Facility (YTMA49) has been described in detail previously (Dolled-Filhart M, et al. Cancer Res. (2006) 66:5487-94). Briefly, the breast cohort (n=669) of invasive ductal carcinoma serially collected from the Yale University Department of Pathology from 1961 to 1983. Also on the array is a selection of normal tissue and cell line controls. The mean follow-up time is 12.8 years with a mean age of diagnosis of 58.1 years. This cohort contains approximately half node-positive and half node-negative specimens. Detailed treatment information was not available for this cohort.
- Immunohistochemical/Immunofluoresence Tissue Staining
- Chromagen-based immunohistochemical staining and scoring for cases in YTMA49 was performed previously as described (Camp R L, et al. Cancer Res. (2003) 63:1445-1448, which is hereby incorporated by reference in its entirety). YTMA49 was stained using a modified indirect immunofluorescence protocol (Camp R L, et al. Nat. Med. (2002) 8:1323-1327, which is hereby incorporated by reference in its entirety). In brief, pre-cut paraffin-coated tissue microarray slides were de-paraffinized and antigen-retrieved by heat-induced epitope retrieval in 10 mM Tris (pH 9.0). Using an auto-stainer (LabVision, Fremont, Calif.), slides were pre-incubated with Background Sniper (BioCare Medical, Concord, Calif.). Slides were then incubated with primary antibodies against HER2 (Dako (Carpinteria, Calif.), rabbit polyclonal, 1:8000 dilution) and pan-cytokeratin (rabbit polyclonal, 1:200 dilution, DAKO, Carpinteria, Calif.) diluted in DaVinci Green (BioCare Medical, Concord, Calif.) for 1 hour at RT.
- Slides were washed 3×5 min with 1×TBS containing 0.05% Tween-20. Corresponding secondary antibodies were diluted in Da Vinci Green and incubated for 30 minutes at room temperature. These included either antibodies directly conjugated to a fluorophore for anti-cytokeratin (Alexa 555-conjugated goat anti-rabbit; 1:100, Molecular Probes, Eugene, Oreg.), and/or conjugated to a horseradish peroxidase (HRP) via, anti-mouse or rabbit Envision (Dako, Carpinteria, Calif.)). Slides were again washed 3×5 min with TBS containing 0.05% Tween-20. Slides were incubated with a fluorescent chromagen amplification system (Cy-5-tyramide, NEN Life Science Products, Boston, Mass.) which, like DAB, is activated by HRP and results in the deposition of numerous covalently associated Cy-5 dyes immediately adjacent to the HRP-conjugated secondary antibody. Cy-5 (red) was used because its emission peak is well outside the green-orange spectrum of tissue auto-fluorescence. Slides for automated analysis were cover slipped with an anti-fade DAPI-containing mounting medium (ProLong Gold, Molecular Probes, Eugene, Oreg.).
- Microscopy System and Image Acquisition
- The PM2000™ system, commercialized by HistoRx, Inc. (New Haven, Conn.), is based on a system described previously (Camp et al., 2002, supra). In brief, it is comprised of the Olympus BX51 epi-fluorescence microscope (Olympus America, Inc., Center Valley, Pa.) which is equipped with a motorized nosepiece to control selection of objectives (e.g., 4×, 10×, 20×, 40×, and 60×); a motorized filter turret to control selection of different filter cubes (e.g., DAPI, Cy2, Cy3, Cy5, and Cy7 or equivalent wavelengths); a motorized stage to control stage movements (Prior Scientific Inc., Rockland, Mass.); an X-Cite 120 mercury/metal halide light source (EXFO Life Sciences & Industrial Division, Ontario, Candada); and a QUANTFIRE monochromatic digital camera (Optronics, Inc., Goleta, Calif.).
- Automated image capture was performed by the HistoRx PM-2000 using the AQUAsition™ software package. High resolution, 8 bit (resulting in 256 discrete intensity values per pixel of an acquired image) digital images of the cytokeratin staining visualized with Cy3, DAPI, and target (HER2) staining with Cy5 were captured and saved for every histospot on the array. Pixels were written to image files as a function of power (Power (P)=((Pixel Intensity/256)/exposure time) in order to help compensate for experimental variations in staining intensity and exposure times.
- AQUA® Score Generation
- Images were validated for percent area tumor (tumors showing <5% area/field were redacted), out-of-focus, and debris. Of the 669 tumor samples on YTMA49, 86 samples were redacted (12.8%) leaving a 583 samples for subsequent scoring and analysis. Compartment specific AQUA® scores for HER2 for each histospot were generated based on the PLACE (pixel-based locale assignment for compartmentalization of expression algorithm) algorithm as described previously (Camp et al., 2002, supra). To remove operator-to-operator bias for threshold setting, an unsupervised pixel-based clustering algorithm for optimal image segmentation was used in the PLACE algorithm as described elsewhere in this application.
- Instrument Standardization
- For AQUA® score standardization for instrument variability, three calibration factors were developed: calibration cube factor (CC factor), light source factor (LS factor), and Cy5 optical path factor (OP factor). Calculation of these factors is based on pixel intensity measurements given by images acquired under described conditions. All factors rely on a specialized filter cube (calibration cube) designed whereby light is reflected directly from the light source to the camera via white filter paper attached to the objective-end of the filter cube. To account for variations in the different cube constructions, calibration cubes for each machine were standardized by calculating the percentage of the average total light intensity compared to average total light intensity of a “gold standard” calibration cube (producing the CC factor). This is a constant factor which is calculated and maintained for each cube, and thus each microscope system with that cube installed. The light source factor is calculated for each histospot acquired and is the total light intensity as measured by the calibration cube divided into a constant (100,000). The optical path factor accounts for the amount of light passed through a specific microscope objective/filter combination relative to the measured incoming light intensity. For these measurements, a standard sample is required that can be transferred between different machines and maintain reproducibility in its construction. A commercially available blue fluorescent standard slide was selected for this purpose (Omega Optical Inc., Brattleboro, Vt.). Standardization was performed as described herein previously.
- Statistical Analysis
- For analysis, AQUA® scores were Log2 transformed. Statistical analysis and output was performed using SPSS 15.0 (SPSS Inc, Chicago, Il.) unless otherwise noted. Optimal cut-points for continuous HER2 AQUA® data for 5-year disease-specific death were generated as a function of survival using the software package X-Tile as described previously (Camp R L, et al., Clin. Cancer Res. (2004) 10:7252-7259, which is hereby incorporated by reference in its entirety). X-tile performs Monte Carlo simulations (e.g. cross-validation (Raeside DE. Phys Med Biol. (1976) 21:181-97, which is incorporated by reference in its entirety) to produce corrected P-values to assess statistical significance of data generated by multiple cut-points. The software also generates training/validation subsets for additional P-value estimation. Agreement percentages with 95% confidence intervals for 2×2 contingency tables were determined using the web-based tool, JavaStat, for 2-way contingency table analysis.
- Results
- HER2 Immunofluorescence Staining
- Fluorescent stains were multiplexed to compartmentalize and measure expression of specific biomarkers. For HER2, only pixels (Cy5) within the cytokeratin-derived (epithelium specific) compartment (Cy3) were considered for analysis, thus differentiating tumor from stromal HER2 signal as well as membrane/cytoplasm from nuclear HER2 signal. As described, only HER2 pixels that coincided with cytokeratin pixels were used to generate an AQUA® score.
- AQUA® Score Correlation with Traditional IHC Scoring Methods
- HER2 AQUA® scores showed a moderate, but highly significant correlation with categorical IHC scoring methods (0, +1, +2, and +3) with Spearman's Rho value of 0.46 (P<0.001). Multinomial regression analysis (for comparison of categorical versus continuous data) showed a highly significant correlation (P<0.001) with a pseudo-R value of 0.56.
FIG. 3 categorizes HER2 AQUA® scores as a function of IHC scores using a box plot. Although there was a highly significant difference in population mean (ANOVA P<0.001), because AQUA® provides a continuous expression score, significant overlap of AQUA® scores was observed across the range of traditional categorical scoring. - Normalized HER2 Expression Scores
- Three serial sections of a cohort (n=669) of invasive breast cancers were fluorescently stained for HER2 as described in Materials and Methods. The first serial section was used for AQUA® score generation across three different instruments and three different operators. The second and third serial sections were stained on separate days to assess run-to-run variability.
FIG. 4 gives box plots showing normalized AQUA® score distributions for each indicated acquisition parameter (instrument (FIG. 4A ), operator (FIG. 4B ), and independent staining runs (FIG. 4C )). For 583 patient samples, the average percent coefficient of variation (% CV) was 1.8% (min=0.04%; max=10.7%) across instruments, 2.0% (min=0.06%; max=15.6%) across operators, and 5.1% (min=0.12%; max=29.7%) across independent staining runs. These % CVs rival that of in vitro immunoassays such as ELISA (Butler et al. J Immunoassay. (2000) 21:165-209). - Positive/Negative Concordance
- A critical parameter for HER2 testing in the clinical laboratory is the ability to reproducibly classify patients as positive or negative. Using survival as a surrogate marker for positive/negative classification 22, an optimal AQUA® score cut-point was established using X-tile 19 for normalized HER2 AQUA® scores produced for
instrument 1,operator 1, andstaining run 1.FIG. 5A shows Kaplan-Meier survival analysis of positive/negative HER2 classification forinstrument 1. As described in Materials and Methods, the cut-point was validated with significance by Monte Carlo simulation (P<0.001) and training/validation subsets (P=0.002). This validated cut-point was applied to AQUA® scores generated oninstruments FIGS. 5B and 5C ). Similar reproducibility was observed across independent operator and staining run acquisitions with P-values all ≦0.01 (data not shown). - Current ASCO-CAP guidelines are suggesting laboratories achieve 95% positive/negative concordance for current HER2 assay methodologies (Wolff A C et al, Arch Pathol Lab Med. (2007) 131:18). A recent study shows that for HER2 IHC-based scoring, concordance between observers ranges from 54-85%, falling short of these guidelines (Hameed et al; in press; direct communication). Positive/negative concordance for normalized AQUA® scoring across instruments, operators, and staining days was examined using the cut-points established above. As shown in
FIG. 6 , overall concordance ranged from 94.5% (Instrument 1 toInstrument 3;FIG. 6B ) to 99.3% (Operator 1 toOperator 2;FIG. 6C ). These analyses include all cases including those that would be considered equivocal. - To assess where differential classification occurred in the distribution of normalized AQUA® scores, paneled frequency histograms were generated to examine where differentially classified cases were occurring. As shown in
FIG. 7 , for instrument-to-instrument, operator-to-operator and run-to-run, differentially classified cases occur at the cut-point and not over the entire distribution. These data suggest that the classification error concerns cut-point selection not generation and reproducibility of the normalized HER2 AQUA® score. Taken together, these data show classification of patients for inter-instrument, inter-operator, and inter-run assessment of HER2 expression using AQUA® scoring is highly reproducible with concordance rates approaching, if not exceeding, that suggested by ASCO/CAP. - The methods of the present invention were applied to the evaluation of the biomarker EGFR in breast cancer tissue sections. As shown in
FIG. 8A , a TMA cohort of 748 specimens was analyzed for HER2 expression by normalized AQUA® analysis across three instruments, 3 operators, and 3 separate staining runs with an average % CV of 4.3%. Preliminary analytical performance assessment was performed with EGFR PharmDx (Dako). AsFIGS. 8B-D demonstrate, AQUA® analysis of EGFR expression across 3 slides and 3 staining days on a TMA composed of breast tumor and cell lines (n=152) shows a high degree of precision slide-to-slide and day-to-day with an average slope of 1.00047, an average Pearson's R of 0.95, an average % CV for tumor tissue of 3.3%, and an average % CV for cell lines of 4.7%. Taken together, these data demonstrate that AQUA® analysis allows for an EGFR assay with a high degree of precision, and combined with instrument and software controls, development of a robust clinical biomarker assay is possible. - To demonstrate reproducibility of AQUAnalysis™ with another biomarker, four breast tissue blocks were obtained that represent a range of estrogen receptor (ER) expression (as judged by Allred scoring). Sections of these tissue blocks were then taken to generate H&E slides on which a board certified pathologist circled the area of tumor for all subsequent analyses. A serial set of sections was DAB stained with the monoclonal mouse anti-human estrogen receptor a, clone 1D5 antibody and evaluated for Allred scoring by the same pathologist. See, e.g., Harvey J M, et al., (1999) J. Clin. Oncol. 12:1474, which is hereby incorporated by reference in its entirety.
- Serial sections were then stained using the immunofluorescence staining protocol described above. Images were collected on the HistoRx PM-2000™ microscopy platform and then passed to AQUAnalysis™ for scoring. All scores were transformed on a
log 2 scale. - Image files for the four slides were acquired and then passed through the AQUAnalysis™ software package n=10 times by the same operator to demonstrate overall software reproducibility. For all files, the % CV was essentially 0 (less then 1E−7).
- The same four image files were then provided to three different operators along with the software operating instructions. Here, the operators redacted images in the method outlined for technician review of image quality, which reflects typical use. The results, shown in Table 1, demonstrate that even with more than 30% variability in the number of images scored (in the case of
slides # 3 and #4) the % CV in the overall score is still on the order of 1% or less. -
TABLE 1 Inter-operator reproducibility Mean AQUA ® score #fields (n = 3) Operator per operator scored Mean StDev % CV Slide # 1 Operator 19.941 100 9.945 0.0047 0.05 Operator 29.945 104 Operator 39.950 109 Slide # 2Operator 110.382 60 10.397 0.0357 0.34 Operator 210.437 61 Operator 310.370 62 Slide # 3Operator 110.254 102 10.232 0.0194 0.19 Operator 210.216 110 Operator 310.227 150 Slide # 4Operator 113.723 4 13.818 0.1644 1.19 Operator 213.723 4 Operator 314.008 14 - To demonstrate performance at independent sites and using alternative hardware systems for image acquisition, the AQUAnalysis™ software was evaluated on three different platforms which meet the required hardware specifications (described in the operator's manual). The systems are described below in Table 2.
-
TABLE 2 Hardware systems used for reproducibility testing System 1 System 2System 3Component HistoRx PM- External System External System 2000 ™ # 1 #2 Light Source Exfo Xcite 120 Exfo Xcite 120Prior Lumen Microscope Olympus BX-52 Olympus BX-51 Nikon 50i Objective Mag. 20× 10× 10× Camera Optronics Cooke Sensicam PixelLink Quantifire, QE PL-B872-MF 2048 × 2040, 1376 × 1040, 1392 × 1040, 7.4 μM pixel 6.45 μM pixels 6.45 μM pixels FOV size 758 μM × 758 μM 887 μM × 671 μM 898 μM × 671 μM Filters Cy3, Cy5, DAPI Cy3, Cy5, DAPI Cy3, Cy5, DAPI - To assure uniform testing, it was critical to assure that the same regions of tissue were sampled on each system since automated image acquisition is not required or necessarily available on all listed platforms. To accomplish this, a TMA was constructed from the same four samples described in the previous reproducibility tests, using five cores from each of the four blocks (for a total of 20 spots). This microarray was then immunofluorescently stained and the same single TMA was acquired on three separate hardware systems sequentially. Images were acquired in the laboratory of the installed hardware system by the operator after receiving training on the software operation. Results were maintained in a blinded manner for all external testing and are provided below in Table 3.
-
TABLE 3 Results of inter-site/inter-hardware testing HistoRx External Site 1 External Site 2Overall AVG SD CV AVG SD CV AVG SD CV AVG SD CV Sample 1 8.12 0.19 2.40 9.01 0.40 4.44 8.36 0.45 5.34 8.50 0.46 5.37 Sample 29.05 0.55 6.10 9.72 0.52 5.36 8.74 0.81 9.22 9.17 0.51 5.51 Sample 39.34 0.16 1.66 10.08 0.04 0.39 9.40 0.31 3.26 9.61 0.41 4.27 Sample 412.01 0.30 2.53 12.78 NA NA 11.23 0.57 5.11 12.01 0.77 6.43 - Each ‘sample’ refers to the average of the scores from the five-fold redundant TMA spots cored from the associated whole tissue section sample used in previous testing (with a range of Allred scores).
- Overall, the % CV values for mean AQUAS score values are in the 4-6.5% range and do not vary significantly across the range of ER expression. The % CV variations observed within a single sample at a single site is the result of indicative of marker heterogeneity within the sample, not measurement error. ANOVA analysis indicated that while there is significant variation between the samples scores as expected (p<0.001), there is no significant difference between sites (p=0.58).
- To demonstrate the utility of AQUA® scores, a comparison study was performed to examine the relationship between breast tissue immunofluorescently stained then scored using AQUAnalysis™ and breast tissue chromogencially stained then scored using the Allred method. As discussed in Example 1, a tissue microarray cohort of 669 patients was obtained from the Yale University Tissue Microarray Facility consisting of samples from the Yale University Department of Pathology tissue archives collected between 1961 and 1983.
- Two serial sections were stained using the mouse monoclonal 1D5 antibody. One section was stained using DAB and the second using the immunofluorescence methods described above above. The DAB stained slide was then provided to three board certified pathologists for Allred scoring. Each pathologist was blinded to the results of the others (and to the fluorescent staining results) and no further information was given other than the nature of the tissue being scored and the biomarker (ER). In parallel the fluorescently stained serial section of the TMA was run through the AQUAnalysis™ software and AQUA® scores were generated. There was a definitive trend between Allred scoring and AQUA® scoring as demonstrated below (
FIGS. 9A-C )) for all pathologists. Allred scoring and AQUA® scoring was highly correlative (p<0.001) for all pathologists by non-parametric correlation analysis (Spearman's Rho,FIG. 9D ). Multinomial logistic regression analysis demonstrated a significant (p<0.001) and direct (pseudo R2) relationship between Allred scoring and AQUA® scoring for all pathologists (seeFIG. 9 ). - Although there is variation in the individual scores provided by the pathologists, in typical practice, a cut point is applied to the data. For the Allred scoring method, a cut point of 3 was used such that scores <3 (0 or 2) were considered negative and scores ≧3 were considered positive. See, e.g., Harvey et al, supra. This cut point was applied to the individual results of each of the manually scored pathologist data sets and a consensus score was generated. Samples where at least one pathologist could not provide a score were eliminated from the consensus. If scores did not agree, the majority score was used. As a result of this, it was observed that pathologists demonstrated universal agreement for positive/
negative classification 91% of the time for 523 cases. - To determine a cut point for the AQUA® score data, an unsupervised Bayesian clustering algorithm based on log-likelihood distances was applied using the commercially available software program, SPSS(SPSS, Inc. Chicago, II). For this algorithm, patients were grouped based on cluster membership of AQUA® scores. When the clustering was performed, four clusters are manifested in the data (see
FIG. 10A ). Analogous to Allred scoring, survival was used to determine positive and negative classification between expression groups. As shown inFIG. 10B , three (clusters 2-4) show improved survival whereascluster 1 show decreased survival. Therefore, patients incluster 1 were considered ER negative and all others ER positive. - With positive/negative classification determined for the AQUA® data, a concordance matrix was generated to compare the results of the AQUAnalysis™ software with the results of the scoring consensus derived from manual Allred scoring. The results indicate that the overall concordance between the methods is 94.9% with percent positive agreement of 96.0% and percent negative agreement of 92.5%, as shown in Table 4 below.
-
TABLE 4 Concordance of AQUA ® scoring with manual IHC Allred scoring. Manual Allred Scoring Positive Negative Total AQUA ® Positive 218 8 226 scoring Negative 9 99 108 Total 227 107 334 % Positive agreement (218/227) = 96.0% (95% CI = 92.6-98.2) % Negative agreement (99/107) = 92.5% (95% CI = 85.8-96.7) % Total agreement (317/334) = 94.9% (95% CI = 92.0-97.0) - As confirmation of positive/negative classification of ER AQUA® scores, overall survival was compared between Allred scoring and AQUA® scoring, as shown in
FIG. 11 . Both methods predict significant five-year disease specific survival and show similar cumulative survival rates for positive/negative classification. - A single TMA slide described in Examples 3 and 4 was stained for ER expression using conventional chromogenic immunohistochemistry techniques as previously described and independently evaluated by three pathologists using light microscopy and scored by the Allred method (
FIG. 12A ). A second, serial section, TMA slide was stained for AQUA® analysis (fluorescent immunohistochemistry) of ER expression and the same slide was analyzed on three independent instruments by AQUA® analysis (FIG. 12B ). Examination of the results obtained by each pathologist vs. each other pathologist shown as scatterplots (FIG. 12A ) shows that while overall concordance is high, there are samples considered positive by one pathologist that are considered negative by another. These patients would receive different treatment (hormonal therapy) depending on which pathologist read their ER results. - The kappa values (which range from 0 to 1, Table 5) over the spread of Allred scores indicate that there is a great deal of variance in the respective pathologists manual scoring determinations.
-
TABLE 5 Kappa of results scored by pathologists. Path 1 v. Path 2: Kappa = 0.482 (p < 0.001)Path 1 v. Path 3: Kappa = 0.444 (p < 0.001)Path 2 v. Path 3: Kappa = 0.400 (p < 0.001) - Overall regression analysis of the results obtained for each combination of PM 2000 instruments is shown in
FIG. 12B . There is extremely high correlation (R2>0.99 in all cases, Table 6) with a strong correspondence (regression coefficients, analogous to the slop eof the regression line, are all ˜1.0). Furthermore, ANOVA analysis of the datasets produces p>0.05, indicating that the data sets are statistically indistinguishable. In comparison toFIG. 12A , results obtained by AQUA analysis is highly reproducible with an average CV of 1.35%. Therefore the methods of the present invention provide for consistent results regardless of which instrument (and therefore location) the sample was analyzed on. -
TABLE 6 Comparison of results obtained on three instruments by AQUA analysis. Regression Coefficient Comparison R2 (95% CI; p value) Instrument 1 v20.996 1.003 (0.99-1.01; <0.001) Instrument 1 v30.995 1.01 (1.00-1.02; <0.001) Instrument 2 v30.996 1.003 (0.99-1.01; <0.001) - The Examples are provided for illustrative purposes only and should not be used to limit the scope of the invention. Many other embodiments of the invention are apparent to those of ordinary skill in the art in view of the contents and teachings of this disclosure.
Claims (25)
Priority Applications (1)
| Application Number | Priority Date | Filing Date | Title |
|---|---|---|---|
| US12/560,129 US9240043B2 (en) | 2008-09-16 | 2009-09-15 | Reproducible quantification of biomarker expression |
Applications Claiming Priority (2)
| Application Number | Priority Date | Filing Date | Title |
|---|---|---|---|
| US9741508P | 2008-09-16 | 2008-09-16 | |
| US12/560,129 US9240043B2 (en) | 2008-09-16 | 2009-09-15 | Reproducible quantification of biomarker expression |
Publications (2)
| Publication Number | Publication Date |
|---|---|
| US20100136549A1 true US20100136549A1 (en) | 2010-06-03 |
| US9240043B2 US9240043B2 (en) | 2016-01-19 |
Family
ID=41461054
Family Applications (1)
| Application Number | Title | Priority Date | Filing Date |
|---|---|---|---|
| US12/560,129 Active 2032-05-05 US9240043B2 (en) | 2008-09-16 | 2009-09-15 | Reproducible quantification of biomarker expression |
Country Status (8)
| Country | Link |
|---|---|
| US (1) | US9240043B2 (en) |
| EP (1) | EP2335221B8 (en) |
| JP (1) | JP5551702B2 (en) |
| CN (1) | CN102165489B (en) |
| AU (1) | AU2009293380B2 (en) |
| CA (1) | CA2737116C (en) |
| ES (1) | ES2573945T3 (en) |
| WO (1) | WO2010033508A1 (en) |
Cited By (81)
| Publication number | Priority date | Publication date | Assignee | Title |
|---|---|---|---|---|
| US20110228993A1 (en) * | 2007-08-31 | 2011-09-22 | Historx, Inc. | Automatic exposure time selection for imaging tissue |
| US8120768B2 (en) | 2007-06-15 | 2012-02-21 | Historx, Inc. | Method and system for standardizing microscope instruments |
| WO2012075377A1 (en) | 2010-12-03 | 2012-06-07 | Historx, Inc. | Identification of cancer patients likely to benefit from radiation therapy |
| WO2013063155A2 (en) | 2011-10-24 | 2013-05-02 | Halozyme, Inc. | Companion diagnostic for anti-hyaluronan agent therapy and methods of use thereof |
| US8600168B2 (en) * | 2006-09-13 | 2013-12-03 | Fluidigm Corporation | Methods and systems for image processing of microfluidic devices |
| US20130336542A1 (en) * | 2011-03-04 | 2013-12-19 | Nec Corporation | Individual product identification system, individual product identification method, and device and program used by same |
| US8655037B2 (en) | 2007-05-14 | 2014-02-18 | Historx, Inc. | Compartment segregation by pixel characterization using image data clustering |
| WO2014062856A1 (en) | 2012-10-16 | 2014-04-24 | Halozyme, Inc. | Hypoxia and hyaluronan and markers thereof for diagnosis and monitoring of diseases and conditions and related methods |
| WO2016033555A1 (en) | 2014-08-28 | 2016-03-03 | Halozyme, Inc. | Combination therapy with a hyaluronan-degrading enzyme and an immune checkpoint inhibitor |
| CN106327508A (en) * | 2016-08-23 | 2017-01-11 | 马跃生 | Ki67 index automatic analysis method |
| US20170013181A1 (en) * | 2014-01-30 | 2017-01-12 | Bd Kiestra B.V. | A system and method for image acquisition using supervised high quality imaging |
| WO2017032867A1 (en) | 2015-08-27 | 2017-03-02 | INSERM (Institut National de la Santé et de la Recherche Médicale) | Methods for predicting the survival time of patients suffering from a lung cancer |
| WO2017060397A1 (en) | 2015-10-09 | 2017-04-13 | INSERM (Institut National de la Santé et de la Recherche Médicale) | Methods for predicting the survival time of subjects suffering from melanoma metastases |
| US20170103279A1 (en) * | 2013-05-01 | 2017-04-13 | Life Technologies Holdings Pte Limited | Method and system for projecting image with differing exposure times |
| WO2017067944A1 (en) | 2015-10-19 | 2017-04-27 | INSERM (Institut National de la Santé et de la Recherche Médicale) | Methods for predicting the survival time of subjects suffering from triple negative breast cancer |
| WO2017070581A1 (en) * | 2015-10-23 | 2017-04-27 | Novartis Ag | Method of deriving a value for percent biomarker positivity for selected cells present in a field of view |
| WO2017081190A1 (en) | 2015-11-13 | 2017-05-18 | INSERM (Institut National de la Santé et de la Recherche Médicale) | Anti- nkg2d single domain antibodies and uses thereof |
| WO2017118634A1 (en) | 2016-01-04 | 2017-07-13 | INSERM (Institut National de la Santé et de la Recherche Médicale) | Use of pd-1 and tim-3 as a measure for cd8+ cells in predicting and treating renal cell carcinoma |
| WO2017129769A1 (en) | 2016-01-28 | 2017-08-03 | INSERM (Institut National de la Santé et de la Recherche Médicale) | Methods for enhancing the potency of the immune checkpoint inhibitors |
| WO2017202962A1 (en) | 2016-05-24 | 2017-11-30 | INSERM (Institut National de la Santé et de la Recherche Médicale) | Methods and pharmaceutical compositions for the treatment of non small cell lung cancer (nsclc) that coexists with chronic obstructive pulmonary disease (copd) |
| WO2018009202A1 (en) * | 2016-07-07 | 2018-01-11 | Flagship Biosciences Inc. | Continuous tissue analysis scoring scheme based on cell classifications |
| WO2018011107A1 (en) | 2016-07-11 | 2018-01-18 | INSERM (Institut National de la Santé et de la Recherche Médicale) | Use of er-alpha 46 in methods and kits for assessing the status of breast cancer |
| WO2018046736A1 (en) | 2016-09-12 | 2018-03-15 | INSERM (Institut National de la Santé et de la Recherche Médicale) | Methods for predicting the survival time of patients suffering from cancer |
| US20180095359A1 (en) * | 2016-09-30 | 2018-04-05 | Samsung Electronics Co., Ltd. | Method of optimizing a mask using pixel-based learning and method for manufacturing a semiconductor device using an optimized mask |
| US9969998B2 (en) | 2014-10-14 | 2018-05-15 | Halozyme, Inc. | Compositions of adenosine deaminase-2 (ADA2), variants thereof and methods of using same |
| WO2018122245A1 (en) | 2016-12-28 | 2018-07-05 | INSERM (Institut National de la Santé et de la Recherche Médicale) | Methods of predicting the survival time of patients suffering from cms3 colorectal cancer |
| WO2018122249A1 (en) | 2016-12-28 | 2018-07-05 | INSERM (Institut National de la Santé et de la Recherche Médicale) | Methods for predicting the survival time of patients suffering from a microsatellite stable colorectal cancer |
| US20180204048A1 (en) * | 2015-09-02 | 2018-07-19 | Ventana Medical Systems, Inc. | Automated analysis of cellular samples having intermixing of analytically distinct patterns of analyte staining |
| WO2018146253A1 (en) | 2017-02-10 | 2018-08-16 | INSERM (Institut National de la Santé et de la Recherche Médicale) | Methods and pharmaceutical compositions for the treatment of cancers associated with activation of the mapk pathway |
| WO2018170026A2 (en) | 2017-03-16 | 2018-09-20 | Alpine Immune Sciences, Inc. | Cd80 variant immunomodulatory proteins and uses thereof |
| EP3273223A4 (en) * | 2015-03-17 | 2018-09-26 | Hamamatsu Photonics K.K. | Device for generating fluorescence image and method for generating fluorescence image |
| US20180306768A1 (en) * | 2015-10-23 | 2018-10-25 | Novartis Ag | Computer method and system for deriving cell-to-cell spatial proximities |
| WO2018202850A1 (en) | 2017-05-05 | 2018-11-08 | INSERM (Institut National de la Santé et de la Recherche Médicale) | Microtubule-targeting drugs as immune checkpoint inhibitors and methods of screening novel immune checkpoint inhibitors for the treatment of cancers and infectious diseases |
| US10225483B1 (en) * | 2013-05-01 | 2019-03-05 | Pierce Biotechnology, Inc. | Method and system for projecting image with differing exposure times |
| WO2019043138A1 (en) | 2017-09-01 | 2019-03-07 | INSERM (Institut National de la Santé et de la Recherche Médicale) | Method for predicting the outcome of a cancer |
| WO2019074489A1 (en) * | 2017-10-10 | 2019-04-18 | Flagship Biosciences, Inc. | Methods for quantitative assessment of muscle fibers in muscular dystrophy |
| WO2019089858A2 (en) | 2017-11-01 | 2019-05-09 | Juno Therapeutics, Inc. | Methods of assessing or monitoring a response to a cell therapy |
| WO2019101871A1 (en) | 2017-11-23 | 2019-05-31 | Inserm (Institut National De La Sante Et De La Recherche Medicale) | A new marker for predicting the sensitivity to pi3k inhibitors |
| WO2019162325A1 (en) | 2018-02-21 | 2019-08-29 | INSERM (Institut National de la Santé et de la Recherche Médicale) | Use of sk1 as biomarker for predicting response to immunecheckpoint inhibitors |
| WO2019175113A1 (en) | 2018-03-12 | 2019-09-19 | INSERM (Institut National de la Santé et de la Recherche Médicale) | Use of caloric restriction mimetics for potentiating chemo-immunotherapy for the treatment of cancers |
| WO2019197683A1 (en) | 2018-04-13 | 2019-10-17 | INSERM (Institut National de la Santé et de la Recherche Médicale) | Methods for predicting outcome and treatment of patients suffering from prostate cancer or breast cancer |
| WO2019207030A1 (en) | 2018-04-26 | 2019-10-31 | INSERM (Institut National de la Santé et de la Recherche Médicale) | Methods for predicting a response with an immune checkpoint inhibitor in a patient suffering from a lung cancer |
| WO2019241758A1 (en) | 2018-06-15 | 2019-12-19 | Alpine Immune Sciences, Inc. | Pd-1 variant immunomodulatory proteins and uses thereof |
| WO2020048942A1 (en) | 2018-09-04 | 2020-03-12 | INSERM (Institut National de la Santé et de la Recherche Médicale) | Methods and pharmaceutical compositions for enhancing cytotoxic t lymphocyte-dependent immune responses |
| WO2020061376A2 (en) | 2018-09-19 | 2020-03-26 | Alpine Immune Sciences, Inc. | Methods and uses of variant cd80 fusion proteins and related constructs |
| WO2020058372A1 (en) | 2018-09-19 | 2020-03-26 | INSERM (Institut National de la Santé et de la Recherche Médicale) | Methods and pharmaceutical composition for the treatment of cancers resistant to immune checkpoint therapy |
| WO2020070053A1 (en) | 2018-10-01 | 2020-04-09 | INSERM (Institut National de la Santé et de la Recherche Médicale) | Use of inhibitors of stress granule formation for targeting the regulation of immune responses |
| WO2020120592A1 (en) | 2018-12-12 | 2020-06-18 | INSERM (Institut National de la Santé et de la Recherche Médicale) | Methods and compositions for predicting and treating melanoma |
| WO2020127059A1 (en) | 2018-12-17 | 2020-06-25 | INSERM (Institut National de la Santé et de la Recherche Médicale) | Use of sulconazole as a furin inhibitor |
| WO2020141199A1 (en) | 2019-01-03 | 2020-07-09 | INSERM (Institut National de la Santé et de la Recherche Médicale) | Methods and pharmaceutical compositions for enhancing cd8+ t cell-dependent immune responses in subjects suffering from cancer |
| US10752955B2 (en) * | 2014-02-21 | 2020-08-25 | Ventana Medical Systems, Inc. | Single-stranded oligonucleotide probes for chromosome or gene copy enumeration |
| WO2020205623A1 (en) | 2019-03-29 | 2020-10-08 | Rakuten Medical, Inc. | Methods for photoimmunotherapy and related biomarkers |
| WO2020201362A2 (en) | 2019-04-02 | 2020-10-08 | INSERM (Institut National de la Santé et de la Recherche Médicale) | Methods of predicting and preventing cancer in patients having premalignant lesions |
| WO2020208060A1 (en) | 2019-04-09 | 2020-10-15 | INSERM (Institut National de la Santé et de la Recherche Médicale) | Use of sk2 inhibitors in combination with immune checkpoint blockade therapy for the treatment of cancer |
| WO2020245208A1 (en) | 2019-06-04 | 2020-12-10 | INSERM (Institut National de la Santé et de la Recherche Médicale) | Use of cd9 as a biomarker and as a biotarget in glomerulonephritis or glomerulosclerosis |
| WO2020245155A1 (en) | 2019-06-03 | 2020-12-10 | INSERM (Institut National de la Santé et de la Recherche Médicale) | Methods for modulating a treatment regimen |
| RU2739974C1 (en) * | 2017-10-10 | 2020-12-30 | Ханчжоу Чживэй Информейшн Текнолоджи Ко., Лтд. | Method for bone marrow cell marking and system for implementation thereof |
| WO2021074391A1 (en) | 2019-10-17 | 2021-04-22 | INSERM (Institut National de la Santé et de la Recherche Médicale) | Methods for diagnosing nasal intestinal type adenocarcinomas |
| US11060967B2 (en) * | 2014-02-28 | 2021-07-13 | Nueon Inc. | Method and apparatus for determining markers of health by analysis of blood |
| WO2021144426A1 (en) | 2020-01-17 | 2021-07-22 | INSERM (Institut National de la Santé et de la Recherche Médicale) | Methods and compositions for treating melanoma |
| WO2021170777A1 (en) | 2020-02-28 | 2021-09-02 | INSERM (Institut National de la Santé et de la Recherche Médicale) | Methods for diagnosing, prognosing and managing treatment of breast cancer |
| WO2022002873A1 (en) | 2020-06-30 | 2022-01-06 | INSERM (Institut National de la Santé et de la Recherche Médicale) | Methods for predicting the risk of recurrence and/or death of patients suffering from a solid cancer after preoperative adjuvant therapies |
| WO2022002874A1 (en) | 2020-06-30 | 2022-01-06 | INSERM (Institut National de la Santé et de la Recherche Médicale) | Methods for predicting the risk of recurrence and/or death of patients suffering from a solid cancer after preoperative adjuvant therapy and radical surgery |
| CN114270174A (en) * | 2019-08-28 | 2022-04-01 | 文塔纳医疗系统公司 | Label-free assessment of biomarker expression using vibrational spectroscopy |
| US20220189026A1 (en) * | 2020-11-06 | 2022-06-16 | Commissariat A L'energie Atomique Et Aux Energies Alternatives | Method for detecting a cell event |
| WO2022171777A1 (en) | 2021-02-12 | 2022-08-18 | INSERM (Institut National de la Santé et de la Recherche Médicale) | Method for prognosis and treating a patient suffering from cancer |
| WO2022200303A1 (en) | 2021-03-23 | 2022-09-29 | INSERM (Institut National de la Santé et de la Recherche Médicale) | Methods for the diagnosis and treatment of t cell-lymphomas |
| WO2022229136A1 (en) | 2021-04-27 | 2022-11-03 | INSERM (Institut National de la Santé et de la Recherche Médicale) | Methods for predicting the risk of lymph node metastasis and/or recurrence of patients suffering from a t1 cancer treated by endoscopic resection |
| US11663717B2 (en) | 2014-12-03 | 2023-05-30 | Ventana Medical Systems, Inc. | Methods, systems, and apparatuses for quantitative analysis of heterogeneous biomarker distribution |
| WO2023144303A1 (en) | 2022-01-31 | 2023-08-03 | INSERM (Institut National de la Santé et de la Recherche Médicale) | Cd38 as a biomarker and biotarget in t-cell lymphomas |
| WO2023144235A1 (en) | 2022-01-27 | 2023-08-03 | INSERM (Institut National de la Santé et de la Recherche Médicale) | Methods for monitoring and treating warburg effect in patients with pi3k-related disorders |
| WO2023172883A1 (en) | 2022-03-07 | 2023-09-14 | Alpine Immune Sciences, Inc. | Immunomodulatory proteins of variant cd80 polypeptides, cell therapies thereof and related methods and uses |
| WO2023175366A1 (en) | 2022-03-17 | 2023-09-21 | Veracyte | Methods for predicting response to an immunotherapeutic treatment in a patient with a cancer |
| WO2023198874A1 (en) | 2022-04-15 | 2023-10-19 | Institut National de la Santé et de la Recherche Médicale | Methods for the diagnosis and treatment of t cell-lymphomas |
| WO2023198648A1 (en) | 2022-04-11 | 2023-10-19 | Institut National de la Santé et de la Recherche Médicale | Methods for the diagnosis and treatment of t-cell malignancies |
| WO2024003310A1 (en) | 2022-06-30 | 2024-01-04 | Institut National de la Santé et de la Recherche Médicale | Methods for the diagnosis and treatment of acute lymphoblastic leukemia |
| WO2024018046A1 (en) | 2022-07-22 | 2024-01-25 | Institut National de la Santé et de la Recherche Médicale | Garp as a biomarker and biotarget in t-cell malignancies |
| WO2024023283A1 (en) | 2022-07-29 | 2024-02-01 | Institut National de la Santé et de la Recherche Médicale | Lrrc33 as a biomarker and biotarget in cutaneous t-cell lymphomas |
| WO2024079192A1 (en) | 2022-10-12 | 2024-04-18 | Institut National de la Santé et de la Recherche Médicale | Cd81 as a biomarker and biotarget in t-cell malignancies |
| WO2024153636A1 (en) | 2023-01-17 | 2024-07-25 | Institut National de la Santé et de la Recherche Médicale | Vasorin as a biomarker and biotarget in nephrology |
| WO2025045894A1 (en) | 2023-08-28 | 2025-03-06 | Institut National de la Santé et de la Recherche Médicale | Methods and kits for diagnosing cause of nephrotic syndrome and guiding therapy |
Families Citing this family (37)
| Publication number | Priority date | Publication date | Assignee | Title |
|---|---|---|---|---|
| ES2573945T3 (en) | 2008-09-16 | 2016-06-13 | Novartis Ag | Reproducible quantification of biomarker expression |
| WO2011146928A2 (en) * | 2010-05-21 | 2011-11-24 | On-Q-ity | Methods for calibrating protein levels in cells and tissue specimens |
| US9522396B2 (en) * | 2010-12-29 | 2016-12-20 | S.D. Sight Diagnostics Ltd. | Apparatus and method for automatic detection of pathogens |
| WO2013098821A1 (en) | 2011-12-29 | 2013-07-04 | Parasight Ltd. | Methods and systems for detecting a pathogen in a biological sample |
| AU2013240137B2 (en) * | 2012-03-30 | 2017-04-20 | Leica Microsystems Cms Gmbh | Methods for generating an image of a biological sample |
| US10317408B2 (en) * | 2012-06-14 | 2019-06-11 | Inserm (Institut National De La Sante Et De La Recherche Medicale) | Method for quantifying immune cells in tumoral tissues and its applications |
| WO2014188405A1 (en) | 2013-05-23 | 2014-11-27 | Parasight Ltd. | Method and system for imaging a cell sample |
| IL227276A0 (en) | 2013-07-01 | 2014-03-06 | Parasight Ltd | A method and system for preparing a monolayer of cells, particularly suitable for diagnosis |
| WO2015029032A1 (en) | 2013-08-26 | 2015-03-05 | Parasight Ltd. | Digital microscopy systems, methods and computer program products |
| DK3117259T3 (en) | 2014-03-10 | 2020-04-14 | Visiopharm As | Staining quality assessment |
| US10746980B2 (en) * | 2014-08-26 | 2020-08-18 | General Electric Company | Calibration of microscopy systems |
| US9797767B2 (en) * | 2014-08-26 | 2017-10-24 | General Electric Company | Calibration of microscopy systems |
| US10482595B2 (en) | 2014-08-27 | 2019-11-19 | S.D. Sight Diagnostics Ltd. | System and method for calculating focus variation for a digital microscope |
| EP3859425B1 (en) | 2015-09-17 | 2024-04-17 | S.D. Sight Diagnostics Ltd. | Methods and apparatus for detecting an entity in a bodily sample |
| WO2017126420A1 (en) * | 2016-01-19 | 2017-07-27 | コニカミノルタ株式会社 | Image processing device and program |
| CN108779140B (en) * | 2016-03-14 | 2022-04-12 | 私募蛋白质体操作有限公司 | Compounds and methods for synthesizing 5- (N-protected tryptophanyl carboxamide) -2' -deoxyuridine phosphoramidites for incorporation into nucleic acid sequences |
| US11733150B2 (en) | 2016-03-30 | 2023-08-22 | S.D. Sight Diagnostics Ltd. | Distinguishing between blood sample components |
| EP3455610B1 (en) | 2016-05-11 | 2023-01-04 | S.D. Sight Diagnostics Ltd. | Sample carrier for optical measurements |
| AU2017263807B2 (en) | 2016-05-11 | 2023-02-02 | S.D. Sight Diagnostics Ltd | Performing optical measurements on a sample |
| CN109313798B (en) * | 2016-06-10 | 2022-04-01 | 豪夫迈·罗氏有限公司 | Method and image processing system for generating analog digital brightfield IHC or ISH images |
| EP3520004A2 (en) | 2016-09-30 | 2019-08-07 | GE Healthcare Bio-Sciences Corp. | Computer device for detecting an optimal candidate compound and methods thereof |
| CN109983310B (en) * | 2016-10-25 | 2021-11-05 | 雅培实验室 | Automated slide preparation reagent assessment and control |
| CN108229098A (en) * | 2016-12-09 | 2018-06-29 | 深圳市瀚海基因生物科技有限公司 | Monomolecular identification, method of counting and device |
| US11450121B2 (en) * | 2017-06-27 | 2022-09-20 | The Regents Of The University Of California | Label-free digital brightfield analysis of nucleic acid amplification |
| EP4488657A1 (en) | 2017-06-28 | 2025-01-08 | Ventana Medical Systems, Inc. | System level calibration |
| CN107463913B (en) * | 2017-08-11 | 2020-07-14 | 苏炯龙 | L ab-based image collagen fiber recognition and calculation system and method |
| WO2019037863A1 (en) * | 2017-08-24 | 2019-02-28 | Toyota Motor Europe | System and method for label augmentation in video data |
| CA3081669A1 (en) | 2017-11-14 | 2019-05-23 | S.D. Sight Diagnostics Ltd | Sample carrier for optical measurements |
| WO2019121564A2 (en) * | 2017-12-24 | 2019-06-27 | Ventana Medical Systems, Inc. | Computational pathology approach for retrospective analysis of tissue-based companion diagnostic driven clinical trial studies |
| CA3130160A1 (en) | 2019-04-04 | 2020-10-08 | Centerline Biomedical, Inc. | Registration of spatial tracking system with augmented reality display |
| JP7440534B2 (en) | 2019-04-04 | 2024-02-28 | センターライン バイオメディカル,インコーポレイテッド | Spatial registration of tracking system and images using 2D image projection |
| AU2020400353A1 (en) | 2019-12-12 | 2022-06-02 | S.D. Sight Diagnostics Ltd | Artificial generation of color blood smear image |
| CN111089967B (en) * | 2020-03-25 | 2020-06-26 | 中南大学湘雅二医院 | Application of skin tissue immune cell in situ detection kit for lupus erythematosus classification |
| WO2021207656A1 (en) * | 2020-04-09 | 2021-10-14 | Ilytica Llc | Assays with induced aggregation for enhanced sensitivity |
| TWI793865B (en) | 2021-11-18 | 2023-02-21 | 倍利科技股份有限公司 | System and method for AI automatic auxiliary labeling |
| CN115541579B (en) * | 2022-10-09 | 2023-07-07 | 广州医科大学附属第一医院(广州呼吸中心) | Method and device for analyzing the proportion of Ki-67 positive tumor cells in tumor slices for non-diagnostic and therapeutic purposes |
| WO2024185434A1 (en) * | 2023-03-03 | 2024-09-12 | ソニーグループ株式会社 | Information processing device, biological specimen analyzing system, and biological specimen analyzing method |
Citations (87)
| Publication number | Priority date | Publication date | Assignee | Title |
|---|---|---|---|---|
| US1914322A (en) * | 1929-01-22 | 1933-06-13 | Everett H Bickley | Device for the comparison of colors |
| US3958122A (en) * | 1974-12-19 | 1976-05-18 | United Technologies Corporation | Exhaust gas analyzer having pressure and temperature compensation |
| US4892817A (en) * | 1987-09-21 | 1990-01-09 | Biogenex Laboratories | Stable phosphatase substrate composition |
| US4902131A (en) * | 1985-03-28 | 1990-02-20 | Kabushiki Kaisha Toshiba | Surface inspection method and apparatus therefor |
| US4904088A (en) * | 1984-08-10 | 1990-02-27 | U.S. Philips Corporation | Method and apparatus for determining radiation wavelengths and wavelength-corrected radiation power of monochromatic light sources |
| US4910398A (en) * | 1987-10-14 | 1990-03-20 | Kabushiki Kaisha Toshiba | Pattern Measurement method |
| US4912034A (en) * | 1987-09-21 | 1990-03-27 | Biogenex Laboratories | Immunoassay test device and method |
| US4927266A (en) * | 1987-03-30 | 1990-05-22 | Anritsu Corporation | Optical signal generating apparatus and optical power meter calibrating system using the same |
| US5015098A (en) * | 1987-10-05 | 1991-05-14 | X-Rite, Incorporated | Densitometer with error correction |
| US5020169A (en) * | 1987-08-13 | 1991-06-04 | Sanwa Shutter Corporation | Elevation bed |
| US5097119A (en) * | 1988-01-09 | 1992-03-17 | Breitmeier Ulrich O | Device for precisely measuring the distance between a test point on a test surface and a reference plane |
| US5115673A (en) * | 1990-07-20 | 1992-05-26 | The United States Of America As Represented By The United States National Aeronautics And Space Administration | Non-destructive method for determining elastic moduli of material |
| US5126577A (en) * | 1991-06-27 | 1992-06-30 | Electro-Optical Industries, Inc. | Infrared target plate handling apparatus with improved thermal control |
| US5309108A (en) * | 1991-07-30 | 1994-05-03 | Hitachi, Ltd. | Method of inspecting thin film transistor liquid crystal substrate and apparatus therefor |
| US5422018A (en) * | 1994-01-31 | 1995-06-06 | Applied Imaging | Centrifuge tube and adaptor |
| US5427910A (en) * | 1992-12-09 | 1995-06-27 | Compucyte Corporation | Method of cytogenetic analysis |
| US5489386A (en) * | 1994-01-31 | 1996-02-06 | Applied Imaging | Density gradient medium for the separation of cells |
| US5492837A (en) * | 1993-08-27 | 1996-02-20 | Biogenex Laboratories | Mounting medium for microscope slide preparations |
| US5517193A (en) * | 1993-04-30 | 1996-05-14 | International Business Machines Corporation | Meteorological workstation |
| US5523207A (en) * | 1994-10-17 | 1996-06-04 | Compucyte Corporation | Method for accurate counting of probe spots in cell nuclei |
| US5602674A (en) * | 1993-07-09 | 1997-02-11 | Compucyte Corp. | Computerized specimen encoder |
| US5633945A (en) * | 1994-10-05 | 1997-05-27 | Compucyte Corporation | Accuracy in cell mitosis analysis |
| US5717198A (en) * | 1995-07-10 | 1998-02-10 | Qc Optics, Inc. | Pellicle reflectivity monitoring system having means for compensating for portions of light reflected by the pellicle |
| US5731156A (en) * | 1996-10-21 | 1998-03-24 | Applied Imaging, Inc. | Use of anti-embryonic hemoglobin antibodies to identify fetal cells |
| US5880473A (en) * | 1997-07-28 | 1999-03-09 | Applied Imaging, Inc. | Multifluor-fluorescence in-situ hybridization (M-FISH) imaging techniques using multiple multiband filters with image registration |
| US5885840A (en) * | 1997-02-10 | 1999-03-23 | Compucyte Corp. | Multiple assays of cell specimens |
| US5889881A (en) * | 1992-10-14 | 1999-03-30 | Oncometrics Imaging Corp. | Method and apparatus for automatically detecting malignancy-associated changes |
| US5916750A (en) * | 1997-01-08 | 1999-06-29 | Biogenex Laboratories | Multifunctional linking reagents for synthesis of branched oligomers |
| US6026174A (en) * | 1992-10-14 | 2000-02-15 | Accumed International, Inc. | System and method for automatically detecting malignant cells and cells having malignancy-associated changes |
| US6031930A (en) * | 1996-08-23 | 2000-02-29 | Bacus Research Laboratories, Inc. | Method and apparatus for testing a progression of neoplasia including cancer chemoprevention testing |
| US6049220A (en) * | 1998-06-10 | 2000-04-11 | Boxer Cross Incorporated | Apparatus and method for evaluating a wafer of semiconductor material |
| US6052190A (en) * | 1997-09-09 | 2000-04-18 | Utoptics, Inc. | Highly accurate three-dimensional surface digitizing system and methods |
| US6169816B1 (en) * | 1997-05-14 | 2001-01-02 | Applied Imaging, Inc. | Identification of objects of interest using multiple illumination schemes and finding overlap of features in corresponding multiple images |
| US6215892B1 (en) * | 1995-11-30 | 2001-04-10 | Chromavision Medical Systems, Inc. | Method and apparatus for automated image analysis of biological specimens |
| US6221607B1 (en) * | 1993-10-07 | 2001-04-24 | Ikonisys Inc. | Automated fluorescence in situ hybridization detection of genetic abnormalities |
| US6225636B1 (en) * | 1996-10-25 | 2001-05-01 | Applied Imaging, Inc. | Multifluor-fluorescence in-situ hybridization (M-FISH) imaging techniques using multiple multiband filters with image registration |
| US6239868B1 (en) * | 1996-01-02 | 2001-05-29 | Lj Laboratories, L.L.C. | Apparatus and method for measuring optical characteristics of an object |
| US6396941B1 (en) * | 1996-08-23 | 2002-05-28 | Bacus Research Laboratories, Inc. | Method and apparatus for internet, intranet, and local viewing of virtual microscope slides |
| US6518554B1 (en) * | 2000-05-24 | 2003-02-11 | Chromavision Medical Systems, Inc. | Reverse focusing methods and systems |
| US6522744B1 (en) * | 2000-05-31 | 2003-02-18 | Jung-Hsun Chiang | Volume control apparatus of telephone |
| US6524798B1 (en) * | 1999-06-18 | 2003-02-25 | Applied Imaging Corporation | High efficiency methods for combined immunocytochemistry and in-situ hybridization |
| US6674058B1 (en) * | 2000-09-20 | 2004-01-06 | Compucyte Corporation | Apparatus and method for focusing a laser scanning cytometer |
| US6674896B1 (en) * | 1999-07-13 | 2004-01-06 | Chromavision Medical Systems, Inc. | Device for applying accurate color thresholds in real time |
| US20040014165A1 (en) * | 2000-06-19 | 2004-01-22 | Joseph Keidar | System and automated and remote histological analysis and new drug assessment |
| US20040027618A1 (en) * | 2002-06-03 | 2004-02-12 | Fuji Photo Film Co., Ltd. | Image defect detecting method |
| US6697509B2 (en) * | 2001-10-04 | 2004-02-24 | Chromavision Medical Systems, Inc. | Method and apparatus for scoring the uptake of markers in cells |
| US20040056966A1 (en) * | 2000-07-21 | 2004-03-25 | Schechner Yoav Y. | Method and apparatus for image mosaicing |
| US6718053B1 (en) * | 1996-11-27 | 2004-04-06 | Chromavision Medical Systems, Inc. | Method and apparatus for automated image analysis of biological specimens |
| US6852986B1 (en) * | 1999-11-12 | 2005-02-08 | E. I. Du Pont De Nemours And Company | Fluorometer with low heat-generating light source |
| US20050037406A1 (en) * | 2002-06-12 | 2005-02-17 | De La Torre-Bueno Jose | Methods and apparatus for analysis of a biological specimen |
| US6876760B1 (en) * | 2000-12-04 | 2005-04-05 | Cytokinetics, Inc. | Classifying cells based on information contained in cell images |
| US6882873B2 (en) * | 1996-01-17 | 2005-04-19 | Respironics, Inc. | Method and system for determining bilirubin concentration |
| US6881580B2 (en) * | 2002-01-22 | 2005-04-19 | Dakocytomation Colorado, Inc. | Environmental containment methods for a flow cytometer |
| US20050106712A1 (en) * | 2003-11-14 | 2005-05-19 | Eastman Kodak Company | Yellow low fluorescence dye for coated optical bead random array DNA analysis |
| US20050105787A1 (en) * | 2002-05-03 | 2005-05-19 | Vialogy Corp., A Delaware Corporation | Technique for extracting arrayed data |
| US20050136509A1 (en) * | 2003-09-10 | 2005-06-23 | Bioimagene, Inc. | Method and system for quantitatively analyzing biological samples |
| US20050282179A1 (en) * | 2003-12-05 | 2005-12-22 | Applera Corporation | Biomarkers for interferon-alpha response in hepatitis C virus infected patients |
| US20060001765A1 (en) * | 2000-10-25 | 2006-01-05 | Yasuo Suda | Image sensing apparatus and its control method, control program, and storage medium |
| US20060015262A1 (en) * | 2003-09-08 | 2006-01-19 | Bioimagene, Inc., San Mateo, Ca | Method and system for automated quantitation of tissue micro-array (TMA) digital image analysis |
| US20060063190A1 (en) * | 2004-09-22 | 2006-03-23 | Tripath Imaging, Inc | Methods and compositions for evaluating breast cancer prognosis |
| US7024316B1 (en) * | 1999-10-21 | 2006-04-04 | Dakocytomation Colorado, Inc. | Transiently dynamic flow cytometer analysis system |
| US7171054B2 (en) * | 2003-05-01 | 2007-01-30 | Eastman Kodak Company | Scene-based method for determining focus |
| US7173663B2 (en) * | 2002-10-31 | 2007-02-06 | Freescale Semiconductor, Inc. | Automatic exposure control system for a digital camera |
| US7189576B2 (en) * | 1995-10-30 | 2007-03-13 | Arkray Inc. | Method for measuring substance and testing piece |
| US7199360B1 (en) * | 2006-01-13 | 2007-04-03 | Jean Montagu | System and method for calibrating a fluorescence microscope |
| US7205154B2 (en) * | 2002-01-31 | 2007-04-17 | Agilent Technologies, Inc. | Calibrating array scanners |
| US7212660B2 (en) * | 2001-01-11 | 2007-05-01 | Clarient, Inc. | System and method for finding regions of interest for microscopic digital montage imaging |
| US7219016B2 (en) * | 2001-04-20 | 2007-05-15 | Yale University | Systems and methods for automated analysis of cells and tissues |
| US20070114388A1 (en) * | 2005-11-02 | 2007-05-24 | Shimadzu Corporation | Imaging mass spectrometer |
| US7224470B2 (en) * | 2000-01-24 | 2007-05-29 | Isis Innovation Limited | Method and apparatus for measuring surface configuration |
| US7224839B2 (en) * | 1998-06-01 | 2007-05-29 | Clarient, Inc. | Compression packaged image transmission for telemicroscopy |
| US7316907B2 (en) * | 2003-09-10 | 2008-01-08 | Board Of Regents, The University Of Texas System | 14-3-3 zeta over-expression as a poor prognosis factor, and a therapeutic target in multiple cancer types |
| US7330250B2 (en) * | 2004-05-18 | 2008-02-12 | Agilent Technologies, Inc. | Nondestructive evaluation of subsurface damage in optical elements |
| US7332290B2 (en) * | 2001-08-02 | 2008-02-19 | The Regents Of The University Of Michigan | Dectection of AMACR cancer markers in urine |
| US7369696B2 (en) * | 2003-04-02 | 2008-05-06 | Ge Healthcare Uk Limited | Classification of cells into subpopulations using cell classifying data |
| US7376256B2 (en) * | 2002-04-16 | 2008-05-20 | Evotec Oai Ag | Method for analyzing chemical and or biological samples by means of particle images |
| US20080118437A1 (en) * | 2006-03-01 | 2008-05-22 | Regents Of The University Of Michigan | Diagnosis and treatment O prostate cancer |
| WO2008143849A2 (en) * | 2007-05-14 | 2008-11-27 | Historx, Inc. | Compartment segregation by pixel characterization using image data clustering |
| US7474777B2 (en) * | 2001-04-28 | 2009-01-06 | Evotec Oai Ag | Device and method for optical measurement of chemical and/or biological samples |
| US7474847B2 (en) * | 2003-06-30 | 2009-01-06 | Nokia Corporation | Method and system in digital imaging for adjusting exposure and a corresponding device |
| US20090074282A1 (en) * | 2007-08-06 | 2009-03-19 | Historx, Inc. | Methods and system for validating sample images for quantitative immunoassays |
| US20090074266A1 (en) * | 2007-08-07 | 2009-03-19 | Historx, Inc. | Method and system for determining an optimal dilution of a reagent |
| US20090086046A1 (en) * | 2007-08-31 | 2009-04-02 | Historx, Inc. | Automatic exposure time selection for imaging tissue |
| US7666663B2 (en) * | 2003-12-24 | 2010-02-23 | Yokogawa Electric Corporation | Correction method for the distribution of quantity of light and biochip-reader |
| US7709222B2 (en) * | 2006-07-13 | 2010-05-04 | Yale University | Methods for making cancer prognoses based on subcellular localization of biomarkers |
| US7873215B2 (en) * | 2007-06-27 | 2011-01-18 | Seiko Epson Corporation | Precise identification of text pixels from scanned document images |
| US7907271B2 (en) * | 2007-06-15 | 2011-03-15 | Historx, Inc. | Method and system for standardizing microscope instruments |
Family Cites Families (151)
| Publication number | Priority date | Publication date | Assignee | Title |
|---|---|---|---|---|
| DE3037622C2 (en) | 1980-10-04 | 1987-02-26 | Theodor Prof. Dr.-Ing. 1000 Berlin Gast | Device for determining surface quality |
| US4480189A (en) | 1981-11-20 | 1984-10-30 | Kasei Optonix, Ltd. | Thermoluminescence dosimeter reader |
| JPH0730753Y2 (en) | 1984-03-02 | 1995-07-19 | 日本ゼニスパイプ株式会社 | Precast concrete casing block |
| US4557599A (en) | 1984-03-06 | 1985-12-10 | General Signal Corporation | Calibration and alignment target plate |
| US4998284A (en) | 1987-11-17 | 1991-03-05 | Cell Analysis Systems, Inc. | Dual color camera microscope and methodology for cell staining and analysis |
| US5134662A (en) | 1985-11-04 | 1992-07-28 | Cell Analysis Systems, Inc. | Dual color camera microscope and methodology for cell staining and analysis |
| JPH06103251B2 (en) | 1989-03-06 | 1994-12-14 | 株式会社ニレコ | Tissue quantification method by image analysis |
| US5068909A (en) | 1989-05-18 | 1991-11-26 | Applied Imaging Corporation | Method and apparatus for generating quantifiable video displays |
| US5070455A (en) | 1989-11-22 | 1991-12-03 | Singer Imaging, Inc. | Imaging system and method using scattered and diffused radiation |
| US5244787A (en) | 1991-01-31 | 1993-09-14 | Biogenex Laboratories | Antigen retrieval in formalin-fixed tissues using microwave energy |
| US6411377B1 (en) | 1991-04-02 | 2002-06-25 | Hitachi, Ltd. | Optical apparatus for defect and particle size inspection |
| JP2907571B2 (en) | 1991-04-15 | 1999-06-21 | 浜松ホトニクス株式会社 | Laser scanning fluorescence microscope |
| CA2084099C (en) | 1991-12-06 | 1996-06-18 | James V. Bacus | Method and apparatus for automated cell analysis |
| US5578452A (en) | 1992-01-16 | 1996-11-26 | Biogenex Laboratories | Enhancement of immunochemical staining in aldehyde-fixed tissues |
| US5254845A (en) | 1992-08-18 | 1993-10-19 | Applied Imaging International Limited | Automatic focusing system using focal length-changing element |
| US6252242B1 (en) | 1992-12-03 | 2001-06-26 | Brown & Sharpe Surface Inspection Systems, Inc. | High speed optical inspection apparatus using Gaussian distribution analysis and method therefore |
| US5439649A (en) | 1993-09-29 | 1995-08-08 | Biogenex Laboratories | Automated staining apparatus |
| US6309601B1 (en) | 1993-11-01 | 2001-10-30 | Nanogen, Inc. | Scanning optical detection system |
| US5432054A (en) | 1994-01-31 | 1995-07-11 | Applied Imaging | Method for separating rare cells from a population of cells |
| US6632598B1 (en) | 1994-03-11 | 2003-10-14 | Biogenex Laboratories | Deparaffinization compositions and methods for their use |
| US6451551B1 (en) | 1994-03-11 | 2002-09-17 | Biogenex Laboratories | Releasing embedding media from tissue specimens |
| US5561556A (en) | 1994-04-21 | 1996-10-01 | Compucyte Corporation | Slide analysis system with slide having self contained microscope analysis information |
| US6463438B1 (en) | 1994-06-03 | 2002-10-08 | Urocor, Inc. | Neural network for cell image analysis for identification of abnormal cells |
| US5672881A (en) | 1994-09-14 | 1997-09-30 | Glyko, Inc. | Charge-coupled device imaging apparatus |
| AU3586195A (en) | 1994-09-20 | 1996-04-09 | Neopath, Inc. | Apparatus for automated identification of cell groupings on a biological specimen |
| US5978497A (en) | 1994-09-20 | 1999-11-02 | Neopath, Inc. | Apparatus for the identification of free-lying cells |
| DE19532897A1 (en) | 1994-09-27 | 1996-03-28 | Zeiss Carl Fa | Camera exposure control by image photometry in photographic microscope |
| GB2294376B (en) | 1994-10-18 | 1999-02-10 | Rank Cintel Ltd | Method and apparatus for correcting noise in a film scanner |
| DE69519980T2 (en) | 1994-12-28 | 2001-06-07 | Siemens Corp. Research, Inc. | Method and device for the detection and interpretation of subtitles in digital video signals |
| EP0815257B1 (en) | 1995-01-31 | 2002-01-02 | BioImage A/S | A method of detecting biologically active substances |
| US5694212A (en) | 1995-06-20 | 1997-12-02 | Compucyte Corporation | Method for calibrating specimen with specimen holder of a microscope |
| CA2185511C (en) | 1995-09-15 | 2008-08-05 | Vladimir Dadeshidze | Cytological specimen analysis system with individualized patient data |
| US6418236B1 (en) | 1999-06-24 | 2002-07-09 | Chromavision Medical Systems, Inc. | Histological reconstruction and automated image analysis |
| US6151405A (en) | 1996-11-27 | 2000-11-21 | Chromavision Medical Systems, Inc. | System and method for cellular specimen grading |
| US6330349B1 (en) | 1995-11-30 | 2001-12-11 | Chromavision Medical Systems, Inc. | Automated method for image analysis of residual protein |
| US6165739A (en) | 1996-03-13 | 2000-12-26 | Compucyte Corporation | Multiple simultaneous testing media |
| AU733647B2 (en) | 1996-05-15 | 2001-05-17 | Biogenex Laboratories | Non-nucleotide linking reagents |
| US6292582B1 (en) | 1996-05-31 | 2001-09-18 | Lin Youling | Method and system for identifying defects in a semiconductor |
| US6458585B1 (en) | 1996-08-14 | 2002-10-01 | Nexell Therapeutics Inc. | Cytokine-free culture of dendritic cells |
| CN100356163C (en) | 1996-08-16 | 2007-12-19 | Ge保健尼亚加拉公司 | Digital imaging system for assays in well plate, gels and blots |
| US6272235B1 (en) | 1997-03-03 | 2001-08-07 | Bacus Research Laboratories, Inc. | Method and apparatus for creating a virtual microscope slide |
| US6404906B2 (en) | 1997-03-03 | 2002-06-11 | Bacus Research Laboratories,Inc. | Method and apparatus for acquiring and reconstructing magnified specimen images from a computer-controlled microscope |
| US6087134A (en) | 1997-01-14 | 2000-07-11 | Applied Imaging Corporation | Method for analyzing DNA from a rare cell in a cell population |
| GB9704054D0 (en) | 1997-02-27 | 1997-04-16 | Univ Cambridge Tech | Assay |
| US5948359A (en) | 1997-03-21 | 1999-09-07 | Biogenex Laboratories | Automated staining apparatus |
| DE69816289T2 (en) | 1997-04-25 | 2004-04-22 | Universiteit Van Amsterdam | PHOTOBLEBLEBLE LUMINESCENT LAYERS FOR CALIBRATION AND STANDARDIZATION IN OPTICAL MICROSCOPY |
| US6259807B1 (en) | 1997-05-14 | 2001-07-10 | Applied Imaging Corp. | Identification of objects of interest using multiple illumination schemes and finding overlap of features in corresponding multiple images |
| US6002788A (en) | 1997-09-24 | 1999-12-14 | Compucyte Corporation | Method and device for rendering cells observable with laser scanning cytometry |
| US5962234A (en) | 1997-10-20 | 1999-10-05 | Applied Imaging Corporation | Use of anti-embryonic epsilon hemoglobin antibodies to identify fetal cells |
| DE19754909C2 (en) | 1997-12-10 | 2001-06-28 | Max Planck Gesellschaft | Method and device for acquiring and processing images of biological tissue |
| JPH11183381A (en) | 1997-12-22 | 1999-07-09 | Bunshi Bio Photonics Kenkyusho:Kk | Fluorescence microscope evaluation method and apparatus |
| US6746873B1 (en) | 1998-02-20 | 2004-06-08 | Xy, Inc. | Vibratory system for a sorting flow cytometer |
| US6699710B1 (en) | 1998-02-25 | 2004-03-02 | The United States Of America As Represented By The Department Of Health And Human Services | Tumor tissue microarrays for rapid molecular profiling |
| US6248590B1 (en) | 1998-02-27 | 2001-06-19 | Cytomation, Inc. | Method and apparatus for flow cytometry |
| US6495106B1 (en) | 1998-03-24 | 2002-12-17 | Biogenex Laboratories | Automated staining apparatus |
| WO2000006980A1 (en) * | 1998-07-27 | 2000-02-10 | Cedars-Sinai Medical Center | Spectral topography of mammalian matter |
| JP3345401B2 (en) | 1998-08-25 | 2002-11-18 | ユニバーシティ オブ ワシントン | Rapid quantitative analysis of proteins or protein functions in complex mixtures |
| DE19915057A1 (en) | 1999-04-01 | 2000-10-19 | Forschungszentrum Borstel | Monoclonal antibodies to the human Mcm3 protein, process for their preparation and their use |
| AU762085B2 (en) | 1999-04-13 | 2003-06-19 | Chromavision Medical Systems, Inc. | Histological reconstruction and automated image analysis |
| US6486915B2 (en) | 1999-04-20 | 2002-11-26 | Intel Corporation | Determining a final exposure setting automatically for a solid state camera without a separate light metering circuit |
| US7151847B2 (en) | 2001-02-20 | 2006-12-19 | Cytokinetics, Inc. | Image analysis of the golgi complex |
| US6496309B1 (en) | 1999-06-18 | 2002-12-17 | Genomic Solutions, Inc. | Automated, CCD-based DNA micro-array imaging system |
| US6453060B1 (en) | 1999-06-29 | 2002-09-17 | Tri Path Imaging, Inc. | Method and apparatus for deriving separate images from multiple chromogens in a branched image analysis system |
| US6445817B1 (en) | 1999-07-13 | 2002-09-03 | Chromavision Medical Systems, Inc. | Apparatus for counting color transitions and areas in real time camera images |
| WO2001011547A1 (en) | 1999-08-04 | 2001-02-15 | Chromavision Medical Systems, Inc. | Method and apparatus for applying color thresholds in light microscopy |
| EP1232392B2 (en) | 1999-10-12 | 2014-04-02 | Oxoid (Ely) Limited | Improved method for the detection of acid resistant bacteria of the genus helicobacter in stool |
| JP2001211896A (en) | 1999-11-26 | 2001-08-07 | Olympus Optical Co Ltd | Image analysis method, device for it, and recording medium |
| US20050230315A1 (en) | 2003-01-13 | 2005-10-20 | Regents Of The University Of Michigan | Protein microarray system |
| US6778714B1 (en) | 2000-03-10 | 2004-08-17 | Imagexpert, Inc. | Portable image analysis system |
| US6408048B2 (en) | 2000-03-14 | 2002-06-18 | Therma-Wave, Inc. | Apparatus for analyzing samples using combined thermal wave and X-ray reflectance measurements |
| US7236623B2 (en) | 2000-04-24 | 2007-06-26 | International Remote Imaging Systems, Inc. | Analyte recognition for urinalysis diagnostic system |
| US6816625B2 (en) | 2000-08-16 | 2004-11-09 | Lewis Jr Clarence A | Distortion free image capture system and method |
| US7298402B2 (en) | 2000-10-26 | 2007-11-20 | Olympus Corporation | Image-pickup apparatus with expanded dynamic range capabilities |
| US7714301B2 (en) | 2000-10-27 | 2010-05-11 | Molecular Devices, Inc. | Instrument excitation source and calibration method |
| GB2406908B (en) | 2000-12-04 | 2005-07-27 | Cytokinetics Inc | Classifying cells based on information contained in cell images |
| US20030215936A1 (en) | 2000-12-13 | 2003-11-20 | Olli Kallioniemi | High-throughput tissue microarray technology and applications |
| US6466690C1 (en) | 2000-12-19 | 2008-11-18 | Bacus Res Lab Inc | Method and apparatus for processing an image of a tissue sample microarray |
| JP3576523B2 (en) | 2000-12-26 | 2004-10-13 | オリンパス株式会社 | Fluorescence luminance measurement method and apparatus |
| EP1352518B1 (en) | 2001-01-11 | 2009-03-04 | Smal Camera Technologies, INC. | Adaptive sensitivity control, on a pixel-by-pixel basis, for a digital imager |
| DE10109130B4 (en) | 2001-02-24 | 2015-02-19 | Carl Zeiss Microscopy Gmbh | Method for recording and displaying fluorescence images with high spatial resolution |
| AU2002254162A1 (en) | 2001-03-08 | 2002-09-24 | Chromavision Medical Systems, Inc. | Apparatus and method for labeling rows and columns in an irregular array |
| JP2002287039A (en) * | 2001-03-22 | 2002-10-03 | Olympus Optical Co Ltd | Photographing device for microscope |
| DE10119005A1 (en) | 2001-04-18 | 2002-10-24 | Roche Diagnostics Gmbh | Process for protein expression starting from stabilized linear short DNA in cell-free in vitro transcription / translation systems with exonuclease-containing lysates or in a cellular system containing exonucleases |
| US7123756B2 (en) | 2001-04-27 | 2006-10-17 | Fuji Photo Film Co., Ltd. | Method and apparatus for standardized fluorescence image generation |
| WO2002098280A2 (en) | 2001-06-04 | 2002-12-12 | Ikonisys Inc. | Method for detecting infectious agents using computer controlled automated image analysis |
| WO2002099429A1 (en) | 2001-06-05 | 2002-12-12 | Genomics, Ltd. | Compositions and methods for the detection of biomarkers associated with cardiovascular disease |
| US7133543B2 (en) | 2001-06-12 | 2006-11-07 | Applied Imaging Corporation | Automated scanning method for pathology samples |
| US7116354B2 (en) | 2001-06-20 | 2006-10-03 | Xenogen Corporation | Absolute intensity determination for a light source in low level light imaging systems |
| JP3788279B2 (en) | 2001-07-09 | 2006-06-21 | 株式会社日立製作所 | Pattern inspection method and apparatus |
| US20030099973A1 (en) | 2001-07-18 | 2003-05-29 | University Of Louisville Research Foundation, Inc. | E-GeneChip online web service for data mining bioinformatics |
| US7229774B2 (en) | 2001-08-02 | 2007-06-12 | Regents Of The University Of Michigan | Expression profile of prostate cancer |
| US6648506B2 (en) | 2001-09-07 | 2003-11-18 | Board Of Trustees Of Michigan State University | Fluorescence emission ratio imaging thermography for use in heat transfer analysis |
| GB0130845D0 (en) | 2001-12-22 | 2002-02-06 | James Peter | Analysis |
| US7383134B2 (en) | 2002-01-15 | 2008-06-03 | Piper James R | Method and/or system for analyzing biological samples using a computer system |
| AU2003210592A1 (en) | 2002-01-18 | 2003-12-02 | The Government Of The United States Of America As Represented By The Secretary Of The Department Of | Simulating microarrays using a parameterized model |
| US20030165263A1 (en) | 2002-02-19 | 2003-09-04 | Hamer Michael J. | Histological assessment |
| JP2003284713A (en) | 2002-03-28 | 2003-10-07 | Konica Corp | Image processing device for medical use, image processing parameter correcting method, program, and storage medium |
| JP2003294734A (en) | 2002-03-29 | 2003-10-15 | Mitsubishi Chemicals Corp | Analytical method of interaction between molecules |
| WO2003098522A1 (en) | 2002-05-17 | 2003-11-27 | Pfizer Products Inc. | Apparatus and method for statistical image analysis |
| US7272252B2 (en) | 2002-06-12 | 2007-09-18 | Clarient, Inc. | Automated system for combining bright field and fluorescent microscopy |
| US6800249B2 (en) | 2002-06-14 | 2004-10-05 | Chromavision Medical Systems, Inc. | Automated slide staining apparatus |
| US20060127946A1 (en) | 2002-08-16 | 2006-06-15 | Montagu Jean I | Reading of fluorescent arrays |
| WO2004025569A2 (en) | 2002-09-13 | 2004-03-25 | Arcturus Bioscience, Inc. | Tissue image analysis for cell classification and laser capture microdissection |
| JP2004157018A (en) | 2002-11-06 | 2004-06-03 | Dkk Toa Corp | Sensitivity calibration method for fluorescence detection device and fluorescence detection device |
| GB2395263A (en) | 2002-11-12 | 2004-05-19 | Qinetiq Ltd | Image analysis |
| GB2396406A (en) | 2002-12-17 | 2004-06-23 | Qinetiq Ltd | Image analysis |
| US7648678B2 (en) | 2002-12-20 | 2010-01-19 | Dako Denmark A/S | Method and system for pretreatment of tissue slides |
| JP4389445B2 (en) | 2003-01-10 | 2009-12-24 | 株式会社ニコン | Laser microscope |
| US7062079B2 (en) | 2003-02-14 | 2006-06-13 | Ikonisys, Inc. | Method and system for image segmentation |
| US7233340B2 (en) | 2003-02-27 | 2007-06-19 | Applied Imaging Corp. | Linking of images to enable simultaneous viewing of multiple objects |
| US7064829B2 (en) | 2003-03-20 | 2006-06-20 | Timbre Technologies, Inc. | Generic interface for an optical metrology system |
| US7084386B2 (en) | 2003-05-02 | 2006-08-01 | International Business Machines Corporation | System and method for light source calibration |
| JP2004354346A (en) | 2003-05-30 | 2004-12-16 | Olympus Corp | Measuring device |
| JP4504644B2 (en) | 2003-08-26 | 2010-07-14 | オリンパス株式会社 | Microscope image imaging apparatus and microscope image imaging method |
| US20050136549A1 (en) | 2003-10-30 | 2005-06-23 | Bioimagene, Inc. | Method and system for automatically determining diagnostic saliency of digital images |
| US7760927B2 (en) | 2003-09-10 | 2010-07-20 | Bioimagene, Inc. | Method and system for digital image based tissue independent simultaneous nucleus cytoplasm and membrane quantitation |
| DE10343375A1 (en) | 2003-09-17 | 2005-04-28 | Axaron Bioscience Ag | Method for the detection and analysis of protein-protein interactions |
| WO2005076197A2 (en) | 2004-01-31 | 2005-08-18 | Bioimagene, Inc. | Method and system for morphology based mitosis identification and classification of digital images |
| WO2005076216A2 (en) | 2004-02-03 | 2005-08-18 | Bioimagene, Inc. | Method and system for automaticed digital image based flourescent in situ hybridization (fish) analysis |
| US7333845B2 (en) | 2004-02-06 | 2008-02-19 | Wake Forest University Health Sciences | Non-invasive imaging for determination of global tissue characteristics |
| JP4338551B2 (en) | 2004-03-04 | 2009-10-07 | 富士フイルム株式会社 | Image reproduction method, image reproduction apparatus, and image reproduction program |
| WO2005096225A1 (en) | 2004-03-27 | 2005-10-13 | Bioimagene, Inc. | Method and system for automated detection of immunohistochemical (ihc) patterns |
| JP2005331394A (en) | 2004-05-20 | 2005-12-02 | Olympus Corp | Image processor |
| WO2005114578A1 (en) | 2004-05-21 | 2005-12-01 | Bioimagene, Inc. | Method and system for automated quantitation of tissue micro-array (tma) digital image analysis |
| EP1779088B1 (en) | 2004-08-06 | 2016-03-09 | Compucyte Corporation | Multiple-color monochromatic light absorption and quantification of light absorption in a stained sample |
| WO2006039396A2 (en) | 2004-10-01 | 2006-04-13 | Ambion, Inc. | Non-embedded tissue microarray technology for protein and nucleic acid analyses |
| CA2587765A1 (en) | 2004-11-17 | 2006-05-26 | Immunivest Corporation | Magnetic enrichment of circulating cells, fragments and debris for enabling hts proteomics and genomics in disease detection |
| US20060160169A1 (en) | 2004-12-03 | 2006-07-20 | Board Of Regents, The University Of Texas System | Cell microarray for profiling of cellular phenotypes and gene function |
| JP2006194711A (en) | 2005-01-13 | 2006-07-27 | Matsushita Electric Ind Co Ltd | Method and apparatus for evaluating the performance of fluorescent dyes |
| JP4982385B2 (en) | 2005-02-01 | 2012-07-25 | アムニス コーポレイション | Analysis of blood and cells using an imaging flow cytometer |
| GB0503087D0 (en) | 2005-02-15 | 2005-03-23 | Medical Solutions Plc | Apparatus and method for processing of specimen images for use in computer analysis thereof |
| WO2007024264A2 (en) | 2005-02-23 | 2007-03-01 | Bioimagene, Inc. | Method and system for digital image based tissue independent simultaneous nucleus, cytoplasm and membrane quantitation |
| WO2006102233A2 (en) | 2005-03-18 | 2006-09-28 | Immunivest Corporation | Method and apparatus for imaging target components in a biological sample using permanent magnets |
| EP1872124A4 (en) | 2005-04-19 | 2008-06-11 | Prediction Sciences Llc | Diagnostic markers of breast cancer treatment and progression and methods of use thereof |
| BRPI0501535B8 (en) | 2005-04-26 | 2021-07-27 | Mario Augusto Pazoti | Guignardia citricarpa identification method |
| WO2006122251A2 (en) | 2005-05-10 | 2006-11-16 | Bioimagene, Inc. | Method and system for automated digital image analysis of prostrate neoplasms using morphologic patterns |
| AU2006254923A1 (en) | 2005-06-08 | 2006-12-14 | Vanderbilt University | Analysis of tissue samples surrounding malignancies |
| WO2006133460A2 (en) | 2005-06-09 | 2006-12-14 | Yale University | Methods for diagnosing and treating breast cancer based on a her/er ratio |
| US7557963B2 (en) | 2005-08-12 | 2009-07-07 | Seiko Epson Corporation | Label aided copy enhancement |
| GB2430026A (en) | 2005-09-09 | 2007-03-14 | Qinetiq Ltd | Automated selection of image regions |
| ES2434491T3 (en) | 2005-10-13 | 2013-12-16 | Funda��O D. Anna Sommer Champalimaud E Dr. Carlos Montez Champalimaud | In situ multiplex immunohistochemical analysis |
| CA2642542C (en) | 2006-02-16 | 2012-09-25 | Ventana Medical Systems, Inc. | Reagents and methods for cancer prognosis and pathological staging |
| JP4748719B2 (en) | 2006-03-02 | 2011-08-17 | 国立大学法人大阪大学 | Methods for quantifying specific proteins in living cells and preparing standard fluorescent microbeads |
| JP2007271484A (en) | 2006-03-31 | 2007-10-18 | Toyobo Co Ltd | Method of improving sensitivity of cell component analysis device |
| JP4864519B2 (en) | 2006-04-11 | 2012-02-01 | 浜松ホトニクス株式会社 | Light measurement apparatus, light measurement method, and light measurement program |
| JP2009537021A (en) | 2006-05-12 | 2009-10-22 | ベリデックス・リミテッド・ライアビリティ・カンパニー | Laser irradiation system in fluorescence microscopy |
| EP2043509B2 (en) | 2006-07-25 | 2016-05-25 | The Procter and Gamble Company | Methods and products for analyzing gingival tissues |
| EP2626067A1 (en) | 2006-12-26 | 2013-08-14 | Pharmacyclics, Inc. | Method of using histone deacetylase inhibitors and monitoring biomarkers in combination therapy |
| WO2009020621A1 (en) | 2007-08-07 | 2009-02-12 | Historx, Inc. | Method and system for determining an optimal dilution of a reagent |
| TWI335252B (en) | 2007-11-30 | 2011-01-01 | Ind Tech Res Inst | Calibration strip and the laser calibration system using thereof |
| ES2573945T3 (en) | 2008-09-16 | 2016-06-13 | Novartis Ag | Reproducible quantification of biomarker expression |
-
2009
- 2009-09-15 ES ES09792559.8T patent/ES2573945T3/en active Active
- 2009-09-15 CN CN200980137750.0A patent/CN102165489B/en active Active
- 2009-09-15 JP JP2011527047A patent/JP5551702B2/en active Active
- 2009-09-15 CA CA2737116A patent/CA2737116C/en active Active
- 2009-09-15 US US12/560,129 patent/US9240043B2/en active Active
- 2009-09-15 EP EP09792559.8A patent/EP2335221B8/en active Active
- 2009-09-15 AU AU2009293380A patent/AU2009293380B2/en active Active
- 2009-09-15 WO PCT/US2009/056996 patent/WO2010033508A1/en active Application Filing
Patent Citations (101)
| Publication number | Priority date | Publication date | Assignee | Title |
|---|---|---|---|---|
| US1914322A (en) * | 1929-01-22 | 1933-06-13 | Everett H Bickley | Device for the comparison of colors |
| US3958122A (en) * | 1974-12-19 | 1976-05-18 | United Technologies Corporation | Exhaust gas analyzer having pressure and temperature compensation |
| US4904088A (en) * | 1984-08-10 | 1990-02-27 | U.S. Philips Corporation | Method and apparatus for determining radiation wavelengths and wavelength-corrected radiation power of monochromatic light sources |
| US4902131A (en) * | 1985-03-28 | 1990-02-20 | Kabushiki Kaisha Toshiba | Surface inspection method and apparatus therefor |
| US4927266A (en) * | 1987-03-30 | 1990-05-22 | Anritsu Corporation | Optical signal generating apparatus and optical power meter calibrating system using the same |
| US5020169A (en) * | 1987-08-13 | 1991-06-04 | Sanwa Shutter Corporation | Elevation bed |
| US4892817A (en) * | 1987-09-21 | 1990-01-09 | Biogenex Laboratories | Stable phosphatase substrate composition |
| US4912034A (en) * | 1987-09-21 | 1990-03-27 | Biogenex Laboratories | Immunoassay test device and method |
| US5015098A (en) * | 1987-10-05 | 1991-05-14 | X-Rite, Incorporated | Densitometer with error correction |
| US4910398A (en) * | 1987-10-14 | 1990-03-20 | Kabushiki Kaisha Toshiba | Pattern Measurement method |
| US5097119A (en) * | 1988-01-09 | 1992-03-17 | Breitmeier Ulrich O | Device for precisely measuring the distance between a test point on a test surface and a reference plane |
| US5115673A (en) * | 1990-07-20 | 1992-05-26 | The United States Of America As Represented By The United States National Aeronautics And Space Administration | Non-destructive method for determining elastic moduli of material |
| US5126577A (en) * | 1991-06-27 | 1992-06-30 | Electro-Optical Industries, Inc. | Infrared target plate handling apparatus with improved thermal control |
| US5309108A (en) * | 1991-07-30 | 1994-05-03 | Hitachi, Ltd. | Method of inspecting thin film transistor liquid crystal substrate and apparatus therefor |
| US6026174A (en) * | 1992-10-14 | 2000-02-15 | Accumed International, Inc. | System and method for automatically detecting malignant cells and cells having malignancy-associated changes |
| US5889881A (en) * | 1992-10-14 | 1999-03-30 | Oncometrics Imaging Corp. | Method and apparatus for automatically detecting malignancy-associated changes |
| US5427910A (en) * | 1992-12-09 | 1995-06-27 | Compucyte Corporation | Method of cytogenetic analysis |
| US5517193A (en) * | 1993-04-30 | 1996-05-14 | International Business Machines Corporation | Meteorological workstation |
| US5602674A (en) * | 1993-07-09 | 1997-02-11 | Compucyte Corp. | Computerized specimen encoder |
| US5492837A (en) * | 1993-08-27 | 1996-02-20 | Biogenex Laboratories | Mounting medium for microscope slide preparations |
| US6221607B1 (en) * | 1993-10-07 | 2001-04-24 | Ikonisys Inc. | Automated fluorescence in situ hybridization detection of genetic abnormalities |
| US5489386A (en) * | 1994-01-31 | 1996-02-06 | Applied Imaging | Density gradient medium for the separation of cells |
| US5422018A (en) * | 1994-01-31 | 1995-06-06 | Applied Imaging | Centrifuge tube and adaptor |
| US5633945A (en) * | 1994-10-05 | 1997-05-27 | Compucyte Corporation | Accuracy in cell mitosis analysis |
| US5523207A (en) * | 1994-10-17 | 1996-06-04 | Compucyte Corporation | Method for accurate counting of probe spots in cell nuclei |
| US5717198A (en) * | 1995-07-10 | 1998-02-10 | Qc Optics, Inc. | Pellicle reflectivity monitoring system having means for compensating for portions of light reflected by the pellicle |
| US7189576B2 (en) * | 1995-10-30 | 2007-03-13 | Arkray Inc. | Method for measuring substance and testing piece |
| US7177454B2 (en) * | 1995-11-30 | 2007-02-13 | Clarient, Inc. | Automated detection of objects in a biological sample |
| US6553135B1 (en) * | 1995-11-30 | 2003-04-22 | Chromavision Medical Systems, Inc. | Method and apparatus for automated image analysis of biological specimens |
| US6215892B1 (en) * | 1995-11-30 | 2001-04-10 | Chromavision Medical Systems, Inc. | Method and apparatus for automated image analysis of biological specimens |
| US6546123B1 (en) * | 1995-11-30 | 2003-04-08 | Chromavision Medical Systems, Inc. | Automated detection of objects in a biological sample |
| US6239868B1 (en) * | 1996-01-02 | 2001-05-29 | Lj Laboratories, L.L.C. | Apparatus and method for measuring optical characteristics of an object |
| US6882873B2 (en) * | 1996-01-17 | 2005-04-19 | Respironics, Inc. | Method and system for determining bilirubin concentration |
| US6226392B1 (en) * | 1996-08-23 | 2001-05-01 | Bacus Research Laboratories, Inc. | Method and apparatus for acquiring and reconstructing magnified specimen images from a computer-controlled microscope |
| US6031930A (en) * | 1996-08-23 | 2000-02-29 | Bacus Research Laboratories, Inc. | Method and apparatus for testing a progression of neoplasia including cancer chemoprevention testing |
| US6396941B1 (en) * | 1996-08-23 | 2002-05-28 | Bacus Research Laboratories, Inc. | Method and apparatus for internet, intranet, and local viewing of virtual microscope slides |
| US5731156A (en) * | 1996-10-21 | 1998-03-24 | Applied Imaging, Inc. | Use of anti-embryonic hemoglobin antibodies to identify fetal cells |
| US6225636B1 (en) * | 1996-10-25 | 2001-05-01 | Applied Imaging, Inc. | Multifluor-fluorescence in-situ hybridization (M-FISH) imaging techniques using multiple multiband filters with image registration |
| US6718053B1 (en) * | 1996-11-27 | 2004-04-06 | Chromavision Medical Systems, Inc. | Method and apparatus for automated image analysis of biological specimens |
| US7190818B2 (en) * | 1996-11-27 | 2007-03-13 | Clarient, Inc. | Method and apparatus for automated image analysis of biological specimens |
| US5916750A (en) * | 1997-01-08 | 1999-06-29 | Biogenex Laboratories | Multifunctional linking reagents for synthesis of branched oligomers |
| US5885840A (en) * | 1997-02-10 | 1999-03-23 | Compucyte Corp. | Multiple assays of cell specimens |
| US6169816B1 (en) * | 1997-05-14 | 2001-01-02 | Applied Imaging, Inc. | Identification of objects of interest using multiple illumination schemes and finding overlap of features in corresponding multiple images |
| US5880473A (en) * | 1997-07-28 | 1999-03-09 | Applied Imaging, Inc. | Multifluor-fluorescence in-situ hybridization (M-FISH) imaging techniques using multiple multiband filters with image registration |
| US6052190A (en) * | 1997-09-09 | 2000-04-18 | Utoptics, Inc. | Highly accurate three-dimensional surface digitizing system and methods |
| US7224839B2 (en) * | 1998-06-01 | 2007-05-29 | Clarient, Inc. | Compression packaged image transmission for telemicroscopy |
| US6049220A (en) * | 1998-06-10 | 2000-04-11 | Boxer Cross Incorporated | Apparatus and method for evaluating a wafer of semiconductor material |
| US6524798B1 (en) * | 1999-06-18 | 2003-02-25 | Applied Imaging Corporation | High efficiency methods for combined immunocytochemistry and in-situ hybridization |
| US6674896B1 (en) * | 1999-07-13 | 2004-01-06 | Chromavision Medical Systems, Inc. | Device for applying accurate color thresholds in real time |
| US7024316B1 (en) * | 1999-10-21 | 2006-04-04 | Dakocytomation Colorado, Inc. | Transiently dynamic flow cytometer analysis system |
| US6852986B1 (en) * | 1999-11-12 | 2005-02-08 | E. I. Du Pont De Nemours And Company | Fluorometer with low heat-generating light source |
| US7224470B2 (en) * | 2000-01-24 | 2007-05-29 | Isis Innovation Limited | Method and apparatus for measuring surface configuration |
| US6518554B1 (en) * | 2000-05-24 | 2003-02-11 | Chromavision Medical Systems, Inc. | Reverse focusing methods and systems |
| US6900426B2 (en) * | 2000-05-24 | 2005-05-31 | Chromavision Medical Systems, Inc. | Reverse focusing methods and systems |
| US6522744B1 (en) * | 2000-05-31 | 2003-02-18 | Jung-Hsun Chiang | Volume control apparatus of telephone |
| US20040014165A1 (en) * | 2000-06-19 | 2004-01-22 | Joseph Keidar | System and automated and remote histological analysis and new drug assessment |
| US20040056966A1 (en) * | 2000-07-21 | 2004-03-25 | Schechner Yoav Y. | Method and apparatus for image mosaicing |
| US6674058B1 (en) * | 2000-09-20 | 2004-01-06 | Compucyte Corporation | Apparatus and method for focusing a laser scanning cytometer |
| US20060001765A1 (en) * | 2000-10-25 | 2006-01-05 | Yasuo Suda | Image sensing apparatus and its control method, control program, and storage medium |
| US6876760B1 (en) * | 2000-12-04 | 2005-04-05 | Cytokinetics, Inc. | Classifying cells based on information contained in cell images |
| US7212660B2 (en) * | 2001-01-11 | 2007-05-01 | Clarient, Inc. | System and method for finding regions of interest for microscopic digital montage imaging |
| US20080013816A1 (en) * | 2001-04-20 | 2008-01-17 | Yale University | Systems and methods for automated analysis of cells and tissues |
| US7219016B2 (en) * | 2001-04-20 | 2007-05-15 | Yale University | Systems and methods for automated analysis of cells and tissues |
| US7474777B2 (en) * | 2001-04-28 | 2009-01-06 | Evotec Oai Ag | Device and method for optical measurement of chemical and/or biological samples |
| US7332290B2 (en) * | 2001-08-02 | 2008-02-19 | The Regents Of The University Of Michigan | Dectection of AMACR cancer markers in urine |
| US6697509B2 (en) * | 2001-10-04 | 2004-02-24 | Chromavision Medical Systems, Inc. | Method and apparatus for scoring the uptake of markers in cells |
| US6881580B2 (en) * | 2002-01-22 | 2005-04-19 | Dakocytomation Colorado, Inc. | Environmental containment methods for a flow cytometer |
| US7205154B2 (en) * | 2002-01-31 | 2007-04-17 | Agilent Technologies, Inc. | Calibrating array scanners |
| US7376256B2 (en) * | 2002-04-16 | 2008-05-20 | Evotec Oai Ag | Method for analyzing chemical and or biological samples by means of particle images |
| US20050105787A1 (en) * | 2002-05-03 | 2005-05-19 | Vialogy Corp., A Delaware Corporation | Technique for extracting arrayed data |
| US7006680B2 (en) * | 2002-05-03 | 2006-02-28 | Vialogy Corp. | System and method for characterizing microarray output data |
| US20040027618A1 (en) * | 2002-06-03 | 2004-02-12 | Fuji Photo Film Co., Ltd. | Image defect detecting method |
| US20050037406A1 (en) * | 2002-06-12 | 2005-02-17 | De La Torre-Bueno Jose | Methods and apparatus for analysis of a biological specimen |
| US7173663B2 (en) * | 2002-10-31 | 2007-02-06 | Freescale Semiconductor, Inc. | Automatic exposure control system for a digital camera |
| US7369696B2 (en) * | 2003-04-02 | 2008-05-06 | Ge Healthcare Uk Limited | Classification of cells into subpopulations using cell classifying data |
| US7171054B2 (en) * | 2003-05-01 | 2007-01-30 | Eastman Kodak Company | Scene-based method for determining focus |
| US7474847B2 (en) * | 2003-06-30 | 2009-01-06 | Nokia Corporation | Method and system in digital imaging for adjusting exposure and a corresponding device |
| US20060015262A1 (en) * | 2003-09-08 | 2006-01-19 | Bioimagene, Inc., San Mateo, Ca | Method and system for automated quantitation of tissue micro-array (TMA) digital image analysis |
| US20050136509A1 (en) * | 2003-09-10 | 2005-06-23 | Bioimagene, Inc. | Method and system for quantitatively analyzing biological samples |
| US7316907B2 (en) * | 2003-09-10 | 2008-01-08 | Board Of Regents, The University Of Texas System | 14-3-3 zeta over-expression as a poor prognosis factor, and a therapeutic target in multiple cancer types |
| US7941275B2 (en) * | 2003-09-10 | 2011-05-10 | Ventana Medical Systems, Inc. | Method and system for automated detection of immunohistochemical (IHC) patterns |
| US20050106712A1 (en) * | 2003-11-14 | 2005-05-19 | Eastman Kodak Company | Yellow low fluorescence dye for coated optical bead random array DNA analysis |
| US20050282179A1 (en) * | 2003-12-05 | 2005-12-22 | Applera Corporation | Biomarkers for interferon-alpha response in hepatitis C virus infected patients |
| US7666663B2 (en) * | 2003-12-24 | 2010-02-23 | Yokogawa Electric Corporation | Correction method for the distribution of quantity of light and biochip-reader |
| US7330250B2 (en) * | 2004-05-18 | 2008-02-12 | Agilent Technologies, Inc. | Nondestructive evaluation of subsurface damage in optical elements |
| US7899623B2 (en) * | 2004-09-22 | 2011-03-01 | Tripath Imaging, Inc. | Methods and computer program products for analysis and optimization of marker candidates for cancer prognosis |
| US20060063190A1 (en) * | 2004-09-22 | 2006-03-23 | Tripath Imaging, Inc | Methods and compositions for evaluating breast cancer prognosis |
| US20070114388A1 (en) * | 2005-11-02 | 2007-05-24 | Shimadzu Corporation | Imaging mass spectrometer |
| US7199360B1 (en) * | 2006-01-13 | 2007-04-03 | Jean Montagu | System and method for calibrating a fluorescence microscope |
| US20080118437A1 (en) * | 2006-03-01 | 2008-05-22 | Regents Of The University Of Michigan | Diagnosis and treatment O prostate cancer |
| US7709222B2 (en) * | 2006-07-13 | 2010-05-04 | Yale University | Methods for making cancer prognoses based on subcellular localization of biomarkers |
| US20090034823A1 (en) * | 2007-05-14 | 2009-02-05 | Historx, Inc. | Compartment segregation by pixel characterization using image data clustering |
| WO2008143849A2 (en) * | 2007-05-14 | 2008-11-27 | Historx, Inc. | Compartment segregation by pixel characterization using image data clustering |
| US7907271B2 (en) * | 2007-06-15 | 2011-03-15 | Historx, Inc. | Method and system for standardizing microscope instruments |
| US20110116086A1 (en) * | 2007-06-15 | 2011-05-19 | Historx, Inc. | Method and system for standardizing microscope instruments |
| US20110116087A1 (en) * | 2007-06-15 | 2011-05-19 | Historx, Inc. | Method and system for standardizing microscope instruments |
| US7873215B2 (en) * | 2007-06-27 | 2011-01-18 | Seiko Epson Corporation | Precise identification of text pixels from scanned document images |
| US20090074282A1 (en) * | 2007-08-06 | 2009-03-19 | Historx, Inc. | Methods and system for validating sample images for quantitative immunoassays |
| US8160348B2 (en) * | 2007-08-06 | 2012-04-17 | Historx, Inc. | Methods and system for validating sample images for quantitative immunoassays |
| US20090074266A1 (en) * | 2007-08-07 | 2009-03-19 | Historx, Inc. | Method and system for determining an optimal dilution of a reagent |
| US20090086046A1 (en) * | 2007-08-31 | 2009-04-02 | Historx, Inc. | Automatic exposure time selection for imaging tissue |
Non-Patent Citations (6)
| Title |
|---|
| Bibliographic data for [Christiansen et al. Quantitative proteomics using AQUA(TM) technology. Human Immunology, October 2006, volume 67, page S43] obtained online on 10 September 2014 from > 2 pages. * |
| Camp et al. Automated subcellular localization and quantification of protein expression in tissue microarrays. Nature Medicine, volume 8, 2002, pages 1323-1328. * |
| Christiansen et al. Quantitative proteomics using AQUA(TM) technology. Human Immunology, October 2006, volume 67, page S43. * |
| Machine learning. Websters new world computer dictionary, 2003, 2 pages. Hoboken, NJ: Wiley. Retrieved online from > on 12 March 2015. * |
| Rubin et al. Quantitative determination of expression of the prostate cancer protein alpha-methylacyl-CoA racemase using automated quantitative analysis (AQUA): A novel paradigm for automated and continuous biomarker measurements. American Journal of Pathology, volume 164, 2004, pages 831-840. * |
| Schweitzer et al. Multiplexed protein profiling on microarrays by rolling-circle amplification. Nature Biotechnology, volume 20, 2002, pages 359-365. * |
Cited By (120)
| Publication number | Priority date | Publication date | Assignee | Title |
|---|---|---|---|---|
| US8600168B2 (en) * | 2006-09-13 | 2013-12-03 | Fluidigm Corporation | Methods and systems for image processing of microfluidic devices |
| US20140133732A1 (en) * | 2006-09-13 | 2014-05-15 | Fluidigm Corporation | Methods and systems for image processing of microfluidic devices |
| US8849037B2 (en) * | 2006-09-13 | 2014-09-30 | Fluidigm Corporation | Methods and systems for image processing of microfluidic devices |
| US8655037B2 (en) | 2007-05-14 | 2014-02-18 | Historx, Inc. | Compartment segregation by pixel characterization using image data clustering |
| US9080978B2 (en) | 2007-06-15 | 2015-07-14 | Novartis Ag | Method and system for standardizing microscope instruments |
| US8120768B2 (en) | 2007-06-15 | 2012-02-21 | Historx, Inc. | Method and system for standardizing microscope instruments |
| US20110228993A1 (en) * | 2007-08-31 | 2011-09-22 | Historx, Inc. | Automatic exposure time selection for imaging tissue |
| US8878983B2 (en) | 2007-08-31 | 2014-11-04 | Historx, Inc. | Automatic exposure time selection for imaging tissue |
| WO2012075377A1 (en) | 2010-12-03 | 2012-06-07 | Historx, Inc. | Identification of cancer patients likely to benefit from radiation therapy |
| US20130336542A1 (en) * | 2011-03-04 | 2013-12-19 | Nec Corporation | Individual product identification system, individual product identification method, and device and program used by same |
| US9436959B2 (en) | 2011-03-04 | 2016-09-06 | Nec Corporation | Individual product identification system, individual product identification method, and device and program used by same |
| US9152861B2 (en) * | 2011-03-04 | 2015-10-06 | Nec Corporation | Individual product identification system, individual product identification method, and device and program used by same |
| US9458442B2 (en) | 2011-10-24 | 2016-10-04 | Halozyme, Inc. | Companion diagnostic for anti-hyaluronan agent therapy and methods of use thereof |
| US8846034B2 (en) | 2011-10-24 | 2014-09-30 | Halozyme, Inc. | Companion diagnostic for anti-hyaluronan agent therapy and methods of use thereof |
| WO2013063155A2 (en) | 2011-10-24 | 2013-05-02 | Halozyme, Inc. | Companion diagnostic for anti-hyaluronan agent therapy and methods of use thereof |
| EP2915542A1 (en) | 2011-10-24 | 2015-09-09 | Halozyme, Inc. | Companion diagnostic for anti-hyaluronan agent therapy and methods of use thereof |
| US9278124B2 (en) | 2012-10-16 | 2016-03-08 | Halozyme, Inc. | Hypoxia and hyaluronan and markers thereof for diagnosis and monitoring of diseases and conditions and related methods |
| WO2014062856A1 (en) | 2012-10-16 | 2014-04-24 | Halozyme, Inc. | Hypoxia and hyaluronan and markers thereof for diagnosis and monitoring of diseases and conditions and related methods |
| US20170103279A1 (en) * | 2013-05-01 | 2017-04-13 | Life Technologies Holdings Pte Limited | Method and system for projecting image with differing exposure times |
| US10115034B2 (en) * | 2013-05-01 | 2018-10-30 | Life Technologies Holdings Pte Limited | Method and system for projecting image with differing exposure times |
| US20190034755A1 (en) * | 2013-05-01 | 2019-01-31 | Life Technologies Holdings Pte Limited | Method and system for projecting image with differing exposure times |
| US10225483B1 (en) * | 2013-05-01 | 2019-03-05 | Pierce Biotechnology, Inc. | Method and system for projecting image with differing exposure times |
| EP3100025B1 (en) * | 2014-01-30 | 2021-03-03 | BD Kiestra B.V. | System and method for imaging biological samples disposed in culture media |
| US10200625B2 (en) * | 2014-01-30 | 2019-02-05 | Bd Kiestra B.V. | System and method for image acquisition using supervised high quality imaging |
| US10841503B2 (en) | 2014-01-30 | 2020-11-17 | Bd Kiestra B.V. | System and method for image acquisition using supervised high quality imaging |
| US20170013181A1 (en) * | 2014-01-30 | 2017-01-12 | Bd Kiestra B.V. | A system and method for image acquisition using supervised high quality imaging |
| EP3851832A1 (en) * | 2014-01-30 | 2021-07-21 | BD Kiestra B.V. | A system and method for image acquisition using supervised high quality imaging |
| US11788149B2 (en) | 2014-02-21 | 2023-10-17 | Ventana Medical Systems, Inc. | Single-stranded oligonucleotide probes for chromosome or gene copy enumeration |
| US10752955B2 (en) * | 2014-02-21 | 2020-08-25 | Ventana Medical Systems, Inc. | Single-stranded oligonucleotide probes for chromosome or gene copy enumeration |
| US11060967B2 (en) * | 2014-02-28 | 2021-07-13 | Nueon Inc. | Method and apparatus for determining markers of health by analysis of blood |
| WO2016033555A1 (en) | 2014-08-28 | 2016-03-03 | Halozyme, Inc. | Combination therapy with a hyaluronan-degrading enzyme and an immune checkpoint inhibitor |
| US11414489B2 (en) | 2014-08-28 | 2022-08-16 | Halozyme, Inc. | Combination therapy with a hyaluronan-degrading enzyme and an immune checkpoint inhibitor |
| US11584923B2 (en) | 2014-10-14 | 2023-02-21 | Halozyme, Inc. | Compositions of adenosine deaminase-2 (ADA2), variants thereof and methods of using same |
| US9969998B2 (en) | 2014-10-14 | 2018-05-15 | Halozyme, Inc. | Compositions of adenosine deaminase-2 (ADA2), variants thereof and methods of using same |
| US11663717B2 (en) | 2014-12-03 | 2023-05-30 | Ventana Medical Systems, Inc. | Methods, systems, and apparatuses for quantitative analysis of heterogeneous biomarker distribution |
| EP3273223A4 (en) * | 2015-03-17 | 2018-09-26 | Hamamatsu Photonics K.K. | Device for generating fluorescence image and method for generating fluorescence image |
| WO2017032867A1 (en) | 2015-08-27 | 2017-03-02 | INSERM (Institut National de la Santé et de la Recherche Médicale) | Methods for predicting the survival time of patients suffering from a lung cancer |
| US11361561B2 (en) | 2015-09-02 | 2022-06-14 | Ventana Medical Systems, Inc. | Automated analysis of cellular samples having intermixing of analytically distinct patterns of analyte staining |
| US10747986B2 (en) * | 2015-09-02 | 2020-08-18 | Ventana Medical Systems, Inc. | Automated analysis of cellular samples having intermixing of analytically distinct patterns of analyte staining |
| US20180204048A1 (en) * | 2015-09-02 | 2018-07-19 | Ventana Medical Systems, Inc. | Automated analysis of cellular samples having intermixing of analytically distinct patterns of analyte staining |
| WO2017060397A1 (en) | 2015-10-09 | 2017-04-13 | INSERM (Institut National de la Santé et de la Recherche Médicale) | Methods for predicting the survival time of subjects suffering from melanoma metastases |
| WO2017067944A1 (en) | 2015-10-19 | 2017-04-27 | INSERM (Institut National de la Santé et de la Recherche Médicale) | Methods for predicting the survival time of subjects suffering from triple negative breast cancer |
| EP3365682A4 (en) * | 2015-10-23 | 2019-04-24 | Novartis AG | COMPUTER METHOD AND SYSTEM FOR OBTAINING SPACE PROXIMITIES OF CELL CELL |
| US11249066B2 (en) * | 2015-10-23 | 2022-02-15 | Novartis Ag | Computer method and system for deriving cell-to-cell spatial proximities |
| US11747319B2 (en) * | 2015-10-23 | 2023-09-05 | Novartis Ag | Computer method and system for deriving cell-to-cell spatial proximities |
| WO2017070581A1 (en) * | 2015-10-23 | 2017-04-27 | Novartis Ag | Method of deriving a value for percent biomarker positivity for selected cells present in a field of view |
| US10712331B2 (en) * | 2015-10-23 | 2020-07-14 | Novartis Ag | Computer method and system for deriving cell-to-cell spatial proximities |
| US11480570B2 (en) | 2015-10-23 | 2022-10-25 | Novartis Ag | Method of deriving a value for percent biomarker positivity for selected cells present in a field of view |
| EP3719143A1 (en) * | 2015-10-23 | 2020-10-07 | Novartis AG | Method of deriving a value for percent biomarker positivity for selected cells present in a field of view |
| US20180306768A1 (en) * | 2015-10-23 | 2018-10-25 | Novartis Ag | Computer method and system for deriving cell-to-cell spatial proximities |
| US20220170905A1 (en) * | 2015-10-23 | 2022-06-02 | Novartis Ag | Computer method and system for deriving cell-to-cell spatial proximities |
| WO2017081190A1 (en) | 2015-11-13 | 2017-05-18 | INSERM (Institut National de la Santé et de la Recherche Médicale) | Anti- nkg2d single domain antibodies and uses thereof |
| WO2017118634A1 (en) | 2016-01-04 | 2017-07-13 | INSERM (Institut National de la Santé et de la Recherche Médicale) | Use of pd-1 and tim-3 as a measure for cd8+ cells in predicting and treating renal cell carcinoma |
| WO2017129769A1 (en) | 2016-01-28 | 2017-08-03 | INSERM (Institut National de la Santé et de la Recherche Médicale) | Methods for enhancing the potency of the immune checkpoint inhibitors |
| WO2017202962A1 (en) | 2016-05-24 | 2017-11-30 | INSERM (Institut National de la Santé et de la Recherche Médicale) | Methods and pharmaceutical compositions for the treatment of non small cell lung cancer (nsclc) that coexists with chronic obstructive pulmonary disease (copd) |
| WO2018009202A1 (en) * | 2016-07-07 | 2018-01-11 | Flagship Biosciences Inc. | Continuous tissue analysis scoring scheme based on cell classifications |
| WO2018011107A1 (en) | 2016-07-11 | 2018-01-18 | INSERM (Institut National de la Santé et de la Recherche Médicale) | Use of er-alpha 46 in methods and kits for assessing the status of breast cancer |
| CN106327508A (en) * | 2016-08-23 | 2017-01-11 | 马跃生 | Ki67 index automatic analysis method |
| WO2018046736A1 (en) | 2016-09-12 | 2018-03-15 | INSERM (Institut National de la Santé et de la Recherche Médicale) | Methods for predicting the survival time of patients suffering from cancer |
| US10222690B2 (en) * | 2016-09-30 | 2019-03-05 | Samsung Electronics Co., Ltd. | Method of optimizing a mask using pixel-based learning and method for manufacturing a semiconductor device using an optimized mask |
| US20180095359A1 (en) * | 2016-09-30 | 2018-04-05 | Samsung Electronics Co., Ltd. | Method of optimizing a mask using pixel-based learning and method for manufacturing a semiconductor device using an optimized mask |
| WO2018122249A1 (en) | 2016-12-28 | 2018-07-05 | INSERM (Institut National de la Santé et de la Recherche Médicale) | Methods for predicting the survival time of patients suffering from a microsatellite stable colorectal cancer |
| WO2018122245A1 (en) | 2016-12-28 | 2018-07-05 | INSERM (Institut National de la Santé et de la Recherche Médicale) | Methods of predicting the survival time of patients suffering from cms3 colorectal cancer |
| WO2018146253A1 (en) | 2017-02-10 | 2018-08-16 | INSERM (Institut National de la Santé et de la Recherche Médicale) | Methods and pharmaceutical compositions for the treatment of cancers associated with activation of the mapk pathway |
| US11096988B2 (en) | 2017-03-16 | 2021-08-24 | Alpine Immune Sciences, Inc. | CD80 variant immunomodulatory proteins and uses thereof |
| US11117950B2 (en) | 2017-03-16 | 2021-09-14 | Alpine Immune Sciences, Inc. | CD80 variant immunomodulatory proteins and uses thereof |
| US11117949B2 (en) | 2017-03-16 | 2021-09-14 | Alpine Immune Sciences, Inc. | CD80 variant immunomodulatory proteins and uses thereof |
| US11117948B2 (en) | 2017-03-16 | 2021-09-14 | Alpine Immune Sciences, Inc. | CD80 variant immunomodulatory proteins and uses thereof |
| US11639375B2 (en) | 2017-03-16 | 2023-05-02 | Alpine Immune Sciences, Inc. | CD80 variant immunomodulatory proteins and uses thereof |
| US11230588B2 (en) | 2017-03-16 | 2022-01-25 | Alpine Immune Sciences, Inc. | CD80 variant immunomodulatory proteins and uses thereof |
| WO2018170026A2 (en) | 2017-03-16 | 2018-09-20 | Alpine Immune Sciences, Inc. | Cd80 variant immunomodulatory proteins and uses thereof |
| WO2018202850A1 (en) | 2017-05-05 | 2018-11-08 | INSERM (Institut National de la Santé et de la Recherche Médicale) | Microtubule-targeting drugs as immune checkpoint inhibitors and methods of screening novel immune checkpoint inhibitors for the treatment of cancers and infectious diseases |
| WO2019043138A1 (en) | 2017-09-01 | 2019-03-07 | INSERM (Institut National de la Santé et de la Recherche Médicale) | Method for predicting the outcome of a cancer |
| RU2739974C1 (en) * | 2017-10-10 | 2020-12-30 | Ханчжоу Чживэй Информейшн Текнолоджи Ко., Лтд. | Method for bone marrow cell marking and system for implementation thereof |
| WO2019074489A1 (en) * | 2017-10-10 | 2019-04-18 | Flagship Biosciences, Inc. | Methods for quantitative assessment of muscle fibers in muscular dystrophy |
| US12031975B2 (en) | 2017-11-01 | 2024-07-09 | Juno Therapeutics, Inc. | Methods of assessing or monitoring a response to a cell therapy |
| WO2019089858A2 (en) | 2017-11-01 | 2019-05-09 | Juno Therapeutics, Inc. | Methods of assessing or monitoring a response to a cell therapy |
| WO2019101871A1 (en) | 2017-11-23 | 2019-05-31 | Inserm (Institut National De La Sante Et De La Recherche Medicale) | A new marker for predicting the sensitivity to pi3k inhibitors |
| WO2019162325A1 (en) | 2018-02-21 | 2019-08-29 | INSERM (Institut National de la Santé et de la Recherche Médicale) | Use of sk1 as biomarker for predicting response to immunecheckpoint inhibitors |
| WO2019175113A1 (en) | 2018-03-12 | 2019-09-19 | INSERM (Institut National de la Santé et de la Recherche Médicale) | Use of caloric restriction mimetics for potentiating chemo-immunotherapy for the treatment of cancers |
| WO2019197683A1 (en) | 2018-04-13 | 2019-10-17 | INSERM (Institut National de la Santé et de la Recherche Médicale) | Methods for predicting outcome and treatment of patients suffering from prostate cancer or breast cancer |
| WO2019207030A1 (en) | 2018-04-26 | 2019-10-31 | INSERM (Institut National de la Santé et de la Recherche Médicale) | Methods for predicting a response with an immune checkpoint inhibitor in a patient suffering from a lung cancer |
| US12065476B2 (en) | 2018-06-15 | 2024-08-20 | Alpine Immune Sciences, Inc. | PD-1 variant immunomodulatory proteins and uses thereof |
| WO2019241758A1 (en) | 2018-06-15 | 2019-12-19 | Alpine Immune Sciences, Inc. | Pd-1 variant immunomodulatory proteins and uses thereof |
| WO2020048942A1 (en) | 2018-09-04 | 2020-03-12 | INSERM (Institut National de la Santé et de la Recherche Médicale) | Methods and pharmaceutical compositions for enhancing cytotoxic t lymphocyte-dependent immune responses |
| WO2020061376A2 (en) | 2018-09-19 | 2020-03-26 | Alpine Immune Sciences, Inc. | Methods and uses of variant cd80 fusion proteins and related constructs |
| WO2020058372A1 (en) | 2018-09-19 | 2020-03-26 | INSERM (Institut National de la Santé et de la Recherche Médicale) | Methods and pharmaceutical composition for the treatment of cancers resistant to immune checkpoint therapy |
| WO2020070053A1 (en) | 2018-10-01 | 2020-04-09 | INSERM (Institut National de la Santé et de la Recherche Médicale) | Use of inhibitors of stress granule formation for targeting the regulation of immune responses |
| WO2020120592A1 (en) | 2018-12-12 | 2020-06-18 | INSERM (Institut National de la Santé et de la Recherche Médicale) | Methods and compositions for predicting and treating melanoma |
| WO2020127059A1 (en) | 2018-12-17 | 2020-06-25 | INSERM (Institut National de la Santé et de la Recherche Médicale) | Use of sulconazole as a furin inhibitor |
| WO2020141199A1 (en) | 2019-01-03 | 2020-07-09 | INSERM (Institut National de la Santé et de la Recherche Médicale) | Methods and pharmaceutical compositions for enhancing cd8+ t cell-dependent immune responses in subjects suffering from cancer |
| EP4059569A1 (en) | 2019-01-03 | 2022-09-21 | Institut National De La Sante Et De La Recherche Medicale (Inserm) | Methods and pharmaceutical compositions for enhancing cd8+ t cell-dependent immune responses in subjects suffering from cancer |
| WO2020205623A1 (en) | 2019-03-29 | 2020-10-08 | Rakuten Medical, Inc. | Methods for photoimmunotherapy and related biomarkers |
| WO2020201362A2 (en) | 2019-04-02 | 2020-10-08 | INSERM (Institut National de la Santé et de la Recherche Médicale) | Methods of predicting and preventing cancer in patients having premalignant lesions |
| WO2020208060A1 (en) | 2019-04-09 | 2020-10-15 | INSERM (Institut National de la Santé et de la Recherche Médicale) | Use of sk2 inhibitors in combination with immune checkpoint blockade therapy for the treatment of cancer |
| WO2020245155A1 (en) | 2019-06-03 | 2020-12-10 | INSERM (Institut National de la Santé et de la Recherche Médicale) | Methods for modulating a treatment regimen |
| WO2020245208A1 (en) | 2019-06-04 | 2020-12-10 | INSERM (Institut National de la Santé et de la Recherche Médicale) | Use of cd9 as a biomarker and as a biotarget in glomerulonephritis or glomerulosclerosis |
| CN114270174A (en) * | 2019-08-28 | 2022-04-01 | 文塔纳医疗系统公司 | Label-free assessment of biomarker expression using vibrational spectroscopy |
| WO2021074391A1 (en) | 2019-10-17 | 2021-04-22 | INSERM (Institut National de la Santé et de la Recherche Médicale) | Methods for diagnosing nasal intestinal type adenocarcinomas |
| WO2021144426A1 (en) | 2020-01-17 | 2021-07-22 | INSERM (Institut National de la Santé et de la Recherche Médicale) | Methods and compositions for treating melanoma |
| WO2021170777A1 (en) | 2020-02-28 | 2021-09-02 | INSERM (Institut National de la Santé et de la Recherche Médicale) | Methods for diagnosing, prognosing and managing treatment of breast cancer |
| WO2022002874A1 (en) | 2020-06-30 | 2022-01-06 | INSERM (Institut National de la Santé et de la Recherche Médicale) | Methods for predicting the risk of recurrence and/or death of patients suffering from a solid cancer after preoperative adjuvant therapy and radical surgery |
| WO2022002873A1 (en) | 2020-06-30 | 2022-01-06 | INSERM (Institut National de la Santé et de la Recherche Médicale) | Methods for predicting the risk of recurrence and/or death of patients suffering from a solid cancer after preoperative adjuvant therapies |
| US20220189026A1 (en) * | 2020-11-06 | 2022-06-16 | Commissariat A L'energie Atomique Et Aux Energies Alternatives | Method for detecting a cell event |
| US12322107B2 (en) * | 2020-11-06 | 2025-06-03 | Commissariat A L'energie Atomique Et Aux Energies Alternatives | Method for detecting a cell event |
| WO2022171777A1 (en) | 2021-02-12 | 2022-08-18 | INSERM (Institut National de la Santé et de la Recherche Médicale) | Method for prognosis and treating a patient suffering from cancer |
| WO2022200303A1 (en) | 2021-03-23 | 2022-09-29 | INSERM (Institut National de la Santé et de la Recherche Médicale) | Methods for the diagnosis and treatment of t cell-lymphomas |
| WO2022229136A1 (en) | 2021-04-27 | 2022-11-03 | INSERM (Institut National de la Santé et de la Recherche Médicale) | Methods for predicting the risk of lymph node metastasis and/or recurrence of patients suffering from a t1 cancer treated by endoscopic resection |
| WO2023144235A1 (en) | 2022-01-27 | 2023-08-03 | INSERM (Institut National de la Santé et de la Recherche Médicale) | Methods for monitoring and treating warburg effect in patients with pi3k-related disorders |
| WO2023144303A1 (en) | 2022-01-31 | 2023-08-03 | INSERM (Institut National de la Santé et de la Recherche Médicale) | Cd38 as a biomarker and biotarget in t-cell lymphomas |
| WO2023172883A1 (en) | 2022-03-07 | 2023-09-14 | Alpine Immune Sciences, Inc. | Immunomodulatory proteins of variant cd80 polypeptides, cell therapies thereof and related methods and uses |
| WO2023175366A1 (en) | 2022-03-17 | 2023-09-21 | Veracyte | Methods for predicting response to an immunotherapeutic treatment in a patient with a cancer |
| WO2023198648A1 (en) | 2022-04-11 | 2023-10-19 | Institut National de la Santé et de la Recherche Médicale | Methods for the diagnosis and treatment of t-cell malignancies |
| WO2023198874A1 (en) | 2022-04-15 | 2023-10-19 | Institut National de la Santé et de la Recherche Médicale | Methods for the diagnosis and treatment of t cell-lymphomas |
| WO2024003310A1 (en) | 2022-06-30 | 2024-01-04 | Institut National de la Santé et de la Recherche Médicale | Methods for the diagnosis and treatment of acute lymphoblastic leukemia |
| WO2024018046A1 (en) | 2022-07-22 | 2024-01-25 | Institut National de la Santé et de la Recherche Médicale | Garp as a biomarker and biotarget in t-cell malignancies |
| WO2024023283A1 (en) | 2022-07-29 | 2024-02-01 | Institut National de la Santé et de la Recherche Médicale | Lrrc33 as a biomarker and biotarget in cutaneous t-cell lymphomas |
| WO2024079192A1 (en) | 2022-10-12 | 2024-04-18 | Institut National de la Santé et de la Recherche Médicale | Cd81 as a biomarker and biotarget in t-cell malignancies |
| WO2024153636A1 (en) | 2023-01-17 | 2024-07-25 | Institut National de la Santé et de la Recherche Médicale | Vasorin as a biomarker and biotarget in nephrology |
| WO2025045894A1 (en) | 2023-08-28 | 2025-03-06 | Institut National de la Santé et de la Recherche Médicale | Methods and kits for diagnosing cause of nephrotic syndrome and guiding therapy |
Also Published As
| Publication number | Publication date |
|---|---|
| CA2737116A1 (en) | 2010-03-25 |
| WO2010033508A1 (en) | 2010-03-25 |
| EP2335221B8 (en) | 2016-05-25 |
| AU2009293380B2 (en) | 2016-05-19 |
| CN102165489B (en) | 2015-11-25 |
| JP5551702B2 (en) | 2014-07-16 |
| CA2737116C (en) | 2019-01-15 |
| EP2335221B1 (en) | 2016-03-23 |
| ES2573945T3 (en) | 2016-06-13 |
| EP2335221A1 (en) | 2011-06-22 |
| AU2009293380A1 (en) | 2010-03-25 |
| US9240043B2 (en) | 2016-01-19 |
| JP2012503180A (en) | 2012-02-02 |
| CN102165489A (en) | 2011-08-24 |
Similar Documents
| Publication | Publication Date | Title |
|---|---|---|
| US9240043B2 (en) | Reproducible quantification of biomarker expression | |
| US8335360B2 (en) | Compartment segregation by pixel characterization using image data clustering | |
| US11315250B2 (en) | Systems and methods for automated analysis of cells and tissues | |
| US9858469B2 (en) | Modular image analysis system and method | |
| AU2002311827A1 (en) | Systems and methods for automated analysis of cells and tissues |
Legal Events
| Date | Code | Title | Description |
|---|---|---|---|
| AS | Assignment |
Owner name: HISTORX, INC.,CONNECTICUT Free format text: ASSIGNMENT OF ASSIGNORS INTEREST;ASSIGNORS:CHRISTIANSEN, JASON;PINARD, ROBERT;GUSTAVSON, MARK;AND OTHERS;SIGNING DATES FROM 20100106 TO 20100122;REEL/FRAME:023896/0394 Owner name: HISTORX, INC., CONNECTICUT Free format text: ASSIGNMENT OF ASSIGNORS INTEREST;ASSIGNORS:CHRISTIANSEN, JASON;PINARD, ROBERT;GUSTAVSON, MARK;AND OTHERS;SIGNING DATES FROM 20100106 TO 20100122;REEL/FRAME:023896/0394 |
|
| AS | Assignment |
Owner name: CONNECTICUT INNOVATIONS, INCORPORATED,CONNECTICUT Free format text: SECURITY AGREEMENT;ASSIGNOR:HISTORX, INC.;REEL/FRAME:024073/0179 Effective date: 20100311 Owner name: CONNECTICUT INNOVATIONS, INCORPORATED, CONNECTICUT Free format text: SECURITY AGREEMENT;ASSIGNOR:HISTORX, INC.;REEL/FRAME:024073/0179 Effective date: 20100311 |
|
| AS | Assignment |
Owner name: NOVARTIS AG, SWITZERLAND Free format text: ASSIGNMENT OF ASSIGNORS INTEREST;ASSIGNOR:HISTORX, INC.;REEL/FRAME:034737/0880 Effective date: 20141218 |
|
| STCF | Information on status: patent grant |
Free format text: PATENTED CASE |
|
| MAFP | Maintenance fee payment |
Free format text: PAYMENT OF MAINTENANCE FEE, 4TH YEAR, LARGE ENTITY (ORIGINAL EVENT CODE: M1551); ENTITY STATUS OF PATENT OWNER: LARGE ENTITY Year of fee payment: 4 |
|
| MAFP | Maintenance fee payment |
Free format text: PAYMENT OF MAINTENANCE FEE, 8TH YEAR, LARGE ENTITY (ORIGINAL EVENT CODE: M1552); ENTITY STATUS OF PATENT OWNER: LARGE ENTITY Year of fee payment: 8 |