US12181556B2 - MRI apparatus - Google Patents
MRI apparatus Download PDFInfo
- Publication number
- US12181556B2 US12181556B2 US17/804,220 US202217804220A US12181556B2 US 12181556 B2 US12181556 B2 US 12181556B2 US 202217804220 A US202217804220 A US 202217804220A US 12181556 B2 US12181556 B2 US 12181556B2
- Authority
- US
- United States
- Prior art keywords
- pulse
- images
- gradient
- mri apparatus
- pulse sequence
- Prior art date
- Legal status (The legal status is an assumption and is not a legal conclusion. Google has not performed a legal analysis and makes no representation as to the accuracy of the status listed.)
- Active, expires
Links
Images


Classifications
-
- G—PHYSICS
- G01—MEASURING; TESTING
- G01R—MEASURING ELECTRIC VARIABLES; MEASURING MAGNETIC VARIABLES
- G01R33/00—Arrangements or instruments for measuring magnetic variables
- G01R33/20—Arrangements or instruments for measuring magnetic variables involving magnetic resonance
- G01R33/44—Arrangements or instruments for measuring magnetic variables involving magnetic resonance using nuclear magnetic resonance [NMR]
- G01R33/48—NMR imaging systems
- G01R33/50—NMR imaging systems based on the determination of relaxation times, e.g. T1 measurement by IR sequences; T2 measurement by multiple-echo sequences
-
- G—PHYSICS
- G01—MEASURING; TESTING
- G01R—MEASURING ELECTRIC VARIABLES; MEASURING MAGNETIC VARIABLES
- G01R33/00—Arrangements or instruments for measuring magnetic variables
- G01R33/20—Arrangements or instruments for measuring magnetic variables involving magnetic resonance
- G01R33/44—Arrangements or instruments for measuring magnetic variables involving magnetic resonance using nuclear magnetic resonance [NMR]
- G01R33/48—NMR imaging systems
- G01R33/54—Signal processing systems, e.g. using pulse sequences ; Generation or control of pulse sequences; Operator console
- G01R33/543—Control of the operation of the MR system, e.g. setting of acquisition parameters prior to or during MR data acquisition, dynamic shimming, use of one or more scout images for scan plane prescription
-
- G—PHYSICS
- G01—MEASURING; TESTING
- G01R—MEASURING ELECTRIC VARIABLES; MEASURING MAGNETIC VARIABLES
- G01R33/00—Arrangements or instruments for measuring magnetic variables
- G01R33/20—Arrangements or instruments for measuring magnetic variables involving magnetic resonance
- G01R33/44—Arrangements or instruments for measuring magnetic variables involving magnetic resonance using nuclear magnetic resonance [NMR]
- G01R33/48—NMR imaging systems
- G01R33/54—Signal processing systems, e.g. using pulse sequences ; Generation or control of pulse sequences; Operator console
- G01R33/56—Image enhancement or correction, e.g. subtraction or averaging techniques, e.g. improvement of signal-to-noise ratio and resolution
- G01R33/561—Image enhancement or correction, e.g. subtraction or averaging techniques, e.g. improvement of signal-to-noise ratio and resolution by reduction of the scanning time, i.e. fast acquiring systems, e.g. using echo-planar pulse sequences
- G01R33/5615—Echo train techniques involving acquiring plural, differently encoded, echo signals after one RF excitation, e.g. using gradient refocusing in echo planar imaging [EPI], RF refocusing in rapid acquisition with relaxation enhancement [RARE] or using both RF and gradient refocusing in gradient and spin echo imaging [GRASE]
- G01R33/5617—Echo train techniques involving acquiring plural, differently encoded, echo signals after one RF excitation, e.g. using gradient refocusing in echo planar imaging [EPI], RF refocusing in rapid acquisition with relaxation enhancement [RARE] or using both RF and gradient refocusing in gradient and spin echo imaging [GRASE] using RF refocusing, e.g. RARE
-
- G—PHYSICS
- G01—MEASURING; TESTING
- G01R—MEASURING ELECTRIC VARIABLES; MEASURING MAGNETIC VARIABLES
- G01R33/00—Arrangements or instruments for measuring magnetic variables
- G01R33/20—Arrangements or instruments for measuring magnetic variables involving magnetic resonance
- G01R33/44—Arrangements or instruments for measuring magnetic variables involving magnetic resonance using nuclear magnetic resonance [NMR]
- G01R33/48—NMR imaging systems
- G01R33/54—Signal processing systems, e.g. using pulse sequences ; Generation or control of pulse sequences; Operator console
- G01R33/56—Image enhancement or correction, e.g. subtraction or averaging techniques, e.g. improvement of signal-to-noise ratio and resolution
- G01R33/563—Image enhancement or correction, e.g. subtraction or averaging techniques, e.g. improvement of signal-to-noise ratio and resolution of moving material, e.g. flow contrast angiography
- G01R33/56341—Diffusion imaging
-
- G—PHYSICS
- G01—MEASURING; TESTING
- G01R—MEASURING ELECTRIC VARIABLES; MEASURING MAGNETIC VARIABLES
- G01R33/00—Arrangements or instruments for measuring magnetic variables
- G01R33/20—Arrangements or instruments for measuring magnetic variables involving magnetic resonance
- G01R33/44—Arrangements or instruments for measuring magnetic variables involving magnetic resonance using nuclear magnetic resonance [NMR]
- G01R33/48—NMR imaging systems
- G01R33/54—Signal processing systems, e.g. using pulse sequences ; Generation or control of pulse sequences; Operator console
- G01R33/56—Image enhancement or correction, e.g. subtraction or averaging techniques, e.g. improvement of signal-to-noise ratio and resolution
- G01R33/565—Correction of image distortions, e.g. due to magnetic field inhomogeneities
- G01R33/56509—Correction of image distortions, e.g. due to magnetic field inhomogeneities due to motion, displacement or flow, e.g. gradient moment nulling
-
- A—HUMAN NECESSITIES
- A61—MEDICAL OR VETERINARY SCIENCE; HYGIENE
- A61B—DIAGNOSIS; SURGERY; IDENTIFICATION
- A61B5/00—Measuring for diagnostic purposes; Identification of persons
- A61B5/0033—Features or image-related aspects of imaging apparatus, e.g. for MRI, optical tomography or impedance tomography apparatus; Arrangements of imaging apparatus in a room
- A61B5/004—Features or image-related aspects of imaging apparatus, e.g. for MRI, optical tomography or impedance tomography apparatus; Arrangements of imaging apparatus in a room adapted for image acquisition of a particular organ or body part
-
- A—HUMAN NECESSITIES
- A61—MEDICAL OR VETERINARY SCIENCE; HYGIENE
- A61B—DIAGNOSIS; SURGERY; IDENTIFICATION
- A61B5/00—Measuring for diagnostic purposes; Identification of persons
- A61B5/05—Detecting, measuring or recording for diagnosis by means of electric currents or magnetic fields; Measuring using microwaves or radio waves
- A61B5/055—Detecting, measuring or recording for diagnosis by means of electric currents or magnetic fields; Measuring using microwaves or radio waves involving electronic [EMR] or nuclear [NMR] magnetic resonance, e.g. magnetic resonance imaging
-
- G—PHYSICS
- G01—MEASURING; TESTING
- G01R—MEASURING ELECTRIC VARIABLES; MEASURING MAGNETIC VARIABLES
- G01R33/00—Arrangements or instruments for measuring magnetic variables
- G01R33/20—Arrangements or instruments for measuring magnetic variables involving magnetic resonance
- G01R33/44—Arrangements or instruments for measuring magnetic variables involving magnetic resonance using nuclear magnetic resonance [NMR]
- G01R33/448—Relaxometry, i.e. quantification of relaxation times or spin density
Definitions
- Disclosed Embodiments relate to a magnetic resonance imaging (MRI) apparatus.
- MRI magnetic resonance imaging
- An MRI apparatus is an imaging apparatus which excites nuclear spin of an object placed in a static magnetic field with a radio frequency (RF) pulse having the Larmor frequency, and reconstructs an image based on the magnetic resonance (MR) signals emitted from the object due to the excitation.
- RF radio frequency
- the MRI apparatus can image cerebrospinal fluid (CSF) and cerebral interstitial fluid, for example.
- CSF cerebrospinal fluid
- cerebral interstitial fluid are called neurofluid and are considered to be important in elucidating the clearance function of removing waste products from the brain. Images of neurofluid are exemplified by a T2-weighted image and a diffusion-weighted image.
- a pulse sequence called a CPMG (Carr-Purcell-Meiboom-Gill) sequence or a FSE (Fast Spin Echo) sequence is often used.
- CPMG Carr-Purcell-Meiboom-Gill
- FSE Fast Spin Echo
- Regions of interest for imaging neurofluid are, for example, perivascular space in the brain (i.e., gap around blood vessels in the brain), narrow cerebral sulcus (i.e., wrinkled grooves in the brain), and a brain surface.
- imaging methods for such narrow regions require high spatial resolution.
- the T2 value of neurofluid which is not influenced by diffusion and/or turbulent flow, is important, while an index related to diffusion and/or turbulent flow of neurofluid is also important.
- the accuracy of the T2 value in T2 mapping is reduced due to the influence of diffusion and/or turbulent flow of neurofluid.
- it is required to perform an imaging sequence other than an imaging sequence for acquiring the T2 value, and the overall imaging time becomes longer (for example, JP 2017-225501 A).
- FIG. 1 is a configuration diagram illustrating an overall configuration of an MRI apparatus according to the present embodiment
- FIG. 2 is a functional block diagram focusing on the functions to be implemented by the processing circuitry of the present embodiment
- FIG. 3 A to FIG. 3 D are sequence diagrams illustrating conventional problems in CSF imaging
- FIG. 4 A to FIG. 4 F are overall sequence diagrams of the first and second pulse sequences of the present embodiment.
- FIG. 5 is a schematic diagram illustrating a processing concept for obtaining a true T2 value that is not influenced by diffusion and/or turbulent flow;
- FIG. 6 is a flowchart illustrating processing to be executed by the MRI apparatus of the present embodiment
- FIG. 7 A and FIG. 7 B are respectively sequence diagrams of the RF pulse and the phase encoding gradient pulse GP that are common to the first and second pulse sequences;
- FIG. 7 C is a sequence diagram of the readout gradient pulse of the first pulse sequence
- FIG. 7 D is a sequence diagram of the readout gradient pulse of the second pulse sequence
- FIG. 8 A and FIG. 8 B are sequence diagrams of the first and second pulse sequences when viewed over a longer time span than those in FIG. 7 A to FIG. 7 D ;
- FIG. 9 A to FIG. 9 C are schematic diagrams illustrating a concept of filling a k-space with k-space data acquired in a plurality of segments;
- FIG. 10 A and FIG. 10 B are schematic diagrams illustrating the concept of generating a first image for each echo time by reconstructing a first k-space dataset for each echo time;
- FIG. 100 and FIG. 10 D are schematic diagrams illustrating a concept of generating a second image for each echo time by reconstructing a second k-space dataset for each echo time;
- FIG. 11 A to FIG. 11 D are schematic diagrams illustrating a processing concept of calculating an ADC map from respective pixel values of the first and second images and the first and second b-values;
- FIG. 12 A to FIG. 12 C are schematic diagrams illustrating a processing concept of correcting the first image generated for each echo time and removing the influence of diffusion and/or turbulent flow by using the ADC map;
- FIG. 13 A to FIG. 13 C are schematic diagrams illustrating a processing concept of generating a T2 map by calculating a true T2 value, from which influence of diffusion and/or turbulent flow is removed, for each pixel position from change in pixel value of the first image after correction with respect to the echo time TE;
- FIG. 14 A and FIG. 14 B are schematic diagrams illustrating a processing concept of calculating a T2 spectrum from change in pixel value of the first image after correction with respect to the echo time TE;
- FIG. 15 A to FIG. 15 C are sequence diagrams of the first and second pulse sequences according to the first modification of the present embodiment.
- FIG. 16 A to FIG. 16 C are schematic diagrams illustrating a processing concept of the second modification of the present embodiment.
- an MRI apparatus includes: a scanner that includes a static magnetic field magnet, a gradient coil, a whole body coil, and an RF transmitter; and processing circuitry configured to: set a first pulse sequence and a second pulse sequence, each of which is a fast spin echo (FSE) pulse sequence in which a plurality of refocusing pulses are applied subsequent to an application of an excitation pulse, wherein, in the first pulse sequence, a first gradient pulse is applied between two adjacent refocusing pulses, and, in the second pulse sequence, a second gradient pulse being different in pulse shape from the first gradient pulse is applied between two adjacent refocusing pulses, wherein: the scanner is configured to apply the first pulse sequence and the second pulse sequence to an object and acquire first signals in the first pulse sequence and second signals in the second pulse sequence; and the processing circuitry is configured to generate at least one first image from the first signals and at least one second image from the second signals; and calculate a T2 value of a body fluid of the object from the at least one first image and the at least
- FSE fast spin echo
- FIG. 1 is a block diagram illustrating the overall configuration of the MRI apparatus 1 of the present embodiment.
- the MRI apparatus 1 of the present embodiment includes components such as a gantry 100 , a control cabinet 300 , a console 400 , and a bed 500 .
- the gantry 100 includes, for example, a static magnetic field magnet 10 , a gradient coil 11 , a WB (whole body) coil 12 , and these components are included in a cylindrical housing.
- the bed 500 includes a bed body 50 and a table 51 .
- the MRI apparatus 1 further includes an array coil 20 that is provided near an object.
- the control cabinet 300 includes three gradient coil power supplies 31 (to be exact, 31 x for the X-axis, 31 y for the Y-axis, and 31 z for the Z-axis), an RF receiver 32 , an RF transmitter 33 , and a sequence controller 34 .
- the static magnetic field magnet 10 of the gantry 100 is substantially in the form of a cylinder, and generates a static magnetic field inside the bore (i.e., the space inside the cylindrical structure of the static magnetic field magnet 10 ), which is an imaging region of an object (for example, a patient).
- the static magnetic field magnet 10 includes a superconducting coil inside, and the superconducting coil is cooled down to an extremely low temperature by liquid helium.
- the static magnetic field magnet 10 generates a static magnetic field by supplying the superconducting coil with electric current provided from a static magnetic field power supply (not shown) in an excitation mode. Afterward, the static magnetic field magnet 10 shifts to a permanent current mode, and the static magnetic field power supply is separated. Once it enters the permanent current mode, the static magnetic field magnet 10 continues to generate a strong static magnetic field for a long time, for example, over one year.
- the static magnetic field magnet 10 may be configured as a permanent magnet.
- the gradient coil 11 is also substantially in the form of a cylinder, and is fixed to the inside of the static magnetic field magnet 10 .
- This gradient coil 11 applies gradient magnetic fields to an object in the respective directions of the X-axis, the Y-axis, and the Z-axis of the apparatus shown in FIG. 1 , by using electric currents supplied from the gradient coil power supplies 31 x , 31 y , and 31 z.
- the bed body 50 of the bed 500 can move the table 51 in the upward and downward directions, and moves the table 51 with the object loaded thereon to a predetermined height before imaging. Afterward, at the time of imaging, the bed body 50 moves the table 51 in the horizontal direction so as to move the object to the inside of the bore.
- the WB body coil 12 is shaped substantially in the form of a cylinder so as to surround an object, and is fixed to the inside of the gradient coil 11 .
- the WB coil 12 applies RF pulses transmitted from the RF transmitter 33 to the object, and receives MR signals emitted from the object due to excitation of hydrogen nuclei.
- the array coil 20 is an RF coil, and receives the MR signals emitted from the object at positions close to the object.
- the array coil 20 is, for example, configured of a plurality of coil elements. Although there are various types of array coil 20 such as a head coil, a chest coil, a spine coil, a lower-limb coil, and a whole-body coil for imaging different parts of the object, a chest coil is illustrated as the array coil 20 in FIG. 1 .
- the RF transmitter 33 transmits RF pulses to the WB coil 12 on the basis of commands inputted from the sequence controller 34 .
- the RF receiver 32 receives MR signals received by the WB coil 12 and/or the array coil 20 , and transmits raw data obtained by digitizing the received MR signals to the sequence controller 34 .
- the sequence controller 34 performs a scan of the object by driving the gradient coil power supplies 31 , the RF transmitter 33 , and the RF receiver 32 under the control of the console 400 . By performing such scan, the sequence controller 34 receives the raw data from the RF receiver 32 and transmits the received raw data to the console 400 .
- the sequence controller 34 includes processing circuitry (not shown), which is configured as hardware such as a processor for executing predetermined programs, a field programmable gate array (FPGA), and an application specific integrated circuit (ASIC).
- processing circuitry not shown
- FPGA field programmable gate array
- ASIC application specific integrated circuit
- the console 400 is configured as a computer including processing circuitry 40 , a memory 41 , a display 42 , and an input interface 43 .
- the memory 41 is a recording medium including a read-only memory (ROM) and a random access memory (RAM) in addition to an external memory device such as a hard disk drive (HDD) and an optical disc device.
- the memory 41 stores various data and information as well as various programs to be executed by a processor of the processing circuitry 40 .
- the input interface 43 includes various devices for an operator to input various data and information, and is configured of, for example, a mouse, a keyboard, a trackball, and/or a touch panel.
- the display 42 is a display device such as a liquid crystal display panel, a plasma display panel, and an organic EL panel.
- the processing circuitry 40 is, for example, a circuit provided with a CPU and/or a special-purpose or general-purpose processor.
- the processor implements various functions described below by executing programs stored in the memory 41 .
- the processing circuitry 40 may be configured of hardware such as an FPGA and an ASIC. The various functions described below can also be implemented by such hardware. Additionally, the processing circuitry 40 can implement the various functions by combining hardware processing and software processing based on its processor and programs.
- the console 400 performs entire system control of the MRI apparatus 1 with these components. Specifically, the console 400 receives various commands and information such as imaging conditions, which are inputted by an operator (e.g., a medical imaging technologist) through the mouse and/or the keyboard of the input interface 43 .
- the processing circuitry 40 causes the sequence controller 34 to perform a scan based on the inputted imaging conditions, and reconstructs images using the raw data transmitted from the sequence controller 34 . The reconstructed images are displayed on the display 42 and stored in the memory 41 .
- FIG. 2 is a block diagram of the MRI apparatus 1 of the present embodiment, and a functional block diagram particularly focusing on the functions achieved by the processing circuitry 40 .
- the components excluding the console 400 i.e., the entirety of the gantry 100 , the control cabinet 300 , and the bed 500 ) constitute a scanner 600 , as illustrated in FIG. 2 .
- the processing circuitry 40 of the MRI apparatus 1 implements each of an imaging-condition setting function F 01 , an image generation function F 02 , an ADC map generation function F 03 , a diffusion/motion correction function F 04 , a T2 map generation function F 05 , and a T2 spectrum generation function F 06 .
- the ADC map generation function F 03 , the diffusion/motion correction function F 04 , the T2 map generation function F 05 , and the T2 spectrum generation function F 06 are collectively referred to as an analysis function F 07 .
- the imaging-condition setting function F 01 determines parameters of the pulse sequence based on the imaging conditions selected or set via, for example, the input interface 43 , and sets the pulse sequence having the determined parameters on the sequence controller 34 of the scanner 600 .
- the MRI apparatus 1 of the present embodiment can set a first and second pulse sequences of FSE (Fast Spin Echo).
- FSE Flust Spin Echo
- an excitation pulse is applied, and a plurality of refocusing pulses are applied subsequent to this excitation pulse such that a first gradient pulse is also applied between any two adjacent refocusing pulses (i.e., between one refocusing pulse and the next refocusing pulse or between two refocusing pulses closest to each other).
- a second gradient pulse having different pulse shape from the first gradient pulse is applied between any two adjacent refocusing pulses.
- the scanner 600 applies the first and second pulse sequences to the object to acquire the first and second MR signals, and sends the first second MR signals to the processing circuitry 40 of the console 400 via the sequence controller 34 .
- the image generation function F 02 of the processing circuitry 40 generates a first image from the first MR signals and generates a second image from the second MR signals.
- the image generation function F 02 reconstructs the first MR signals and the second MR signals by processing such as Fourier transform to generate the first and second images.
- the analysis function F 07 uses the first image and the second image to calculate the T2 value of the body fluid.
- the T2 value herewith refers to a value from which the influence of the movement including the diffusion of the body fluid of the object is removed.
- the body fluid of the object is, for example, neurofluid such as CSF (cerebrospinal fluid) or cerebral interstitial fluid.
- the body fluid of the object may include blood, lymph, or other fluid inside the object.
- the ADC map generation function F 03 Prior to detailed description of the ADC map generation function F 03 , the diffusion/motion correction function F 04 , the T2 map generation function F 05 , and the T2 spectrum generation function F 06 , a description will be given of the conventional problems in imaging neurofluid such as CSF, and the means for solving the conventional problems according to the present embodiment, by referring to FIG. 3 A to FIG. 5 .
- the target of the imaging is assumed to be CSF in the following for the sake of simplifying the description, neurofluid such as cerebral interstitial fluid and other body fluid are not excluded from the target of the imaging.
- FIG. 3 A to FIG. 3 D are sequence diagrams showing the conventional problems in CSF imaging. Since body fluids such as CSF have a longer transverse relaxation time T2 than the parenchyma of the brain, T2-weighted images are often used as images of CSF. In particular, in order to obtain a well depicted image of the CSF, it is necessary to sufficiently separate the parenchyma of the brain, thereby a pulse sequence called a Carr-Purcell-Meiboom-Gill (CPMG) sequence or a Fast Spin Echo (FSE) sequence has been often used conventionally.
- CPMG Carr-Purcell-Meiboom-Gill
- FSE Fast Spin Echo
- the CPMG sequence is an FSE pulse sequence that satisfies the so-called CPMG conditions.
- the CPMG sequence needs to satisfy both of the following two conditions (1) and (2).
- CPMG condition (1) The interval between any two adjacent refocusing pulses (i.e., ESP: echo spacing) is twice the interval between the excitation pulse and the first refocusing pulse, and the phase of the refocusing pulse is shifted by 90° from the phase of the excitation pulse.
- ESP echo spacing
- CPMG condition (2) Among all two adjacent refocusing pulses, the integral value of all the gradient magnetic fields between the two adjacent refocusing pulses are the same.
- the spin echo SE and the stimulated echo STE are added in the same phase at the same position in the time axis, and thus, the signal to noise ratio (SNR) is improved.
- SNR signal to noise ratio
- FIG. 3 A to FIG. 3 C illustrate CPMG sequences that are conventionally used.
- FIG. 3 A shows an RF pulse train
- FIG. 3 B shows a phase encoding gradient pulse train
- FIG. 3 C shows a readout gradient pulse train.
- a slice selection gradient pulse is also applied at a timing corresponding to the application timing of each RF pulse, it is omitted in FIG. 3 A to FIG. 3 D .
- the application directions of the readout gradient pulse, the phase encoding gradient pulse, and the slice selection gradient pulse are respectively the X-axis direction, the Y-axis direction, and the Z-axis direction in FIG. 1 , for example. However, it is not limited to the above-described case but may be desired application directions depending on the inclination of the selected FOV (Field Of View).
- the RF pulse train is composed of an excitation pulse (for example, an RF pulse with a flip angle of 90°) and a plurality of refocusing pulses following the excitation pulse (for example, RF pulses with a flip angle of 180°).
- the excitation pulse and the plurality of refocusing pulses satisfy the above-described CPMG condition (1).
- phase encoding gradient pulse GP shown in FIG. 3 B in each interval between two adjacent refocusing pulses, a pair of a phase encoding pulse for determining the phase encode amount and a rewinder pulse are applied.
- the rewinder pulse has the same amplitude as the phase encoding pulse and has the polarity opposite to that of the phase encoding pulse. With this pair, the CPMG condition (2) described above can be satisfied while setting a different phase encoding amount for each refocusing pulse.
- the gradient pulse between the excitation pulse and the first refocusing pulse is a gradient pulse, so-called pre-phasing pulse, for previously rotating the phase of the transverse magnetization in the negative direction such that the phase of the transverse magnetization becomes zero in the middle of the readout gradient pulse between the first and second refocusing pulses.
- the strength of the pre-phasing pulse is set to be the same as the readout gradient pulse, and the pulse length of the pre-phasing pulse is set to be half of the readout gradient pulse.
- amplitude and pulse length of the readout gradient pulse it is necessary to increase at least one of amplitude (i.e., strength) and pulse length of the readout gradient pulse, and correspondingly, the amplitude and/or pulse length of the pre-phasing pulse also increase.
- the pair of the pre-phasing pulse and the half of the first readout gradient pulse shown as hatched regions in FIG. 3 C work in the same way as the MPG (Motion Probing Gradient) pulse in diffusion-weighted imaging, and show the same effect as the MPG pulse.
- MPG Motion Probing Gradient
- such effect is referred to as the MPG effect of the readout gradient pulse. That is, an effect that the signal strength is decayed due to dephasing because of diffusion and/or turbulent flow of CSF caused by application of a readout gradient pulse having large amplitude and/or long pulse length.
- FIG. 3 D shows each MR signal emitted from the object when the readout gradient pulse is applied.
- the MR signal peaks at the center of each readout gradient pulse between two adjacent refocusing pulses.
- Each peak value of the MR signals is decayed by T2 relaxation along with elapse of time from application of the excitation pulse, as shown by the dotted curve line in FIG. 3 D .
- the transverse relaxation time T2 is calculated from the shape of this decay curve.
- a gradient pulse for suppressing FID signals i.e., so-called spoiler or crusher gradient pulse
- the MPG effect by the readout gradient pulse is similarly caused as what is shown in FIG. 3 D , and the correction method described below can be applied in the same manner.
- the second pulse sequence is used in addition to the conventional pulse sequence (first pulse sequence) shown in FIG. 3 A to FIG. 3 D .
- FIG. 4 A to FIG. 4 F illustrate the first and second pulse sequences used in the present embodiment.
- FIG. 4 A to FIG. 4 D are the same as the conventional pulse sequence shown in FIG. 3 A to FIG. 3 D .
- the pair composed of the pre-phasing pulse and the first half of the readout gradient pulse shown by hatching in FIG. 4 C constitute the MPG 1 pulse that produces the above-described MPG effect.
- the second pulse sequence is the same as the first pulse sequence in terms of RF pulse ( FIG. 4 A ), slice selection gradient pulse (not shown), and phase encoding gradient pulse ( FIG. 4 B ), and is different from the first pulse sequence in terms of readout gradient pulse.
- FIG. 4 E illustrates the readout gradient pulses G r2 in the second pulse sequence.
- the readout gradient pulse G r2 in the second pulse sequence is configured by adding an additional gradient pulse having a predetermined shape (for example, a rectangular shape) to both the front edge and the trailing edge of the readout gradient pulse G r1 in the first pulse sequence.
- the pre-phasing pulse in the second pulse sequence is configured by adding an additional gradient pulse having the same shape as mentioned above to the trailing edge of the pre-phasing pulse in the first pulse sequence.
- the pair composed of the pre-phasing pulse shown by hatching and the first half of the readout gradient pulse constitutes an MPG 2 pulse that produces the MPG effect in the second pulse sequence.
- FIG. 4 F shows MR signals emitted from the object when the readout gradient pulse in the second pulse sequence is applied. Each peak value of the MR signals is decayed by T2 relaxation along with elapse of time from the application of the excitation pulse similarly to the first pulse sequence.
- the time integral value of the MPG 2 pulse in the second pulse sequence is larger than the time integral value of the MPG 1 pulse in the first pulse sequence.
- the second pulse sequence is larger in MPG effect than the first pulse sequence, and the degree of decay of the peak value of the MR signal due to the elapse of time from the application of the excitation pulse is larger in the second pulse sequence.
- FIG. 5 illustrates the processing concept, in which the MR signal s 1 (t) obtained by the first pulse sequence and the MR signal s 2 (t) obtained by the second pulse sequence is used to calculate a true T2 value that is not influenced by diffusion and/or turbulent flow.
- the solid line in the upper graph of FIG. 5 schematically shows the respective decay curves of the MR signal s 1 (t) in the first pulse sequence and the MR signal s 2 (t) in the second pulse sequence along with the time elapsed after the application of the excitation pulse.
- Each curve is an envelope of each peak of the MR signals generated during each interval between refocusing pulses.
- the MR signal s 1 (t) in the first pulse sequence is decayed by T2 relaxation and perfusion and/or turbulent flow due to the MPG 1 pulse.
- the MR signal s 1 (t) can be represented by, for example, Expression 1 below.
- s 1 ( t ) s 0 *exp( ⁇ t/T 2)*exp( ⁇ b 1 *ADC )
- Expression 1
- T2 represents the transverse relaxation time value T2 of the imaging target
- ADC represents an apparent diffusion coefficient which is an index of perfusion and/or turbulent flow of the imaging target.
- the ADC is simply referred to as the diffusion coefficient.
- b 1 is an index (b-value) showing the MPG effect by the MPG 1 pulse, and a known value that can be calculated from the time waveform of the MPG 1 pulse.
- the MR signal s 2 (t) in the second pulse sequence can be represented by, for example, Expression 2 below.
- s 2 ( t ) s 0 *exp( ⁇ t/T 2)*exp( ⁇ b 2 *ADC )
- b 2 is also an index showing the MPG effect by the MPG 2 pulse and a known value that can be calculated from the time waveform of the MPG 2 pulse.
- Expression 3 represents the corrected MR signal s c (t).
- exp( ⁇ b 1 *ADC) which is the decay term of the diffusion coefficient ADC in Expression 1
- Expression 3 is composed only of the term of exp( ⁇ t/T2), which is the decay term due to T2 decay, and is not influenced by the perfusion and/or turbulent flow of the imaging target.
- the true T2 value without the influence of perfusion and/or turbulent flow can be calculated from the decay curve according to Expression 3.
- the concept of the first and second pulse sequences shown in FIG. 4 A to FIG. 4 F and the processing of the present embodiment shown in FIG. 5 are based on the assumption that the same T2 value and the same diffusion coefficient ADC is uniform over the entire imaging target. However, in reality, the T2 value and the diffusion coefficient ADC should show different values depending on the position of the imaging target. Thus, in the present embodiment, the diffusion coefficient ADC is calculated for each pixel position of the reconstructed image, and the true T2 value without influence of perfusion and/or turbulent flow is calculated for each pixel position.
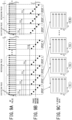
- FIG. 7 A to FIG. 9 C are diagrams illustrating the first and second pulse sequences set in the step ST 100 .
- FIG. 7 A and FIG. 7 B are respectively sequence diagrams of the RF pulse and the phase encoding gradient pulse GP that are common to the first and second pulse sequences.
- FIG. 7 C is a sequence diagram of the readout gradient pulse G r1 of the first pulse sequence.
- FIG. 7 D is a sequence diagram of the readout gradient pulse G r2 of the second pulse sequence.
- FIG. 8 A and FIG. 8 B are sequence diagrams of the first and second pulse sequences when viewed over a longer time span than FIG. 7 A to FIG. 7 D .
- the solid straight line extending in the horizontal direction corresponds to the phase encode amount of zero, and the value of the phase encode amount is schematically shown by the distance between each black square and the solid straight line.
- the plurality of refocusing pulses are classified into a plurality of groups that are different in echo time TE from each other, and the phase encode amount associated with each refocusing pulse is set to change in a predetermined pattern for each refocusing pulse within each group.
- the plurality of refocusing pulses are classified into N groups consisting of the group 1 to the group N, and each group has M refocusing pulses.
- each group includes five refocusing pulses.
- the phase encode amount associated with each refocusing pulse is set such that the phase encode amount changes for each refocusing pulse within each group in a predetermined pattern, for example, “+2P, +P, 0, ⁇ P, ⁇ 2p” wherein “P” is a predetermined unit of phase encode amount.
- the elapsed time from the application of the excitation pulse to the center of each group is considered to be the echo time TE representing each group.
- MR signals corresponding to the echo times TE 1 , TE 2 , TE 3 , . . . , TE (N) can be respectively obtained in the group 1, group 2, group 3, . . . , Group N.
- the first and second pulse sequences are set such that application of one segment, which is composed of one excitation pulse and the subsequent refocusing pulses, is repeated a predetermined number of times (for example, L times) during a repetition time TR.
- the phase encode amount is set such that the change pattern of the phase encode amount in each group is different between different segments. For example, as shown in FIG. 8 B , when the change pattern of the phase encode amount of every group in the first segment is “+2P, +P, 0, ⁇ P, ⁇ 2P”, the change pattern of the phase encode amount of every group in the second segment is set to be, for example, “+2P+ ⁇ , +P+ ⁇ , +a, ⁇ P+ ⁇ , ⁇ 2P+ ⁇ ”, where the phase encode amount in the first segment is uniformly shifted by a in the plus direction.
- FIG. 9 A to FIG. 9 C are schematic diagrams illustrating a concept of filling k-spaces with k-space data (i.e., MR signals) acquired in a plurality of segments.
- k-space data of groups corresponding to the same echo time TE i.e., k-space data of groups having the same group number
- k-spaces provided for each of different echo times TE such as TE 1 , TE 2 , TE 3 , . . . , TE(N) are filled.
- k-space data are acquired by repeating a segment composed of a plurality of groups with different echo times for a plurality of times, and accordingly, each k-space corresponding to different echo times can be fully filled with k-space data that are sufficient for reconstructing complete images.
- the change pattern of the phase encode amount is common to all the groups in the same segment in the case shown in FIG. 7 A to FIG. 9 C , the change pattern of the phase encode amount is not limited to the above-described case.
- the change pattern of phase encode amount between groups in the same segment may be different. The point is that, when acquiring k-space data over a plurality of segments, it is sufficient that each k-space corresponding to different echo times are eventually fully filled, without overlap, with k-space data enough for reconstructing the complete images.
- step ST 100 the above-described first and second pulse sequences are set.
- the first and second b-values (b 1 and b 2 ) are calculated from the shapes of the respective MPG pulses (MPG 1 and MPG 2 ) in the readout gradient pulse of the first and second pulse sequences by a known method (see FIG. 11 A ).
- the processing of the step ST 101 is performed by, for example, the ADC map generation function F 03 .
- the first and second pulse sequences determined in the step ST 100 are applied to the object to acquire the first MR signals and the second MR signals.
- the processing of the step ST 102 is performed by the scanner 600 .
- each of k-spaces corresponding to the respective different echo times is filled with the digitized first MR signals having the same echo time to constitute a first k-space dataset for each echo time so as to generate the first images.
- each of k-spaces corresponding to the respective different echo times is filled with the digitized second MR signals having the same echo time to constitute a second k-space dataset for each echo time so as to generate the second images.
- FIG. 10 A illustrates the first k-space dataset generated for each echo time from TE 1 to TE(N)
- FIG. 100 illustrates the second k-space dataset generated for each echo time from TE 1 to TE(N).
- the first and second images for each echo time are generated by reconstructing the first and second k-space datasets for each echo time.
- FIG. 10 A to FIG. 10 D illustrate the processing concept of reconstructing the first and second k-space datasets for each echo time to generate the first and second images for each echo time.
- the processing of the steps ST 103 and ST 104 is performed by, for example, the image generation function F 02 in FIG. 2 .
- the diffusion coefficient ADC i.e., ADC map
- ADC map the diffusion coefficient ADC for each pixel position is calculated from each pixel value S 1 (x, y) of the first image, each pixel value S 2 (x, y) of the second image, and the first and second b-values (b1, b2).
- the processing of the step ST 105 is performed by the ADC map generation function F 03 in FIG. 2 .
- FIG. 11 A to FIG. 11 C illustrate the processing concept of the step ST 105 .
- the pixel value S 1 (x, y) of the first image is subjected to T2 decay ⁇ exp( ⁇ TE(n)/T2) ⁇ depending on the echo time TE(n) and the T2 value of the tissue of the object at the pixel position (x, y), and is also subjected to decay ⁇ exp( ⁇ b 1 *ADC(x, y)) ⁇ , for each readout, by perfusion and/or turbulent flow depending on the diffusion coefficient ADC at the pixel position (x, y) and the b 1 value of the first pulse sequence.
- the pixel value S 1 (x, y) of the first image is subjected to decay effectively corresponding to the (M*b1) value as the MPG effect.
- M 5
- the effective b-value integrated between two adjacent echo times is used in the following for convenience.
- the pixel value S 1 (x, y) of the first image can be expressed by Expression 4 below.
- S 1 ( x,y ) S 0 ( x,y )*exp( ⁇ TE ( n )/ T 2)*exp( ⁇ b 1 *ADC ( x,y ))
- the pixel value S 2 (x, y) of the second image is subjected to T2 decay ⁇ exp( ⁇ TE(n)/T2) ⁇ depending on the echo time TE(n) and the T2 value of the tissue of the object at the pixel position (x, y), and is also subjected to decay ⁇ exp( ⁇ b 2 *ADC(x, y)) ⁇ by perfusion and/or turbulent flow depending on the diffusion coefficient ADC at the pixel position (x, y) and the b 2 value of the second pulse sequence.
- the pixel value S 2 (x, y) of the second image can be expressed by Expression 5 below.
- S 2 ( x,y ) S 0 ( x,y )*exp( ⁇ TE ( n )/ T 2)*exp( ⁇ b 2 *ADC ( x,y ))
- the diffusion coefficient ADC for each pixel position (i.e., the ADC map) is used to correct the first images generated for each echo time, and the influence of diffusion and/or turbulence is removed from the first images.
- the processing of the step ST 106 is performed by the diffusion/motion correction function F 04 in FIG. 2 .
- FIG. 12 A to FIG. 12 C are schematic diagrams illustrating the processing concept of the step ST 106 .
- FIG. 12 A shows the first images for each echo time TE(n) before correction wherein n is 1 to N, and these uncorrected first images are influenced by perfusion and/or turbulent flow.
- Each pixel value of the first image before correction is subjected to decay by perfusion and/or turbulent flow ⁇ exp( ⁇ b 1 *ADC(x, y)) ⁇ depending on the b 1 value of the first pulse sequence as shown in Expression 4.
- the true T2 value from which the influence of diffusion and/or turbulence is removed, is calculated for each pixel position based on the change in pixel value of the corrected first image with respect to the echo time TE, and the T2 map is generated by arranging the true T2 values at corresponding pixel positions.
- the processing of the step ST 107 is performed by the T2 map generation function F 05 in FIG. 2 .
- FIG. 13 A to FIG. 13 C are schematic diagrams illustrating the processing concept of the step ST 107 .
- the curve shown by the broken line in FIG. 13 B is a schematic graph in which the pixel value S c (x, y) of the corrected first image is marked with a dot with respect to the echo time TE.
- the curve shown by the solid line in FIG. 13 B is a schematic graph in which the pixel value S 1 (x, y) of the first image before correction is marked with a dot with respect to the echo time TE.
- the T2 value can be calculated when pixel values S c (x, y) for at least two echo times TE are available.
- the calculation accuracy of the T2 value can be enhanced by increasing the sample points of the echo time TE and using a method such as curve fitting.
- multi-component substances showing different T2 values in the same pixel position may be included. Even in such a case, the T2 value of each component can be estimated from the change curve of the pixel value S c (x, y) corresponding to two or more echo times TE.
- the true T2 map can be generated as shown in FIG. 13 C .
- the T2 spectrum illustrated in FIG. 14 B can also be calculated from the change curve ( FIG. 14 A ) of each pixel value S c (x, y) of the corrected first image with respect to the echo time TE.
- the T2 spectrum is obtained by marking the horizontal axis showing the T2 value of each pixel and the vertical axis showing the relative amplitude (i.e., normalized pixel value) of each pixel. Under the influence of perfusion and/or turbulent flow, the peak of the T2 spectrum shows a larger T2 value compared with the peak of the true T2 spectrum obtained by correction.
- the spectrum peak appears at the correct position of the T2 value.
- the calculation processing of the T2 spectrum is performed by the T2 spectrum generation function F 06 in FIG. 2 .
- FIG. 15 A to FIG. 15 C are sequence diagrams of the first and second pulse sequences according to the first modification of the present embodiment.
- the first pulse sequence FIG. 15 A and FIG. 15 B
- the readout gradient pulse of the second pulse sequences is slightly different from the above-described embodiment as shown in FIG. 15 C .
- the same readout gradient pulse as that of the first pulse sequence is applied (i.e., the additional gradient pulse is not added) during the predetermined echo time TEa from the application of the excitation pulse, and the additional gradient pulse is added after the predetermined echo time TEa elapsed.
- the main imaging target of the MRI apparatus 1 of the present embodiment is a body fluid such as CSF having a relatively long T2 relaxation time.
- a correction process it is usually sufficient to target a signal having an echo time TE longer than a predetermined echo time TEa. Since the additional gradient pulse is not added in the period from the application of the excitation pulse to the predetermined echo time TEa, the burden on the MRI apparatus 1 is reduced. Further, by using data acquired by adding the additional gradient pulse to limit the processing, such as the reconstruction of the first and second images, the correction of the first images, calculation of T2 values using the corrected first images, time for such processing can be shortened.
- FIG. 16 A to FIG. 16 C are schematic diagrams illustrating a processing concept of the second modification of the present embodiment.
- the intervals of the echo times TE are set to be unequal by thinning out some of the first and second images.
- the T2 value is calculated from the curve of the pixel values of the corrected first image with respect to the echo time TE. Normally, change of this curve is larger in the region where the echo time TE is short, and becomes smaller as the echo time TE becomes longer. Thus, in the region where the echo time TE is short, data are acquired at equal intervals as shown in FIG. 14 A .
- the interval between two adjacent echo times is set to be longer than the region where the echo time TE is short.
- the application direction of each readout gradient pulse of the second pulse sequence is set to be the same as the application direction of each readout gradient pulse of the first pulse sequence.
- the imaging-condition setting function F 01 sets a third pulse sequence in which the application direction of the readout gradient pulse is orthogonal to the application direction of the readout gradient pulse of the second pulse sequence. Further, imaging-condition setting function F 01 sets a fourth pulse sequence in which the application direction of the readout gradient pulse is orthogonal to both of the application direction of the readout gradient pulse of the second pulse sequence and the application direction of the readout gradient pulse of the third pulse sequence.
- each readout gradient pulse in the third and fourth pulse sequences is a pulse in which two additional gradient pulse are added to the respective front and trailing edges of the readout gradient pulse in the first pulse sequence, and has a predetermined magnitude of the MPG effect.
- the image generation function F 02 Based on the respective MR signals acquired by applying the above-described second to fourth (i.e., second, third, and fourth) pulse sequences to the object, the image generation function F 02 according to the third modification generates at least one of: a set of respective diffusion-weighted images based on the second to fourth pulse sequences; a set of respective diffusion coefficient images based on the second to fourth pulse sequences; and a diffusion tensor image.
- the MRI apparatus of each embodiment can acquire a highly accurate T2 value and an index related to diffusion and/or turbulent flow in a short imaging time.
Landscapes
- Physics & Mathematics (AREA)
- High Energy & Nuclear Physics (AREA)
- Condensed Matter Physics & Semiconductors (AREA)
- General Physics & Mathematics (AREA)
- Health & Medical Sciences (AREA)
- Nuclear Medicine, Radiotherapy & Molecular Imaging (AREA)
- Engineering & Computer Science (AREA)
- Signal Processing (AREA)
- General Health & Medical Sciences (AREA)
- Radiology & Medical Imaging (AREA)
- Vascular Medicine (AREA)
- Magnetic Resonance Imaging Apparatus (AREA)
Abstract
Description
s 1(t)=s 0*exp(−t/T2)*exp(−b 1 *ADC)
s 2(t)=s 0*exp(−t/T2)*exp(−b 2 *ADC)
s c(t)=s 0*exp(−t/T2)
S 1(x,y)=S 0(x,y)*exp(−TE(n)/T2)*exp(−b 1 *ADC(x,y))
S 2(x,y)=S 0(x,y)*exp(−TE(n)/T2)*exp(−b 2 *ADC(x,y)) Expression 5
S c(x,y)=S 0(x,y)*exp(−TE(n)/T2) Expression 6
Claims (18)
Applications Claiming Priority (2)
| Application Number | Priority Date | Filing Date | Title |
|---|---|---|---|
| JP2021-098207 | 2021-06-11 | ||
| JP2021098207A JP7706269B2 (en) | 2021-06-11 | 2021-06-11 | Magnetic resonance imaging equipment |
Publications (2)
| Publication Number | Publication Date |
|---|---|
| US20220397626A1 US20220397626A1 (en) | 2022-12-15 |
| US12181556B2 true US12181556B2 (en) | 2024-12-31 |
Family
ID=81850265
Family Applications (1)
| Application Number | Title | Priority Date | Filing Date |
|---|---|---|---|
| US17/804,220 Active 2042-07-29 US12181556B2 (en) | 2021-06-11 | 2022-05-26 | MRI apparatus |
Country Status (3)
| Country | Link |
|---|---|
| US (1) | US12181556B2 (en) |
| EP (1) | EP4102243A1 (en) |
| JP (1) | JP7706269B2 (en) |
Families Citing this family (1)
| Publication number | Priority date | Publication date | Assignee | Title |
|---|---|---|---|---|
| CN117233676B (en) * | 2023-11-15 | 2024-03-26 | 之江实验室 | Echo time-dependent magnetic resonance diffusion imaging signal generation method and device |
Citations (4)
| Publication number | Priority date | Publication date | Assignee | Title |
|---|---|---|---|---|
| US5560360A (en) * | 1992-03-09 | 1996-10-01 | University Of Washington | Image neurography and diffusion anisotropy imaging |
| US20160202338A1 (en) * | 2014-12-26 | 2016-07-14 | Kabushiki Kaisha Toshiba | Mri apparatus, image processing device, and generation method of diffusion-weighted image |
| US20170363699A1 (en) * | 2016-06-20 | 2017-12-21 | Toshiba Medical Systems Corporation | Mri apparatus and image processing apparatus |
| US20180067183A1 (en) * | 2016-09-02 | 2018-03-08 | Samsung Electronics Co., Ltd. | Magnetic resonance imaging apparatus and method for obtaining magnetic resonance image |
Family Cites Families (4)
| Publication number | Priority date | Publication date | Assignee | Title |
|---|---|---|---|---|
| JP5481117B2 (en) | 2008-09-29 | 2014-04-23 | 株式会社東芝 | Magnetic resonance diagnostic apparatus and control method thereof |
| JP2011143241A (en) | 2009-12-18 | 2011-07-28 | Toshiba Corp | Magnetic resonance imaging apparatus |
| JP7366575B2 (en) | 2019-04-11 | 2023-10-23 | キヤノンメディカルシステムズ株式会社 | Magnetic resonance imaging device, magnetic resonance imaging method, and image processing device |
| CN112462311B (en) | 2020-11-09 | 2021-06-15 | 无锡鸣石峻致医疗科技有限公司 | Method and device for correcting and measuring transverse magnetization vector decay time constant, computer equipment and non-uniform field magnetic resonance system |
-
2021
- 2021-06-11 JP JP2021098207A patent/JP7706269B2/en active Active
-
2022
- 2022-05-25 EP EP22175386.6A patent/EP4102243A1/en active Pending
- 2022-05-26 US US17/804,220 patent/US12181556B2/en active Active
Patent Citations (5)
| Publication number | Priority date | Publication date | Assignee | Title |
|---|---|---|---|---|
| US5560360A (en) * | 1992-03-09 | 1996-10-01 | University Of Washington | Image neurography and diffusion anisotropy imaging |
| US20160202338A1 (en) * | 2014-12-26 | 2016-07-14 | Kabushiki Kaisha Toshiba | Mri apparatus, image processing device, and generation method of diffusion-weighted image |
| US20170363699A1 (en) * | 2016-06-20 | 2017-12-21 | Toshiba Medical Systems Corporation | Mri apparatus and image processing apparatus |
| JP2017225501A (en) | 2016-06-20 | 2017-12-28 | 東芝メディカルシステムズ株式会社 | Magnetic resonance imaging apparatus and image processing apparatus |
| US20180067183A1 (en) * | 2016-09-02 | 2018-03-08 | Samsung Electronics Co., Ltd. | Magnetic resonance imaging apparatus and method for obtaining magnetic resonance image |
Non-Patent Citations (5)
| Title |
|---|
| Extended European Search Report issued Oct. 25, 2022, in corresponding European Patent Application No. 22175386.6, 8 pages. |
| Natalie Bnaiahu et al: "The generalized effect of diffusion on quantitative T2 mapping in preclinical scanners" Proceedings of The International Society for Magnetic Resonance in Medicine, 27TH Annual Meeting and Exhibition, vol. 27, 3217, Apr. 26, 2019, XP040710603. |
| Oshio et al., "The Spatial Distribution of Water Components with Similar T2 May Provide Insight into Pathways for Large Molecule Transportation in the Brain", Magn Reson Med Sci, 2020, doi:10.2463/mrms.mp.2019-0138, 6 Pages. |
| Shepherd Timothy M. et al: "New rapid, accurate T2 quantification detects pathology in normal-appearing brain regions of relapsing-remitting MS patients", Neuroimage: Clinical, vol. 14, Feb. 3, 2017, pp. 363-370, XP055966945. |
| Umesh Rudrapatna S. et al.: "Measurement of distinctive features of cortical spreading depolarizations with different MRI contrasts", NMR in Biomedicine., vol. 28, No. 5, Mar. 27, 2015, pp. 591-600, XP055966069. |
Also Published As
| Publication number | Publication date |
|---|---|
| US20220397626A1 (en) | 2022-12-15 |
| EP4102243A1 (en) | 2022-12-14 |
| JP7706269B2 (en) | 2025-07-11 |
| JP2022189560A (en) | 2022-12-22 |
Similar Documents
| Publication | Publication Date | Title |
|---|---|---|
| Haskell et al. | Off‐resonance artifact correction for MRI: a review | |
| US10488479B2 (en) | MRI apparatus and image processing apparatus | |
| CN102697501B (en) | Correct the method for the phase information in magnetic resonance image (MRI) and corresponding magnetic resonance equipment | |
| US9341694B2 (en) | Method and magnetic resonance system for distortion correction in magnetic resonance imaging | |
| JP6037652B2 (en) | Diffusion-weighted magnetic resonance data generation method, magnetic resonance system, and computer-readable storage medium | |
| US9910120B2 (en) | Method and magnetic resonance apparatus to acquire magnetic resonance data with a diffusion-weighted magnetic resonance sequence | |
| Pipe | Pulse sequences for diffusion-weighted MRI | |
| US10031201B2 (en) | Method and apparatus for magnetic resonance imaging | |
| Moeller et al. | Diffusion imaging in the post HCP era | |
| In et al. | Distortion‐free imaging: A double encoding method (DIADEM) combined with multiband imaging for rapid distortion‐free high‐resolution diffusion imaging on a compact 3T with high‐performance gradients | |
| US10502801B2 (en) | Method and magnetic resonance apparatus for generating a weighting matrix for reducing artifacts with parallel imaging | |
| CN113544527A (en) | EPI MR imaging with distortion correction | |
| CN113939846A (en) | Helical MR imaging with partial resonance artifact correction | |
| US12181556B2 (en) | MRI apparatus | |
| KR20180007327A (en) | Reducing artifacts in magnetic resonance technology | |
| US20190346525A1 (en) | Mri apparatus | |
| US11255942B2 (en) | Magnetic resonance imaging apparatus | |
| US12089922B2 (en) | MRI apparatus and non-transitory computer-readable storage medium | |
| US10401460B2 (en) | Method and magnetic resonance apparatus for acquiring magnetic resonance dataset with reduced susceptibility artifacts in the reconstruction image | |
| JP3688795B2 (en) | Magnetic resonance imaging system | |
| JPH1156808A (en) | Magnetic resonance device | |
| US20230094606A1 (en) | Creating Calibration Data for Completing Undersampled Measurement Data of an Object to be Examined by Means of a Magnetic Resonance System | |
| EP4465069A1 (en) | Improved echo planar magnetic resonance imaging | |
| JP2022016312A (en) | Magnetic resonance imaging device and magnetic resonance imaging method | |
| Van | High resolution 3D diffusion tensor imaging for delineating neuronal architectures |
Legal Events
| Date | Code | Title | Description |
|---|---|---|---|
| AS | Assignment |
Owner name: CANON MEDICAL SYSTEMS CORPORATION, JAPAN Free format text: ASSIGNMENT OF ASSIGNORS INTEREST;ASSIGNORS:YUI, MASAO;IKEZAKI, AINA;SIGNING DATES FROM 20220517 TO 20220524;REEL/FRAME:060030/0064 |
|
| FEPP | Fee payment procedure |
Free format text: ENTITY STATUS SET TO UNDISCOUNTED (ORIGINAL EVENT CODE: BIG.); ENTITY STATUS OF PATENT OWNER: LARGE ENTITY |
|
| STPP | Information on status: patent application and granting procedure in general |
Free format text: DOCKETED NEW CASE - READY FOR EXAMINATION |
|
| STPP | Information on status: patent application and granting procedure in general |
Free format text: NON FINAL ACTION MAILED |
|
| STPP | Information on status: patent application and granting procedure in general |
Free format text: RESPONSE TO NON-FINAL OFFICE ACTION ENTERED AND FORWARDED TO EXAMINER |
|
| STPP | Information on status: patent application and granting procedure in general |
Free format text: FINAL REJECTION MAILED |
|
| STPP | Information on status: patent application and granting procedure in general |
Free format text: DOCKETED NEW CASE - READY FOR EXAMINATION |
|
| STPP | Information on status: patent application and granting procedure in general |
Free format text: NOTICE OF ALLOWANCE MAILED -- APPLICATION RECEIVED IN OFFICE OF PUBLICATIONS |
|
| STPP | Information on status: patent application and granting procedure in general |
Free format text: PUBLICATIONS -- ISSUE FEE PAYMENT RECEIVED |
|
| STPP | Information on status: patent application and granting procedure in general |
Free format text: PUBLICATIONS -- ISSUE FEE PAYMENT VERIFIED |
|
| STCF | Information on status: patent grant |
Free format text: PATENTED CASE |