US12154677B2 - Systems and methods for neuro-behavioral relationships in dimensional geometric embedding (N-BRIDGE) - Google Patents
Systems and methods for neuro-behavioral relationships in dimensional geometric embedding (N-BRIDGE) Download PDFInfo
- Publication number
- US12154677B2 US12154677B2 US16/980,136 US201916980136A US12154677B2 US 12154677 B2 US12154677 B2 US 12154677B2 US 201916980136 A US201916980136 A US 201916980136A US 12154677 B2 US12154677 B2 US 12154677B2
- Authority
- US
- United States
- Prior art keywords
- neural
- behavioral
- patient
- neuro
- data
- Prior art date
- Legal status (The legal status is an assumption and is not a legal conclusion. Google has not performed a legal analysis and makes no representation as to the accuracy of the status listed.)
- Active, expires
Links
Images


Classifications
-
- G—PHYSICS
- G16—INFORMATION AND COMMUNICATION TECHNOLOGY [ICT] SPECIALLY ADAPTED FOR SPECIFIC APPLICATION FIELDS
- G16H—HEALTHCARE INFORMATICS, i.e. INFORMATION AND COMMUNICATION TECHNOLOGY [ICT] SPECIALLY ADAPTED FOR THE HANDLING OR PROCESSING OF MEDICAL OR HEALTHCARE DATA
- G16H20/00—ICT specially adapted for therapies or health-improving plans, e.g. for handling prescriptions, for steering therapy or for monitoring patient compliance
- G16H20/70—ICT specially adapted for therapies or health-improving plans, e.g. for handling prescriptions, for steering therapy or for monitoring patient compliance relating to mental therapies, e.g. psychological therapy or autogenous training
-
- A—HUMAN NECESSITIES
- A61—MEDICAL OR VETERINARY SCIENCE; HYGIENE
- A61B—DIAGNOSIS; SURGERY; IDENTIFICATION
- A61B5/00—Measuring for diagnostic purposes; Identification of persons
- A61B5/05—Detecting, measuring or recording for diagnosis by means of electric currents or magnetic fields; Measuring using microwaves or radio waves
- A61B5/055—Detecting, measuring or recording for diagnosis by means of electric currents or magnetic fields; Measuring using microwaves or radio waves involving electronic [EMR] or nuclear [NMR] magnetic resonance, e.g. magnetic resonance imaging
-
- A—HUMAN NECESSITIES
- A61—MEDICAL OR VETERINARY SCIENCE; HYGIENE
- A61B—DIAGNOSIS; SURGERY; IDENTIFICATION
- A61B5/00—Measuring for diagnostic purposes; Identification of persons
- A61B5/16—Devices for psychotechnics; Testing reaction times ; Devices for evaluating the psychological state
- A61B5/165—Evaluating the state of mind, e.g. depression, anxiety
-
- A—HUMAN NECESSITIES
- A61—MEDICAL OR VETERINARY SCIENCE; HYGIENE
- A61B—DIAGNOSIS; SURGERY; IDENTIFICATION
- A61B5/00—Measuring for diagnostic purposes; Identification of persons
- A61B5/72—Signal processing specially adapted for physiological signals or for diagnostic purposes
- A61B5/7235—Details of waveform analysis
- A61B5/7264—Classification of physiological signals or data, e.g. using neural networks, statistical classifiers, expert systems or fuzzy systems
-
- A—HUMAN NECESSITIES
- A61—MEDICAL OR VETERINARY SCIENCE; HYGIENE
- A61B—DIAGNOSIS; SURGERY; IDENTIFICATION
- A61B5/00—Measuring for diagnostic purposes; Identification of persons
- A61B5/72—Signal processing specially adapted for physiological signals or for diagnostic purposes
- A61B5/7271—Specific aspects of physiological measurement analysis
- A61B5/7275—Determining trends in physiological measurement data; Predicting development of a medical condition based on physiological measurements, e.g. determining a risk factor
-
- G—PHYSICS
- G16—INFORMATION AND COMMUNICATION TECHNOLOGY [ICT] SPECIALLY ADAPTED FOR SPECIFIC APPLICATION FIELDS
- G16H—HEALTHCARE INFORMATICS, i.e. INFORMATION AND COMMUNICATION TECHNOLOGY [ICT] SPECIALLY ADAPTED FOR THE HANDLING OR PROCESSING OF MEDICAL OR HEALTHCARE DATA
- G16H40/00—ICT specially adapted for the management or administration of healthcare resources or facilities; ICT specially adapted for the management or operation of medical equipment or devices
- G16H40/60—ICT specially adapted for the management or administration of healthcare resources or facilities; ICT specially adapted for the management or operation of medical equipment or devices for the operation of medical equipment or devices
- G16H40/63—ICT specially adapted for the management or administration of healthcare resources or facilities; ICT specially adapted for the management or operation of medical equipment or devices for the operation of medical equipment or devices for local operation
-
- G—PHYSICS
- G16—INFORMATION AND COMMUNICATION TECHNOLOGY [ICT] SPECIALLY ADAPTED FOR SPECIFIC APPLICATION FIELDS
- G16H—HEALTHCARE INFORMATICS, i.e. INFORMATION AND COMMUNICATION TECHNOLOGY [ICT] SPECIALLY ADAPTED FOR THE HANDLING OR PROCESSING OF MEDICAL OR HEALTHCARE DATA
- G16H50/00—ICT specially adapted for medical diagnosis, medical simulation or medical data mining; ICT specially adapted for detecting, monitoring or modelling epidemics or pandemics
- G16H50/20—ICT specially adapted for medical diagnosis, medical simulation or medical data mining; ICT specially adapted for detecting, monitoring or modelling epidemics or pandemics for computer-aided diagnosis, e.g. based on medical expert systems
Definitions
- Embodiments herein relate to systems and methods for mapping multi-dimensional relationships between neural and behavioral features in humans.
- N-BRIDGE neuro-behavioral relationships in dimensional geometric embedding
- N-BRIDGE includes a comprehensive, extensible, data-driven analytic framework for mapping the multi-dimensional and/or multi-variate relationships between neural and behavioral/phenotypic features in individual or groups of humans.
- N-BRIDGE allows mapping of variations along newly-defined data-driven behavioral/phenotypic latent and/or manifest weighted composite dimensions/axes that capture the geometry of behavioral/phenotypic variation to variation in multi-dimensional combination of neural areal features (e.g. voxels, areas or networks).
- This bi-directional data-driven mapping allows for the robust identification of neuro-behavioral latent and/or manifest weighted composite and/or manifest weighted composite variables that capture clinically and therapeutically relevant information along complex behavioral/phenotypic dimensions.
- This multi-dimensional mapping can in turn allow for neurobiologically-grounded definition of robust therapeutic neural targets that quantitatively vary in relation to alterations in behavioral/phenotypic dimensions.
- Capturing the newly-defined data-driven behavioral dimensions obtained via N-BRIDGE reveals a qualitatively novel and substantially more quantitatively robust mapping of neural feature variation onto behavioral/phenotypic dimensions relative to existing approaches, which directly impacts clinically and therapeutically relevant use for specific patients.
- the newly defined behavioral/phenotypic dimensions while robustly mapping neural circuit variation, do not necessarily reveal differences between pre-existing psychiatric diagnostic groups defined using conventional categorical approaches.
- the resulting neural-behavioral multi-dimensional geometry would have been quantitatively invisible to any prior approach using either existing psychiatric diagnoses or any one single pre-existing clinical scale.
- using the neural-behavioral multi-dimensional geometry mapping obtained via N-BRIDGE it is possible to make subject-specific, quantitative predictions about individuals with the same clinical/psychiatric diagnosis but markedly different behavioral profiles and/or neural profiles, with respect to therapeutically relevant targets.
- the multi-dimensional behavioral/phenotypic to neural feature mapping informs the identification of pharmacological targets for developing drugs or therapeutics for specific behavioral/phenotypic profiles, which may not be evident using either existing psychiatric diagnoses or any one single pre-existing clinical scale.
- this multi-dimensional behavioral/phenotypic to neural feature mapping when applied to the individual subject level, provides an assisted selection of behavioral/clinical/symptom measures that quantitatively pinpoint variation in a specific neural circuit.
- the multi-dimensional behavioral/phenotypic to neural feature mapping provides an assisted selection of specific neural features that in turn quantitatively map onto behavioral/clinical/symptom measures.
- This individual-level quantitative framework confers a fundamental technical advantage for patient segmentation who present with neuro-behavioral alterations along one or more behavioral and/or neural features.
- the framework itself may also be iteratively applied to existing behavioral and neuroimaging data to inform and refine use of existing therapeutics which may have not been optimally targeted. Additionally, the ability to match patients to clinical trials and identify pharmacological targets for drug development with higher rates of success has massive economic upside for enterprises that develop and refine clinical trials (i.e. millions of dollars in savings per trial).
- the opportunity to develop and refine an individual-level quantitative framework via the present invention confers a fundamentally more rapid and cost-effective way of identifying how to effectively treat individuals with neuro-behavioral alterations based on their specific and unique profile of neuro-behavioral alterations (e.g., not pre-grouping individuals into a category or syndrome or defining their treatment based solely on a single pre-existing clinical scale of behavior).
- a method for treating a patient based on neuro-behavioral mapping includes receiving, from a user interface of a computing device, behavioral data of a patient corresponding to mental health or cognitive status of the patient, predicting, by at least one processor of the computing device, a neural feature map for the patient representative of neural data based on the behavioral data, determining, by the at least one processor, a therapeutic associated with the neural feature map, and treating the patient with the therapeutic associated with the neural feature map.
- a method for treating a patient based on neuro-behavioral mapping includes receiving, from a user interface of a computing device, neural data of a patient corresponding to neural status of the patient, predicting, by at least one processor of the computing device, a behavioral feature profile for the patient representative of behavioral data based on the neural data, determining, by the at least one processor, a therapeutic associated with the behavioral feature profile, and treating the patient with the therapeutic associated with the behavioral feature profile.
- a method for prognosticating a treatment for a patient based on neuro-behavioral mapping includes receiving, from a user interface of a computing device, behavioral data of a patient corresponding to mental health or cognitive status of the patient, predicting, by at least one processor of the computing device, a neural feature map for the patient representative of neural data based on the behavioral data, determining, by the at least one processor, at least one neural therapeutic target with a quantitative score indicating correspondence with the neural feature map above a predetermined threshold that the patient will likely respond to, and prognosticating, by the at least one processor, a therapeutic associated with the at least one neural therapeutic target for a current treatment of the patient based on behaviors the patient is presenting.
- a method for prognosticating a treatment for a patient based on neuro-behavioral mapping includes receiving, from a scanning or recording device, neural data of a patient corresponding to the neural status of that patient, predicting, by at least one processor of the computing device, a behavioral feature profile for the patient representative of behavioral data based on the neural data, determining, by the at least one processor, at least one therapeutic target with a quantitative score indicating correspondence with the behavioral feature profile above a predetermined threshold that the patient will likely respond to, and prognosticating, by the at least one processor, a therapeutic associated with the at least one behavioral feature profile for treatment of the patient based on the patient's presently obtained neural data.
- a method for forecasting clinical status for an individual based on neuro-behavioral mapping includes receiving, from a user interface of a computing device, behavioral data of an individual corresponding to mental health or cognitive status of the individual, predicting, by at least one processor of the computing device, a neural feature map for the individual representative of neural data based on the behavioral data, and forecasting, by the at least one processor, a quantitative correspondence of similarity of the neural feature map with a predetermined neural feature map corresponding to a pre-existing patients' neuro-behavioral mapping, wherein the quantitative correspondence indicates a future occurrence of a clinical status.
- a method for forecasting a clinical status for an individual based on neuro-behavioral mapping includes receiving, from a scanning or recording device, neural data of an individual corresponding to the neural status of the individual, predicting, by at least one processor of the computing device, a behavioral feature profile for the individual representative of behavioral data based on the neural data; and forecasting, by the at least one processor, a quantitative correspondence of similarity of the behavioral feature profile with a predetermined behavioral feature profile corresponding to a pre-existing patients' neuro-behavioral mapping, wherein the quantitative correspondence indicates a future occurrence of a clinical status.
- a method for mapping between one or more behavioral features and neural features in humans includes receiving, by a computing device, neural data and behavioral data for each individual in a plurality of individuals at one or more discrete points in time, determining, by at least one processor of the computing device, a multi-dimensional geometry of latent behavioral and neural features based on a statistical analysis of the neural data and behavioral data for each individual, and saving and displaying quantified statistical relationships obtained from the multi-dimensional geometry on an output device of the computing device.
- a method for mapping between one or more behavioral features and neural features in patients presenting mental health symptoms includes receiving, by a computing device, neural data and symptom-relevant behavioral data relevant to mental health status for each patient in a plurality of patients at one or more discrete points in time, determining, by at least one processor of the computing device, a multi-dimensional geometry of latent behavioral and neural features based on a statistical analysis of the neural data and symptom-relevant behavioral data for each patient, saving and displaying quantified statistical relationships obtained from the multi-dimensional geometry on an output device of the computing device, and deriving clinical status information and/or treatment-relevant information from the multi-dimensional geometry.
- a system for determining an individual's quantitative score within the established neuro-behavioral mapping includes a neural scanning or recording device for obtaining neural data and/or behavioral recording device for obtaining behavioral data, a computing device including a graphical user interface, memory, and at least one processor, in which the neural scanning or recording device, the behavioral recording device and the computing device are communicatively coupled via a network.
- the neural scanning or recording device and/or the behavioral recording device is configured to process the neural data and/or the behavioral data to output neural and/or behavioral latent feature scores for the individual within a predetermined multi-dimensional neuro-behavioral geometry.
- the neural scanning or recording device is configured to scan or record the individual's brain, and output at least one of neural data.
- the behavioral recording device is configured to record the individual's behavioral data and output the behavioral data.
- the at least one processor of the computing device is configured to receive the neural data from the neural scanning or recording device and/or the behavioral data from the behavioral recording device, project the individual's neural data and/or the behavioral data into the predetermined multi-dimensional neuro-behavioral geometry of latent behavior and neural features, generate outputs via the graphical user interface indicating at least one of the individual's projection scores within the predetermined multi-dimensional neuro-behavioral geometry, and save at least one of the scores in the memory of the computing device.
- a method for identifying individuals with similar neuro-behavioral latent scores based on their quantitative proximity in a neuro-behavioral geometry includes receiving, from a scanning or recording device, neural data of an individual corresponding to a neural status of the individual, receiving, from a user interface of a computing device, behavioral data of the individual corresponding to mental health or cognitive status of the individual, determining, by at least one processor of the computing device, a behavioral feature profile for the individual based on the behavioral data, determining, a neural feature map for the individual based on the neural data, determining, by the at least one processor, a quantitative proximity of behavioral and neural feature scores of individuals within a plurality of individuals based on the behavioral feature profile and/or the neural feature map, and identifying, by the at least one processor, individuals with quantitatively similar neuro-behavioral latent scores based on their quantitative proximity in the neuro-behavioral geometry.
- a method for mapping between one or more behavioral features and neural features in humans includes receiving, by a computing device, neural data and phenotypic data for each individual in a plurality of individuals at one or more discrete points in time, determining, by at least one processor of the computing device, a multi-dimensional geometry of latent behavioral feature data based on a statistical analysis of the neural data and phenotypic data for each individual, quantifying statistical relationships of the neural data and phenotypic data for each individual, by the at least one processor of the computing device, to map the one or more behavioral features and the neural features, the quantifying including a multi-dimensional analysis of the neural data and phenotypic data for each individual, and displaying the quantified statistical relationships on an output device of the computing device.
- the method includes first performing a data reduction procedure of the phenotypic or behavioral feature data across the plurality of individuals.
- the method includes quantifying the statistical relationships between multi-dimensional neural feature data and the behavioral/phenotypic feature data such as to define axes in a multi-dimensional geometry, which can be used to inform prediction of functional impairment along specific behavioral/phenotypic and neural dimensions for a single individual or group of individuals.
- the method includes quantifying the statistical relationships between multi-dimensional neural feature data and the behavioral/phenotypic feature data such as to define axes in a multi-dimensional geometry, which can be used to predict specific phenotypic features of individual humans using the multi-dimensional neural feature data, irrespective of functional impairment.
- the method includes quantifying the statistical relationships between multi-dimensional neural feature data and the behavioral/phenotypic feature data such as to define axes in a multi-dimensional geometry, which can be used to predict specific neural features of individual humans using the multi-dimensional behavioral/phenotypic feature data, irrespective of functional impairment.
- the method includes predicting treatment outcome of specific individual humans in relation to variation along multi-dimensional behavioral/phenotypic or neural feature data.
- the method includes identifying optimal targets for treatment outcome for specific individual humans with variation along multi-dimensional phenotypic or neural feature data.
- the method includes predicting progression or change of behavioral/phenotypic or neural feature data over time.
- the individual data comprises phenotypic or behavioral characteristics for each individual in the plurality of individuals.
- the phenotypic or behavioral characteristics for each individual further comprise data regarding detailed assessment of complex behavioral or phenotypic features using one or more assessment instruments.
- the latent phenotypic or behavioral feature data for each individual further comprise data derived from the data reduction procedures using detailed assessment of complex behavioral or phenotypic features obtained from one or more assessment instruments for each individual in the plurality of individuals.
- the neural data comprise multiple areal/regional features such as voxels, areas, neural networks, electrodes from an electrophysiological recording device or other areal features of invasive or noninvasive imaging data for each individual in the plurality of individuals.
- the latent phenotypic or behavioral feature data represents behavior variations along a given latent dimension derived via a data reduction procedure.
- any independent individual for whom there is available detailed assessment of complex behavioral or phenotypic features obtained from one or more assessment instruments can be ‘projected’ as a point in the multi-dimensional latent feature space to obtain a ‘score’ along a given latent dimension derived via a data reduction procedure.
- neural data of the cerebral and/or cerebellar cortices are mapped to two-dimensional surfaces for each individual in the plurality of individuals, whereas subcortical neural data are mapped onto appropriate volumetric structures for each individual in the plurality of individuals, thus yielding a neural map.
- neural data are appropriately cleaned and de-noised prior to statistical quantification to improve the signal-to-noise ratio and to attenuate sources of spurious artefactual signal.
- neural data comprise regional summary measures derived from invasive or noninvasive methods across multiple neural areas.
- quantifying the statistical relationships of multi-dimensional neural-phenotypic data can be validated using statistical cross-validation procedures (for example, leave-one-out or k-fold) within and across independent data collection sites and samples.
- data regarding treatment outcome of individuals with variation along multi-dimensional phenotypic or neural feature data are collected over time either continuously or at discrete time points.
- phenotypic and neural data of the same individual human is collected at multiple time points via detailed assessment using one or more assessment instruments.
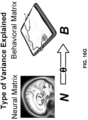
- FIG. 1 illustrates an example schematic of determining a treatment for a patient based on neuro-behavioral mapping, according to embodiments of the present disclosure.
- FIG. 2 A illustrates example table comprising examples of behavioral, clinical, cognitive, and demographic characteristics of patients and healthy control subjects (CON), according to embodiments of the present disclosure.
- FIG. 2 B illustrates an example diagram showing a cognitive paradigm deployed via computerized assessment for obtaining behavioral features, according to embodiments of the present disclosure.
- FIG. 2 C illustrates an example diagram showing an eye tracking deployment, an example of behavioral data collection, in a laboratory, clinic, or inside a scanner, according to embodiments of the present disclosure.
- FIGS. 3 A- 3 F illustrate example diagrams of the multi-dimensional behavioral variation of psychopathology and cognition, according to embodiments of the present disclosure.
- FIGS. 4 A- 4 F illustrate example diagrams showing distinct angles of the geometry of multi-dimensional behavioral variation, according to embodiments of the present disclosure.
- FIGS. 5 A- 5 K illustrate example diagrams showing k-Fold cross-validation for behavioral principal component analysis (PCA), according to embodiments of the present disclosure.
- FIGS. 6 A- 6 R illustrate example diagrams of evaluating site effects in behavioral PCA, according to embodiments of the present disclosure.
- FIGS. 7 A- 7 J illustrate example diagrams relating symptom axes to neural connectivity, according to embodiments of the present disclosure.
- FIGS. 8 A- 8 P illustrate example diagrams relating diagnostic categories and symptom axes to neural features, according to embodiments of the present disclosure.
- FIGS. 9 A- 9 D illustrate example diagrams showing between-group differences in functional connectivity of the frontoparietal control network (FPCN), according to embodiments of the present disclosure.
- FPCN frontoparietal control network
- FIGS. 10 A- 10 D illustrate examples of performing data-reduction on neural features, according to embodiments of the present disclosure.
- FIGS. 11 A- 11 F illustrate example diagrams showing the robustness of neural-behavioral mapping across individuals, according to embodiments of the present disclosure.
- FIGS. 12 A- 12 I illustrate example diagrams showing the use of independent component analysis (ICA) as an alternative method of dimensionality-reduction for behavioral data, according to embodiments of the present disclosure.
- ICA independent component analysis
- FIGS. 13 A- 13 J illustrate example diagrams showing canonical correlation analysis (CCA) of behavioral and neural features, according to embodiments of the present disclosure.
- CCA canonical correlation analysis
- FIGS. 14 A- 14 H illustrate example diagrams showing k-Fold cross-validation for establishing the neuro-behavioral geometry by means of canonical correlation analysis, according to embodiments of the present disclosure.
- FIGS. 15 A- 15 I illustrate example diagrams showing canonical correlation analysis (CCA) of behavioral and network-level neural features, according to embodiments of the present disclosure.
- CCA canonical correlation analysis
- FIGS. 16 A- 16 I illustrate example diagrams showing canonical correlation analysis (CCA) of behavioral and subcortical neural features, according to embodiments of the present disclosure.
- CCA canonical correlation analysis
- FIGS. 17 A- 17 T illustrate example diagrams showing the characterization of canonical variate symptom configurations, according to embodiments of the present disclosure.
- FIGS. 18 A- 18 E illustrate example diagrams showing the characterization of individual subject-specific “neuroprint” profiles of neural and behavioral geometry, according to embodiments of the present disclosure.
- FIGS. 19 A- 19 R illustrate example diagrams showing principal component analysis (PCA) of neural features in control and proband subjects, according to embodiments of the present disclosure.
- PCA principal component analysis
- FIGS. 20 A- 20 I illustrate example diagrams showing a process of using latent scores from the neuro-behavioral geometry to provide a therapeutic prognosis for a new individual.
- FIGS. 21 A- 21 S illustrate example diagrams showing correlation with gene expression maps, according to embodiments of the present disclosure.
- FIGS. 22 A- 22 G illustrate example pharmaceutical candidates for targeting specific neuroprints using gene expression maps, according to embodiments of the present disclosure.
- FIG. 23 illustrates example mapping of an exemplar neural feature in a sample of individuals without formal psychiatric diagnoses to delineate the boundaries of functional impairment, according to embodiments of the present disclosure.
- FIG. 24 illustrates an example flowchart diagram of a process by which a neuro-behavioral geometry may be derived from neural and behavioral features and used to determine, prognosticate, and/or forecast treatment response for a given individual, individual response to a specific treatment, individual neuro-behavioral mental status, and/or the quantitative proximity of individuals in the neuro-behavioral geometry according to embodiments of the present disclosure.
- FIG. 25 illustrates an example flowchart diagram of a process by which neural and behavioral features may be obtained in preparation for establishing a neuro-behavioral geometry.
- FIG. 27 illustrates an example flowchart diagram of a process by which neural and behavioral features are used to compute and establish neuro-behavioral geometry, according to embodiments of the present disclosure.
- FIG. 28 illustrates an example flowchart diagram of a process by which a neuro-behavioral geometry may be validated and quality-assured, according to embodiments of the present disclosure.
- FIG. 29 illustrates an example flowchart diagram of a process by which neural and behavioral latent group-level features may be related to candidate therapeutic targets and/or a neuro-behavioral mental status, according to embodiments of the present disclosure.
- FIG. 30 illustrates an example flowchart diagram of a process by which neural and/or behavioral features from an independent individual may be used to compute latent scores under the neuro-behavioral geometry, according to embodiments of the present disclosure.
- FIG. 31 illustrates an example flowchart diagram of a process by which neural and/or behavioral scores from an independent individual may be used to compute a similarity score with a neuro-behavioral mental status neural therapeutic target(s) of interest, according to embodiments of the present disclosure.
- FIG. 32 illustrates an example flowchart diagram of a process of determining, prognosticating, or forecasting individual response to a particular therapeutic, based on neuro-behavioral mapping, according to embodiments of the present disclosure.
- FIG. 33 illustrates an example flowchart diagram of a process of determining, prognosticating, or forecasting a therapeutic for an individual based on neuro-behavioral mapping, according to embodiments of the present disclosure.
- FIG. 35 illustrates an example flowchart diagram of a process of identifying individuals based on quantitative proximity in the neuro-behavioral geometry, according to embodiments of the present disclosure.
- FIG. 36 illustrates an example of a user interface for performing the steps of the invention, according to embodiments of the present disclosure.
- FIGS. 37 A- 37 C illustrate examples of outputs of the neuro-behavioral geometry from an exemplar user interface, according to embodiments of the present disclosure.
- FIG. 38 illustrates a block diagram of an example computer system that may be used to perform various aspects of the present disclosure.
- Embodiments of the present invention may be implemented in hardware, firmware, software, or any combination thereof. Embodiments of the present invention may also be implemented as instructions stored on a machine-readable medium, which may be read and executed by one or more processors.
- a machine-readable medium may include any mechanism for storing or transmitting information in a form readable by a machine (e.g., a computing device).
- a machine-readable medium may include read only memory (ROM); random access memory (RAM); magnetic disk storage media; optical storage media; flash memory devices; electrical, optical, acoustical or other forms of propagated signals (e.g., carrier waves, infrared signals, digital signals, etc.), and others.
- firmware, software, routines, instructions may be described herein as performing certain actions. However, it should be appreciated that such descriptions are merely for convenience and that such actions in fact result from computing devices, processors, controllers, or other devices executing the firmware, software, routines, instructions, etc.
- the term “projecting” or “projection” refers to the process of mapping a data point from one n-dimensional geometry to another by means of applying a mathematical transform.
- neural feature map or “brain feature map” or “neural data map” refers to an assignment of a numerical value to specific brain locations/regions from a given assessment or analysis, from neural data of a particular modality.
- neural features include, but are not limited to: functional connectivity (e.g. global brain connectivity, seed-based connectivity derived from blood oxygen level-dependent imaging functional magnetic resonance imaging (BOLD fMRT)); functional activation (e.g.
- behavioral measure refers to a quantitative measure of a behavioral phenotype.
- behavioral measures include, but are not limited to: assessments of symptom severity for a particular psychiatric disorder or domain of psychiatric disorders, either clinician-observed or self-reported (e.g. questionnaires, Positive and Negative Syndrome Scale (PANSS), Beck Depression Inventory (BDI)); assessments of cognitive ability (e.g. the Brief Assessment of Cognition in Schizophrenia (BACS) or Penn Matrix Test (PMAT)); quantitative assessments of task performance (e.g. accuracy or reaction time); physiological responses (e.g. eye movement, heart rate, galvanic skin response).
- assessments of symptom severity for a particular psychiatric disorder or domain of psychiatric disorders either clinician-observed or self-reported (e.g. questionnaires, Positive and Negative Syndrome Scale (PANSS), Beck Depression Inventory (BDI)); assessments of cognitive ability (e.g. the Brief Assessment of Cognition in Schizophrenia (BAC
- the term “behavioral feature profile” refers to a configuration of quantified behaviors.
- therapeutically relevant map refers to a map with spatial information regarding the potential efficacy of a therapeutic target(s) at each brain location.
- therapeutically relevant maps include, but are not limited to: neuropharmacological maps showing the neural response to a pharmacological intervention, such as ketamine; gene expression maps showing levels of expression of particular genes at each brain location; PET maps showing the binding of radioligands to specific neuroreceptors of interest (e.g. dopamine D2 receptors).
- mental health refers to an individual's psychological status, reflecting cognitive, behavioral, emotional states and traits. Examples of measures of mental health include but are not limited to: cognitive ability; mood; level of psychosis; and personality.
- predict/prediction refers to the process of computing a statistical inference for a measure or quantity, based on current information.
- the term “prognosticate/prognostication” refers to the prediction of diagnostic status and/or treatment response, based on current information.
- the term “forecast” refers to the process of computing a statistical inference for a measure or quantity for a time point in the future, based on current information.
- pre-existing mapping may be used synonymously with “neuro-behavioral mapping.”
- the term “latent” refers to a variable, and/or feature, and/or state, and/or statistical model, and/or geometry that may be directly observed and/or inferred and may reflects some composite weighted linear and/or non-linear score derived from the original neural and/or behavioral data.
- “latent” may be used synonymously with “weighted composite” and/or “manifest weighted composite”.
- neural-behavioral geometry refers to the derived mathematical solution that incorporates neural and behavioral features into a set of neural and behavioral latent and/or manifest weighted composite variables derived from a plurality of individuals.
- the term “latent neural feature map” refers to a map of neural information wherein the neural information comprises neural data mathematically transformed with respect to the neuro-behavioral geometry.
- the term “latent behavioral feature profile” refers to a configuration of behavioral information wherein the behavioral information comprises behavioral data mathematically transformed with respect to the neuro-behavioral geometry.
- the term “latent neural score” refers to the computed or predicted neural measure for an individual's representation in the neuro-behavioral geometry.
- the term “latent behavioral score” refers to the computed or predicted behavioral measure for an individual's representation in the neuro-behavioral geometry.
- neural status refers to an individual's neural condition. Neural status may comprise states or traits of an individual's neural system. Examples of measures of neural status include but are not limited to: degree of synchrony of specific neural circuits, myelin content, volume of neural structures, cortical thickness, functional coupling of specific neural regions.
- therapeutic refers to the process of affecting clinical status.
- measures of therapeutics include, but are not limited to, pharmaceutical agents, cognitive behavioral therapy, deep brain stimulation.
- treating or “treatment” or “therapy” refer to partially or completely alleviating, ameliorating, improving, relieving, delaying onset of, inhibiting progression of, reducing severity of, reducing incidence of one or more symptoms or features of disease, or any combination thereof.
- the term “treatment” refers to countering the effects caused as a result of the disease or pathological condition of interest in a subject including (i) inhibiting the progress of the disease or pathological condition, in other words, slowing or stopping the development or progression thereof, or one or more symptoms of such disorder or condition; (ii) relieving the disease or pathological condition, in other words, causing said disease or pathological condition, or the symptoms thereof, to regress; (iii) stabilizing the disease or pathological condition or one or more symptoms of such disorder or condition, (iv) reversing the disease or pathological condition or one or more symptoms of such disorder or condition to a normal state, (v) preventing the disease or pathological condition or one or more symptoms of such disorder or condition, and (vi) any combination thereof.
- the term “treatment” may refer to the general process of receiving a therapeutic.
- the term “preventing” refers to partially or completely delaying onset of an disease, disorder and/or condition; partially or completely delaying onset of one or more symptoms, features, or clinical manifestations of a particular disease, disorder, and/or condition; partially or completely delaying onset of one or more symptoms, features, or manifestations of a particular disease, disorder, and/or condition; partially or completely delaying progression from a particular disease, disorder and/or condition; and/or decreasing the risk of developing pathology associated with the disease, disorder, and/or condition.
- the term “effective amount” is that amount sufficient to effect beneficial or desired results.
- the beneficial or desired results are, for example, clinical results, and, as such, an “effective amount” depends upon the context in which it is being applied.
- the term “effective amount” can be used interchangeably with “effective dose,” “therapeutically effective amount,” or “therapeutically effective dose.”
- FIG. 1 illustrates an example schematic of determining a treatment for a patient based on neuro-behavioral mapping, according to embodiments of the present disclosure.
- FIG. 1 shows a high-level overview of N-BRIDGE, illustrating how behavioral data and/or neural data is obtained from a plurality of individuals, such as by imaging modalities (e.g., MM, EEG, MEG, or the like) or behavioral assessment (e.g., behaviors identified via computer tests administered to patients by clinicians, behaviors obtained by observation by an individual, measurements corresponding to behaviors a patient exhibits or reports to a doctor, or the like) and utilized for generating a neural-behavioral multi-dimensional geometry mapping.
- imaging modalities e.g., MM, EEG, MEG, or the like
- behavioral assessment e.g., behaviors identified via computer tests administered to patients by clinicians, behaviors obtained by observation by an individual, measurements corresponding to behaviors a patient exhibits or reports to a doctor, or the like
- behavioral data and/or neural data may undergo processing, transformation, and analysis steps, as will be described further below, prior to mapping and validation of a neuro-behavioral geometry.
- the resulting neural-behavioral multi-dimensional geometry mapping may ultimately be used to determine therapeutics associated with distinct neural/behavioral features, predict treatments for patients, and generate recommendations for treating patients.
- Described herein are a series of data-driven methods, in which independent behavioral dimensions have been identified that map to specific neural circuits in a public dataset of 436 psychosis-spectrum patients, including 150 individuals with a formal diagnosis of bipolar disorder with psychosis (BPP), 119 individuals with a formal diagnosis of schizoaffective disorder (SADP), and 167 individuals with a formal diagnosis of schizophrenia (SZP) and 202 healthy control subjects without a diagnosis or history of psychiatric illness. Additionally, the generalizability of the present disclosure is demonstrated with an independent public dataset of 339 young adults without a diagnosis of psychiatric illness.
- FIG. 2 A illustrates an example table comprising examples of relevant behavioral, clinical, cognitive, and demographic characteristics of patients (PROB, all proband patients) and healthy control subjects (HCS), according to embodiments of the present disclosure.
- FIG. 2 A illustrates an example table with behavioral data comprising demographic characteristics, symptom scores, and cognitive performance collected via rating scales, questionnaires, and clinician impression.
- B-SNIP Bipolar-Schizophrenia Network for Intermediate Phenotypes
- NDA National Institutes of Mental Health Data Archive
- PCA principal component analysis
- a patient or a doctor may utilize a user interface of a computing device to provide behavioral data corresponding to the patient.
- the behavioral data may include any measurements corresponding to behaviors a patient exhibits or reports to a doctor.
- behavioral data may be obtained by observation of the patient by an individual (e.g., doctor, medical assistant, or the like) or by selection of answers to questions on a computing device.
- a clinician may ask a patient a series of open-ended questions and provide the patient with rating levels to identify the severity of a condition for each question.
- the patient may provide answers to the questions, in which the answers include rating levels selected by the patient.
- a patient may be given a test (e.g., a test on a computer or a test administered by a clinician) to measure the patient's short-term and long-term memory abilities, such as by asking the patient to recall various numbers or names over time.
- a clinician may ask a patient a series of questions regarding behaviors, such as how often a patient smokes each day, how many alcoholic beverages a patient drinks, and the like.
- FIG. 2 B illustrates an example diagram showing a cognitive paradigm deployed via computerized assessment for obtaining behavioral features, according to embodiments of the present disclosure.
- a patient may utilize a user interface of a computing device for a computerized cognitive assessment to measure cognitive processes, such as memory, attention, problem solving, decision making, and the like.
- a questionnaire-based assessment to assess a patient's mental health or cognitive status may be implemented on a computing device, a tablet, a mobile device, or the like.
- a computing device may present a plurality of questions to a user (e.g., an individual, a patient, or a clinician) on a display of the computing device, and the computing device may receive one or more answers to the series of questions via a user interface of the computing device.
- the one or more answers may be selected by the user via the user interface of the computing device.
- FIG. 2 C illustrates an example diagram showing an eye tracking deployment in a laboratory, clinic, or inside a scanner, according to embodiments of a present disclosure.
- an infrared illuminator may be utilized to measure eye movements of a patient over time, while using a computing device or while in a scanning device.
- the eye movement or eye tracking measurements may be useful in providing insight and useful data for measuring cognitive processes of the patient.
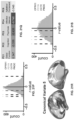
- FIGS. 3 A- 3 F illustrates example diagrams of behavioral variation of psychopathy and cognition, according to embodiments of the present disclosure.
- the first five PCs (green) were determined to be significant using a permutation test. Inset shows the proportion of variance both accounted and not accounted for by the five significant PCs. Together, these five PCs capture 50.93% of the total variance in behavior in the sample.
- these axes are not parallel to the axes of traditional clinical symptom dimensions that are derived from pre-existing clinical scales used in psychiatry, and do not reflect DSM-defined categorical diagnostic boundaries (See FIG. 3 F and FIG. 4 ).
- FIGS. 4 A- 4 F illustrates example diagrams showing distinct angles of the geometry of symptom variation, according to embodiments of the present disclosure.
- FIGS. 4 A- 4 F show alternative views of the tri-plot in the diagram of FIG. 3 G , showing the relationship between the three principal axes of variation in behavior and standard clinical symptom factors. Each point represents an individual subject projected into the principal component (PC) space.
- FIGS. 4 D- 4 F show alternative views of the tri-plot in diagrams of FIGS. 4 A- 4 C , where each sphere represents the mean of each a priori clinical group.
- using these behavioral dimensions allows for prediction of how individual subjects in a left-out sample fit into the geometry with a high degree of accuracy (e.g., FIGS. 5 and 6 ).
- FIGS. 5 A- 5 K illustrate example diagrams showing k-Fold cross-validation for behavioral principal component analysis (PCA), according to embodiments of the present disclosure.
- FIGS. 5 A- 5 K illustrate the results from a 5-fold cross-validation analysis to test the stability of the PCA solution. Subjects were first randomly assigned to one of 5 subsets. Each subset of subjects was then used as an independent ‘test sample’ in a PCA that was derived from the other 4 subsets.
- FIGS. 5 A- 5 K are described as the following:
- FIGS. 5 A- 5 E illustrate the results from a 5-fold cross-validation analysis to test the stability of the PCA solution. Subjects were first randomly assigned to one of 5 subsets.
- Each point in the scatterplot represents the GBC value of a single parcel for a single subject.
- a regression of parcel GBC against all 5 PC scores was computed in a subset of 349 subjects.
- the parcel GBC for each of the remaining 87 subjects in the left-out sample was predicted using this multiple regression model.
- FIGS. 6 A- 6 R illustrates example diagrams of evaluating site effects in behavioral PCA, according to embodiments of the present disclosure.
- FIGS. 6 A- 6 R are described as the following: (a) Proportion of variance explained by each of the PCs in a PCA of all 36 behavioral measures, excluding one of the six sites at which data was collected. The number of significant PCs determined via a permutation test and the total proportion of variance explained by these PCs are all comparable to a full model (shown in FIGS. 3 A- 3 F ). (b) To obtain a ‘predicted’ PC score for the 46 subjects in the excluded site, the loadings from the model obtained from the other 390 subjects were used. The ‘observed’ PC scores are the scores from the full model of the same 88 subjects.
- variation along the identified behavioral dimensions relate to variation in specific neural circuits. These robust relationships between brain and behavior are not observed using traditional diagnostic groups or symptom categories ( FIGS. 7 A- 7 J ).
- the ability to map distinct neural circuitry underlying data-driven behavioral variation has not been demonstrated with previous frameworks.
- One such example of neural-behavioral mapping in the disclosed geometry is demonstrated using an unbiased data-driven measure that quantifies the relationships between spontaneous fluctuations of the blood-oxygenation-level-dependent (BOLD) signal from any one region (i.e. functional connectivity), termed global brain connectivity (GB C)[8],[9],[10].
- GBC can be calculated by computing the average strength of the statistical relationship between a given voxel (or area) and all other voxels (or areas) and is therefore unbiased as to the location of a possible alteration in connectivity (i.e. it is data-driven). Consequently, GBC maps can be computed for each individual subject and yield an area neural map provide a fully unbiased and data-driven validation of the variation along the PCA-derived behavioral/phenotype geometry ( FIGS. 7 A- 7 J ).
- FIGS. 7 A- 7 J illustrates example diagrams relating symptom/behavior axes to neural connectivity, according to embodiments of the present disclosure.
- GBC global brain connectivity
- the sigmoidal distribution of the PC3 vs Negative map indicates an improvement in statistics of the PC map.
- FIGS. 8 A- 8 P illustrate example diagrams relating diagnostic categories and symptom axes to neural features, according to embodiments of the present disclosure.
- FIGS. 8 A- 8 P are described as the following: Z-scored map of a t-test for the difference in group mean GBC between traditional diagnostic patient groups: (a) all probands (PRB) versus all healthy controls (CON); (b) patients with bipolar disorder (BPP) versus healthy controls (CON); (c) patients with schizophrenia (SZP) versus healthy controls (CON); (d) patients with schizoaffective disorder (SADP) versus healthy controls (CON).
- PRB probands
- BPP bipolar disorder
- SZP schizophrenia
- SADP schizoaffective disorder
- FIGS. 9 A- 9 D show one example of a neural characteristic that is distinctly different between individuals with and without a psychosis-spectrum diagnosis.
- Previous studies have shown that schizophrenia-associated disruptions in functional connectivity are most pronounced in higher order associative regions of the brain, such as those of the fronto-parietal control network (FPCN) implicated in higher-order executive functioning.
- FPCN fronto-parietal control network
- this affected neural circuit is similarly disrupted in all psychosis spectrum disorder patients irrespective of the specific diagnosis, suggesting that it is a marker of a categorical distinction between healthy individuals and those with psychosis, which may serve as a solid categorical classifier.
- a classifier no matter how many features it included, would be unable to detect multi-dimensional variation along dimensions of latent and/or manifest weighted composite features in both behavioral and neural spaces.
- the N-BRIDGE framework therefore provides a unified mapping between the multi-dimensional geometry of data-driven behavioral variation and the multi-dimensional geometry of data-driven neural variation.
- FIGS. 9 A- 9 D illustrate example diagrams showing between-group differences in functional connectivity of the fronto-parietal control network (FPCN), according to embodiments of the present disclosure.
- the FPCN seed was defined using a well-validated functional parcellation derived from an independent dataset of 1,000 individuals[11].
- FIGS. 10 A- 10 D illustrate examples of performing data-reduction on neural features, according to embodiments of the present disclosure.
- FIGS. 10 A- 10 D are described as the following: (a) Example analysis of behavioral data with complete, unreduced high-dimensional neural data (in this example, regression of a behavioral score on to a neural map with over 90,000 features). (b) Map of data from (a) parcellated after performing analysis. (c) Example of the same analysis performed on the same neural data, where neural features which were first dimension-reduced using a neurobiologically-based parcellation.
- FIGS. 11 A- 11 F illustrate example diagrams showing the robustness of neural-behavioral mapping in psychosis spectrum individuals, according to embodiments of the present disclosure.
- PC Principal Component
- FIGS. 12 A- 12 I illustrate example diagrams showing the use of independent component analysis (ICA) as an alternative method of dimensionality-reduction for behavioral data.
- FIGS. 12 A- 12 I are described as the following: (a) Screeplot showing the total proportion of variance explained by each independent component (IC) in a five-component solution. performed across all 36 behavioral measures in 436 patients. The size of each point is proportional to the variance explained by that IC. (b) Pie chart shows the proportion of variance both accounted and not accounted for by the five ICs. Together, these five ICs capture 52.77% of the total variance in behavior in the sample. (c) Correlation matrix showing correlations of individual subject scores for the 5 significant principal components (PCs) from the PCA solution shown in FIGS.
- PCs principal principal components
- the present disclosure additionally demonstrates the utility of mapping data-derived behavioral dimensions to neural circuitry by using canonical correlation analysis (CCA), a multivariate data-driven approach to characterizing the relationships between two sets of multi-dimensional variables.
- CCA canonical correlation analysis
- CCA examines simultaneously the relationships between multiple independent variables and multiple dependent variables by identifying linear combinations of each variable set that maximizes the correlations between the two sets, making it a powerful statistical technique for studying the many-to-many geometry mapping between neural and behavioral features.
- FIG. 13 A The application of the CCA process in the present disclosure is illustrated in FIG. 13 A .
- results of a CCA performed between neural features and all 36 behavioral measures are compared with a CCA performed between neural features and scores along the 5 identified data-driven behavioral PC dimensions across all patients.
- the neural features used in both CCAs are the mean GBC averaged within each of 180 cortical parcel s[12]. Results demonstrate that a comparable amount of behavioral variance in the PCs can be explained ( FIG. 13 J ) despite having far fewer features than the full set of behavioral measures ( FIG. 13 I ).
- FIGS. 13 A- 13 J illustrate example diagrams showing canonical correlation analysis (CCA) of behavioral and neural features, according to embodiments of the present disclosure.
- FIGS. 13 A- 13 J are described as the following: (a) Conceptual illustration of the CCA process.
- CCA maximizes the correlation between linear combinations of two sets of variables (in this case, a matrix B of behavioral measures and a matrix N of neural measures for each subject).
- CCA solves for transformation matrices ⁇ and ⁇ such that the correlations between the linearly transformed ‘latent’ matrices U and V are maximal.
- Each row in U and V is known as a canonical variate; each corresponding pair of canonical variates (e.g. U 1 and V 1 ) is referred to as a canonical mode.
- the canonical modes are independent from each other; the correlation between each subsequent pair of variates is computed from the residuals of the previous pair.
- the correlation between the neural data N and the transformed behavioral data matrix B ⁇ reflects the amount of variance in N that can be explained by behavioral canonical variates V.
- Screeplot showing the proportion of neural variance explained by each of the behavioral canonical variates in a CCA performed between 180 neural features (symmetrized cortical parcel GBC) and all 36 behavioral measures. Dashed black line shows the null calculated via a permutation test with 5000 shuffles; grey bars show 95% confidence interval. Inset shows the total proportion of neural variance explained by the behavioral variates.
- Inset shows the total proportion of behavioral variance explained by the neural variates.
- the multi-dimensional neural feature information contains substantially more predictive power for the variation of the multi-dimensional behavioral/phenotype features. This is important because to optimize the prediction for any independent individual human, both neural and behavioral feature data should be used concurrently to first map the multi-dimensional neural-behavioral geometry and then use it to project both neural and behavioral data for any independent individual along the defined axes.
- FIGS. 14 A- 14 H illustrate example diagrams showing k-fold cross-validation for establishing the neuro-behavioral geometry by means of canonical correlation analysis, according to embodiments of the present disclosure.
- FIGS. 14 A- 14 H are described as the following:
- FIGS. 15 A- 15 I illustrate example diagrams showing canonical correlation analysis (CCA) of behavioral and network-level neural features, according to embodiments of the present disclosure.
- FIGS. 15 A- 15 I are described as the following: (a) The correlations between the transformed latent matrices U and V are maximized.
- U is a linear composite of behavioral data matrix B scaled by the weights in ⁇ ; similarly, V 1 is the linear composite of N transformed by ⁇ .
- each row in U and V is known as a canonical variate; each corresponding pair of canonical variates (e.g. U 1 and V 1 ) is referred to as a canonical mode.
- FIGS. 16 A- 16 I illustrate example diagrams showing canonical correlation analysis (CCA) of behavioral and subcortical neural features, according to embodiments of the present disclosure.
- FIGS. 16 A- 16 I are described as the following: (a) The correlations between the transformed latent matrices U and V are maximized.
- U is a linear composite of behavioral data matrix B scaled by the weights in ⁇ ; similarly, V 1 is the linear composite of N transformed by ⁇ .
- each row in U and V is known as a canonical variate; each corresponding pair of canonical variates (e.g. U 1 and V 1 ) is referred to as a canonical mode.
- Dashed black line shows the null calculated via a permutation test with 5000 shuffles; grey bars show 95% confidence interval.
- Inset shows the total proportion of behavioral variance explained by the neural variates.
- FIGS. 17 A- 17 T illustrate example diagrams showing the characterization of canonical variate symptom configurations, according to embodiments of the present disclosure.
- FIGS. 17 A- 17 T are described as the following: (a) Distributions of scores for the first canonical variate (CV1) by diagnostic group (white: controls; black: all patients; yellow: bipolar disorder with psychosis; orange: schizoaffective disorder with psychosis; red: schizophrenia). All scores are normalized to controls. (b) Behavioral canonical factor loadings for CV1. (c) Weights of the original behavioral items for CV1. (d) Neural canonical factor loadings for CV1. (e-t) Similar analyses shown for canonical variates 2-5.
- FIGS. 18 A- 18 E illustrate example diagrams showing the characterization of individual subject-specific “neuroprint” profiles of neural and behavioral geometry, according to embodiments of the present disclosure.
- FIGS. 18 A- 18 E are described as the following: (a) Neural features (cortical GBC, demeaned relative to all patients) from an exemplar individual subject, “Adrian”. (b) Neural features (cortical GBC, demeaned relative to all patients) from another exemplar subject, “Alex”. Note the differences in neural features between Alex and Adrian, which is also reflected in the differences in the behavioral profile of the two subjects. (c) Individual behavioral loading (behavioral principal components and canonical variates) profile for subject Adrian. (d) Individual behavioral loading profile for subject Alex.
- FIGS. 19 A- 19 R illustrate example diagrams showing principal component analysis (PCA) of neural features in control and proband subjects, according to embodiments of the present disclosure.
- PC principal component analysis
- the second and third PCs are also similar between control and proband subjects.
- the fourth PC is markedly dissimilar between control and proband subjects, suggesting that this component may reflect neural variance which deviates in individuals with psychiatric symptoms.
- the fifth PC is also highly dissimilar between controls and probands, also possibly reflecting diagnosis-relevant differences in neural variance.
- Screeplot showing the total proportion of variance explained by the first 100 PCs from the PCA performed across all 718 neural features in 202 control subjects. The size of each point is proportional to the variance explained by that PC.
- the first 8 PCs (green) were determined to be significant using a permutation test. Inset shows the proportion of variance both accounted and not accounted for by the 8 significant PCs.
- the mapping identified using the disclosed neuro-behavioral framework ultimately yields a neural map that can define a set of neural features (e.g. areas, circuits, systems, etc.), which can then be mapped to specific additional neural features with spatial information.
- An example here is neuropharmacological maps derived from administering an agent of known molecular mechanism, such as ketamine.
- FIGS. 20 A- 20 I illustrate example diagrams showing a process of using latent scores from the neuro-behavioral geometry to provide a therapeutic prognosis for a new individual.
- FIGS. 20 A- 20 I show an exemplar process by which the neuro-behavioral prediction can be validated and are described as follows: (a) First, the CCA was performed in all available subjects. This is referred to as the “full CCA”. Next, a training set of 90% of these subjects was randomly selected, and a CCA was performed in this training set (“training CCA”). A simple regression was performed between training set neural scores and training set behavioral scores, to derive a weight for prediction in panel C. The remaining 10% of left-out subjects comprised the test set.
- Neural features are used to compute latent neural scores, per the established neuro-behavioral geometry.
- the ‘observed’ latent neural scores for the test set are the scores obtained for those subjects from the full CCA.
- Behavioral latent scores for test set subjects were computed from behavioral data using weights from the training CCA. These behavioral latent scores were then used to predict the latent neural scores using the simple regression from the training set, without leveraging neural data from the test set.
- the regression here was performed solely to derive a weight in order to demonstrate that the behavioral CCA score is predictive of the neural CCA score and is not a step or in place of the CCA.
- the ‘predicted’ neural latent scores are computed by using the test subjects' behavioral data and the weight matrix derived from the training CCA.
- Predicted latent neural scores are highly similar to observed neural scores computed from neural data. The correlation accuracy is ⁇ 0.7.
- a therapeutically relevant map for example a map of the change in neural GBC pre- and post-ketamine infusion, can be used to provide a direct link to molecular mechanisms which affect neural circuits in the same manner as one or more of the group neural feature maps (e.g. CV3 neural map in panel (g).)
- the neural latent scores can be using to identify subjects which are most similar to particular neuro-behavioral profile, for example CV3.
- the predicted neural latent scores of an individual from a fully independent dataset are shown relative to the distribution of neural latent scores for all original subjects used to derive the geometry.
- the framework would predict that the subject in (i), who is highly similar to CV3 and therefore ketamine intervention, would respond to glutamatergic agonism.
- AHBA Allen Human Brain Atlas
- a group-level map for each gene was computed by averaging its Z-scored expression level per parcel across all subjects[14].
- These parcellated gene expression maps can then be compared with the neural maps identified from the disclosed neuro-behavioral geometry.
- such a mapping can allow identification of molecular targets for specific axes of variation in the overall multi-dimensional phenotype-neural geometry, which can reveal therapeutic targets otherwise invisible to prior approaches that fail to consider the optimally derived multi-dimensional phenotype-neural geometry (e.g. such as the DSM, RDoC or using pre-existing single or multiple clinical scales).
- FIGS. 21 A- 21 S show the expression maps for these four genes—a high positive value indicates a high expression of the gene in that cortical parcel.
- Canonical Variate 4 is highly correlated with behavioral PC1 and PC2 (Global Functioning and Cognition) but not PC3, PC4, or PC5 ( FIG. 21 N ), indicating that the neural map shown in FIG.
- FIG. 21 O is associated with high functioning and high cognitive performance and low psychosis and mood deficits.
- This neural map is highly anti-correlated with cortical expression of the PNOC gene ( FIG. 21 P , purple dashed line; note that this gene is close to the tail end of the correlation distribution), suggesting that the expression pattern of PNOC in FIG. 21 D is related to poor cognitive performance and poor functioning.
- this mapping provides the indication that targeting the regulation of PNOC-related ligands may treat cognitive deficits and in turn improve global function.
- genetic and molecular targets that are associated with specific dimensions of behavioral variation may be identified, along with the development of pharmaceutical agents that may address deficits along axes that maximally capture multi-dimensional phenotype-neural geometry.
- FIGS. 21 A- 21 S illustrate example diagrams showing spatial relationships with gene expression maps, according to embodiments of the present disclosure.
- FIGS. 21 A- 21 S are described as the following: (a) Cortical expression of the OPRK1 gene from the Allen Human Brain Atlas (AHBA). Values indicate Z-scored expression levels; a high positive value indicates high expression of OPRK1 in that region. (b-d) Cortical expression of the PDYN, OXTR, and PNOC genes. (e) Correlation between each of the 5 behavioral PCs and the first behavioral canonical variate (CV). These values reflect the proportion of variance in the behavioral data extracted by CV1. For example, the high positive correlation with PC5 indicates that this CV accounts for most of the variance in the Agitation/Excitement behavioral measures.
- AHBA Allen Human Brain Atlas
- FIGS. 22 A- 22 G illustrate example pharmaceutical candidates for targeting specific neuroprints using gene expression maps, according to embodiments of the present disclosure.
- FIGS. 22 A- 22 G are described as the following: (a) Distribution of correlation values between the CV3 neural loading map and the expression maps of 16,088 genes from the AHBA dataset. The position of 7 genes of interest shown in b-d are highlighted. Note for example that the expression pattern of GABRA3 (purple dashed line) is at the tail end of the distribution, and is highly anti-correlated with the neural map of CV3. The CV3 neuroprint, including the canonical symptom profile and associated loading map, is shown at left.
- the CV3 map again has the highest value, indicating that it is highly correlated and highly anti-correlated with a larger number of gene expression maps and may thus provide superior and more easily resolvable mapping to gene expression patterns.
- FIG. 23 illustrates mapping of an exemplar neural feature in a sample of individuals without formal psychiatric diagnoses obtained from the publicly available Human Connectome Project dataset. These results delineate the concept of defining boundaries of functional impairment, according to embodiments of the present disclosure.
- FIG. 23 is described as the following: example distributions of parcel GBC from an independent sample of 339 young adults without a diagnosis of psychiatric illness, in 180 parcels of the right cerebral cortex. Each density plot shows the distribution of GBC for a particular parcel across all 339 individuals (i.e. a summary measure of functional connectivity for a particular region of the brain). Dotted grey line shows the mean GBC across all 339 subjects for each parcel; solid black line shows the zero-line for all parcels.
- the distributions of a neural feature for particular neural regions can be quantified in individuals with and without functional and/or behavioral/phenotypic impairment and used to inform quantitative prediction of neural functional and/or behavioral/phenotypic impairment along axes that maximally capture multi-dimensional phenotype-neural geometry.
- Such a prediction for a specific individual can be quantified by independently obtaining either the neural feature data or the relevant behavioral/phenotypic data, which can then be projected into the axes of the predefined multi-dimensional phenotype-neural geometry.
- FIG. 24 illustrates an example flowchart diagram of a process 200 by which a neuro-behavioral geometry may be derived from neural and behavioral features and used to determine, prognosticate, and/or forecast treatment response for a given individual, individual response to a specific treatment, individual neuro-behavioral mental status, and/or the quantitative proximity of individuals in the neuro-behavioral geometry according to embodiments of the present disclosure.
- FIG. 25 illustrates an example flowchart diagram of a process 300 by which neural and behavioral features may be obtained in preparation for establishing a neuro-behavioral geometry.
- FIG. 26 illustrates an example flowchart diagram of a process 400 by which neural features may be processed and prepared for use in a neuro-behavioral geometry, according to embodiments of the present disclosure.
- FIG. 27 illustrates an example flowchart diagram of a process 500 by which neural and behavioral features are used to compute and establish neuro-behavioral geometry, according to embodiments of the present disclosure.
- FIG. 28 illustrates an example flowchart diagram of a process 600 by which a neuro-behavioral geometry may be validated and quality-assured, according to embodiments of the present disclosure.
- FIG. 29 illustrates an example flowchart diagram of a process 700 by which neural and behavioral latent group-level features may be related to candidate therapeutic targets and/or a neuro-behavioral mental status, according to embodiments of the present disclosure.
- FIG. 30 illustrates an example flowchart diagram of a process 800 by which neural and/or behavioral features from an independent individual may be used to compute latent scores under the neuro-behavioral geometry, according to embodiments of the present disclosure.
- FIG. 31 illustrates an example flowchart diagram of a process 900 by which neural and/or behavioral scores from an independent individual may be used to compute a similarity score with a neuro-behavioral mental status neural therapeutic target(s) of interest, according to embodiments of the present disclosure.
- FIG. 32 illustrates an example flowchart diagram of a process 1000 of determining, prognosticating, or forecasting individual response to a particular therapeutic, based on neuro-behavioral mapping, according to embodiments of the present disclosure.
- FIG. 33 illustrates an example flowchart diagram of a process 1100 of determining, prognosticating, or forecasting a therapeutic for an individual based on neuro-behavioral mapping, according to embodiments of the present disclosure.
- FIG. 34 illustrates an example flowchart diagram of a process 1200 of determining, prognosticating, or forecasting a mental health status for an individual based on neuro-behavioral mapping, according to embodiments of the present disclosure.
- FIG. 35 illustrates an example flowchart diagram of a process 1300 of identifying individuals based on quantitative proximity in the neuro-behavioral geometry, according to embodiments of the present disclosure.
- FIG. 36 illustrates an example of a user interface for performing the steps of the invention, according to embodiments of the present disclosure.
- FIGS. 37 A- 37 C illustrate examples of outputs of the neuro-behavioral geometry from an exemplar user interface, according to embodiments of the present disclosure.
- FIG. 37 A illustrates an example summary quality assurance report for a derived neuro-behavioral latent variable.
- FIG. 37 B illustrates an example graph showing a range of scores of randomized ‘surrogate’ unit vector symptom profiles versus a derived neuro-behavioral latent variable.
- FIG. 37 C illustrates example graphs of unit-variance normalized distributions of derived neuro-behavioral latent variables versus a priori input clinical scales.
- FIGS. 1 - 35 as described herein are illustrative examples allowing an explanation of the present invention. It should be understood that embodiments of the present invention could be implemented in hardware, firmware, software, or a combination thereof. In such an embodiment, the various components and steps would be implemented in hardware, firmware, and/or software to perform the functions of the present invention. That is, the same piece of hardware, firmware, or module of software could perform one or more of the illustrated blocks (i.e., components or steps).
- the present invention can be implemented in one or more computer systems capable of carrying out the functionality described herein.
- FIG. 38 an example computer system 3800 useful in implementing the present invention is shown.
- Various embodiments of the invention are described in terms of this example computer system 3800 . After reading this description, it will become apparent to one skilled in the relevant art(s) how to implement the invention using other computer systems and/or computer architectures.
- Computer system 3800 includes one or more processors, such as processor 3804 .
- Processor 3804 can be a special purpose or a general purpose digital signal processor.
- Processor 3804 is connected to a communication infrastructure 3802 (for example, a bus or network).
- a communication infrastructure 3802 for example, a bus or network.
- Computer system 3800 also includes a main memory 3806 , preferably random access memory (RAM), and may also include a secondary memory 3808 .
- Secondary memory 3808 may include, for example, a hard disk drive 3810 and/or a removable storage drive 3812 , representing a floppy disk drive, a magnetic tape drive, an optical disk drive, solid-state disk, or the like.
- Removable storage drive 3812 reads from and/or writes to a removable storage unit 3816 in a well-known manner.
- Removable storage unit 3816 represents a floppy disk, magnetic tape, optical disk, solid-state disk, or the like, which is read by and written to by removable storage drive 3812 .
- removable storage unit 3816 includes a computer usable storage medium having stored therein computer software and/or data.
- secondary memory 3808 may include other similar means for allowing computer programs or other instructions to be loaded into computer system 3800 .
- Such means may include, for example, a removable storage unit 3818 and an interface 3814 .
- Examples of such means may include a program cartridge and cartridge interface (such as that found in video game devices), a removable memory chip (such as an EPROM, or PROM) and associated socket, a thumb drive and USB port, and other removable storage units 3818 and interfaces 3814 which allow software and data to be transferred from removable storage unit 3818 to computer system 3800 .
- Computer system 3800 may also include a communications interface 3820 .
- Communications interface 3820 allows software and data to be transferred between computer system 3800 and external devices. Examples of communications interface 3820 may include a modem, a network interface (such as an Ethernet card), a communications port, a PCMCIA slot and card, etc.
- Software and data transferred via communications interface 3820 are in the form of signals which may be electronic, electromagnetic, optical, or other signals capable of being received by communications interface 3820 . These signals are provided to communications interface 3820 via a communications path 3822 .
- Communications path 3822 carries signals and may be implemented using wire or cable, fiber optics, a phone line, a cellular phone link, an RF link and other communications channels.
- computer program medium and “computer readable medium” are used to generally refer to tangible storage media such as removable storage units 3816 and 3818 or a hard disk installed in hard disk drive 3810 . These computer program products are means for providing software to computer system 3800 .
- Computer programs are stored in main memory 3806 and/or secondary memory 3808 . Computer programs may also be received via communications interface 3820 . Such computer programs, when executed, enable the computer system 3800 to implement the present disclosure as discussed herein. In particular, the computer programs, when executed, enable processor 3804 to implement the processes of the present disclosure, such as any of the methods described herein. Accordingly, such computer programs represent controllers of the computer system 3800 . Where the disclosure is implemented using software, the software may be stored in a computer program product and loaded into computer system 3800 using removable storage drive 3812 , interface 3814 , or communications interface 3820 .
- features of the disclosure are implemented primarily in hardware using, for example, hardware components such as application-specific integrated circuits (ASICs) and gate arrays.
- ASICs application-specific integrated circuits
- gate arrays gate arrays
Landscapes
- Health & Medical Sciences (AREA)
- Engineering & Computer Science (AREA)
- Life Sciences & Earth Sciences (AREA)
- Biomedical Technology (AREA)
- Public Health (AREA)
- Medical Informatics (AREA)
- General Health & Medical Sciences (AREA)
- Psychiatry (AREA)
- Physics & Mathematics (AREA)
- Pathology (AREA)
- Epidemiology (AREA)
- Primary Health Care (AREA)
- Surgery (AREA)
- Veterinary Medicine (AREA)
- Animal Behavior & Ethology (AREA)
- Heart & Thoracic Surgery (AREA)
- Molecular Biology (AREA)
- Biophysics (AREA)
- Artificial Intelligence (AREA)
- Hospice & Palliative Care (AREA)
- Psychology (AREA)
- Developmental Disabilities (AREA)
- Child & Adolescent Psychology (AREA)
- Social Psychology (AREA)
- Computer Vision & Pattern Recognition (AREA)
- Signal Processing (AREA)
- Physiology (AREA)
- Mathematical Physics (AREA)
- Educational Technology (AREA)
- Data Mining & Analysis (AREA)
- Databases & Information Systems (AREA)
- Evolutionary Computation (AREA)
- Fuzzy Systems (AREA)
- General Business, Economics & Management (AREA)
- Business, Economics & Management (AREA)
- Medical Treatment And Welfare Office Work (AREA)
- Nuclear Medicine, Radiotherapy & Molecular Imaging (AREA)
- High Energy & Nuclear Physics (AREA)
- Radiology & Medical Imaging (AREA)
- Magnetic Resonance Imaging Apparatus (AREA)
Abstract
Description
- 1. Seeman, P. & Lee, T. Antipsychotic drugs: direct correlation between clinical potency and presynaptic action on dopamine neurons. Science 188, 1217-1219 (1975).
- 2. American Psychiatric Association. Diagnostic and Statistical Manual of Mental Disorders, 5th Edition: DSM-5. (American Psychiatric Publishing, Arlington, VA, 2013).
- 3. Anticevic, A., et al. Characterizing thalamo-cortical disturbances in schizophrenia and bipolar illness.
Cereb Cortex 24, 3116-3130 (2014). - 4. Insel, T., et al. Research domain criteria (RDoC): toward a new classification framework for research on mental disorders.
Am J Psychiatry 167, 748-751 (2010). - 5. Yang, G. J., et al. Altered Global Signal Topography in Schizophrenia. Cereb Cortex (2016).
- 6. Shen, W. W. A history of antipsychotic drug development.
Compr Psychiatry 40, 407-414 (1999). - 7. Tamminga, C. A., et al. Clinical phenotypes of psychosis in the Bipolar-Schizophrenia Network on Intermediate Phenotypes (B-SNIP). Am J Psychiatry 170, 1263-1274 (2013).
- 8. Anticevic, A., et al. Global Prefrontal and Fronto-amygdala Dysconnectivity in Bipolar I Disorder with Psychosis History.
Biological Psychiatry 73, 565-573 (2012). - 9. Anticevic, A., et al. Global resting-state fMRI analysis identifies frontal cortex, striatal, and cerebellar dysconnectivity in obsessive-compulsive disorder.
Biol. Psychiatry 75, 595-605 (2013). - 10. Cole, M. W., Anticevic, A., Repovs, G. & Barch, D. M. Variable global dysconnectivity and individual differences in schizophrenia. Biological Psychiatry 70, 43-50 (2011).
- 11. Yeo, B. T., et al. The organization of the human cerebral cortex estimated by intrinsic functional connectivity. J Neurophysiol 106, 1125-1165 (2011).
- 12. Glasser, M. F., et al. A multi-modal parcellation of human cerebral cortex. Nature 536, 171-178 (2016).
- 13. Hawrylycz, M. J., et al. An anatomically comprehensive atlas of the adult human brain transcriptome. Nature 489, 391-399 (2012).
- 14. Burt, J. D., M; Eckner, W J; Navejar, N M; Ji, J L; Martin, W J; Bernacchia, A; Anticevic, A; Murray, JD. Hierarchy of transcriptomic specialization across human cortex captured by myelin map topography. (2017).
Claims (13)
Priority Applications (1)
| Application Number | Priority Date | Filing Date | Title |
|---|---|---|---|
| US16/980,136 US12154677B2 (en) | 2018-03-14 | 2019-03-13 | Systems and methods for neuro-behavioral relationships in dimensional geometric embedding (N-BRIDGE) |
Applications Claiming Priority (3)
| Application Number | Priority Date | Filing Date | Title |
|---|---|---|---|
| US201862642900P | 2018-03-14 | 2018-03-14 | |
| US16/980,136 US12154677B2 (en) | 2018-03-14 | 2019-03-13 | Systems and methods for neuro-behavioral relationships in dimensional geometric embedding (N-BRIDGE) |
| PCT/US2019/022110 WO2019178271A1 (en) | 2018-03-14 | 2019-03-13 | Systems and methods for neuro-behavioral relationships in dimensional geometric embedding (n-bridge) |
Publications (2)
| Publication Number | Publication Date |
|---|---|
| US20210005306A1 US20210005306A1 (en) | 2021-01-07 |
| US12154677B2 true US12154677B2 (en) | 2024-11-26 |
Family
ID=67908520
Family Applications (1)
| Application Number | Title | Priority Date | Filing Date |
|---|---|---|---|
| US16/980,136 Active 2039-09-28 US12154677B2 (en) | 2018-03-14 | 2019-03-13 | Systems and methods for neuro-behavioral relationships in dimensional geometric embedding (N-BRIDGE) |
Country Status (5)
| Country | Link |
|---|---|
| US (1) | US12154677B2 (en) |
| EP (1) | EP3764904A4 (en) |
| JP (1) | JP2021518172A (en) |
| CA (1) | CA3093552A1 (en) |
| WO (1) | WO2019178271A1 (en) |
Families Citing this family (8)
| Publication number | Priority date | Publication date | Assignee | Title |
|---|---|---|---|---|
| US11037296B1 (en) * | 2020-08-07 | 2021-06-15 | Omniscient Neurotechnology Pty Limited | Deriving target data from selected brain data |
| EP4216807A4 (en) * | 2020-09-25 | 2024-11-20 | Linus Health, Inc | SYSTEMS AND METHODS FOR MACHINE LEARNING-ASSISTED COGNITIVE ASSESSMENT AND TREATMENT |
| US12502541B2 (en) | 2021-02-24 | 2025-12-23 | Medtronic, Inc. | Device for assessment of brain signals |
| JP7317171B2 (en) * | 2021-12-03 | 2023-07-28 | 株式会社Doctorbook | Program, information processing device and information processing method |
| US12159333B2 (en) * | 2022-05-06 | 2024-12-03 | Omniscient Neurotechnology Pty Limited | Visualization of complex connectome interactions |
| CN117731312A (en) | 2022-09-13 | 2024-03-22 | 上海联影医疗科技股份有限公司 | A scanning method and system for medical images |
| CN116383600A (en) * | 2023-03-16 | 2023-07-04 | 上海外国语大学 | Single-test brain wave signal analysis method and system |
| CN120072263B (en) * | 2025-02-06 | 2025-09-05 | 中国人民解放军总医院第一医学中心 | A cognitive behavioral testing method combined with medical data analysis |
Citations (14)
| Publication number | Priority date | Publication date | Assignee | Title |
|---|---|---|---|---|
| US4862359A (en) | 1984-08-31 | 1989-08-29 | Bio-Logic Systems Corporation | Topographical mapping of brain functionality from neuropsychological test results |
| US20070112585A1 (en) * | 2003-08-01 | 2007-05-17 | Breiter Hans C | Cognition analysis |
| US20100076274A1 (en) * | 2008-09-23 | 2010-03-25 | Joan Severson | Human-Digital Media Interaction Tracking |
| US20100311023A1 (en) | 2009-05-07 | 2010-12-09 | Kan Kevin Gar Wah | Systems amd methods for evaluating neurobehavioural performance from reaction time tests |
| US20130060125A1 (en) | 2010-04-16 | 2013-03-07 | Applied Brain And Vision Sciences Inc. | Encephalography method and apparatus incorporating independent component analysis and a spectral shaping filter |
| US20150045688A1 (en) | 2013-08-10 | 2015-02-12 | Dario Nardi | Nardi neurotype profiler system |
| US20160019693A1 (en) * | 2014-07-15 | 2016-01-21 | The Brigham And Women's Hospital | Systems and methods for generating biomarkers based on multivariate classification of functional imaging and associated data |
| US9504415B1 (en) | 2004-12-22 | 2016-11-29 | Neurowave Systems Inc | Neuro-behavioral test method for screening and evaluating therapy for ADHD and system |
| US20170258389A1 (en) * | 2016-03-14 | 2017-09-14 | Newton Howard | Neuroanalytic, neurodiagnostic, and therapeutic tools |
| US20170364929A1 (en) | 2016-06-17 | 2017-12-21 | Sanjiv Ferreira | Method and system for identifying, aggregating & transforming emotional states of a user using a temporal phase topology framework |
| US20180236235A1 (en) * | 2017-02-22 | 2018-08-23 | Medtronic Ardian Luxembourg S.A.R.L. | Systems, devices, and associated methods for treating patients via renal neuromodulation to reduce a risk of developing cognitive impairment |
| US20190090749A1 (en) * | 2017-09-26 | 2019-03-28 | Washington University | Supervised classifier for optimizing target for neuromodulation, implant localization, and ablation |
| US20190142338A1 (en) * | 2017-11-10 | 2019-05-16 | Lvis Corporation | Efficacy and/or therapeutic parameter recommendation using individual patient data and therapeutic brain network maps |
| US20220160287A1 (en) * | 2016-03-04 | 2022-05-26 | Brainsview Inc. | System, process, and devices for real-time brain monitoring |
-
2019
- 2019-03-13 CA CA3093552A patent/CA3093552A1/en active Pending
- 2019-03-13 WO PCT/US2019/022110 patent/WO2019178271A1/en not_active Ceased
- 2019-03-13 EP EP19767121.7A patent/EP3764904A4/en not_active Withdrawn
- 2019-03-13 JP JP2020548646A patent/JP2021518172A/en not_active Withdrawn
- 2019-03-13 US US16/980,136 patent/US12154677B2/en active Active
Patent Citations (14)
| Publication number | Priority date | Publication date | Assignee | Title |
|---|---|---|---|---|
| US4862359A (en) | 1984-08-31 | 1989-08-29 | Bio-Logic Systems Corporation | Topographical mapping of brain functionality from neuropsychological test results |
| US20070112585A1 (en) * | 2003-08-01 | 2007-05-17 | Breiter Hans C | Cognition analysis |
| US9504415B1 (en) | 2004-12-22 | 2016-11-29 | Neurowave Systems Inc | Neuro-behavioral test method for screening and evaluating therapy for ADHD and system |
| US20100076274A1 (en) * | 2008-09-23 | 2010-03-25 | Joan Severson | Human-Digital Media Interaction Tracking |
| US20100311023A1 (en) | 2009-05-07 | 2010-12-09 | Kan Kevin Gar Wah | Systems amd methods for evaluating neurobehavioural performance from reaction time tests |
| US20130060125A1 (en) | 2010-04-16 | 2013-03-07 | Applied Brain And Vision Sciences Inc. | Encephalography method and apparatus incorporating independent component analysis and a spectral shaping filter |
| US20150045688A1 (en) | 2013-08-10 | 2015-02-12 | Dario Nardi | Nardi neurotype profiler system |
| US20160019693A1 (en) * | 2014-07-15 | 2016-01-21 | The Brigham And Women's Hospital | Systems and methods for generating biomarkers based on multivariate classification of functional imaging and associated data |
| US20220160287A1 (en) * | 2016-03-04 | 2022-05-26 | Brainsview Inc. | System, process, and devices for real-time brain monitoring |
| US20170258389A1 (en) * | 2016-03-14 | 2017-09-14 | Newton Howard | Neuroanalytic, neurodiagnostic, and therapeutic tools |
| US20170364929A1 (en) | 2016-06-17 | 2017-12-21 | Sanjiv Ferreira | Method and system for identifying, aggregating & transforming emotional states of a user using a temporal phase topology framework |
| US20180236235A1 (en) * | 2017-02-22 | 2018-08-23 | Medtronic Ardian Luxembourg S.A.R.L. | Systems, devices, and associated methods for treating patients via renal neuromodulation to reduce a risk of developing cognitive impairment |
| US20190090749A1 (en) * | 2017-09-26 | 2019-03-28 | Washington University | Supervised classifier for optimizing target for neuromodulation, implant localization, and ablation |
| US20190142338A1 (en) * | 2017-11-10 | 2019-05-16 | Lvis Corporation | Efficacy and/or therapeutic parameter recommendation using individual patient data and therapeutic brain network maps |
Non-Patent Citations (18)
| Title |
|---|
| Anticevic, A., et al. Characterizing thalamo-cortical disturbances in schizophrenia and bipolar illness. Cereb Cortex 24, 3116-3130 (2014). |
| Anticevic, A., et al. Global Prefrontal and Fronto-amygdala Dysconnectivity in Bipolar I Disorder with Psychosis History. Biological Psychiatry 73, 565-573 (2012). |
| Anticevic, A., et al. Global resting-state functional magnetic resonance imaging analysis identifies frontal cortex, striatal, and cerebellar dysconnectivity in obsessive-compulsive disorder. Biol. Psychiatry 75, 595-605 (2013). |
| Bielczyk, Natalia Z et al. "Circuit to construct mapping: a mathematical tool for assisting the diagnosis and treatment in major depressive disorder." Frontiers in psychiatry vol. 6 29. Feb. 26, 2015 (Year: 2015). * |
| Burt, J.D., M; Eckner, WJ; Navejar, NM; Ji, JL; Martin, WJ; Bernacchia, A; Anticevic, A; Murray, JD. Hierarchy of transcriptomic specialization across human cortex captured by myelin map topography. Nature Neuroscience 21, 1251-1259 (2017). |
| Cole, M.W., Anticevic, A., Repovs, G. & Barch, D.M. Variable global dysconnectivity and individual differences in schizophrenia. Biological Psychiatry 70, 43-50 (2011). |
| European Extended Search Report mailed Dec. 16, 2021 for European Application No. EP 19 76 7121.7; 11 pages. |
| Glasser, M.F., et al. A multi-modal parcellation of human cerebral cortex. Nature 536, 171-178 (2016). |
| Hawrylycz, M.J., et al. An anatomically comprehensive atlas of the adult human brain transcriptome. Nature 489, 391-399 (2012). |
| Insel, T., et al. Research domain criteria (RDoC): toward a new classification framework for research on mental disorders. Am J Psychiatry 167, 748-751 (2010). |
| International Search Report and Written Opinion of the International Searching Authority directed to related International Patent Application No. PCT/US2019/022110, mailed Jul. 25, 2019; 17 pages. |
| Medaglia, John D., and Danielle S. Bassett. "Network analyses and nervous system disorders." arXiv preprint arXiv:1701.01101 (2017) (Year: 2017). * |
| Seeman, P. & Lee, T. Antipsychotic drugs: direct correlation between clinical potency and presynaptic action on dopamine neurons. Science 188, 1217-1219 (1975). |
| Shen, W.W. A history of antipsychotic drug development. Compr Psychiatry 40, 407-414 (1999). |
| Sunkin, S., et al. Allen Brain Atlas: an integrated spatio-temporal portal for exploring the central nervous system. Nucleic Acids Research 41, D996-D1008 (Jan. 2013; published online Nov. 28, 2012). |
| Tamminga, C.A., et al. Clinical phenotypes of psychosis in the Bipolar-Schizophrenia Network on Intermediate Phenotypes (B-SNIP). Am J Psychiatry 170, 1263-1274 (2013). |
| Yang, G.J., et al. Altered Global Signal Topography in Schizophrenia. Cereb Cortex (2016). |
| Yeo, B.T., et al. The organization of the human cerebral cortex estimated by intrinsic functional connectivity. J Neurophysiol 106, 1125-1165 (2011). |
Also Published As
| Publication number | Publication date |
|---|---|
| EP3764904A4 (en) | 2022-01-19 |
| CA3093552A1 (en) | 2019-09-19 |
| WO2019178271A1 (en) | 2019-09-19 |
| EP3764904A1 (en) | 2021-01-20 |
| JP2021518172A (en) | 2021-08-02 |
| US20210005306A1 (en) | 2021-01-07 |
Similar Documents
| Publication | Publication Date | Title |
|---|---|---|
| US12154677B2 (en) | Systems and methods for neuro-behavioral relationships in dimensional geometric embedding (N-BRIDGE) | |
| Nielsen et al. | Multisite functional connectivity MRI classification of autism: ABIDE results | |
| Fan et al. | Williams syndrome-specific neuroanatomical profile and its associations with behavioral features | |
| US20130224117A1 (en) | Latent variable approach to the identification and/or diagnosis of cognitive disorders and/or behaviors and their endophenotypes | |
| US20090006001A1 (en) | Empirical quantitative approaches for psychiatric disorders phenotypes | |
| Jessen et al. | Patterns of cortical structures and cognition in antipsychotic-naïve patients with first-episode schizophrenia: a partial least squares correlation analysis | |
| Tsagkas et al. | Classification of multiple sclerosis based on patterns of CNS regional atrophy covariance | |
| Zarei et al. | Automated classification of Alzheimer's disease, mild cognitive impairment, and cognitively normal patients using 3D convolutional neural network and radiomic features from T1-weighted brain MRI: A comparative study on detection accuracy | |
| Das et al. | Regional brain volumes and ADHD symptoms in middle-aged adults: The PATH through life study | |
| CN116486135A (en) | Sample classification method, device, computing device and storage medium | |
| Chen et al. | Robust differences in cortical cell type proportions across healthy human aging inferred through cross-dataset transcriptome analyses | |
| Lazari et al. | Reassessing associations between white matter and behaviour with multimodal microstructural imaging | |
| Zhang et al. | Gene expression is associated with brain function of insomnia disorder, rather than brain structure | |
| Barron et al. | Pain can’t be carved at the joints: defining function-based pain profiles and their relevance to chronic disease management in healthcare delivery design | |
| Ferre et al. | Anatomical and functional characterization in children with unilateral cerebral palsy: an atlas-based analysis | |
| Muggli et al. | Low to moderate prenatal alcohol exposure and facial shape of children at age 6 to 8 years | |
| Chiang et al. | Machine-learning-based feature selection to identify attention-deficit hyperactivity disorder using whole-brain white matter microstructure: A longitudinal study | |
| Kember et al. | Transitioning sleeping position detection in late pregnancy using computer vision from controlled to real-world settings: an observational study | |
| Baghirova et al. | Explainable graph-theoretical machine learning: with application to alzheimer's disease prediction | |
| Sütçübaşı et al. | Differentiating functional connectivity patterns in ADHD and autism among the young people: a machine learning solution | |
| Boelders et al. | Factor Structure and Validity of Composite Scores Resulting From a Computerized Cognitive Test Battery in Healthy Adults and Patients With Primary Brain Tumors | |
| Kasanova et al. | Optimizing vs. matching: response strategy in a probabilistic learning task is associated with negative symptoms of schizophrenia | |
| Diaz et al. | OPTIMUS*: Predicting Multivariate Outcomes in Alzheimer's Disease using Multi-modal Data amidst Missing Values | |
| Della Bella et al. | Brain dynamic organization at the acute stage of severe brain injury | |
| Schultebraucks et al. | Precision psychiatry approach to posttraumatic stress response |
Legal Events
| Date | Code | Title | Description |
|---|---|---|---|
| FEPP | Fee payment procedure |
Free format text: ENTITY STATUS SET TO UNDISCOUNTED (ORIGINAL EVENT CODE: BIG.); ENTITY STATUS OF PATENT OWNER: SMALL ENTITY |
|
| FEPP | Fee payment procedure |
Free format text: ENTITY STATUS SET TO SMALL (ORIGINAL EVENT CODE: SMAL); ENTITY STATUS OF PATENT OWNER: SMALL ENTITY |
|
| STPP | Information on status: patent application and granting procedure in general |
Free format text: APPLICATION DISPATCHED FROM PREEXAM, NOT YET DOCKETED |
|
| STPP | Information on status: patent application and granting procedure in general |
Free format text: DOCKETED NEW CASE - READY FOR EXAMINATION |
|
| STPP | Information on status: patent application and granting procedure in general |
Free format text: NON FINAL ACTION MAILED |
|
| STPP | Information on status: patent application and granting procedure in general |
Free format text: ADVISORY ACTION MAILED |
|
| STPP | Information on status: patent application and granting procedure in general |
Free format text: DOCKETED NEW CASE - READY FOR EXAMINATION |
|
| STPP | Information on status: patent application and granting procedure in general |
Free format text: NON FINAL ACTION MAILED |
|
| STPP | Information on status: patent application and granting procedure in general |
Free format text: RESPONSE TO NON-FINAL OFFICE ACTION ENTERED AND FORWARDED TO EXAMINER |
|
| STPP | Information on status: patent application and granting procedure in general |
Free format text: NOTICE OF ALLOWANCE MAILED -- APPLICATION RECEIVED IN OFFICE OF PUBLICATIONS |
|
| ZAAB | Notice of allowance mailed |
Free format text: ORIGINAL CODE: MN/=. |
|
| AS | Assignment |
Owner name: YALE UNIVERSITY, CONNECTICUT Free format text: ASSIGNMENT OF ASSIGNORS INTEREST;ASSIGNORS:ANTICEVIC, ALAN;MURRAY, JOHN;JI, JIE LISA;SIGNING DATES FROM 20240919 TO 20240923;REEL/FRAME:068725/0321 |
|
| STPP | Information on status: patent application and granting procedure in general |
Free format text: PUBLICATIONS -- ISSUE FEE PAYMENT RECEIVED |
|
| STPP | Information on status: patent application and granting procedure in general |
Free format text: AWAITING TC RESP, ISSUE FEE PAYMENT VERIFIED |
|
| STCF | Information on status: patent grant |
Free format text: PATENTED CASE |