US12130186B2 - Method and system for real-time wide-field dynamic temperature sensing - Google Patents
Method and system for real-time wide-field dynamic temperature sensing Download PDFInfo
- Publication number
- US12130186B2 US12130186B2 US17/893,784 US202217893784A US12130186B2 US 12130186 B2 US12130186 B2 US 12130186B2 US 202217893784 A US202217893784 A US 202217893784A US 12130186 B2 US12130186 B2 US 12130186B2
- Authority
- US
- United States
- Prior art keywords
- imaging
- camera
- shot
- spatially encoded
- image
- Prior art date
- Legal status (The legal status is an assumption and is not a legal conclusion. Google has not performed a legal analysis and makes no representation as to the accuracy of the status listed.)
- Active, expires
Links
Images


Classifications
-
- G—PHYSICS
- G01—MEASURING; TESTING
- G01J—MEASUREMENT OF INTENSITY, VELOCITY, SPECTRAL CONTENT, POLARISATION, PHASE OR PULSE CHARACTERISTICS OF INFRARED, VISIBLE OR ULTRAVIOLET LIGHT; COLORIMETRY; RADIATION PYROMETRY
- G01J5/00—Radiation pyrometry, e.g. infrared or optical thermometry
- G01J5/48—Thermography; Techniques using wholly visual means
-
- G—PHYSICS
- G01—MEASURING; TESTING
- G01J—MEASUREMENT OF INTENSITY, VELOCITY, SPECTRAL CONTENT, POLARISATION, PHASE OR PULSE CHARACTERISTICS OF INFRARED, VISIBLE OR ULTRAVIOLET LIGHT; COLORIMETRY; RADIATION PYROMETRY
- G01J3/00—Spectrometry; Spectrophotometry; Monochromators; Measuring colours
- G01J3/28—Investigating the spectrum
- G01J3/2889—Rapid scan spectrometers; Time resolved spectrometry
-
- G—PHYSICS
- G01—MEASURING; TESTING
- G01J—MEASUREMENT OF INTENSITY, VELOCITY, SPECTRAL CONTENT, POLARISATION, PHASE OR PULSE CHARACTERISTICS OF INFRARED, VISIBLE OR ULTRAVIOLET LIGHT; COLORIMETRY; RADIATION PYROMETRY
- G01J3/00—Spectrometry; Spectrophotometry; Monochromators; Measuring colours
- G01J3/28—Investigating the spectrum
- G01J3/30—Measuring the intensity of spectral lines directly on the spectrum itself
- G01J3/36—Investigating two or more bands of a spectrum by separate detectors
-
- G—PHYSICS
- G01—MEASURING; TESTING
- G01J—MEASUREMENT OF INTENSITY, VELOCITY, SPECTRAL CONTENT, POLARISATION, PHASE OR PULSE CHARACTERISTICS OF INFRARED, VISIBLE OR ULTRAVIOLET LIGHT; COLORIMETRY; RADIATION PYROMETRY
- G01J5/00—Radiation pyrometry, e.g. infrared or optical thermometry
- G01J5/02—Constructional details
- G01J5/08—Optical arrangements
- G01J5/0801—Means for wavelength selection or discrimination
- G01J5/0802—Optical filters
-
- G—PHYSICS
- G01—MEASURING; TESTING
- G01J—MEASUREMENT OF INTENSITY, VELOCITY, SPECTRAL CONTENT, POLARISATION, PHASE OR PULSE CHARACTERISTICS OF INFRARED, VISIBLE OR ULTRAVIOLET LIGHT; COLORIMETRY; RADIATION PYROMETRY
- G01J5/00—Radiation pyrometry, e.g. infrared or optical thermometry
- G01J5/02—Constructional details
- G01J5/08—Optical arrangements
- G01J5/0803—Arrangements for time-dependent attenuation of radiation signals
- G01J5/0805—Means for chopping radiation
-
- G—PHYSICS
- G01—MEASURING; TESTING
- G01J—MEASUREMENT OF INTENSITY, VELOCITY, SPECTRAL CONTENT, POLARISATION, PHASE OR PULSE CHARACTERISTICS OF INFRARED, VISIBLE OR ULTRAVIOLET LIGHT; COLORIMETRY; RADIATION PYROMETRY
- G01J5/00—Radiation pyrometry, e.g. infrared or optical thermometry
- G01J5/10—Radiation pyrometry, e.g. infrared or optical thermometry using electric radiation detectors
-
- G—PHYSICS
- G01—MEASURING; TESTING
- G01J—MEASUREMENT OF INTENSITY, VELOCITY, SPECTRAL CONTENT, POLARISATION, PHASE OR PULSE CHARACTERISTICS OF INFRARED, VISIBLE OR ULTRAVIOLET LIGHT; COLORIMETRY; RADIATION PYROMETRY
- G01J5/00—Radiation pyrometry, e.g. infrared or optical thermometry
- G01J5/80—Calibration
-
- G—PHYSICS
- G02—OPTICS
- G02B—OPTICAL ELEMENTS, SYSTEMS OR APPARATUS
- G02B26/00—Optical devices or arrangements for the control of light using movable or deformable optical elements
- G02B26/08—Optical devices or arrangements for the control of light using movable or deformable optical elements for controlling the direction of light
- G02B26/10—Scanning systems
- G02B26/105—Scanning systems with one or more pivoting mirrors or galvano-mirrors
-
- G—PHYSICS
- G02—OPTICS
- G02B—OPTICAL ELEMENTS, SYSTEMS OR APPARATUS
- G02B27/00—Optical systems or apparatus not provided for by any of the groups G02B1/00 - G02B26/00, G02B30/00
- G02B27/10—Beam splitting or combining systems
- G02B27/14—Beam splitting or combining systems operating by reflection only
-
- H—ELECTRICITY
- H04—ELECTRIC COMMUNICATION TECHNIQUE
- H04N—PICTORIAL COMMUNICATION, e.g. TELEVISION
- H04N23/00—Cameras or camera modules comprising electronic image sensors; Control thereof
- H04N23/56—Cameras or camera modules comprising electronic image sensors; Control thereof provided with illuminating means
-
- H—ELECTRICITY
- H04—ELECTRIC COMMUNICATION TECHNIQUE
- H04N—PICTORIAL COMMUNICATION, e.g. TELEVISION
- H04N23/00—Cameras or camera modules comprising electronic image sensors; Control thereof
- H04N23/95—Computational photography systems, e.g. light-field imaging systems
- H04N23/951—Computational photography systems, e.g. light-field imaging systems by using two or more images to influence resolution, frame rate or aspect ratio
-
- G—PHYSICS
- G01—MEASURING; TESTING
- G01J—MEASUREMENT OF INTENSITY, VELOCITY, SPECTRAL CONTENT, POLARISATION, PHASE OR PULSE CHARACTERISTICS OF INFRARED, VISIBLE OR ULTRAVIOLET LIGHT; COLORIMETRY; RADIATION PYROMETRY
- G01J5/00—Radiation pyrometry, e.g. infrared or optical thermometry
- G01J2005/0077—Imaging
Definitions
- the present invention relates to temperature sensing. More specifically, the present invention is concerned with a method and system for fast wide-field upconversion luminescence lifetime thermometry.
- Temperature is an important parameter associated with a number of physical, chemical, and biological processes. Accurate and real-time, temperature sensing at microscopic scales is essential to both industrial applications and scientific research, including the examination of internal strains in turbine blades, control of the synthesis of ionic liquids, and theranostics of cancer.
- Phosphorescence lifetime imaging has emerged as a promising approach to temperature sensing, due to its high spatial resolution, high temperature sensitivity, and resilience to experimental perturbation. Because phosphorescence can be both excited and detected optically, the resulting non-contact phosphorescence lifetime imaging possesses a high spatial resolution. This advantage not only overcomes the intrinsic limitation in spatial resolution of imaging thermography due to the long wavelengths of thermal radiation but also avoids heat-transfer-induced inaccuracy in conventional contact methods. Moreover, independent of accurate prior knowledge of the physical properties of the sample, in terms of emissivity and Griineisen coefficient, phosphorescence lifetime imaging brings in higher flexibility in sample selection.
- phosphorescence lifetime imaging is less susceptible than intensity-based measurements to inhomogeneous signal attenuation, stray light, photobleaching, light path length, and excitation intensity variations.
- phosphorescence lifetime imaging does not rely on the concentration of labeling agents, which eliminates the need for special ratiometric probes.
- Phosphorescence lifetime imaging (PLI) in temperature mapping depends on temperature indicators and optical imaging instruments.
- upconverting nanoparticles Leveraging the long-lived excited states provided by the lanthanide ions, upconverting nanoparticles can sequentially absorb two, or more, low-energy near-infrared photons and convert them to one higher-energy photon, in an upconversion process allowing using excitation power densities several orders of magnitude lower than those needed for simultaneous multiphoton absorption.
- the near-infrared excitation with smaller extinction coefficients, also gains deeper penetration.
- upconverted luminescence particularly the Boltzmann-coupled emission bands in co-doped erbium/ytterbium (Er- 3+ Yb- 3+ ) systems
- Er- 3+ Yb- 3+ co-doped erbium/ytterbium
- long-lived emission in the range between microseconds and milliseconds, of upconverting nanoparticles circumvents interferences from autofluorescence and scattering during image acquisition, which translates into improved imaging contrast and detection sensitivity.
- upconverting nanoparticles have become much brighter, photostable, biocompatible, and non-toxic. As a result, upconverting nanoparticles are one of the frontrunners in temperature indicators for phosphorescence lifetime imaging.
- Phosphorescence lifetime imaging typically uses scanning time-correlated single-photon counting (TCSPC) to determine phosphorescence decay point by point.
- TCSPC scanning time-correlated single-photon counting
- wide-field methods comprise parallel collection in the time-domain and frequency-domain; In the time-domain, these methods extend time-correlated single-photon counting (TCSPC) to wide-field imaging.
- Photoluminescence decay over a 2D field of view (FOV) is synthesized from above 100,000 frames.
- frequency-domain wide-field phosphorescence lifetime imaging methods use phase difference between the intensity-modulated excitation and the received phosphorescence signal to determine the 2D lifetime distribution.
- optical instruments still lack the ability of wide-field phosphorescence lifetime imaging in real time, thus falling short in dynamics temperature mapping.
- thermometry for real-time wide-field dynamic temperature sensing.
- a method for real-time wide-field dynamic temperature sensing of an object comprising producing wide-field illumination to upconverting nanoparticles at the object plane, collecting a light emitted by the upconverting nanoparticles, dividing a collected light into a reflected component and a transmitted component; imaging the reflected component into a first image, imaging the transmitted component into a second image; processing the images; and reconstruction of the object from resulting proceed images.
- a system for real-time wide-field dynamic temperature sensing of an object comprising an illumination unit configured to produce wide-field illumination to upconverting nanoparticles at the object plane; an objective collecting light emitted by the upconverting nanoparticles; a beam splitter dividing a collected light into a reflected component and a transmitted component; a spatiotemporal integrator imaging the reflected component into a first image; a spatial encoder encoding the object into spatially encoded frames, a rotating mirror temporally shearing resulting spatially encoded, and a camera spatiotemporally integrating a resulting spatially encoded and temporally sheared object into a second image; and a processing unit reconstructing the object from the first and the second images.
- FIG. 1 is a schematic view of a system according to an embodiment of an aspect of the present disclosure
- FIG. 2 A shows images of core/shell upconverting nanoparticles acquired with a transmission electron microscope; scale bar: 25 nm;
- FIG. 2 B shows normalized upconversion spectra of upconverting nanoparticles shown in FIG. 2 A ;
- FIG. 2 C shows simplified energy level diagram of Yb 3+ -Er 3+ energy transfer upconversion excitation and emission
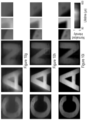
- FIG. 2 D shows temporally projected image of phosphorescence intensity decay of the 5.6-nm-thick-shell upconverting nanoparticles covered by a negative resolution target
- FIG. 2 E shows a comparison of averaged light fluence distribution along the horizontal bars (I) and vertical bars (II) of Element 5 in Group 4 on the resolution target; error bar: standard deviation;
- FIG. 2 F shows lifetime maps of upconverting nanoparticles with the shell thicknesses of 1.9 nm, 3.5 nm, and 5.6 nm covered by transparencies of letters “C”, “A”, and “N” in green emission;
- FIG. 2 G shows time-lapse averaged phosphorescence emission intensities of the samples
- FIG. 2 H shows histograms of phosphorescence lifetimes in the letters shown in FIG. 2 F ;
- FIGS. 3 A- 3 B show lifetime images of green (a) and red (b) upconversion emission bands under different temperatures
- FIGS. 3 C- 3 D show normalized phosphorescence decay curves of green ( FIG. 3 C ) and red ( FIG. 3 D ) emission bands at different temperatures, averaged over the entire field of view;
- FIG. 3 E shows the relationship between temperature and mean lifetimes of green and red emissions with linear fitting, error bar indicating standard deviation from three independent measurements;
- FIG. 3 F shows the normalized contrast versus tissue thickness for green and red emission bands fitted by using the Beer's law
- FIG. 3 G shows longitudinal temperature monitoring of a phantom covered by 0.5 mm-thick chicken tissue
- FIG. 4 A shows representative time-integrated images of a moving onion epidermis cell sample labeled by upconverting nanoparticles
- FIG. 4 B shows phosphorescence lifetime images corresponding to FIG. 4 A ;
- FIG. 4 C shows phosphorescence decay at four selected areas, marked by the solid boxes in the first panel of FIG. 4 A , with different intensities;
- FIG. 4 D shows time histories of averaged fluence and corresponding temperature in four selected regions during translational motion of the sample
- FIG. 5 show image registration in dual-view data acquisition by single-shot photoluminescence lifetime imaging thermometry (SPLIT): FIG. 5 A shows an image acquired in View 1; FIG. 5 B shows an image acquired in View 2 without using optical shearing; FIG. 5 C shows a co-registered image in View 1;
- SPLIT single-shot photoluminescence lifetime imaging thermometry
- FIG. 6 show simulations of dual-view plug-and-play alternating direction method of multipliers (PnP-ADMM) reconstruction:
- FIG. 6 A shows a comparison of representative frames of the reconstructed result with the ground truth;
- FIG. 6 C shows normalized averaged intensity of the reconstructed result versus the frame index, the error bar representing standard deviation;
- FIG. 7 shows X-ray powder diffraction patterns of upconverting nanoparticles (UCNPs), the core-only and core/shell NaGdF 4 :Er 3+ , Yb 3+ /NaGdF 4 upconverting nanoparticles (UCNPs) following their growth by increasing the shell thickness; red dotted lines showing diffraction peaks of pure hexagonal NaGdF 4 ;
- FIG. 8 show characterization sensitivity of the single-shot photoluminescence lifetime imaging thermometry (SPLIT):
- FIG. 8 A shows temporally integrated reconstructed image at the excitation laser power density of 0.06 W/mm 2 ;
- FIG. 8 B shows the normalized intensity as a function of time with a fitting curve;
- FIG. 9 shows a measurement of the green upconversion emission lifetime of the 5.6 nm-thick-shell upconverting nanoparticles (UCNPs) using time-correlated single-photon counting (TCSPC);
- FIG. 10 show comparison of quality of images reconstructed by using different algorithms: FIG. 10 A shows letter “C” reconstructed by using the single-view two-step iterative thresholding/shrinkage (TwIST) method, dual-view two-step iterative thresholding/shrinkage (TwIST) method, and dual-view plug-and-play alternating direction method of multipliers (PnP-ADMM) method, respectively; FIG. 10 B ad FIG. 10 , like FIG. 10 A , for letters “A” and “N”; FIG. 10 D shows a comparison of the selected line profiles of the reconstructed images of letter “C”; FIG. 10 E and FIG. 10 GF , like FIG. 10 D for letters “A” and “N”. FIG. 10 A shows letter “C” reconstructed by using different algorithms: FIG. 10 A shows letter “C” reconstructed by using the single-view two-step iterative thresholding/shrinkage (TwIST) method, dual-view two-step iterative thresholding/s
- FIG. 10 G , FIG. 10 H and FIG. 10 I show lifetime maps of the three letters produced by the single-view two-step iterative thresholding/shrinkage (TwIST) method, showing single-view plug-and-play alternating direction method of multipliers (PnP-ADMM) in FIG. 10 H , and plug-and-play alternating direction method of multipliers (PnP-ADMM) in FIG. 10 I ; insets showing zoom-in views of three local areas;
- FIG. 11 shows quantification of relative temperature sensitivities of green and red upconversion emissions of the core/shell NaGdF 4 : Er 3+ , Yb 3+ /NaGdF 4 upconverting nanoparticles (UCNPs) with a 5.6 nm-thick shell.
- Error bar standard deviation
- FIG. 12 show quantification of single-shot photoluminescence lifetime imaging thermometry (SPLIT)'s imaging depth:
- FIG. 12 A shows experimental system;
- FIG. 12 B shows temporally projected images of the reconstructed dynamic scene at the depth from 0 to 1 mm with green emission;
- FIG. 12 c shows same as FIG. 12 B for red emission;
- FIG. 12 A shows comparison of normalized intensity of a representative cross-section, marked by the dashed line in the first panel in FIG. 12 B , for various imaging depths;
- FIG. 12 E same as FIG. 12 D for red emission, the representative cross-section being marked by the dashed line in the first panel in FIG. 12 C ;
- FIG. 13 show longitudinal temperature monitoring using green in FIG. 13 A and red in FIG. 13 B luminescence emissions from the 5.6 nm-thick upconverting nanoparticles (UCNPs) covered by a transmissive mask of letters “rob”;
- UCNPs upconverting nanoparticles
- FIG. 14 shows demonstration of single-shot photoluminescence lifetime imaging thermometry (SPLIT) with a fresh beef tissue phantom:
- FIG. 14 A shows sample preparation;
- FIG. 14 B shows temporally projected images of the reconstructed dynamic scene at the depth from 0.09 to 0.60 mm with green emission;
- FIG. 14 C shows same as FIG. 14 B for red emission;
- FIG. 14 D shows cross-sections of a selected spatial feature, marked by the solid line in FIG. 14 B , for various depths;
- FIG. 14 E shows same as FIG. 14 D for red emission;
- FIG. 14 F shows normalized fluence versus tissue thickness for green and red emission fitted using Beer's law;
- FIG. 14 A shows sample preparation;
- FIG. 14 B shows temporally projected images of the reconstructed dynamic scene at the depth from 0.09 to 0.60 mm with green emission;
- FIG. 14 C shows same as FIG. 14 B for red emission;
- FIG. 14 D shows cross-sections of a selected spatial feature, marked by
- FIG. 14 G shows lifetimes as the function of the thickness for green emission (circles; the mean value being plotted in solid line) and red emission (diamonds; the mean value being plotted as the dashed line), the error bar corresponding to standard deviation, FIG. 14 H showing the decay of normalized average intensity at the depth of 0.09 mm for the green emission and FIG. 14 I showing the decay of normalized average intensity at the depth of 0.09 mm for the red emission;
- FIG. 15 show single-layer onion cell sample: FIG. 15 A shows an image of the sample taken by a bright field microscope; FIG. 15 B shows a confocal microscopy of green upconversion emission of upconverting nanoparticles (UCNPs) diffused in an individual onion cell, marked by the dashed box in FIG. 15 A ;
- UCNPs upconverting nanoparticles
- FIG. 16 show schematics of an optoelectronic streak camera ( FIG. 16 A ) and a mechanical streak camera ( FIG. 16 B ) in their conventional operations;
- FIG. 17 show comparison between line-scanning microscopy and single-shot photoluminescence lifetime imaging thermometry (SPLIT) in 2D photoluminescence lifetime imaging (PLI) capability:
- FIG. 17 A shows a experimental system of line-scanning microscopy, the moving upconverting nanoparticles (UCNPs) sample beings loaded onto a translation stage, the moving directions being marked by arrows:
- FIG. 17 B shows one-dimensional photoluminescence lifetime imaging (PLI) by using the line-scanning system;
- FIG. 17 C shows a 2D temperature map synthesized by using the data in FIG. 17 B ;
- FIG. 17 D shows seven 2D lifetime maps of the sample moving along vertical direction captured by using the single-shot photoluminescence lifetime imaging thermometry (SPLIT);
- FIG. 18 shows a comparison between the thermal imaging camera and single-shot photoluminescence lifetime imaging thermometry (SPLIT) in temperature imaging:
- FIGS. 18 A - and 18 B show experimental system using thermal imaging camera ( FIG. 18 A ) or photoluminescence lifetime imaging thermometry system ( FIG. 18 B ), the sample and mask being heated up by a blackbody radiator.
- FIG. 18 C shows a temperature image captured by using the thermal imaging camera
- FIG. 18 D shows as FIG. 18 C using single-shot photoluminescence lifetime imaging thermometry (SPLIT)
- FIG. 18 E and FIG. 18 show selected line profile from FIG. 18 C and FIG. 18 D , respectively
- FIG. 18 G shows same as FIG. 18 A using a translation stage to move the mask with the room temperature
- FIG. 18 H shows a temperature image captured by the system in FIG. 18
- FIG. 18 I shows as elected line profile from FIG. 18 H ; and
- FIG. 19 is an illustration of the principle of single-shot photoluminescence lifetime imaging thermometry (SPLIT).
- FIG. 1 A system according to an embodiment of an aspect of the present disclosure is illustrated for example in FIG. 1 .
- a laser beam from a laser source 20 passes through an expander consisting of a first 4f system consisting of lenses L 1 and L 2 (focal length 50-mm, singlet).
- a chopper 30 is placed at the back focal plane of the first lens L 1 of 4f system to generate 50- ⁇ s optical pulses. Then, the pulses pass through a 100-mm focal length lens L 3 and is reflected by a dichroic mirror 40 to generate a focus on the back focal plane of an objective lens 50 with a field of view of at least 1.5 mm ⁇ 1.5 mm.
- the laser source 20 may be a 980-nm continuous-wave laser or a 980-mm pulse laser.
- the expander may be an optical beam expander.
- the chopper 30 may be an optical chopper or an electro-optic modulator or an acoustic optical modulator.
- the dichroic mirror 40 may be a short-pass filter with a cut off wavelength of 750 nm.
- This illumination configuration using a 4f system to expand the diameter of the laser beam, produces wide-field illumination, with a 1.5 ⁇ 1.5 mm 2 field of view, to upconverting nanoparticles at the object plane.
- the near-infrared excited upconverting nanoparticles emit upconverted phosphorescence light in the visible spectrum.
- the decay of light intensity over the 2D field of view is a dynamic scene I(x,y,t).
- the emitted light is collected by the objective lens 50 , transmitted through the dichroic mirror 40 , and is filtered by a band-pass filter 60 .
- a beam splitter 70 then equally divides the light into a reflected and a transmitted components.
- the reflected component is imaged by a complementary metal oxide semiconductor (CMOS) camera via spatiotemporal integration (operator T) as View 1, with optical energy distribution E 1 (x 1 .y i ).
- CMOS complementary metal oxide semiconductor
- Operator T optical energy distribution
- E 1 optical energy distribution
- CCD charge-coupled device
- sCMOS scientific complementary metal oxide semiconductor
- ECCD electron-multiplying charged-coupled device
- the transmitted component forms an image, using front optics such as a camera lens, an objective lens, and a telescope for imaging to an intermediate image plane, the dynamic scene on a transmissive encoding mask 90 with a pseudo-random binary pattern (Fineline Imaging, 50% transmission ratio; 60- ⁇ m encoding pixel size) (operator C).
- a spatial light modulator such as a digital micro-mirror device, or a printed mask loaded on a translation stage may be used.
- relay optics such as by a second 4f imaging system (100-mm focal length lenses L 4 and L 5 ) as illustrated, or by a tube lens system, to the sensor plane of an electron-multiplying charged-coupled device (EMCCD) camera 110 for View 2 imaging.
- EMCCD electron-multiplying charged-coupled device
- a global shutter scientific complementary metal oxide semiconductor (sCMOS) camera may also be used.
- a galvanometer scanner 100 placed at the Fourier plane of the 4f imaging system, temporally shears (operator S) the spatially encoded frames linearly to different spatial locations along the x-axis of the electron-multiplying charged-coupled device (EMCCD) camera 110 according to their time of arrival.
- Other rotating mirror such as a polygonal scanner or a resonant scanners, may be used.
- the spatially encoded and temporally sheared dynamic scene is recorded by the electron-multiplying charged-coupled device (EMCCD) camera 110 via spatiotemporal integration, as View 2, with optical energy distribution E 2 (x 2 .y 2 ).
- E TMI ( x,y,t ), (1)
- E is the concatenation of measurements [E 1 , ⁇ E 2 ] T
- M is a linear operator [ 1 , ⁇ SC] T
- ⁇ is a scalar factor introduced to balance the energy ratio between the two views View 1 and View 2 during measurement.
- E is obtained by retrieving the datacube of the dynamic scene by leveraging the spatiotemporal sparsity of the dynamic scene and the prior knowledge of each operator.
- PnP-ADMM plug-and-play alternating direction method of multipliers
- I ⁇ argmin I ⁇ ⁇ 1 2 ⁇ ⁇ TMI - E ⁇ 2 2 + R ⁇ ( I ) + I + ( I ) ⁇ . ( 2 )
- ⁇ 2 2 represents the l 2 norm
- Plug-and-play alternating direction method of multipliers implements a variable splitting strategy with a state-of-the-art denoiser to obtain fast and closed-form solutions to each sub-optimization problem, which produces a high image quality in reconstruction.
- the retrieved datacube of the dynamic scene has a sequence depth, defined as the number of frames in a reconstructed movie, of 12-100 frames, each containing 460 ⁇ 460 (x, y) pixels.
- the imaging speed is tunable from 4 to 33 thousand frames per second (kfps).
- the reconstructed datacube is then converted to a photoluminescence lifetime map.
- the area under the normalized intensity decay curve is integrated to report the value of the photoluminescence lifetime.
- T ⁇ ( x , y ) c t + 1 S a ⁇ ⁇ I ⁇ ( x , y , t ) I ⁇ ( x , y , 0 ) ⁇ dt , ( 3 )
- c t is a constant, and S a is the absolute temperature sensitivity.
- EMCD charged-coupled device
- FIG. 2 A shows images of core/shell upconverting nanoparticles acquired with a transmission electron microscope.
- FIG. 2 B shows normalized upconversion spectra of upconverting nanoparticles shown in FIG. 2 A .
- FIG. 2 C shows simplified energy level diagram of Yb3+-Er3+ energy transfer upconversion excitation and emission.
- FIG. 2 D shows temporally projected image of phosphorescence intensity decay of the 5.6-nm-thick-shell upconverting nanoparticles covered by a negative resolution target.
- FIG. 2 E shows a comparison of averaged light fluence distribution along the horizontal bars (I) and vertical bars (II) of Element 5 in Group 4 on the resolution target.
- FIG. 2 F shows lifetime maps of upconverting nanoparticles with the shell thicknesses of 1.9 nm, 3.5 nm, and 5.6 nm covered by transparencies of letters “C”, “A”, and “N” in green emission.
- FIG. 2 G shows time-lapse averaged phosphorescence emission intensities of the samples.
- FIG. 2 H shows histograms of phosphorescence lifetimes in the letters shown in FIG. 2 F .
- FIG. 3 show single-shot temperature mapping using single-shot photoluminescence lifetime imaging thermometry (SPLIT).
- FIGS. 3 A- 3 B show lifetime images of green (A) and red (»B) upconversion emission bands under different temperatures.
- FIGS. 3 C- 3 D show normalized phosphorescence decay curves of green (C) and red (D) emission bands at different temperatures, averaged over the entire field of view.
- FIG. 3 E shows the relationship between temperature and mean lifetimes of green and red emissions with linear fitting.
- FIG. 3 F shows the normalized contrast versus tissue thickness for green and red emission bands with single-component exponential fitting.
- FIG. 3 G shows longitudinal temperature monitoring of a phantom covered by 0.5 mm-thick chicken tissue.
- FIG. 4 show dynamic single-cell temperature mapping.
- FIG. 4 A shows representative time-integrated images of a moving onion epidermis cell sample labeled by upconverting nanoparticles.
- FIG. 4 B shows phosphorescence lifetime images corresponding to FIG. 4 A .
- FIG. 4 C shows phosphorescence decay at four selected areas, marked by the solid boxes in the first panel of FIG. 4 A , varied intensities.
- FIG. 4 D shows time histories of averaged fluence and corresponding temperature in the four selected regions during the sample's translational motion.
- the present optical temperature mapping method synergistically combines dual-view optical streak imaging with compressed sensing, to record wide-field luminescence decay of Er 3 ⁇ , Yb 3+ co-doped NaGdF4 upconverting nanoparticles in real time, from which a lifetime-based 2D temperature map is obtained in a single exposure.
- the method enables high-resolution longitudinal temperature monitoring beneath a thin scattering medium and dynamic temperature tracking of a moving biological sample at single-cell resolution.
- a method comprises producing wide-field illumination to upconverting nanoparticles at the object plane, by expanding the laser beam diameter, using a 4f system or an optical beam expander for example.
- the near-infrared excited upconverting nanoparticles emit upconverted phosphorescence light in the visible spectrum.
- the decay of the emitted light intensity over the 2D field of view is a dynamic scene I(x,y,t).
- the emitted light is collected and equally divided into a reflected component and a transmitted component.
- the method then comprises imaging the reflected component (View 1) by spatiotemporal integration using a complementary metal oxide semiconductor (CMOS) camera, a charge-coupled device (CCD) camera, a scientific complementary metal oxide semiconductor (sCMOS) camera, or an electron-multiplying charged-coupled device (EMCCD) camera for example, and imaging the transmitted component (View 2) by spatial encoding using a printed mask or a spatial light modulator such as a digital micro-mirror device, or a printed mask loaded on a translation stage, temporal shearing, using a rotating mirror such as a galvanometer scanner, a polygonal scanner or a resonant scanner for example, and spatiotemporal integration, using a highly sensitive cameras such as an electron-multiplying charged-coupled device (EMCCD) or a global shutter scientific complementary metal oxide semiconductor (sCMOS) for example.
- the data of the images are processed for denoising, cropping, and calibration of the obtained two views, and video reconstruction or compressed sensing based video reconstruction is performed
- the present single-shot phosphorescence lifetime imaging thermometry method high parallelism in the data acquisition improves the overall light throughput.
- the method comprising single-shot temperature sensing over a 2D field of view, allows improved measurement accuracy by avoiding scanning motion artifacts and laser intensity fluctuation.
- the present single-shot phosphorescence lifetime imaging thermometry method and system extend the application scope of phosphorescence lifetime imaging to observing non-repeatable temperature dynamics. They allow high tunability of imaging speeds, which accommodates a variety of upconverting nanoparticles with a wide lifetime span.
- both the dual-view data acquisition and the plug-and-play alternating direction method of multipliers (PnP-ADMM) method support high imaging quality in the present single-shot phosphorescence lifetime imaging thermometry system and method.
- View 1 preserves the spatial information in the dynamic scene.
- View 2 retains temporal information by optical streaking via time-to-space conversion.
- both views maximally keep rich spatiotemporal information.
- the plug-and-play alternating direction method of multipliers (PnP-ADMM) method provides a powerful modular structure, which allows separated optimization of individual sub-optimization problems with an advanced denoising algorithm to generate high-quality image restoration results.
- the present single-shot phosphorescence lifetime imaging thermometry method and system provide a versatile temperature-sensing platform. In materials characterization, they may be used in the stress analysis of metal fatigue in turbine blades. In biomedicine, they may be implemented for accurate sub-cutaneous temperature monitoring for theranostics of skin diseases such as melanoma. The microscopic temperature mapping ability may also be exploited for the studies of temperature-regulated cellular signaling. Finally, the operation of the method and system may be extended to Stokes emission in rare-earth nanoparticles and spectrally resolved temperature mapping.
- single-shot photoluminescence lifetime imaging thermometry Synergistically combining dual-view optical streak imaging with compressed sensing, single-shot photoluminescence lifetime imaging thermometry (SPLIT) records wide-field luminescence decay of Er 3+ , Yb 3+ co-doped NaGdF 4 Upconverting nanoparticles (UCNPs) in real time, from which a lifetime-based 2D temperature map is obtained in a single exposure.
- single-shot photoluminescence lifetime imaging thermometry SPLIT
- UCNPs Upconverting nanoparticles
- FIG. 1 A single-shot photoluminescence lifetime imaging thermometry (SPLIT) system according to an embodiment of an aspect of the present invention is shown in FIG. 1 , showing data acquisition and image reconstruction of luminescence intensity decay in a letter “C”.
- a 980-nm continuous-wave laser BWT, DS3-11312-113-LD
- the laser beam passes through a 4f system consisting of two 50-mm focal length lenses (L 1 and L 2 , Thorlabs, LA1255).
- An optical chopper (Scitec Instruments, 300CD) is placed at the back focal plane of lens L 1 to generate 50- ⁇ s optical pulses.
- the pulse passes through a 100-mm focal length lens (L 3 , Thorlabs, AC254-100-B) and is reflected by a short-pass dichroic mirror (Edmund Optics, 69-219) to generate a focus on the back focal plane of an objective lens (Nikon, CF Achro 4 ⁇ ).
- This illumination scheme produces wide-field illumination (1.5 ⁇ 1.5 mm 2 field of view (FOV)) to Upconverting nanoparticles (UCNPs) at the object plane.
- the near-infrared excited Upconverting nanoparticles emit light in the visible spectral range.
- the decay of light intensity over the 2D field of view (FOV) is a dynamic scene, denoted by I(x, y, t).
- the emitted light is collected by the same objective lens, transmits through the dichroic mirror, and is filtered by a band-pass filter (Thorlabs, MF542-20 or Semrock, FF01-660/30-25). Then, a beam splitter (Thorlabs, BS013) equally divides the light into two components.
- the reflected component is imaged by a complementary metal oxide semiconductor (CMOS) camera (FLIR, GS3-U3-23S6M-C) with a camera lens (Fujinon, HF75SA1) via spatiotemporal integration (denoted as the operator T) as View 1, whose optical energy distribution is denoted by E 1 (x 1 , y 1 ).
- CMOS complementary metal oxide semiconductor
- the transmitted component forms an image of the dynamic scene on a transmissive encoding mask with a pseudo-random binary pattern (Fineline Imaging, 50% transmission ratio; 60- ⁇ m encoding pixel size).
- This process of spatial encoding is denoted by the operator C.
- the spatially encoded scene is relayed to the sensor plane of an electron-multiplying (EM) CCD camera (Nüvü Cameras, HNü 1024) by another 4f imaging system consisting of two 100-mm focal length lenses (L 4 and L 5 , Thorlabs, AC254-100-A).
- EM electron-multiplying
- a galvanometer scanner placed at the Fourier plane of the 4f imaging system, temporally shears the spatially encoded frames linearly to different spatial locations along the x 2 -axis of the electron-multiplying charged-coupled device (EMCCD) camera according to their time of arrival. This process of temporal shearing is denoted by the operator S.
- EMCCD electron-multiplying charged-coupled device
- E After data acquisition, E is processed an algorithm that retrieves the datacube of the dynamic scene by leveraging the spatiotemporal sparsity of the dynamic scene and the prior knowledge of each operator.
- PnP-ADMM plug-and-play alternating direction method of multipliers
- SPLIT single-shot photoluminescence lifetime imaging thermometry
- I ⁇ argmin I ⁇ ⁇ 1 2 ⁇ ⁇ TMI - E ⁇ 2 2 + R ⁇ ( I ) + I + ( I ) ⁇ . ( 2 )
- the retrieved datacube of the dynamic scene has a sequence depth, that is the number of frames in a reconstructed movie, of 100 frames, each containing 460 ⁇ 460 (x, y) pixels.
- the imaging speed is tunable from 4 to 33 thousand frames per second (kfps).
- a photoluminescence lifetime map is then generated by integrating the area under the decay curve 50 .
- the 2D temperature distribution, T(x, y) is calculated as follows:
- T ⁇ ( x , y ) c t + 1 S a ⁇ ⁇ I ⁇ ( x , y , t ) I ⁇ ( x , y , 0 ) ⁇ dt , ( 3 )
- UCNP core/shell upconverting nanoparticle
- upconverting nanoparticles All of the upconverting nanoparticles (UCNPs) samples were of pure hexagonal crystal phase ( FIG. 7 ). Under the 980-nm excitation, upconversion emission bands of all samples were measured at around 525/545 and 660 nm, which correspond to the 2 H 11/2 / 4 S 3/2 ⁇ 4 I 15/2 and 4 F 9/2 ⁇ 4 I 15/2 radiative transitions, respectively ( FIGS. 2 B- 2 C ).
- the Upconverting nanoparticles were imaged with shell thicknesses of 1.9 nm, 3.5 nm, and 5.6 nm, covered by transparencies of letters “C”, “A”, and “N”, respectively, using a single laser pulse.
- the lifetime maps of these samples are shown in FIG. 2 F , which reveals the averaged lifetimes for the 4 S 3/2 excited state of samples “C”, “A”, and “N” to be 142 ⁇ s, 335 ⁇ s, and 478 ⁇ s, respectively ( FIGS. 2 G- 2 H ).
- TCSPC time-correlated single-photon counting
- Single-shot photoluminescence lifetime imaging thermometry (SPLIT) reconstruction method is thus shown to match existing mainstream algorithms popularly used in single-shot compressed ultrafast imaging.
- the comparison demonstrates that the dual-view plug-and-play alternating direction method of multipliers (PnP-ADMM) used by single-shot photoluminescence lifetime imaging thermometry (SPLIT) is more powerful in preserving spatial features while maintaining a low background, which enables a more accurate lifetime quantification and the ensuing temperature mapping (see Supplementary Note 8 hereinbelow and FIG. 10 ).
- the 5.6 nm-thick-shell upconverting nanoparticles was used as the temperature indicator for single-shot photoluminescence lifetime imaging thermometry (SPLIT).
- the temperature of the upconverting nanoparticles (UCNPs) was controlled by a heating plate placed behind the sample.
- the temperature of the entire sample was measured with both a Type K thermocouple (Omega, HH306A) and a thermal camera (FLIR, E 4 ) as references.
- FIGS. 3 A, 3 B The reconstructed lifetime images in the 20-46° C. temperature range are shown in FIGS. 3 A, 3 B .
- FIGS. 3 C, 3 D the time-lapse averaged intensity over the entire field of view (FOV) shows that the averaged lifetimes of green and red emissions decrease from 489 to 440 ⁇ s and from 458 to 398 ⁇ s, which is due to their enhanced multiphonon deactivation at higher temperatures.
- Single-shot photoluminescence lifetime imaging thermometry was also demonstrated using a fresh beef phantom as a scattering medium, where both water and blood are present ( FIG. 14 and Supplementary Note 10).
- the results reveal better penetration of red emission over the green counterpart due to its weaker scattering and absorption by blood. More importantly, the results confirm the independence of the measured photoluminescence lifetime of upconverting nanoparticles (UCNPs) to tissue thickness and hence the excitation light power density in the present example ( ⁇ 0.4 W/mm 2 ).
- UCNPs upconverting nanoparticles
- FIGS. 4 A, 4 B Four representative time-integrated images and their corresponding lifetime maps are shown in FIGS. 4 A, 4 B .
- FIG. 4 C shows intensity decay curves from four selected intensity regions with varied intensity in the onion cell sample at 0.05 seconds.
- the photoluminescence lifetimes and hence the temperature remain stable, showing the resilience of single-shot photoluminescence lifetime imaging thermometry (SPLIT) to spatial intensity variation.
- SPLIT single-shot photoluminescence lifetime imaging thermometry
- the time histories of the averaged emitted fluence and lifetime-indicated temperature of these four regions during the sample's translational moving ( FIG. 4 D ) were also tracked. In this measurement window, the emitted photoluminescence fluence has varied in the selected regions. In contrast, the measured temperature shows a small fluctuation of ⁇ 0.35° C., which validates the advantage of photoluminescence lifetime imaging (PLI) thermometry in handling temporal intensity variation.
- PLI photoluminescence lifetime imaging
- single-shot photoluminescence lifetime imaging thermometry (SPLIT) is presented herein for wide-field dynamic temperature sensing in real-time.
- SPLIT single-shot photoluminescence lifetime imaging thermometry
- PnP-ADMM the developed plug-and-play alternating direction method of multipliers
- single-shot photoluminescence lifetime imaging thermometry has enabled temperature mapping with high sensitivity for both green and red upconversion emission bands with a 20- ⁇ m spatial resolution in a 1.5 ⁇ 1.5 mm 2 field of view (FOV) at a video rate of 20 Hz.
- Single-shot photoluminescence lifetime imaging thermometry is demonstrated in longitudinal temperature monitoring of a phantom beneath chicken and beef tissues.
- Single-shot photoluminescence lifetime imaging thermometry is also applied to dynamic single-cell temperature mapping of a moving single-layer onion epidermis sample.
- Single-shot photoluminescence lifetime imaging thermometry advances the technical frontier of optical instrumentation in photoluminescence lifetime imaging thermometry.
- the high parallelism in data acquisition by Single-shot photoluminescence lifetime imaging thermometry (SPLIT) drastically improves the overall light throughput.
- the resulting system featuring single-shot temperature sensing over a 2D field of view (FOV), solves the long-standing issue in scanning-based techniques (Supplementary Note 12, FIG. 17 ).
- Single-shot photoluminescence lifetime imaging thermometry improves the measurement accuracy by avoiding scanning motion artifacts and laser intensity fluctuation. More importantly, as shown in FIG.
- Single-shot photoluminescence lifetime imaging thermometry extends the application scope of photoluminescence lifetime imaging (PLI) to observing non-repeatable temperature dynamics for the first time. Its high tunability of imaging speeds also accommodates a variety of upconverting nanoparticles (UCNPs) with a wide lifetime span, from hundreds of nanoseconds to milliseconds.
- UCNPs upconverting nanoparticles
- Single-shot photoluminescence lifetime imaging thermometry (SPLIT) is shown to be well suited for dynamic photoluminescence lifetime imaging (PLI) in terms of the targeted imaging speed, detection sensitivity, spatial resolution, and cost efficiency (Supplementary Note 12, Supplementary Table 1 hereinbelow).
- the single-shot photoluminescence lifetime imaging thermometry (SPLIT) system by itself records only the lifetime images; yet, when using upconverting nanoparticles (UCNPs) as contrast agents, those images also carry temperature information in situ, where the Upconverting nanoparticles (UCNPs) reside.
- SPLIT single-shot photoluminescence lifetime imaging thermometry
- both the dual-view data acquisition and the plug-and-play alternating direction method of multipliers support high imaging quality in single-shot photoluminescence lifetime imaging thermometry (SPLIT).
- SPLIT single-shot photoluminescence lifetime imaging thermometry
- View 1 preserves the spatial information in the dynamic scene.
- View 2 retains temporal information by optical streaking via time-to-space conversion.
- both views maximally keep rich spatiotemporal information.
- the dual-view plug-and-play alternating direction method of multipliers provides a powerful modular structure, which allows separated optimization of individual sub-optimization problems with an advanced denoising algorithm to generate high-quality image restoration results.
- Single-shot photoluminescence lifetime imaging thermometry is thus shown to offer a versatile photoluminescence lifetime imaging (PLI) temperature-sensing methods. In materials characterization, it could be used in the stress analysis of metal fatigue in turbine blades 55 . In biomedicine, it will be implemented for accurate sub-cutaneous temperature monitoring for theranostics of skin diseases, for example micro-melanoma. The microscopic temperature mapping ability of single-shot photoluminescence lifetime imaging thermometry (SPLIT) could also be exploited for the studies of temperature-regulated cellular signaling. Finally, the operation of single-shot photoluminescence lifetime imaging thermometry (SPLIT) may be extended to Stokes emission in rare-earth nanoparticles and spectrally resolved temperature mapping. All of these topics are promising research directions in the future.
- the optical chopper For synchronization of the single-shot photoluminescence lifetime imaging thermometry (SPLIT) system, the optical chopper outputs a TTL signal that is synchronized with the generated optical pulses.
- This TTL signal is input to a delay generator (Stanford Research Systems, DG 645), which then generates three synchronized TTL signals at 20 Hz.
- the first two signals are used to trigger the 3-ms exposure of the electron-multiplying charged-coupled device (EMCCD) and complementary metal oxide semiconductor (CMOS) cameras.
- the complementary metal oxide semiconductor (CMOS) camera is used to trigger a function generator (Rigol, DG1022Z) that outputs a 20-Hz sinusoidal waveform under the external burst mode to control the rotation of the galvanometer scanner.
- Parameters of single-shot photoluminescence lifetime imaging thermometry may be determined as follows.
- EMCD electron-multiplying charged-coupled device
- the imaging speed is determined by the data acquisition for View 2.
- the reconstructed movie has a frame rate as follows:
- N t ranges from 12 to 100 frames.
- s x and s y are the scaling factors in the x-direction and the y-direction.
- l x and l y represent translation factors in the x-direction and the y-direction.
- FIGS. 5 A, 5 B show the acquired images in View 1 and View 2.
- the co-registered View 1 image ( FIG. 5 C ) and the View 2 image were used for image reconstruction by single-shot photoluminescence lifetime imaging thermometry (SPLIT).
- I ⁇ arg ⁇ min I , v , u , w ⁇ A ⁇ ⁇ 1 2 ⁇ ⁇ Tv - E ⁇ 2 2 + R ⁇ ( u ) + I + ( w ) + ⁇ 1 2 ⁇ ⁇ MI - v + ⁇ 1 ⁇ 1 ⁇ 2 2 + ⁇ 2 2 ⁇ ⁇ I - u + ⁇ 2 ⁇ 2 ⁇ 2 2 + ⁇ 3 2 ⁇ ⁇ I - w + ⁇ 3 ⁇ 3 ⁇ 2 2 ⁇ . ( S4 )
- D is the identity matrix.
- D BM3D ( ⁇ ) stands for the block-matching and 3D filtering (BM3D) filtering.
- I k + 1 ( ⁇ 1 k ⁇ M T ⁇ M ⁇ D + ⁇ 2 k ⁇ D + ⁇ 3 k ⁇ D ) - 1 ⁇ [ ⁇ 1 k ⁇ M T ( v k + 1 - ⁇ 1 k ⁇ 1 k ) + ⁇ 2 k ( u k + 1 - ⁇ 2 k ⁇ 2 k ) + ⁇ 3 k ( w k + 1 - ⁇ 3 k ⁇ 3 k ) ] . ( S6 )
- ⁇ ( ⁇ >1) is the balancing factor
- ⁇ ( ⁇ >1) is the residual tolerance 13 .
- ⁇ (0 ⁇ 10 ⁇ 3 ) is the pre-set tolerance value.
- Step 4 The image reconstruction recovers the datacube of the dynamic scene.
- this dynamic scene was fed into single-shot photoluminescence lifetime imaging thermometry (SPLIT)'s forward model (Relation 1 hereinabove) to generate E 1 and E 2 .
- SPLIT photoluminescence lifetime imaging thermometry
- Gaussian noise (0.01 variance and 0 mean value) was added into E 1 and E 2 .
- PnP-ADMM dual-view plug-and-play alternating direction method of multipliers
- the reconstructed frames and ground truth frames are compared side by side in FIG. 6 A .
- the averaged peak signal-to-noise ratio and the averaged structural similarity index over all reconstructed images were calculated to be 34.6 dB and 0.96, respectively.
- the reconstructed three local features in Frame 1 are compared to their ground truths ( FIG. 6 B ).
- FIG. 6 C presents the reconstructed normalized intensity versus time, which has a good agreement with the pre-set intensity decay (black dashed line).
- ⁇ i represents the proportion of each exponential decays.
- “*” denotes convolution. The calculation result is given as follows:
- the lifetime is linearly linked to the temperature as follows:
- Core/shell NaGdF 4 2 mol % Er 3+ , 20 mol % Yb 3+ /NaGdF 4 upconverting nanoparticles (UCNPs) were synthesized via the previously reported thermal decomposition method, with minor modifications to the synthesis procedure.
- Core precursors were prepared by mixing 0.025 mmol of Er 2 O 3 (REacton 99.99%), 0.250 mmol Yb 2 O 3 (REacton 99.99+%), and 0.975 mmol Gd 2 O 3 (REacton 99.99+%) with 5 mL trifluoroacetic acid (99%) and 5 mL of distilled water in a 50 mL three-neck round bottom flask.
- Shell precursors were prepared separately by mixing 1.5 mmol of Gd 2 O 3 with 5 mL of trifluoroacetic acid and 5 ml of distilled water in a 50 mL three-neck round bottom flask. Mixtures were refluxed under vigorous stirring at 80° C. until each solution turned from turbid to clear, at which point the temperature was decreased to 60° C. to slowly evaporate the excess trifluoroacetic acid and water. All precursors were obtained as solid dried materials and were used for the upconverting nanoparticles (UCNPs) synthesis without further purification. All materials involved in the precursor synthesis (obtained from Alfa Aesar) were used without further purification.
- UCNPs upconverting nanoparticles
- the first step was to synthesize the core UCNPs.
- An initial mixture of 12.5 mL each of oleic acid (OA; 90%, Alfa Aesar) and 1-octadecene (ODE; 90%, Alfa Aesar) was prepared in a 100 mL three-neck round bottom flask (Solution A).
- Solution A 2.5 mmol of sodium trifluoroacetate (98%, Alfa Aesar) was added to the dried core precursor together with 7.5 mL each of oleic acid and 1-octadecene (Solution B). Both Solutions A and B were degassed at 145° C. under vacuum with magnetic stirring for 30 minutes.
- Solution A was placed under an inert Ar atmosphere and the temperature was slowly raised to 315° C.
- Solution B was then injected into the reaction vessel containing Solution A using a syringe and pump system (Harvard Apparatus, Pump 11 Elite) at a 1.5 mL/min injection rate. The mixture was left at 315° C. under vigorous stirring for 60 minutes.
- the synthesized core upconverting nanoparticles (UCNPs) were stored in Falcon centrifuge tubes (50 mL) under Ar for the further shelling step. Due to the evaporation of impurities in starting materials, for example OA and ODE) and reaction byproducts, as well as minor losses accrued from intermediate steps of liquid handling, the final volume of the core mixture was around 36 mL.
- UCNPs core/shell upconverting nanoparticles
- Solution A was prepared by mixing approximately 1.5 mmol of core upconverting nanoparticles (UCNPs) ( ⁇ 21.6 mL) in a 100 mL three-neck round bottom flask together with 9.2 mL each of OA and ODE.
- Solution B was prepared by mixing 3 mmol of gadolinium trifluoroacetate (shelling) precursors with 3 mmol of sodium trifluoroacetate, and 10.5 mL each of OA and ODE.
- Both solutions were degassed under vacuum and magnetic stirring at 110° C. for 30 minutes. After degassing, Solution A was back-filled with argon gas and the temperature was raised to 315° C. Solution B was then injected into the reaction vessel containing Solution A using a syringe and pump system at a 0.75 mL/min injection rate in three steps. After each about 7 mL injection step, the mixture was allowed to react for 60 minutes.
- a portion of core/shell upconverting nanoparticles would be extracted before the next injection step: 15.6 mL after the first injection step for core/shell upconverting nanoparticles (UCNPs) with a 1.9 nm-thick shell and 19.2 mL after the second injection step for core/shell upconverting nanoparticles (UCNPs) with a 3.5 nm-thick shell. Extractions were allowed to cool down to room temperature before transfer from glass syringe to Falcon centrifuge tube for subsequent washing. After the final injection step and a total of 180 minutes of reaction, the mixture (core/shell upconverting nanoparticles (UCNPs) with a 5.6 nm-thick shell) was cooled to room temperature under argon gas and magnetic stirring.
- UCNPs core/shell upconverting nanoparticles
- the morphology and size distribution of the core/shell upconverting nanoparticles were investigated by transmission electron microscopy (TEM, Philips, Tecnai 12). The particle size was determined from TEM images using ImageJ software with a minimum set size of 280 individual upconverting nanoparticles (UCNPs) per sample. The results are shown in FIG. 2 A .
- the crystallinity and phase of the core-only and core/shell upconverting nanoparticles (UCNPs) were determined via X-ray powder diffraction (XRD) analysis using a diffractometer (Bruker, D8 Advance) with CuK ⁇ radiation ( FIG. 7 ). The peaks in measured XRD spectra match the reference tabulated data (PDF #01-080-8787). Along with the TEM images ( FIG. 2 A ), this result ensured that the fabricated upconverting nanoparticles (UCNPs) are of the hexagonal crystal phase.
- the detection sensitivity of the single-shot photoluminescence lifetime imaging thermometry (SPLIT) system was characterized by imaging photoluminescence intensity decay with various power densities ( FIG. 8 ).
- Transparency of the letter “P” covered the sample of upconverting nanoparticles (UCNPs) with a shell thickness of 5.6 nm.
- the laser power density was varied from 0.4 to 0.04 W/mm 2 . All other experimental parameters, such as exposure time, camera gain, and temperature, were kept the same.
- the quality of reconstructed images kept degrading with decreased laser power density until partially losing spatial structure below 0.06 W/mm 2 .
- TCSPC time-correlated single-photon counting
- UCNPs upconverting nanoparticles
- SPLIT single-shot photoluminescence lifetime imaging thermometry
- TCSPC time-correlated single-photon counting
- FIGS. 10 A- 10 C show the time-integrated images by projecting datacubes reconstructed by the three algorithms along the time axis. Among them, the result from the dual-view plug-and-play alternating direction method of multipliers (PnP-ADMM) is duplicated from FIG. 2 F to better illustrate this comparison.
- FIGS. 10 G- 10 I show 2D lifetime maps of these samples with zoom-in-views of three local areas.
- Both the single-view and dual-view two-step iterative thresholding/shrinkage (TwIST) methods yield artifacts, manifesting as false lifetime values on pixels in the background.
- the dual-view-plug-and-play alternating direction method of multipliers (PnP-ADMM) eliminates these artifacts with a clean background.
- PnP-ADMM dual-view-plug-and-play alternating direction method of multipliers
- TwIST thresholding/shrinkage
- the relative temperature sensitivity can be as follows:
- S r in the pre-set temperature range were quantified to be 0.39-0.43% ⁇ ° C. ⁇ 1 for green emission and 0.52-0.60% ⁇ ° C. ⁇ 1 for red emission ( FIG. 11 ).
- ⁇ was characterized by repeating measurements using the single-shot photoluminescence lifetime imaging thermometry (SPLIT) system under the same experimental conditions. Specifically, using the sample of the 5.6 nm shell thickness upconverting nanoparticles (UCNPs) at 20° C., the 2D lifetime measurements were repeated 60 times using the excitation power density of 0.4 W/mm 2 and 0.06 W/mm 2 , respectively These measurements produced ⁇ of 1.4-2.7 ⁇ s for the green emission and 2.2-4.0 ⁇ s for the red emission, respectively. With known values of
- SPLIT single-shot photoluminescence lifetime imaging thermometry
- the upconverting nanoparticle (UCNP) sample with the shell thickness of 5.6 nm was covered by lift-out grids (Ted Pella, 460-2031-S), in which the features of the letter “O” with a triangular shape on the bottom and the letter “m” was selected. Then, fresh chicken tissue with a thickness of 0.25, 0.5, 0.65, 0.75, 1.0 mm was used to cover the sample ( FIG. 12 A ).
- the single-shot photoluminescence lifetime imaging thermometry (SPLIT) system captured the photoluminescence decay at 20 kfps. The reconstructed datacubes were projected to the x-y plane ( FIGS. 12 B, 12 C ).
- FIG. 12 D depicts the normalized intensity profiles across the white dashed line as shown in the first panel of FIG. 12 B .
- the experimental result was fitted using Beer's law 18 with an extinction coefficient of 0.26 cm ⁇ 1 .
- the triangular feature and the letter “m” cannot be distinguished.
- imaging depth of single-shot photoluminescence lifetime imaging thermometry (SPLIT) for red emission FIGS. 12 C, 12 E ) was characterized.
- the decay intensity of red emission was fitted with Beer's law with an extinction coefficient of 0.18 cm ⁇ 1 .
- the single-shot photoluminescence lifetime imaging thermometry (SPLIT) system performed photoluminescence lifetime imaging (PLI) at 20 kfps.
- PLI photoluminescence lifetime imaging thermometry
- the reconstructed datacubes with the different beef thicknesses were projected temporally, as shown in FIGS. 14 B, 14 C .
- the profile of a selected local edge feature of the inserted copper wire was plotted under the different thicknesses, as shown in FIGS. 14 D, 14 E .
- the contrast of these edge profiles were calculated.
- the values are 0.78, 0.27, 0.26, and 0.09 for the four selected curves.
- red emission these values are 0.80, 0.38, 0.33, and 0.09.
- the upconverting nanoparticles were precipitated with acetone (1 ⁇ 3 v/v) via centrifugation at 7500 rounds per minute (rpm) for 30 minutes.
- the obtained pellet was re-dispersed in 25 ml of 0.2 M trisodium citrate solution (pH 7-8) and left under stirring for an additional 2 hours.
- Upconverting nanoparticles (UCNPs) were then precipitated with acetone (1 ⁇ 3 v/v) via centrifugation at 7500 rpm for 30 minutes and washed twice with a mixture of water/acetone (1 ⁇ 3 v/v).
- the citrate-coated upconverting nanoparticles were re-dispersed in distilled water.
- the yellow household onion was used to peel single-layer sheets of onion cells, which were incubated in a solution of citrate-coated upconverting nanoparticles (UCNPs) (3 mg/ml) for 24 hours. After the incubation, single-layer onion cells were rinsed in distilled water and dried by gently tapping with a soft paper tissue, before being placed onto microscope slides for subsequent imaging experiments. Before lifetime imaging, the presence of upconverting nanoparticles (UCNPs) in single-layer onion cells was confirmed ( FIG. 15 A ) with a bright-field microscope (Nikon, ECLIPSE Ti-S).
- UCNPs upconverting nanoparticles
- a reference photoluminescence intensity image was taken by a custom-built confocal imaging platform (Photon Etc.), equipped with pulsed femtosecond Ti: Sapphire laser (Spectra-Physics, Mai Tai DeepSee). Samples were excited and imaged epi-fluorescently through a 20 ⁇ /0.40 NA objective lens (Nikon, CFI60 TU Plan Epi ELWD). Photoluminescence intensity was recorded by a low-noise CCD camera (Princeton Instruments, Pixis100). The upconversion emission images of static onion cells ( FIG. 15 B ) were obtained through raster scanning a 120 ⁇ 120 pixel map, each of which has the size of 2 ⁇ m and the integration time 0.2 s per pixel. The total time to form one lifetime map was 48 minutes.
- Streak cameras are highly suitable for 2D lifetime imaging.
- the field of view (FOV) of streak cameras is limited by an entrance slit with typical widths in a range between about 50 and about 100 ⁇ m.
- a sweeping unit deflects the time-of-arrival of the incident light signal along the axis perpendicular to the device's entrance slit.
- streak cameras can be generally categorized into optoelectronic and mechanical types.
- optoelectronic streak cameras FIG. 16 A
- incident photons are first converted to photoelectrons by a photocathode. After acceleration, these photoelectrons are deflected by a time-varying voltage applied on a pair of sweep electrodes.
- the optoelectronic streak camera can achieve a temporal resolution of up to 100 fs. Because of this ultrafast imaging ability, optoelectronic streak cameras have been used for imaging fluorescence that has lifetimes in the order of picoseconds and nanoseconds. However, due to the photon-to-photoelectron conversion by the photocathode, the quantum efficiency (QE) of the optoelectronic streak cameras is typically less than 15% for visible light.
- the space-charge effect in the electro-optic lens system imposes constraints in the spatial resolution, typically tens to hundreds of micrometers, and the dynamic range, for example less than 10 for certain femtosecond streak cameras. Both weaknesses severely limit the quality of acquired data.
- a mechanical streak camera usually uses a rotating mirror, for example a galvanometer scanner or a polygon mirror, to deflect the light. Since the mechanical sweeping is much slower than the optoelectronic counterpart, this type of streak camera has tunable temporal resolutions from hundreds of nanoseconds to microseconds, which makes them highly suitable for lifetime imaging of luminescence processes on the order of microseconds and milliseconds, such as phosphorescence and parity forbidden 4f-4f transitions in lanthanide ions.
- the all-optical data acquisition allows flexibly implementing many high-sensitivity cameras, for example electron-multiplying charged-coupled device (EMCCD) and scientific complementary metal oxide semiconductor (CMOS) cameras, whose QEs can be >90%, to obtain increased signal-to-noise ratios in measurements.
- ECCD electron-multiplying charged-coupled device
- CMOS scientific complementary metal oxide semiconductor
- the all-optical operation also avoids the space-charge effect, which enables optics-limited spatial resolution and high dynamic range, for example over 60,000, of the electron-multiplying charged-coupled device (EMCCD) camera used in the present discussion.
- the mechanical streak camera is considerably more cost-efficient than the optoelectronic streak camera. Therefore, mechanical streak cameras are more suitable for imaging microsecond-level emission from upconverting nanoparticles (UCNPs).
- UCNPs upconverting nanoparticles
- Single-shot compressed temporal imaging is a computational imaging method that enables 2D lifetime mapping in one acquisition.
- the entrance slit limits the imaging field of view (FOV) to 1D.
- compressed-sensing paradigms have been implemented with optoelectronic streak cameras.
- the resulted compressed ultrafast photography (CUP) technique allows complete opening of the entrance slit for 2D ultrafast imaging in a single shot.
- CUP and its variants have been applied to single-shot fluorescence lifetime imaging.
- single-shot compressed temporal imaging has not yet been applied to 2D imaging of microsecond-to-millisecond scale lifetimes, like those of upconverting nanoparticle (UCNP) emission.
- UCNP upconverting nanoparticle
- Single-shot photoluminescence lifetime imaging thermometry SPLIT
- SPLIT Single-shot photoluminescence lifetime imaging thermometry
- FIG. 17 To experimentally demonstrate the advantages of single-shot photoluminescence lifetime imaging thermometry (SPLIT) to line-scanning imaging, a moving photoluminescent sample was imaged ( FIG. 17 ).
- the upconverting nanoparticles (UCNPs) with the shell thickness of 5.6 nm were covered by transparency of letter “A”.
- This sample was loaded onto a translation stage. The sample moved along the y axis at a speed of 0.8 mm/s.
- a 150- ⁇ m-wide slit was placed at the intermediate image plane ( FIG. 17 A ). Attached to a translation stage, the slit was scanned in the x direction across the field of view (FOV), which generated seven lifetime maps ( FIG. 17 B ).
- FOV field of view
- the single-shot photoluminescence lifetime imaging thermometry (SPLIT) system provides high-sensitivity cameras with ultrahigh imaging speeds in 2D field of view (FOV).
- FOV 2D field of view
- SPLIT single-shot photoluminescence lifetime imaging thermometry
- the metal mask was loaded on a translation stage.
- the mask was kept out of the field of view (FOV) to keep its temperature at the room temperature in the laboratory.
- the upconverting nanoparticles (UCNPs) were still heated up by the blackbody radiator to 27° C.
- the mask was quickly moved into the field of view (FOV), and the thermal imaging camera captured the images immediately ( FIG. 18 F ).
- the thermal image and the selected line profiles are shown in FIGS. 18 H, 18 I .
- the image quality is still incomparable to the results produced by the single-shot photoluminescence lifetime imaging thermometry (SPLIT) ( FIGS. 18 D, 18 F ).
- SPLIT single-shot photoluminescence lifetime imaging thermometry
- the present optical temperature mapping method synergistically combines dual-view optical streak imaging with compressed sensing, to record wide-field luminescence decay of Er 3 ⁇ , Yb 3 ⁇ co-doped NaGdF 4 upconverting nanoparticles in real time, from which a lifetime-based 2D temperature map is obtained in a single exposure.
- the method enables high-resolution longitudinal temperature monitoring beneath a thin scattering medium and dynamic temperature tracking of a moving biological sample at single-cell resolution.
- a method comprises producing wide-field illumination to upconverting nanoparticles at the object plane, by expanding the laser beam diameter, using a 4f system or an optical beam expander for example.
- the near-infrared excited upconverting nanoparticles emit upconverted phosphorescence light in the visible spectrum.
- the decay of the emitted light intensity over the 2D field of view is a dynamic scene I(x,y,t).
- the emitted light is collected and equally divided into a reflected component and a transmitted component.
- the method then comprises imaging the reflected component (View 1) by spatiotemporal integration using a CMOS camera, a CCD camera, a sCMOS camera, or a EMCCD camera for example, and imaging the transmitted component (View 2) by spatial encoding using a printed mask or a spatial light modulator such as a digital micro-mirror device, or a printed mask loaded on a translation stage, temporal shearing, using a rotating mirror such as a galvanometer scanner, a polygonal scanner or a resonant scanner for example, and spatiotemporal integration, using a highly sensitive cameras such as an EMCCD or a global shutter sCMOS for example.
- the data of the images are processed for denoising, cropping, and calibration of the obtained two views, and video reconstruction or compressed sensing based video reconstruction is performed.
- the present single-shot phosphorescence lifetime imaging thermometry method high parallelism in the data acquisition improves the overall light throughput.
- the method comprising single-shot temperature sensing over a 2D field of view, allows improved measurement accuracy by avoiding scanning motion artifacts and laser intensity fluctuation.
- the present single-shot phosphorescence lifetime imaging thermometry method and system extend the application scope of phosphorescence lifetime imaging to observing non-repeatable temperature dynamics. They allow high tunability of imaging speeds, which accommodates a variety of upconverting nanoparticles with a wide lifetime span.
- both the dual-view data acquisition and the PnP-ADMM algorithm support high imaging quality in the present single-shot phosphorescence lifetime imaging thermometry system and method.
- View 1 preserves the spatial information in the dynamic scene.
- View 2 retains temporal information by optical streaking via time-to-space conversion.
- both views maximally keep rich spatiotemporal information.
- the dual-view PnP-ADMM algorithm provides a powerful modular structure, which allows separated optimization of individual sub-optimization problem with an advanced denoising algorithm to generate high-quality image restoration results.
- the present single-shot phosphorescence lifetime imaging thermometry method and system provide a versatile temperature-sensing platform. In materials characterization, they may be used in the stress analysis of metal fatigue in turbine blades. In biomedicine, they may be implemented for accurate sub-cutaneous temperature monitoring for theranostics of skin diseases such as melanoma. The microscopic temperature mapping ability may also be exploited for the studies of temperature-regulated cellular signaling. Finally, the operation of the method and system may be extended to Stokes emission in rare-earth nanoparticles and spectrally resolved temperature mapping.
Landscapes
- Physics & Mathematics (AREA)
- Spectroscopy & Molecular Physics (AREA)
- General Physics & Mathematics (AREA)
- Engineering & Computer Science (AREA)
- Optics & Photonics (AREA)
- Multimedia (AREA)
- Signal Processing (AREA)
- Computing Systems (AREA)
- Theoretical Computer Science (AREA)
- Investigating, Analyzing Materials By Fluorescence Or Luminescence (AREA)
Abstract
Description
E=TMI(x,y,t), (1)
where E is the concatenation of measurements [E1, αE2]T, M is a linear operator [1, αSC]T, and α is a scalar factor introduced to balance the energy ratio between the two
is a fidelity term representing the similarity between the measurement and the estimated result. R(·) is the implicit regularizer that promotes sparsity in the dynamic scene. I+(·) represents a non-negative intensity constraint
E=TMI, (1)
-
- E denotes the concatenation of measurements [E1, αE2]T, M denotes the linear operator [1, αSC]T, and α is a scalar factor introduced to balance the energy ratio between the two views during measurement. The hardware of the single-shot photoluminescence lifetime imaging thermometry (SPLIT) system is synchronized for capturing both views (detailed in Methods) that are calibrated before data acquisition (see
Supplementary Note 1 andFIG. 5 ).
- E denotes the concatenation of measurements [E1, αE2]T, M denotes the linear operator [1, αSC]T, and α is a scalar factor introduced to balance the energy ratio between the two views during measurement. The hardware of the single-shot photoluminescence lifetime imaging thermometry (SPLIT) system is synchronized for capturing both views (detailed in Methods) that are calibrated before data acquisition (see
-
- ∥·∥2 represents the l2 norm. The fidelity term,
represents the similarity between the measurement and the estimated result. R(·) is the implicit regularizer that promotes sparsity in the dynamic scene. I+(·) represents a non-negative intensity constraint. Compared to existing reconstruction schemes, the plug-and-play alternating direction method of multipliers (PnP-ADMM) method implements a variable splitting strategy with a state-of-the-art denoiser to obtain fast and closed-form solutions to each sub-optimization problem, which produces a high image quality in reconstruction (see
-
- ct is a constant, and Sa is the absolute temperature sensitivity. The derivation of
Relation 3 is detailed inSupplementary Note 4 hereinbelow. Leveraging the intrinsic frame rate of the electron-multiplying charged-coupled device (EMCCD) camera, the photoluminescence lifetime imaging thermometry (SPLIT) system can generate lifetime-determined temperature maps at a video rate of 20 Hz.
- ct is a constant, and Sa is the absolute temperature sensitivity. The derivation of
-
- Vg is the voltage added onto the GS. γa is a constant that links Vg with GS's deflection angle with the consideration of the input waveform. fs=100 mm is the focal length of lens L5, ts=50 ms is the period of the sinusoidal voltage waveform added to the GS, and d=13 μm is the electron-multiplying charged-coupled device (EMCCD) sensor's pixel size. In the present example, the voltage is varied from V=0.24-1.11 V. Thus, the imaging speed of the photoluminescence lifetime imaging thermometry (SPLIT) system ranges from 4 to 33 kfps. In addition, the exposure time of the electron-multiplying charged-coupled device (EMCCD) and complementary metal oxide semiconductor (CMOS) cameras, te, is determined by the sequence depth, Nt, and the frame rate as follows:
-
- Supplementary Note 1: Two-view image registration of the single-shot photoluminescence lifetime imaging thermometry (SPLIT) system.
[u c v c1]T =P t [uv1]T. (S2)
-
- Supplementary Note 2: Derivation of the reconstruction by single-shot photoluminescence lifetime imaging thermometry (SPLIT).
-
- u, and w are primal variables. A is the set of possible solutions in compliance with the spatial constraint, which is generated by binarizing the image E1 in
View 1 with an appropriate intensity threshold that is determined by the Otsu's method. Then, Relation S3 is further written in the augmented Lagrangian arguments as follows:
- u, and w are primal variables. A is the set of possible solutions in compliance with the spatial constraint, which is generated by binarizing the image E1 in
-
- γ1, γ2, and γ3 are dual variables. μ1, μ2, and μ3 are penalty parameters The block-matching and 3D filtering (BM3D) is used as the plug-and-play (PnP) denoiser in the implicit regularizer R(·). The ramp function12 is used in the non-negative indicator function I+(·).
-
- Step 1: update primal variables v, u, and w as follows:
-
- Step 2: update the estimated datacube of the dynamic scene I(x, y, t) as follows:
-
- Step 3: update the penalty parameters μ1, μ2, and μ3 as follows:
-
- Step 4: judge the relative change in results and the parameters μ1 k+1, μ2 k+1, and μ3 k+1 in adjacent iterations as follows:
-
- Step 5: if the convergence is unmet, update dual variables γ1, γ2, and γ3 as follows:
γ1 k+1=γ1 k+μ1 k+1(MI k+1 −v k+1),
γ2 k+1=γ2 k+μ2 k+1(I k+1 −u k+1), and (S9)
γ3 k+1=γ3 k+μ3 k+1(I k+1 −w k+1).
- Step 5: if the convergence is unmet, update dual variables γ1, γ2, and γ3 as follows:
-
- Supplementary Note 3: Simulation results of the dual-view plug-and-play alternating direction method of multipliers (PnP-ADMM).
-
- Supplementary Note 4: Details on the relationship between temperature and lifetime
L t=∫0 ∞ f(t)*g(t)dt. (S10)
represents the Gaussian excitation pulse with a pulse width of tw. g(t)=Σεiexp (−t/τi) is used to represent the photoluminescence with multiple exponential decays, each of which has a lifetime τi. εi represents the proportion of each exponential decays. “*” denotes convolution. The calculation result is given as follows:
L t=Σεiτi. (S12)
-
- Supplementary Note 5: Preparation and characterization of upconverting nanoparticles (UCNPs).
-
- Supplementary Note 6: characterization of sensitivity of single-shot photoluminescence lifetime imaging thermometry (SPLIT) system.
-
- Supplementary Note 7: Measurement of photoluminescence lifetimes of upconverting nanoparticles (UCNPs) using time-correlated single-photon counting (TCSPC) method.
-
- Supplementary Note 8: Comparison of reconstructed image quality.
-
- Supplementary Note 9: Determination of the absolute temperature sensitivities, relative temperature sensitivities, and thermal uncertainty.
-
- where δτ represents the uncertainty in the measured lifetimes. Relation (S15) shows that δT depends on both the UCNPs' performance (quantified by the relative sensitivity, Sr) and experimental setup (that limits the normalized fluctuation of lifetimes,
δτ was characterized by repeating measurements using the single-shot photoluminescence lifetime imaging thermometry (SPLIT) system under the same experimental conditions. Specifically, using the sample of the 5.6 nm shell thickness upconverting nanoparticles (UCNPs) at 20° C., the 2D lifetime measurements were repeated 60 times using the excitation power density of 0.4 W/mm2 and 0.06 W/mm2, respectively These measurements produced δτ of 1.4-2.7 μs for the green emission and 2.2-4.0 μs for the red emission, respectively. With known values of |Sa| and by using Relation (S15), single-shot photoluminescence lifetime imaging thermometry (SPLIT)'s thermal uncertainty was calculated to be 0.7-1.4° C. for the green emission and 0.9-1.7° C. for the red emission.
-
- Supplementary Note 10: characterization of imaging depth of single-shot photoluminescence lifetime imaging thermometry (SPLIT) in biological environment.
-
- Supplementary Note 11: preparation of the single-layer onion cells doped with upconverting nanoparticles (UCNPs).
-
- Supplementary Note 12: comparison between single-shot photoluminescence lifetime imaging thermometry (SPLIT) system and streak-camera-based modalities for 2D lifetime imaging.
-
- Supplementary Note 13: in a comparison test between single-shot photoluminescence lifetime imaging thermometry (SPLIT) and thermal imaging, a thermal imaging camera (Yoseen, X384D) (
FIG. 18A ) and single-shot photoluminescence lifetime imaging thermometry (SPLIT) (FIG. 18B ) were used to image upconverting nanoparticles (UCNPs) covered by a metal mask of letters “rob” (Ted Pella, 460-2031-S). Akin to the single-shot photoluminescence lifetime imaging thermometry (SPLIT) system, a 4× magnification ratio was used for the thermal imaging camera. A blackbody radiator (Yoseen, YSHT-35) was used to heat this sample to 27° C. The images produced by these two methods are shown inFIGS. 18C, 18D and the selected line profiles are shown inFIGS. 18E, 18F . The edge contrast of the imaged letters using the thermal imaging camera is lower than that when using SPLIT. Moreover, the thermal imaging result presents strong background due to the same temperature of the mask, whereas single-shot photoluminescence lifetime imaging thermometry (SPLIT) keeps a clean background thanks to its optical sensing.
- Supplementary Note 13: in a comparison test between single-shot photoluminescence lifetime imaging thermometry (SPLIT) and thermal imaging, a thermal imaging camera (Yoseen, X384D) (
| TABLE 1 | ||||||
| Sequential 1D | Sequential ID | |||||
| ultrafast | ultrahigh-speed | |||||
| photography | photography | |||||
| CUP [21] | LLE-CUP [22] | CUSP [24] | [19] | [20] | SPLIT | |
| Application | Macroscopic | High-speed | Spectrally | FILM [25] | PpLIM | Video-rate PLI |
| FLI | Film [23] | resolved FILM | thermometry | |||
| Imaging scheme | Compressed | Compressed | Compressed | Line-scanning | Line-scanning | Compressed |
| streak imaging | streak imaging | streak imaging | streak imaging | |||
| Single-shot 2D | Yes | Yes | Yes | No | No | Yes |
| mapping | ||||||
| Throughput | High | High | High | Low | | High |
| Inter-frame |
| 10 | ps | 10-20 | |
2 | |
50 | ps | 5.8 ns-4.7 μs | 30-250 | μs |
| interval |
| Recording time | 3.5 | ns | 3.5 ns-20 ns | 0.8 | ns | 1-10 | μs | 52 ns-5 ms | 3.0 | ms |
| window |
| Spatial resolution | 1.67 | mm | ≥0.2 | μm | N/A | N/ |
1 |
20 | μm |
| Applicability to | Yes | Yes | Yes | No | No | Yes |
| dynamic samples | ||||||
| Type of streak | Optoelectronic | Optoelectronic | Optoelectronic | Optoelectronic | Mechanical | Mechanical |
| camera | ||||||
| Cost | High | High | High | High | Low | Low |
| Size | Big | Big | Big | Big | Small | Small |
| Quantum | Moderate | Moderate | Moderate | Moderate | High | High |
| efficiency (QE) | ||||||
| Power | High | High | High | High | Low | Low |
| consumption | ||||||
Claims (18)
Priority Applications (1)
| Application Number | Priority Date | Filing Date | Title |
|---|---|---|---|
| US17/893,784 US12130186B2 (en) | 2021-08-23 | 2022-08-23 | Method and system for real-time wide-field dynamic temperature sensing |
Applications Claiming Priority (2)
| Application Number | Priority Date | Filing Date | Title |
|---|---|---|---|
| US202163260511P | 2021-08-23 | 2021-08-23 | |
| US17/893,784 US12130186B2 (en) | 2021-08-23 | 2022-08-23 | Method and system for real-time wide-field dynamic temperature sensing |
Publications (2)
| Publication Number | Publication Date |
|---|---|
| US20230071896A1 US20230071896A1 (en) | 2023-03-09 |
| US12130186B2 true US12130186B2 (en) | 2024-10-29 |
Family
ID=85278735
Family Applications (1)
| Application Number | Title | Priority Date | Filing Date |
|---|---|---|---|
| US17/893,784 Active 2042-12-08 US12130186B2 (en) | 2021-08-23 | 2022-08-23 | Method and system for real-time wide-field dynamic temperature sensing |
Country Status (2)
| Country | Link |
|---|---|
| US (1) | US12130186B2 (en) |
| CA (1) | CA3170991A1 (en) |
Cited By (1)
| Publication number | Priority date | Publication date | Assignee | Title |
|---|---|---|---|---|
| US20240328949A1 (en) * | 2021-04-12 | 2024-10-03 | Purdue Research Foundation | Fluorescence-Detected Mid-Infrared Photothermal Microscopy |
Families Citing this family (5)
| Publication number | Priority date | Publication date | Assignee | Title |
|---|---|---|---|---|
| CN116285575B (en) * | 2023-03-15 | 2024-03-29 | 北京机电工程总体设计部 | Flame flow ablation experiment back temperature micro-area imaging coating, preparation and use methods |
| CN116429692B (en) * | 2023-04-24 | 2026-01-02 | 中国科学技术大学 | A full-coverage line-scan Raman microscopy system and its imaging method |
| US20250102822A1 (en) * | 2023-09-27 | 2025-03-27 | Onto Innovation Inc. | Blur reduction techniques for semiconductor inspection |
| CN117554288B (en) * | 2023-11-14 | 2024-05-28 | 浙江大学 | A luminescence lifetime imaging system and method based on compressed sensing using digital micromirror devices |
| CN118962719A (en) * | 2024-10-16 | 2024-11-15 | 吉林财经大学 | Laser scanning imaging and temperature measurement system and method for campus classroom environment |
Citations (3)
| Publication number | Priority date | Publication date | Assignee | Title |
|---|---|---|---|---|
| US5705821A (en) | 1996-11-07 | 1998-01-06 | Sandia Corporation | Scanning fluorescent microthermal imaging apparatus and method |
| US20050169348A1 (en) * | 2002-06-06 | 2005-08-04 | Wei Chen | Nanoparticle thermometry and pressure sensors |
| WO2021102580A1 (en) | 2019-11-26 | 2021-06-03 | Photon Control Inc. | Phosphor thermometry imaging system and control system |
-
2022
- 2022-08-23 US US17/893,784 patent/US12130186B2/en active Active
- 2022-08-23 CA CA3170991A patent/CA3170991A1/en active Pending
Patent Citations (3)
| Publication number | Priority date | Publication date | Assignee | Title |
|---|---|---|---|---|
| US5705821A (en) | 1996-11-07 | 1998-01-06 | Sandia Corporation | Scanning fluorescent microthermal imaging apparatus and method |
| US20050169348A1 (en) * | 2002-06-06 | 2005-08-04 | Wei Chen | Nanoparticle thermometry and pressure sensors |
| WO2021102580A1 (en) | 2019-11-26 | 2021-06-03 | Photon Control Inc. | Phosphor thermometry imaging system and control system |
Non-Patent Citations (58)
| Title |
|---|
| A. Pickel et al., Apparent self-heating of individual upconverting nanoparticle thermometers, Nature Communications | (2018) 9:4907. |
| A. Skripka et al., Spectral characterization of LiYbF4 upconverting nanoparticles, Nanoscale, 2020, 12, 17545-17554. |
| B. Xiong et al., Luminescence lifetime imaging using a cellphone camera with an electronic rolling shutter, vol. 45, No. 1 / Jan. 1, 2020 / Optics Letters. |
| C D.S. Brites et al., Thermometry at the nanoscale, Nanoscale, 2012, 4, 4799. |
| C. Wang et al., Determining intracellular temperature at single-cell level by a novel thermocouple method, Cell Research (2011) 21:1517-1519. |
| D Obermayer et al., On the importance of simultaneous infrared/fiber-optic temperature monitoring in the microwave-assisted synthesis of ionic liquids, Org. Biomol. Chem., 2010, 8, 114-121. |
| D. Jaque et al., Luminescence nanothermometry†, Nanoscale, 2012, 4, 4301. |
| E.M. Graham et al., Quantitative mapping of aqueous microfluidic temperature with sub-degree resolution using fluorescence lifetime imaging microscopy†, Lab Chip, 2010, 10, 1267-1273. |
| F. Auzel, Upconversion and Anti-Stokes Processes with f and d Ions in Solids, Chem. Rev. 2004, 104, 139-173. |
| F. Vetrone et al., Temperature Sensing Using Fluorescent Nanothermometers, ACS NANO, vol. 4, No. 6, May 4, 2010. |
| G. Schlegel et al., Fluorescence Decay Time of Single Semiconductor Nanocrystals, Physical Review Letters, vol. 88, No. 13, Apr. 1, 2022. |
| H Kurikawa et al., High resolution imaging of intracellular oxygen concentration by phosphorescence lifetime, Scientific Reports | 5:10657 | DOi: 10.1038/srep10657, 2015. |
| H S Jung et al., Organic molecule-based photothermal agents: an expanding photothermal therapy universe, Chem. Soc. Rev., 2018, 47, 2280. |
| H. Qin et al., Tuning the upconversion photoluminescence lifetimes of NaYF4:Yb3+ , Er3+ through lanthanide Gd3+ doping, Scientific Reports | (2018) 8:12683. |
| H. Zhang et al., Dual-Emissive Phosphorescent Polymer Probe for Accurate Temperature Sensing in Living Cells and Zebrafish Using Ratiometric and Phosphorescence Lifetime Imaging Microscopy, ACS Appl. Mater. Interfaces 2018, 10, 1754217550. |
| H.Gao et al., A simple yet effective AIE-based fluorescent nanothermometer for temperature mapping in living cells using fluorescence lifetime imaging microscopyt, Nanoscale Horiz., 2020, 5, 488. |
| I. Rostami et al., Breakthroughs in medicine and bioimaging with up-conversion nanoparticles, International Journal of Nanomedicine 2019:14 7759-7780. |
| J Liang et al., Single shot real-time video recording of a photonic Mach cone induced by a scattered light pulse, Sci. Adv. 2017; 3 : e1601814 Jan. 20, 2017. |
| J Liang et al., Single-shot real-time femtosecond imaging of temporal focusing, Science & Applications (2018) 7:42. |
| J Liang et al., Single-shot stereo-polarimetric compressed ultrafast photography for light-speed observation of high-dimensional optical transients with picosecond resolution, Nature Communications | (2020) https://doi.org/10.1038/s41467-020-19065-5. |
| J. Zhou et al., Advances and challenges for fluorescence nanothermometry, NAtURe MethoDS | vol. 17 | Oct. 2020 | 967-980. |
| K. Maciejewaska et al., NIR luminescence lifetime nanothermometry based on phonon assisted Yb3+-Nd3+ energy transfer, Nanoscale Adv. 2021. |
| K. Suhling et al., Fluorescence lifetime imaging (FLIM): Basic concepts and some recent developments, Medical Photonics (2015) 27, 3-40. |
| K. Suhling et al., Wide-field TCSPC-based fluorescence lifetime imaging (FLIM) Microscopy, Proc. of SPIE vol. 9858 98580J-1, 2016. |
| L Labrador-Paez et al., Reliability of rare-earth-doped infrared luminescent nanothermometers, Nanoscale, 2018, 10, 22319. |
| L.Gao et al., Single-cell photoacoustic thermometry, Journal of Biomedical Optics 18(2), 026003 (Feb. 2013). |
| L.M. Hirvonen et al., Photon counting phosphorescence lifetime imaging with TimepixCam, Review of Scientific Instruments 88, 013104 (2017). |
| Liang, Punching holes in light: recent progress in single-shot coded-aperture optical imaging, Rep. Prog. Phys. 83 (2020) 116101 (32pp). |
| M. Tan et al., Accurate In Vivo Nanothermometry through NIR-II Lanthanide Luminescence Lifetime, Small 2020, 16, 2004118. |
| M.P. Wood et al., Simultaneous Temperature, Concentration, and Pressure Imaging of Water Vapor in a Turbine Engine, EEE Sensors Journal, vol. 15, No. 1, Jan. 2015. |
| N Inada et al., Temperature imaging using a cationic linear fluorescent polymeric thermometer and fluorescence lifetime imaging microscopy, Nature Protocols | vol. 14 | Apr. 2019 | 1293-1321. |
| P S. Chelushkin, Phosphorescence Lifetime Imaging (PLIM): State of the Art and Perspectives, Progress in Photon Science, Springer Series in Chemical Physics 119-2019. |
| P. R. N. Childs et al., Review of temperature measurement, Review of Scientific Instruments vol. 71. No. 8 Aug. 2000. |
| P. Stanley May et al., Tutorial on the acquisition, analysis, and interpretation of upconversion luminescence data, Methods Appl. Fluoresc. 7 (2019) 023001. |
| P. Wang et al., Single-shot ultrafast imaging attaining 70 trillion frames per second, Nature Communications | (2020) 11:2091. |
| P.Bolek et al., Ga-modified YAG:Pr3+ dual-mode tunable luminescence thermometers, Chemical Engineering Journal 421 (2021) 129764. |
| P.V. Dos Santos et al., Optical temperature sensing using upconversion Fluorescence emission in Er31 /Yb31—codoped chalcogenide glass, Applied Physics Letters vol. 73, No. 5 Aug. 3, 1998. |
| R Datta et al., Fluorescence lifetime imaging microscopy: fundamentals and advances in instrumentation, analysis, and applications, J. Biomed. Opt. 25(7), 071203 (2020). |
| R K.P. Benninger et al., Quantitative 3D Mapping of Fluidic Temperatures within Microchannel Networks Using Fluorescence Lifetime Imaging, Anal. Chem. 2006, 78, 2272-2278. |
| R. Franke et al., Frequency-domain fluorescence lifetime imaging system (pco.flim) based on a in-pixel dual tap control CMOS image sensor, SPIE BiOS, 2015. |
| R. Sen et al., New luminescence lifetime macro-imager based on a Tpx3Cam optical camera, vol. 11, No. 1/ Jan. 1, 2020 / Biomedical Optics Express. |
| R. Wang et al., Thermomechanical fatigue experiment and failure analysis on a nickel-based superalloy turbine blade, Engineering Failure Analysis 102 (2019) 35-45. |
| S H. Chan et al., Plug-and-Play ADMM for Image Restoration: Fixed Point Convergence and Applications, arXiv:1605.01710v2 [cs.CV] Nov. 11, 2016. |
| S L Jacques, Corrigendum: Optical properties of biological tissues: a review, Phys. Med. Biol. 58 (2013) 5007-5008. |
| S W Allison et al., Nanoscale thermometry via the fluorescence of YAG:Ce phosphor particles: measurements from 7 to 77° C, Nanotechnology 14 (2003) 859-863. |
| S. Howard et al., Frequency-multiplexed in vivo multiphoton phosphorescence lifetime microscopy, Nature Photonics | vol. 7 | Jan. 2013. |
| T.T. Basiev et al., Multiphonon Relaxation of the Energy of Electronic Excitation in Optical Crystals Doped with Rare-Earth Ions, Laser Physics, vol. 7, No. 6, 1997, pp. 1139-1152. |
| W. Becker, lifetime imaging—techniques and applications, Journal of Microscopy, vol. 247, Pt 2 2012, pp. 119-136. |
| W. Snyder, Classification-based Emissivity for Land Surface Temperature Measurement from Space, May 24, 2005. |
| X. Liu et al., Single-shot compressed optical-streaking ultra-high-speed photography, vol. 44, No. 6 / Mar. 15, 2019 / Optics Letters. |
| X. Liu et al., Single-shot real-time sub-nanosecond electron imaging aided by compressed sensing: Analytical modeling and simulation, Micron 117 (2019) 47-54. |
| X. Yuan et al., Compressive Hyperspectral Imaging With Side Information, IEEE Journal of Selected Topics in Signal Processing, vol. 9, No. 6, Sep. 2015. |
| X. Yuan et al., Plug-and-Play Algorithms for Large-scale Snapshot Compressive Imaging, arXiv:2003.13654v2 [eess.IV] Jul. 17, 2020. |
| Y. Liu et al., Rank Minimization for Snapshot Compressive Imaging, arXiv:1807.07837v1 [cs.CV] Jul. 20, 2018. |
| Y. Shen et al., Ag2S Nanoheaters with Multiparameter Sensing for Reliable Thermal Feedback during In Vivo Tumor Therapy, Adv. Funct. Mater. 2020, 30, 2002730. |
| Y. Shen et al., In Vivo Spectral Distortions of Infrared Luminescent Nanothermometers Compromise Their Reliability, ACS Nano 2020, 14, 4122-4133. |
| Z Chen et al., Phosphorescent Polymeric Thermometers for In Vitro and In Vivo Temperature Sensing with Minimized Background Interference, Adv. Funct. Mater. 2016, 26, 4386-4396. |
| Z. Zhang et al., Near-Infrared Light-Mediated Nanoplatforms for Cancer Thermo-Chemotherapy and Optical Imaging, Adv. Mater. 2013, 25, 3869-3880. |
Cited By (2)
| Publication number | Priority date | Publication date | Assignee | Title |
|---|---|---|---|---|
| US20240328949A1 (en) * | 2021-04-12 | 2024-10-03 | Purdue Research Foundation | Fluorescence-Detected Mid-Infrared Photothermal Microscopy |
| US12449363B2 (en) * | 2021-04-12 | 2025-10-21 | Purdue Research Foundation | Fluorescence-detected mid-infrared photothermal microscopy |
Also Published As
| Publication number | Publication date |
|---|---|
| US20230071896A1 (en) | 2023-03-09 |
| CA3170991A1 (en) | 2023-02-23 |
Similar Documents
| Publication | Publication Date | Title |
|---|---|---|
| US12130186B2 (en) | Method and system for real-time wide-field dynamic temperature sensing | |
| Liu et al. | Fast wide-field upconversion luminescence lifetime thermometry enabled by single-shot compressed ultrahigh-speed imaging | |
| JP7336654B2 (en) | Processing system, data processing device, display system and microscope system | |
| JP7424286B2 (en) | Fluorescence observation device and fluorescence observation method | |
| US9569828B2 (en) | Method and apparatus for the imaging of a labeled biological sample | |
| US9383570B2 (en) | Image analysis method and image analysis apparatus | |
| US10416427B2 (en) | Scan-based imaging with variable scan speed using predictions of region-of-interest positions | |
| EP3315595A1 (en) | Determination device, determination program, determination method, cell sheet manufacturing device, and cell sheet manufacturing method | |
| EP3775851B1 (en) | Method and apparatus for simultaneous nonlinear excitation and detection of different chromophores across a wide spectral range using ultra-broadband light pulses and time-resolved detection | |
| CN109916867B (en) | Fluorescence intensity related time-resolved enhanced imaging method and device | |
| Becker et al. | Simultaneous fluorescence and phosphorescence lifetime imaging | |
| US20240394880A1 (en) | Photon absorption remote sensing system for histological assessment of tissues | |
| Mancebo et al. | Precisely calibrated and spatially informed illumination for conventional fluorescence and improved PALM imaging applications | |
| JP2006275964A (en) | Shading correction method for scanning fluorescence microscope | |
| JP2013109205A (en) | Image detection device | |
| Santos et al. | Compressive single pixel phosphorescence lifetime and intensity simultaneous imaging: a pilot study using oxygen sensitive biomarkers | |
| US20250224603A1 (en) | Video rate spontaneous raman imaging and method for using | |
| US20190003967A1 (en) | Method for creating a digital fluorescent image | |
| Van der Voort et al. | Confocal scanning laser fluorescence and reflection microscopy: Measurements of the 3-D image formation and applications in biology | |
| You et al. | NIR‐II Temporal Compressive Wide‐Field Microscope (TCWM) Achieving Fluorescent Dynamic Imaging Beyond Camera Frame Rate | |
| Stoltzfus | Wide field of view two-photon excited fluorescence imaging, theory and applications | |
| Niu et al. | Multispectral Multiphoton Fluorescence Lifetime Imaging Microscopy Based on a Synchroscan Streak Camera | |
| Liu | Computational Imaging Using Spatially Modulated Optical Fields | |
| Aviles-Espinosa et al. | Cell division stage in C. elegans imaged using third harmonic generation microscopy | |
| Webb et al. | ‘5-D’fluorescence microscopy |
Legal Events
| Date | Code | Title | Description |
|---|---|---|---|
| FEPP | Fee payment procedure |
Free format text: ENTITY STATUS SET TO UNDISCOUNTED (ORIGINAL EVENT CODE: BIG.); ENTITY STATUS OF PATENT OWNER: LARGE ENTITY |
|
| AS | Assignment |
Owner name: INSTITUT NATIONAL DE LA RECHERCHE SCIENTIFIQUE, CANADA Free format text: ASSIGNMENT OF ASSIGNORS INTEREST;ASSIGNOR:LIU, XIANGLEI;REEL/FRAME:060883/0915 Effective date: 20210803 Owner name: INSTITUT NATIONAL DE LA RECHERCHE SCIENTIFIQUE, CANADA Free format text: ASSIGNMENT OF ASSIGNORS INTEREST;ASSIGNOR:VETRONE, FIORENZO;REEL/FRAME:060884/0040 Effective date: 20210910 Owner name: INSTITUT NATIONAL DE LA RECHERCHE SCIENTIFIQUE, CANADA Free format text: ASSIGNMENT OF ASSIGNORS INTEREST;ASSIGNOR:SKRIPKA, ARTIOM;REEL/FRAME:060883/0954 Effective date: 20210728 Owner name: INSTITUT NATIONAL DE LA RECHERCHE SCIENTIFIQUE, CANADA Free format text: ASSIGNMENT OF ASSIGNORS INTEREST;ASSIGNOR:LIANG, JINYANG;REEL/FRAME:060883/0779 Effective date: 20210722 Owner name: INSTITUT NATIONAL DE LA RECHERCHE SCIENTIFIQUE, CANADA Free format text: ASSIGNMENT OF ASSIGNORS INTEREST;ASSIGNOR:LIU, MIAO;REEL/FRAME:060884/0141 Effective date: 20220719 Owner name: INSTITUT NATIONAL DE LA RECHERCHE SCIENTIFIQUE, CANADA Free format text: ASSIGNMENT OF ASSIGNORS INTEREST;ASSIGNOR:LAI, YINGMING;REEL/FRAME:060884/0094 Effective date: 20220719 |
|
| STPP | Information on status: patent application and granting procedure in general |
Free format text: DOCKETED NEW CASE - READY FOR EXAMINATION |
|
| STPP | Information on status: patent application and granting procedure in general |
Free format text: NON FINAL ACTION MAILED |
|
| STPP | Information on status: patent application and granting procedure in general |
Free format text: RESPONSE TO NON-FINAL OFFICE ACTION ENTERED AND FORWARDED TO EXAMINER |
|
| STPP | Information on status: patent application and granting procedure in general |
Free format text: NOTICE OF ALLOWANCE MAILED -- APPLICATION RECEIVED IN OFFICE OF PUBLICATIONS |
|
| STPP | Information on status: patent application and granting procedure in general |
Free format text: NOTICE OF ALLOWANCE MAILED -- APPLICATION RECEIVED IN OFFICE OF PUBLICATIONS |
|
| STPP | Information on status: patent application and granting procedure in general |
Free format text: AWAITING TC RESP., ISSUE FEE NOT PAID |
|
| STPP | Information on status: patent application and granting procedure in general |
Free format text: AWAITING TC RESP, ISSUE FEE PAYMENT VERIFIED |
|
| STPP | Information on status: patent application and granting procedure in general |
Free format text: PUBLICATIONS -- ISSUE FEE PAYMENT VERIFIED |
|
| STCF | Information on status: patent grant |
Free format text: PATENTED CASE |