US12094337B2 - Method and device for visualizing multiple vehicle trajectories - Google Patents
Method and device for visualizing multiple vehicle trajectories Download PDFInfo
- Publication number
- US12094337B2 US12094337B2 US17/477,063 US202117477063A US12094337B2 US 12094337 B2 US12094337 B2 US 12094337B2 US 202117477063 A US202117477063 A US 202117477063A US 12094337 B2 US12094337 B2 US 12094337B2
- Authority
- US
- United States
- Prior art keywords
- nodes
- vehicles
- vehicle
- planning
- node
- Prior art date
- Legal status (The legal status is an assumption and is not a legal conclusion. Google has not performed a legal analysis and makes no representation as to the accuracy of the status listed.)
- Active, expires
Links
Images


Classifications
-
- G—PHYSICS
- G08—SIGNALLING
- G08G—TRAFFIC CONTROL SYSTEMS
- G08G1/00—Traffic control systems for road vehicles
- G08G1/123—Traffic control systems for road vehicles indicating the position of vehicles, e.g. scheduled vehicles; Managing passenger vehicles circulating according to a fixed timetable, e.g. buses, trains, trams
- G08G1/127—Traffic control systems for road vehicles indicating the position of vehicles, e.g. scheduled vehicles; Managing passenger vehicles circulating according to a fixed timetable, e.g. buses, trains, trams to a central station ; Indicators in a central station
- G08G1/13—Traffic control systems for road vehicles indicating the position of vehicles, e.g. scheduled vehicles; Managing passenger vehicles circulating according to a fixed timetable, e.g. buses, trains, trams to a central station ; Indicators in a central station the indicator being in the form of a map
-
- B—PERFORMING OPERATIONS; TRANSPORTING
- B60—VEHICLES IN GENERAL
- B60W—CONJOINT CONTROL OF VEHICLE SUB-UNITS OF DIFFERENT TYPE OR DIFFERENT FUNCTION; CONTROL SYSTEMS SPECIALLY ADAPTED FOR HYBRID VEHICLES; ROAD VEHICLE DRIVE CONTROL SYSTEMS FOR PURPOSES NOT RELATED TO THE CONTROL OF A PARTICULAR SUB-UNIT
- B60W40/00—Estimation or calculation of non-directly measurable driving parameters for road vehicle drive control systems not related to the control of a particular sub unit, e.g. by using mathematical models
- B60W40/08—Estimation or calculation of non-directly measurable driving parameters for road vehicle drive control systems not related to the control of a particular sub unit, e.g. by using mathematical models related to drivers or passengers
-
- G—PHYSICS
- G06—COMPUTING OR CALCULATING; COUNTING
- G06Q—INFORMATION AND COMMUNICATION TECHNOLOGY [ICT] SPECIALLY ADAPTED FOR ADMINISTRATIVE, COMMERCIAL, FINANCIAL, MANAGERIAL OR SUPERVISORY PURPOSES; SYSTEMS OR METHODS SPECIALLY ADAPTED FOR ADMINISTRATIVE, COMMERCIAL, FINANCIAL, MANAGERIAL OR SUPERVISORY PURPOSES, NOT OTHERWISE PROVIDED FOR
- G06Q10/00—Administration; Management
- G06Q10/04—Forecasting or optimisation specially adapted for administrative or management purposes, e.g. linear programming or "cutting stock problem"
-
- G—PHYSICS
- G06—COMPUTING OR CALCULATING; COUNTING
- G06Q—INFORMATION AND COMMUNICATION TECHNOLOGY [ICT] SPECIALLY ADAPTED FOR ADMINISTRATIVE, COMMERCIAL, FINANCIAL, MANAGERIAL OR SUPERVISORY PURPOSES; SYSTEMS OR METHODS SPECIALLY ADAPTED FOR ADMINISTRATIVE, COMMERCIAL, FINANCIAL, MANAGERIAL OR SUPERVISORY PURPOSES, NOT OTHERWISE PROVIDED FOR
- G06Q50/00—Information and communication technology [ICT] specially adapted for implementation of business processes of specific business sectors, e.g. utilities or tourism
- G06Q50/40—Business processes related to the transportation industry
-
- G—PHYSICS
- G08—SIGNALLING
- G08G—TRAFFIC CONTROL SYSTEMS
- G08G1/00—Traffic control systems for road vehicles
- G08G1/20—Monitoring the location of vehicles belonging to a group, e.g. fleet of vehicles, countable or determined number of vehicles
-
- G—PHYSICS
- G08—SIGNALLING
- G08G—TRAFFIC CONTROL SYSTEMS
- G08G1/00—Traffic control systems for road vehicles
- G08G1/20—Monitoring the location of vehicles belonging to a group, e.g. fleet of vehicles, countable or determined number of vehicles
- G08G1/202—Dispatching vehicles on the basis of a location, e.g. taxi dispatching
-
- H—ELECTRICITY
- H04—ELECTRIC COMMUNICATION TECHNIQUE
- H04W—WIRELESS COMMUNICATION NETWORKS
- H04W4/00—Services specially adapted for wireless communication networks; Facilities therefor
- H04W4/30—Services specially adapted for particular environments, situations or purposes
- H04W4/40—Services specially adapted for particular environments, situations or purposes for vehicles, e.g. vehicle-to-pedestrians [V2P]
-
- B—PERFORMING OPERATIONS; TRANSPORTING
- B60—VEHICLES IN GENERAL
- B60W—CONJOINT CONTROL OF VEHICLE SUB-UNITS OF DIFFERENT TYPE OR DIFFERENT FUNCTION; CONTROL SYSTEMS SPECIALLY ADAPTED FOR HYBRID VEHICLES; ROAD VEHICLE DRIVE CONTROL SYSTEMS FOR PURPOSES NOT RELATED TO THE CONTROL OF A PARTICULAR SUB-UNIT
- B60W40/00—Estimation or calculation of non-directly measurable driving parameters for road vehicle drive control systems not related to the control of a particular sub unit, e.g. by using mathematical models
- B60W40/08—Estimation or calculation of non-directly measurable driving parameters for road vehicle drive control systems not related to the control of a particular sub unit, e.g. by using mathematical models related to drivers or passengers
- B60W2040/0881—Seat occupation; Driver or passenger presence
-
- B—PERFORMING OPERATIONS; TRANSPORTING
- B60—VEHICLES IN GENERAL
- B60W—CONJOINT CONTROL OF VEHICLE SUB-UNITS OF DIFFERENT TYPE OR DIFFERENT FUNCTION; CONTROL SYSTEMS SPECIALLY ADAPTED FOR HYBRID VEHICLES; ROAD VEHICLE DRIVE CONTROL SYSTEMS FOR PURPOSES NOT RELATED TO THE CONTROL OF A PARTICULAR SUB-UNIT
- B60W2552/00—Input parameters relating to infrastructure
- B60W2552/53—Road markings, e.g. lane marker or crosswalk
-
- H—ELECTRICITY
- H04—ELECTRIC COMMUNICATION TECHNIQUE
- H04W—WIRELESS COMMUNICATION NETWORKS
- H04W4/00—Services specially adapted for wireless communication networks; Facilities therefor
- H04W4/02—Services making use of location information
- H04W4/029—Location-based management or tracking services
Definitions
- the present disclosure relates to the field of automatic traffic planning. It presents a method and a device for visualizing a plurality of vehicle trajectories generated by a traffic planning algorithm, which can be utilized to assist an operator wanting to evaluate or configure the traffic planning algorithm.
- Traffic planning algorithms find widespread use in the systematic solving of stipulated transportation tasks for which time and resource constraints apply. If the transportation task is to be carried out collectively by multiple vehicles that operate contemporaneously in a shared traffic system, the planning problem may have a very large solution space and a considerable number of constraints.
- the solution space may be understood as all feasible vehicle trajectories in a given traffic system, and the constraints could correspond to vehicles mutually blocking one another at intersections, one-way passages and the like.
- One objective of the present disclosure is to make available methods and devices for visualizing multiple vehicle trajectories. Another objective is to enable visualization of vehicle trajectories that constitute output data of a traffic planning method for controlling a plurality of vehicles occupying nodes in a shared set of planning nodes. A further objective is to provide an intuitive visualization of the time dependence of the vehicle trajectories in that technical setting. A still further objective is to propose, for the purposes of such a visualization, useful annotations to assist an operator's task of evaluating a traffic planning algorithm and/or improve its performance by varying configuration parameters. In particular, the visualization may help the operator trace the causes of an unwanted set of node occupancies.
- a method of visualizing output data of a traffic planning method for controlling a plurality of vehicles Each vehicle is assumed to occupy one node in a shared set of planning nodes and to be movable to other nodes along predefined edges between pairs of the nodes, wherein the output data indicates respective planned node occupancies of the vehicles for a sequence of time steps.
- the method comprises obtaining a graphical representation of the planning nodes and, in the graphical representation, indicating each vehicle's planned movements between the nodes by linear graphical elements.
- an appearance parameter of the linear graphical elements has a time variation with respect to the time step, and the time variation is common to all vehicles.
- the method according to the first aspect efficiently conveys the time aspect of the vehicles' movements, namely, by expressing it as the time variation of the line segments.
- the appearance parameter is line width or color
- an operator may look for all locations in the graphical representation with equal line width (or identical color) to get a snapshot of the vehicle positions at a corresponding time step. This inspection may be repeated for a different line width value (or a different color). From such inspections, the operator may evaluate to what extent two or more vehicles move close to each other, which may be a sign that they are mutually blocking and that the traffic planning method may not be solving the transportation task with optimal efficiency.
- the operator may consider applying a modified configuration of the traffic planning method (e.g., hyperparameters, initialization data, parameters of the objective function) to explore whether it produces better vehicles movements and or node occupancies of the vehicles.
- a modified configuration of the traffic planning method e.g., hyperparameters, initialization data, parameters of the objective function
- these movements or node occupancies may be perceived as better, for example, since they solve a transportation task in shorter time, with less resource expenditure, greater safety margins and/or with fewer cases of vehicles blocking each other.
- the proposed method according to the first aspect may be used by an operator to fine-tune settings or initial values of a traffic planning method.
- a further utility of the proposed method is to verify, as an additional human-executed safety measure, that the planned node occupancies correspond to collision-free movement of the vehicles.
- the appearance parameter is line width or line style, or both. Additionally or alternatively, the appearance parameter is color and/or texture. Furthermore, the linear graphical elements include line segments or curve segments or a combination of these. As used in the present disclosure, a “line segment” or “curve segment” can be solid or non-solid. The non-solid options include dotted, dashed, dash-dotted lines or curves, which are interrupted by imaginary lifts of the drawing instrument.
- the graphical representation contains annotations indicating such groups of planning nodes that allow occupancy of a single vehicle only.
- groups may for instance correspond to waypoints in a road segment where traffic is being routed two ways but the width does not allow two vehicles to meet.
- the annotations help the operator understand in more detail the task that the traffic planning method has attempted to solve. Specifically, the operator may realize more easily why the traffic planning method does not route vehicles to seemingly empty planning nodes.
- the graphical representation contains annotations indicating node occupancies where a first vehicle blocks onward movement of a second vehicle or multiple second vehicles.
- the blocking state can be detected by evaluating the closeness of the vehicles, optionally by taking into account the safe following distance applied by the traffic planning method.
- This type of annotations helps the operator estimate the extent to which the traffic planning method is being limited by node occupancies constituting blocking states. In cases where the operator believes the transportation task could be solved more efficiently if there were less such blocking states, the operator may modify settings of the traffic planning method to explore whether this improves the output.
- a device configured to visualize output data of a traffic planning method for controlling a plurality of vehicles, wherein each vehicle occupies one node in a shared set of planning nodes and is movable to other nodes along predefined edges between pairs of the nodes.
- the device comprises: an input interface configured to receive the output data of the traffic planning method, wherein the output data indicates respective planned node occupancies of the vehicles for a sequence of time steps; processing circuitry configured to process the output data of the traffic planning method to determine each vehicle's planned movements between the nodes; and a graphical output interface configured to render a graphical representation of the planning nodes, and render linear graphical elements corresponding to each vehicle's planned movements between the nodes, wherein an appearance parameter of the linear graphical elements has a time variation with respect to the time step, which time variation is common to all vehicles.
- the invention further relates to a computer program containing instructions for causing a computer, or the just described device in particular, to carry out the above method.
- the computer program may be stored or distributed on a data carrier.
- a “data carrier” may be a transitory data carrier, such as modulated electromagnetic or optical waves, or a non-transitory data carrier.
- Non-transitory data carriers include volatile and non-volatile memories, such as permanent and non-permanent storage media of magnetic, optical or solid-state type. Still within the scope of “data carrier”, such memories may be fixedly mounted or portable.
- FIG. 1 is a schematical representation of a road network with numbered waypoints
- FIG. 2 shows a device suitable for controlling a plurality of vehicles
- FIG. 3 shows example vehicles that can be controlled centrally using embodiments of the invention
- FIG. 4 A illustrates a vehicle's movement between waypoints wp 1 -wp 6 by linear graphical elements (line segments) with varying line width and uniform color;
- FIG. 4 B illustrates the same vehicle movement as FIG. 4 B , however, using linear graphical elements with varying color (hatching) and uniform line width;
- FIG. 5 illustrates, in the symbolism of FIG. 4 A , a vehicle's movement from waypoint wp 1 to wp 5 in a first time step and, in a next time step, the same vehicle's movement from waypoint wp 5 to wp 9 ;
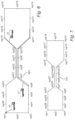
- FIG. 6 is a graphical representation of a road network where the node occupancies of three vehicles have been illustrated and where annotations (waypoint labels encircled by dotted line) indicate node occupancies blocking another vehicle's movement;
- FIG. 7 is a graphical representation of the road network in FIG. 6 , where further annotations (waypoint labels encircled by dotted line) indicate a group of planning nodes which allows occupancy of a single vehicle only; and
- FIG. 8 is flowchart of a method of visualizing output data of a traffic planning method for controlling a plurality of vehicles, according to embodiments herein.
- FIG. 1 is a schematic representation of a road network.
- Waypoints are defined at the road junctions wp 1 , wp 3 and additionally at some intermediate locations wp 2 , wp 4 , wp 5 , wpb, wp 7 and wp 8 .
- Some of the intermediate locations may correspond to so-called absorption nodes, where a visiting vehicle is required to dwell for a predetermined or variable time, for purposes of loading, unloading, maintenance etc.
- the arrangement of the waypoints is not essential to the present invention, rather their locations and number may be chosen (defined) as deemed necessary in each use case to achieve smooth and efficient traffic control.
- the waypoints are treated as planning nodes which are shared by a plurality of vehicles v 1 , v 2 , v 3 , v 4 .
- a planning node may be understood as a logical entity which is either free or occupied by exactly one vehicle at a time. An occupied node is not consumed but can be released for use by the same or another vehicle.
- Planning nodes may represent physical space for transport (road segments, road junctions) or parking, a communication channel, maintenance machinery, additional equipment for optional temporary use, such as tools or trailers.
- Each vehicle (see FIG. 3 ) is controllable by an individual control signal, which may indicate a command from a finite set of predetermined commands.
- the control signal may be a machine-oriented signal which controls actuators in the vehicle; if the vehicles are conventional, the control signals may be human-intelligible signals directed to their drivers. It is understood that individual control signals may be multiplexed onto a common carrier.
- a predefined command may represent an action to be taken at the next waypoint (e.g., continue straight, continue right, continue left, stop), a next destination, a speed adjustment, a loading operation or the like.
- Implicit signaling is possible, in that a command has a different meaning depending on its current state (e.g., toggle between an electric engine and a combustion engine, toggle between high and low speed, drive/wait at the next waypoint).
- a vehicle which receives no control signal or a neutrally-valued control signal may be configured to continue the previously instructed action or to halt.
- the predetermined commands preferably relate to tactical decision-making, which corresponds to a time scale typically shorter than strategic decision-making and typically longer than operational (or machine-level) decision-making. Different vehicles may have different sets of commands.
- One aim of the present disclosure is to assist efficient centralized control of the vehicles v 1 , v 2 , v 3 , v 4 .
- the vehicles v 1 , v 2 , v 3 , v 4 are to be controlled as a group, with mutual coordination.
- the mutual coordination may entail that any planning node utilization conflicts that could arise between vehicles are deferred to a planning algorithm and resolved at the planning stage.
- the planning may aim to maximize productivity, such as the total quantity of useful transport system work or the percentage of on-schedule deliveries of goods.
- the planning may additionally aim to minimize cost, including fuel consumption, battery aging, mechanical component wear or the like.
- a waypoint topology populated with many vehicles may also have more deadlock states, i.e., states where no vehicle movement is possible.
- a deadlock state may correspond to a real-life scenario where the controlled vehicles need external help to resume operation, such as operator intervention, towing etc.
- the following description is made under an assumption of discrete time, that is, the traffic system evolves in evenly spaced epochs.
- the length of an epoch may be of the order of 0.1 s, 1 s, 10 s or longer.
- a command a 1 , a 2 is given to one of the vehicles v 1 , v 2 , v 3 , v 4 , a command is given to a predefined group of vehicles, or no command is given.
- Quasi-simultaneous commands v 1 .a 1 , v 2 .a 1 to two vehicles v 1 , v 2 or two vehicle groups can be distributed over two consecutive epochs.
- the epoch length may be configured shorter than the typical time scale of the tactical decision-making for one vehicle.
- the space of possible planning outcomes corresponds to the set of all command sequences of length d, where d is the planning horizon (or lookahead horizon).
- the method 800 may be implemented by a general-purpose programmable computer, or in particular by the device 200 shown in FIG. 2 to be described below.
- a purpose of the method 800 is to visualize output data of a traffic planning method.
- the traffic planning method may be executed by the same entity as performs the visualization method 800 , or by a different entity.
- the output data of the traffic planning method is related to the control of a plurality of vehicles and indicates—directly or implicitly—respective planned planning-node occupancies of the vehicles for a sequence of time steps. Possible formats of the output data include:
- a graphical representation of the planning nodes is obtained.
- the graphical representation includes the planning nodes and edges that connect pairs of the planning nodes, wherein each edge corresponds to a possible vehicle movement.
- the graphical representation need not include any present or future node occupancy of a vehicle.
- the graphical representation may be provided (rendered) by the same entity as performs the method 800 , or the graphical representation may be obtained in already rendered format from a different entity.
- the rendered format may be a static vector or bitmap image, on which the graphical elements generated by the execution of the method 800 are overlaid. If the graphical representation of the planning nodes is void of node-occupancy information, it can be reused between different execution cycles of the method 800 .
- each vehicle's planned movements between the nodes are indicated by linear graphical elements.
- the linear graphical elements may consist of or include line segments or curve segments, with their endpoints in the planning nodes between which a vehicle moves. As mentioned, such line segments may be drawn in solid line, or they may be dashed, dotted etc.
- An appearance parameter of the linear graphical elements shall have a time variation with respect to the time step, and the time variation shall be common to all vehicles.
- FIG. 4 shows, in two different formats, a vehicle's movement between waypoints wp 1 -wp 6 in a simple linear road network without any junctions.
- a gradually decreasing line width is used to express the time dimension of the movement.
- color (texture) conveys the corresponding information, wherein more precisely lighter shades correspond to movements at more advanced points in time. Because no two line segments have the same line width (same color hue) in FIGS. 4 A and 4 B , it can be appreciated that the vehicle passes by waypoints wp 2 -wp 5 on its journey from waypoint wp 1 to wpb.
- FIG. 4 shows, in two different formats, a vehicle's movement between waypoints wp 1 -wp 6 in a simple linear road network without any junctions.
- a gradually decreasing line width is used to express the time dimension of the movement.
- color (texture) conveys the corresponding information, wherein more precisely lighter shades correspond to movements at more advanced points in time. Because no two line segments have the
- a time variation as exemplified in FIGS. 4 and 5 shall be common to all vehicles, so that an operator viewing the graphical representation is able to determine—at least approximately—that two vehicles' movement are contemporaneous.
- the linear graphical element between a pair of consecutive planning nodes shall have a uniform appearance.
- the uniform appearance may correspond to (a) the time step in which the movement begins, (b) the time step in which the movement ends, or (c) the time step during which the movement is performed; this may be determined by a predetermined rule for the visualization.
- each linear graphical element can have an appearance that varies with the position between the planning nodes.
- the initial portion of the graphical element can have the appearance (i.e., color, width) of the start time step
- the final portion of the graphical element can have the appearance of the end time step
- the intervening portion can be an interpolation between these appearances.
- Such a gradual transition of the appearance over the course of a connecting linear graphical element may convey the direction of movement in an intuitive manner.
- the gradual transition further expresses the vehicle movement on a more fine-grained time scale than if a simple association rule, like the above-mentioned rules (a) or (b), is applied.
- FIG. 6 illustrates an example output of the first and second steps 810 , 812 which is overlaid is on a graphical representation of a road network where vehicles can move freely between planning nodes (or waypoints) wp 1 -wp 26 . There are no junctions.
- the connections define a circuit which allows a vehicle to traverse all twenty-six planning nodes.
- the planned node occupancies of three vehicles v 1 , v 2 , v 3 are to be indicated in the graphical representation using line segments with variable line width (decreasing over time), which is therefore suitable for monochrome rendering. If coloring is available, it can be used to make the plotted trajectories more distinguishable across vehicles.
- the initial node occupancies are:
- the method 800 additionally comprises a third step 814 , where the graphical representation is annotated with groups of planning nodes allowing occupancy of a single vehicle only.
- FIG. 7 shows an example of such an annotation 701 .
- vehicles are not allowed to occupy planning nodes wp 7 -wp 10 and wp 20 -wp 23 contemporaneously.
- these waypoints are encircled by a dotted oval. (It is noted in passing that the road network shown in FIG. 7 would not be equivalent to a network where nodes wp 7 -wp 10 and wp 20 -wp 23 were combined into one.
- the following options are open to the traffic planner: (a) let the second vehicle v 2 wait, route the first vehicle v 1 through the corridor wp 7 -wp 10 , and then route the second vehicle v 2 through the corridor wp 20 -wp 23 , or (b) let the first vehicle v 1 wait, route the second vehicle v 2 through wp 20 -wp 23 , and then route the first vehicle through wp 7 -wp 10 . It is seen that under option b), all three vehicles v 1 , v 2 , v 3 will be present in the left half of the road network, relatively close to each other, so that blocking states are likely to occur, to the potential detriment of the transportation efficiency. Configuration of a traffic planning method that favor this option can be identified with the aid of visualizations produced by the method 800 , and the algorithm can be tuned accordingly.
- the method 800 additionally comprises a fourth step 816 of processing the output data of the traffic planning method to detect a node occupancy of one vehicle which blocks onward movement of at least one other vehicle and a fifth step 818 of annotating the graphical representation with the detected node occupancy.
- FIG. 6 shows an annotation 601 of this kind applied to nodes wp 7 -wp 10 .
- An operator will interpret the placement of this annotation 601 to mean: while the first vehicle v 1 occupies any of nodes wp 7 -wp 10 , it is restricting the onward movement of the second vehicle v 2 .
- the second vehicle's v 2 waiting time at node wp 19 prevents it from performing the set transportation task.
- this type of annotations 601 helps the operator determine to what extent the traffic planning method is limited by blocking states. In cases where the operator believes the transportation task could be solved more efficiently if there were fewer such blocking states, the operator may modify settings of the traffic planning method to explore whether this improves the output.
- the blocking condition can be detected by evaluating the closeness of the vehicles, optionally by taking into account the safe following distance that the traffic planning method applies.
- Some classes of traffic planning methods rely, at least in part and possibly supplemented by central coordination, on local logic in the individual vehicles.
- the logic may be formulated as a local decision rule which determines, on the basis of the distance to the vehicle in front, whether the self vehicle shall continue at full speed, slow down or stop. The stop option may be selected if the self vehicle is being blocked by the vehicle in front.
- the visualization method 800 may evaluate the local decision rule for each vehicle and each set of node occupancies, to determine which vehicles experience the condition of being blocked, and in which time steps. This may form the basis for adding the annotations 601 shown in FIG. 6 .
- FIG. 2 shows, in accordance with a further embodiment, a device 200 for controlling a plurality of vehicles 299 sharing a set of planning nodes.
- the device 200 which may be referred to as a traffic planner, has a first interface 210 configured to receive initial node occupancies of the vehicles 299 .
- it may further receive, for each vehicle, information representing a set of predefined commands v 1 .a 1 , v 1 .a 2 , v 2 .a 1 , v 2 .a 2 , which can be fed to the respective vehicles, and/or a mission (transportation task) to be carried out may by the vehicles 299 .
- a mission transportation task
- the initial node occupancies may be obtained from a traffic control entity (not shown) communicating with the vehicles 299 , from sensors (not shown) detecting the positions of the vehicles 299 , or from replies to a self-positioning query which are issued to the vehicles 299 .
- the optional information may be entered into the first interface 210 by an operator or provided as configuration data once it is known which vehicles 299 will form the fleet.
- the device 200 further has a second interface 216 configured to feed commands selected from said predefined commands to said plurality of vehicles, as well as processing circuitry 212 configured to perform the method 100 described above.
- FIG. 2 shows direct wireless links from the second interface 216 to the vehicles 299 .
- the second interface 216 may instead feed sequences of the predefined commands to the traffic control entity, which takes care of the delivery of the commands to the vehicles 299 .
- the device 200 further include a graphical output interface 214 configured to render a graphical representation of the planning nodes and to indicate therein the planned movements of the vehicles, optionally together with various types of annotations.
- the first interface 210 and the graphical output interface 214 may be implemented as a combined operator interface, such as a graphical human-machine interface (HMI) including a visual display, keyboard and a pointing device.
- HMI graphical human-machine interface
- FIG. 3 shows a truck 300 , a bus 302 and a construction equipment vehicle 304 .
- a fleet of vehicles of one or more of these types, whether they are autonomous or conventional, can be controlled in a centralized fashion using the device 200 described above, and the method 800 may visualize their planned trajectories.
Landscapes
- Engineering & Computer Science (AREA)
- Physics & Mathematics (AREA)
- General Physics & Mathematics (AREA)
- Business, Economics & Management (AREA)
- Human Resources & Organizations (AREA)
- Remote Sensing (AREA)
- Strategic Management (AREA)
- Radar, Positioning & Navigation (AREA)
- Economics (AREA)
- Automation & Control Theory (AREA)
- Mathematical Physics (AREA)
- Mechanical Engineering (AREA)
- Theoretical Computer Science (AREA)
- Marketing (AREA)
- Signal Processing (AREA)
- Transportation (AREA)
- Tourism & Hospitality (AREA)
- General Business, Economics & Management (AREA)
- Computer Networks & Wireless Communication (AREA)
- Primary Health Care (AREA)
- Development Economics (AREA)
- Game Theory and Decision Science (AREA)
- Entrepreneurship & Innovation (AREA)
- Operations Research (AREA)
- Quality & Reliability (AREA)
- General Health & Medical Sciences (AREA)
- Health & Medical Sciences (AREA)
- Traffic Control Systems (AREA)
Abstract
Description
It can also be seen that these node occupancies provide each vehicle with a next waypoint to which it can move in a next epoch. The choice of the next waypoint is not arbitrary, as both vehicles v1 and v4 could theoretically move to waypoint wp3 simultaneously. This conflict can however be avoided by routing vehicle v1 to waypoint wp2 instead, so that waypoint wp3 remains free for use by vehicle v4. If the system is evolved in the second manner, that is,
then vehicle v4 will block vehicle v1 from moving to the next waypoint wp3. This blocking state temporarily reduces the vehicle system's productivity but will be resolved once vehicle v4 continues to waypoint wp4 or wpb.
-
- (a) sequences of commands to be given to the vehicles in respective time steps,
- (b) each vehicle's node occupancy in respective time steps, (c) snapshots of the vehicles' node occupancies in respective time steps. The output data can be formatted as machine-oriented instructions addressed to autonomous vehicles or as human-readable instructions directed to drivers of conventional vehicles.
The following movements can be derived from the indications in
Claims (10)
Priority Applications (1)
| Application Number | Priority Date | Filing Date | Title |
|---|---|---|---|
| US17/477,063 US12094337B2 (en) | 2021-09-16 | 2021-09-16 | Method and device for visualizing multiple vehicle trajectories |
Applications Claiming Priority (1)
| Application Number | Priority Date | Filing Date | Title |
|---|---|---|---|
| US17/477,063 US12094337B2 (en) | 2021-09-16 | 2021-09-16 | Method and device for visualizing multiple vehicle trajectories |
Publications (2)
| Publication Number | Publication Date |
|---|---|
| US20230083586A1 US20230083586A1 (en) | 2023-03-16 |
| US12094337B2 true US12094337B2 (en) | 2024-09-17 |
Family
ID=85478322
Family Applications (1)
| Application Number | Title | Priority Date | Filing Date |
|---|---|---|---|
| US17/477,063 Active 2042-07-02 US12094337B2 (en) | 2021-09-16 | 2021-09-16 | Method and device for visualizing multiple vehicle trajectories |
Country Status (1)
| Country | Link |
|---|---|
| US (1) | US12094337B2 (en) |
Families Citing this family (1)
| Publication number | Priority date | Publication date | Assignee | Title |
|---|---|---|---|---|
| EP4462404B1 (en) * | 2023-05-12 | 2025-11-12 | Volvo Autonomous Solutions AB | A traffic planning method for a vehicle fleet |
Citations (14)
| Publication number | Priority date | Publication date | Assignee | Title |
|---|---|---|---|---|
| US20140032035A1 (en) | 2011-04-11 | 2014-01-30 | Crown Equipment Limited | Method and apparatus for efficient scheduling for multiple automated non-holonomic vehicles using a coordinated path planner |
| US20150193994A1 (en) * | 2013-05-12 | 2015-07-09 | Zonar Systems, Inc. | Graphical user interface for efficiently viewing vehicle telematics data to improve efficiency of fleet operations |
| US20190033808A1 (en) | 2017-07-27 | 2019-01-31 | Caterpillar Inc. | Blend control truck assignment monitoring system and method |
| US10248120B1 (en) * | 2016-09-16 | 2019-04-02 | Amazon Technologies, Inc. | Navigable path networks for autonomous vehicles |
| US20190153701A1 (en) | 2017-11-20 | 2019-05-23 | Caterpillar Inc. | System and method for mining site production planning |
| US10304334B2 (en) * | 2015-01-16 | 2019-05-28 | Mitsubishi Electric Corporation | Travel planning device and travel planning method |
| US20190248287A1 (en) * | 2018-02-09 | 2019-08-15 | Toyota Jidosha Kabushiki Kaisha | Display device |
| US20200184826A1 (en) | 2018-12-10 | 2020-06-11 | Truck It Llc | Dynamic route administration for hauling vehicles |
| US20200198140A1 (en) * | 2018-12-21 | 2020-06-25 | X Development Llc | Dynamic probabilistic motion planning |
| US20200231386A1 (en) * | 2019-01-18 | 2020-07-23 | United States Postal Service | Systems and methods for automated guided vehicle control |
| US20200341490A1 (en) * | 2019-04-25 | 2020-10-29 | GM Global Technology Operations LLC | Method, system and apparatus for an autonomous routing algorithm with a failsafe provision at a final drop-off location |
| US20210046929A1 (en) * | 2018-02-24 | 2021-02-18 | Beijing Tusen Weilai Technology Co., Ltd. | System, method and device for planning driving path for vehicle |
| US20210197811A1 (en) * | 2018-08-22 | 2021-07-01 | Mitsubishi Electric Corporation | Course prediction device, computer readable medium, and course prediction method |
| US20220262265A1 (en) * | 2019-07-19 | 2022-08-18 | Sony Group Corporation | Information processing apparatus, information processing method, and program |
-
2021
- 2021-09-16 US US17/477,063 patent/US12094337B2/en active Active
Patent Citations (14)
| Publication number | Priority date | Publication date | Assignee | Title |
|---|---|---|---|---|
| US20140032035A1 (en) | 2011-04-11 | 2014-01-30 | Crown Equipment Limited | Method and apparatus for efficient scheduling for multiple automated non-holonomic vehicles using a coordinated path planner |
| US20150193994A1 (en) * | 2013-05-12 | 2015-07-09 | Zonar Systems, Inc. | Graphical user interface for efficiently viewing vehicle telematics data to improve efficiency of fleet operations |
| US10304334B2 (en) * | 2015-01-16 | 2019-05-28 | Mitsubishi Electric Corporation | Travel planning device and travel planning method |
| US10248120B1 (en) * | 2016-09-16 | 2019-04-02 | Amazon Technologies, Inc. | Navigable path networks for autonomous vehicles |
| US20190033808A1 (en) | 2017-07-27 | 2019-01-31 | Caterpillar Inc. | Blend control truck assignment monitoring system and method |
| US20190153701A1 (en) | 2017-11-20 | 2019-05-23 | Caterpillar Inc. | System and method for mining site production planning |
| US20190248287A1 (en) * | 2018-02-09 | 2019-08-15 | Toyota Jidosha Kabushiki Kaisha | Display device |
| US20210046929A1 (en) * | 2018-02-24 | 2021-02-18 | Beijing Tusen Weilai Technology Co., Ltd. | System, method and device for planning driving path for vehicle |
| US20210197811A1 (en) * | 2018-08-22 | 2021-07-01 | Mitsubishi Electric Corporation | Course prediction device, computer readable medium, and course prediction method |
| US20200184826A1 (en) | 2018-12-10 | 2020-06-11 | Truck It Llc | Dynamic route administration for hauling vehicles |
| US20200198140A1 (en) * | 2018-12-21 | 2020-06-25 | X Development Llc | Dynamic probabilistic motion planning |
| US20200231386A1 (en) * | 2019-01-18 | 2020-07-23 | United States Postal Service | Systems and methods for automated guided vehicle control |
| US20200341490A1 (en) * | 2019-04-25 | 2020-10-29 | GM Global Technology Operations LLC | Method, system and apparatus for an autonomous routing algorithm with a failsafe provision at a final drop-off location |
| US20220262265A1 (en) * | 2019-07-19 | 2022-08-18 | Sony Group Corporation | Information processing apparatus, information processing method, and program |
Also Published As
| Publication number | Publication date |
|---|---|
| US20230083586A1 (en) | 2023-03-16 |
Similar Documents
| Publication | Publication Date | Title |
|---|---|---|
| US20230065411A1 (en) | Navigation method, device and system for cross intersection | |
| Bhoopalam et al. | Planning of truck platoons: A literature review and directions for future research | |
| DE102013113572B4 (en) | A method of identifying potential hazards in the environment of a vehicle | |
| CN108762268B (en) | Multi-AGV collision-free path planning algorithm | |
| CN106705955B (en) | Sea level AGV scheduling method and system | |
| EP3757964B1 (en) | System, method and apparatus for planning driving path of vehicle | |
| CN114911238B (en) | A cooperative control method and system for unmanned mining vehicles | |
| Dey et al. | Fuzzy graph coloring technique to classify the accidental zone of a traffic control | |
| US12094337B2 (en) | Method and device for visualizing multiple vehicle trajectories | |
| US20230134026A1 (en) | Method and device for coordinating vehicle routes in confined areas | |
| Cao et al. | Research on global optimization method for multiple AGV collision avoidance in hybrid path | |
| CN108520326A (en) | A Real-time Synthesis Method of Supervisory Controller Based on AGV Task Path Scheduling | |
| AU2021362864A1 (en) | Traffic control system for mining trucks and method for same | |
| DE102022129591A1 (en) | SYSTEM AND METHOD FOR FLEET CHARGING OPTIMIZATION | |
| CN105388897A (en) | Method and system for realizing AGV automatic exploration path algorithm and AGV | |
| Li et al. | Traffic simulation model for port planning and congestion prevention | |
| CN107168364A (en) | A kind of unmanned aerial vehicle (UAV) control method, device and unmanned plane | |
| CN119319846B (en) | A non-conservative decision-making method for autonomous vehicles with defensive behavior | |
| CN120353752A (en) | SoC interconnection method, device, electronic equipment, storage medium and domain controller | |
| CN115285885B (en) | Unmanned forklift path and task joint generation method and system based on warehouse environment | |
| CN115933504A (en) | Driving control system, driving control method and device | |
| DE102022205999A1 (en) | Method for training a deep learning based machine learning algorithm | |
| CN114971992A (en) | Vehicle dynamic scheduling method, cloud server, vehicle-mounted device controller and system | |
| Madni | Autonomous system-of-systems | |
| ZHANG et al. | Parameters' Optimization of Resources in a Container Terminal |
Legal Events
| Date | Code | Title | Description |
|---|---|---|---|
| FEPP | Fee payment procedure |
Free format text: ENTITY STATUS SET TO UNDISCOUNTED (ORIGINAL EVENT CODE: BIG.); ENTITY STATUS OF PATENT OWNER: LARGE ENTITY |
|
| AS | Assignment |
Owner name: VOLVO AUTONOMOUS SOLUTIONS AB, SWEDEN Free format text: ASSIGNMENT OF ASSIGNORS INTEREST;ASSIGNOR:HELLGREN, JONAS;REEL/FRAME:057561/0336 Effective date: 20210920 |
|
| STPP | Information on status: patent application and granting procedure in general |
Free format text: DOCKETED NEW CASE - READY FOR EXAMINATION |
|
| STPP | Information on status: patent application and granting procedure in general |
Free format text: NON FINAL ACTION MAILED |
|
| STPP | Information on status: patent application and granting procedure in general |
Free format text: FINAL REJECTION MAILED |
|
| STPP | Information on status: patent application and granting procedure in general |
Free format text: ADVISORY ACTION MAILED |
|
| STPP | Information on status: patent application and granting procedure in general |
Free format text: DOCKETED NEW CASE - READY FOR EXAMINATION |
|
| STPP | Information on status: patent application and granting procedure in general |
Free format text: NOTICE OF ALLOWANCE MAILED -- APPLICATION RECEIVED IN OFFICE OF PUBLICATIONS |
|
| STPP | Information on status: patent application and granting procedure in general |
Free format text: PUBLICATIONS -- ISSUE FEE PAYMENT VERIFIED |
|
| STCF | Information on status: patent grant |
Free format text: PATENTED CASE |