This application is a U.S. national stage filing under 35 U.S.C. 371 from International Application No. PCT/US2019/017038, filed on 7 Feb. 2019, and published as WO 2019/157173 A1 on 15 Aug. 2019, which claims benefit of priority to the filing date of U.S. Provisional Application Ser. No. 62/628,383, filed Feb. 9, 2018, the contents of which are specifically incorporated herein by reference in their entity.
BACKGROUND OF THE INVENTION
Plant cell walls provide the raw material for a range of important industries, including feed, food, fuel and materials (Carroll and Somerville, 2009; Somerville, 2006). The cell wall is also essential for plant growth and development as it determines plant cell size and shape and provides structural qowth support and protection against various environmental stresses (Landrein and Hamant, 2013; Le Gall et al., 2015; Malinovsky et al., 2014; Szymanski and Cosgrove, 2009). Plant cell walls are comprised largely of polysaccharides (cellulose, hemicellulose, pectin) and the polypheraolic structure, lignin (Somerville et al., 2004). In general, two major types of plant cell walls exist: first, a thin, pectin-rich primary cell wall that surrounds all dividing and expanding cells; and, second, a thickened lignin-rich secondary cell wall that provides structural support to specialized cells, such as xylem cells (Harholt et al., 2010; Scheller and Ulvskov, 2010; Somerville et al., 2004; Wang et al., 2016a). Primary wall synthesis is closely associated with cell division and expansion that determine the size of an organ/tissue, whereas secondary wall deposition is initiated during the process of cellular differentiation to contribute plant strength and overall biomass production (Keegstra, 2010; Schuetz et al., 2013). As the most prominent and load-bearing component of many plant cell walls, cellulose plays a central role in plant mechanical strength and morphogenesis (Cosgrove, 2005; Liu et al., 2016).
SUMMARY
Described herein are plants, plant seeds, and plant cells that are modified to express certain types of cellulose synthases, such as one or more of the CesA2, CesA5 and CesA6 enzymes. Such plants, plant seeds and plant cells can be cotton, flax, hemp, jute, sisal, poplar, or eucalyptus plants, plant seeds and plant cells. As illustrated herein modified plants that overexpress certain cellulose synthases (but not a CesA3, CesA7 or CesA9 gene) tend to grow taller, have increased cellulose synthesis, have more crystalline cellulose, have wider secondary cell walls, have increased biomass, and have increased mechanical strength than in a control plant without the expression cassette (e.g., a wild type or parental plant without the expression cassette).
Methods of making ad using such plants, plant seeds, and plant cells are also described herein.
DESCRIPTION OF THE FIGURES
FIG. 1A-1G illustrate enhanced seedling growth in three Arabidopsis plants that overexpress CesA2, CesA5 and CesA6. FIG. 1A-1 shows an image of a Western blot of CesA2 (A2) proteins expressed by nine day old (D9) seedlings Shown in FIG. 1B. FIG. 1A-2 shows an image of a Western blot of CesA5 (A5) proteins expressed by D9 seedlings Shown in FIG. 1B, FIG. 1A-3 shows an image of a Western blot of CesA6 (A6) proteins expressed by D9 seedlings shown in FIG. 1B. Numerical data provided below the blots for FIGS. 1A-1, 1A-2 , and 1A3 are band density values indicated with ±SD; three WT lanes were derived from the same reference gel, and all blot analyses used the same amounts of protein samples. FIG. 1B shows images of D9 seedlings where the seedlings were generated from homozygous Arabidopsis seeds that were germinated and grown on ½ MS media for 9 days under dark (D9; 24 hours dark) or light (L9; 16-hours light: 8-hours dark) conditions. WT refers to wild type (Col-0); EV refers to transgenic plants transformed with empty vector; the A2, A5, A6 refer to the transgenic plants that overexpressed CesA2, CesA5 and CesA6 genes, respectively; Scale bars, 5 mm. FIG. 1C shows hypocotyl and root lengths of seedlings shown in FIG. 1B. Bars indicated means±SD (n=3 biological replicates), and at least 50 seedlings were measured in each replicate; Student's t-tests were performed between WT and transgenic plants as **P<0.01. FIG. 1D-1 graphically illustrates growth over time (days 2-7; D2-7) of hypocotyls from plant lines expressing CesA2 (A2, upper graph) compared to wild type (lower graph). FIG. 1D-2 graphically illustrates growth over time (days 2-7; D2-7) of hypocotyls from plant lines expressing CesA5 (A5, upper graph). FIG. 1D-3 graphically illustrates growth over time (days 2-7; D2-7) of hypocotyls from plant lines expressing CesA6 (A6, upper graph) compared to wild type (lower graph). Data for FIGS. 1D-1 to 1D-3 show means indicated as ±SD (n=3 biological replicates), and at least 30 seedlings were measured in each replicate. As illustrated hypocotyl lengths are longer in plant lines expressing CesA2, CesA5, and CesA6. FIG. 1E graphically illustrates hypocotyl and root lengths of Arabidopsis wild type (WT; Col-0) seedlings grown in dark (D) or light (L) from 3 days (D3) to 12 days (D12) after sowing. Bars indicated means±SD (n=3 biological replicates), and at least 30 plants were measured for each replicate; LSD (Least Significant Difference) test is used for multiple comparisons. Different letters above bars indicate that the means differ according to analysis of variance and LSD test (P<0.01). FIG. 1F graphically illustrates Q-PCR analyses of CesA1, CesA3, CesA6, CesA2, and CesA5 endogenous gene expression levels using total RNA extracted from hypocotyl samples illustrated in FIG. 1E. FIG. 1G graphically illustrates Q-PCR analyses of CesA1, CesA3, CesA6 CesA2, and CesA5 endogenous gene expression levels using total RNA extracted from L9 hypocotyl and root samples illustrated in FIG. 1E. GAPDH was used as the internal control and the expression value of GAPDH was defined as 100. Bars indicated means±SD (n=3 biological replicates); **P<0.01 by Student's t-test.
FIG. 2A-2F graphically illustrates the relative expression levels of CesA genes in D9 hypocotyls or roots of three CesA6-like genes overexpressing lines as detected by Q-PCR analyses. FIG. 2A graphically illustrates the relative expression level of Ces A2 (lighter, left bars), CesA5 (middle bars) or CesA6 (darker right bars) genes in D9 hypocotyls of plant lines that overexpress CesA2 (A2), CesA5 (A5) and CesA6 (A6) proteins. FIG. 2B graphically illustrates the relative expression level of CesA1 (lighter bars) or CesA3 (darker bars) genes in D9 hypocotyls of plant lines that overexpress CesA2 (A2), CesA5 (A5) and CesA6 (A6) proteins. FIG. 2C graphically illustrates the relative expression level of CesA8 in D9 hypocotyls of plant lines that overexpress CesA2 (A2), CesA5 (A5) and CesA6 (A6) proteins. FIG. 2D graphically illustrates the relative expression level of CesA2 (lighter, left bars), CesA5 (middle bars) or CesA6 (darker right bars) genes in L9 roots of plant lines that overexpress CesA2 (A2), CesA5 (A5) and CesA6 (A6) proteins where the plants were grown for 9 days under light (L9; 16-hours light: 8-hours dark) conditions. FIG. 2E graphically illustrates the relative expression levels of CesA1 (lighter bars) or CesA3 (darker bars) genes in L9 roots of plant lines that overexpress CesA2 (A2), CesA5 (A5) and CesA6 (A6) proteins, FIG. 2F graphically illustrates the relative expression level of CesA8 in 19 roots of plant lines that overexpress CesA2 (A2), CesA5 (A5) and CesA6 (A6) proteins. GAPDH was used as the internal control, and the expression value of GAPDH was defined as 100; bars indicate means±SD (n=3 biological replicates); Student's t-tests were performed between WT and transgenic plants as **P<0.01 for increase or ##P<0.01 for decrease.
FIG. 3A-3D illustrates increased dynamic movements of primary wall GFP-CesA3 at plasma membrane in the CesA6-like overexpressing transgenic seedlings. FIG. 3A shows images of GFP-CesA3 dynamic movements in epidermal cells of D3 hypocotyls that overexpress CesA2 (A2), CesA5 (A5) and CesA6 (A6) proteins. Scale bar, 5 μm, FIG. 3B graphically illustrates GFP-CesA3 particle density (spot/μm2) in plant lines that overexpress CesA2 (A2), CesA5 (A5) and CesA6 (A6) proteins. FIG. 3C graphically illustrates GFP-CesA3 mean velocity (nm/min) in plant lines that overexpress Ces A2 (A2), CesA5 (A5) and CesA6 (A6) proteins. FIG. 3D graphically illustrates the velocity distribution of GFP-CesA3 particles in wild type plants (light first bar) compared to plant lines that overexpress CesA2 (A2; light second bar), CesA5 (A5; darker, third bar) and CesA6 (A6; darkest, fourth bar) proteins. Data indicated are the means±SD; 578-1257 CesA3 particles were detected with n≥4 cells from four different seedlings for each genotype; **P<0.01 by Student's t-test.
FIG. 4A-4G illustrates enhanced cellulose synthesis in three CesA6-like overexpressing seedlings. FIG. 4A graphically illustrates absolute crystalline cellulose contents of D9 seedlings of plant lines that overexpress CesA2 (A2), CesA5 (A5) and CesA6 (A6) proteins. FIG. 4B graphically illustrates absolute crystalline cellulose contents of L9 seedlings of plant lines that overexpress CesA2 (A2), Ces A5 (A5) and CesA6 (A6) proteins. For FIGS. 4A and 4B, the bars indicate means±SD for n=3 biological replicates, where 100 seedlings were measured for each replicate; *P<0.05 and **P<0.01 by Student's t-test; the differences in increased rates (%) were calculated by subtraction of values between overexpression transgenic lines and wild type (WT), divided by WT, FIG. 4C illustrates reassembly of macrofibrils from purified cellulose using atomic force microscopy (AFM). The relative average particle size (width D9 length) was calculated from randomly selecting ten particles in each image from three biological replicates. FIG. 4D graphically illustrates crystalline cellulose levels (percent dry matter) in D9 seedlings from plant lines that overexpress CesA2 (A2), CesA5 (A5) and CesA6 (A6) proteins. FIG. 4E graphically illustrates pectin levels (percent dry matter) in D9 seedlings from plant lines that overexpress CesA2 (A2), CesA5 (A5) and CesA6 (A6) proteins. FIG. 4F graphically illustrates hemicellulose levels (percent dry matter) in D9 seedlings from plant lines that overexpress CesA2 (A2), CesA5 (A5) and CesA6 (A6) proteins. FIG. 4G graphically illustrates the monosaccharide composition in the total wall polysaccharides of D9 seedlings from plant lines that overexpress CesA2 (A2), CesA5 (A5) and CesA6 (A6) proteins as detected by gas chromatography-mass spectrometer (GC-MS); Rha, rhamnose; Fuc, fucose; Ara, arabinose; Xyl, xylose; Man, mannose; Glu, glucose; Gal, galactose; Bars indicated means±SD (n=3 biological replicates); *P<0.05 and **P<0.01 by Student's t-test.
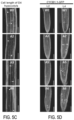
FIG. 5A-5I illustrate enhanced cell elongation and division in seedlings of plant lines that overexpress CesA2 (A2), CesA5 (A5) and CesA6 (A6) proteins. FIG. 5A graphically illustrates ral cell lengths of basal longest epidermal cells of D9 hypocotyls of plant lines that overexpress CesA2 (A2), CesA5 (A5) and CesA6 (A6) proteins. FIG. 5B graphically illustrates cell number of L9 root apical meristems of plant lines that overexpress CesA2 (A2), CesA5 (A5) and CesA6 (A6) proteins. For FIGS. 5A-5B, bars indicate means±SD for n=3 biological replicates, where at least 30 seedlings were measured for each replicate; **P<0.01 by Student's t-tests. FIG. 5C shows confocal laser scanning microscopy images of basal longest epidermal cells of D4 hypocotyls of plant lines that overexpress CesA2 (A2), CesA5 (A5) and Ces A6 (A6) proteins as visualized using propidium iodide (PI) staining (red-fluorescent). Arrowheads indicate a single cell to illustrate cell lengths; scale bars, 100 μm. FIG. 5D illustrates typical expression of the G2/M-specific marker proAtCYCB1; 1:AtCYCB1; 1-GFP (green) of plant cell cycle in the root apical meristem of plant lines that overexpress CesA2 (A2), CesA5 (A5) and CesA6 (A6) proteins as visualized using PI staining (red-fluorescent). Scale bars, 75 μm. FIG. 5E-5I illustrate altered expression of genes associated with cell growth by RNA sequencing. FIG. 5E illustrates numbers of differentially expressed genes (DEGs) identified by applying statistical tests (P<0.001) for the genes between D6 transgenic (A2, A5 and A6) and WT seedlings. Blue, green and yellow represent CesA2, CesA5 and CesA6 over-expressing seedlings, respectively; Two biological replicates for each sample, FIG. 5F graphically illustrates the numbers of up-regulated and down-regulated genes in each over-expression line as shown in FIG. 5E. FIG. 5G graphically illustrates Gene Ontology-Biological Process terms (GO-BP terms) of all DEGs in FIG. 5E for A2 transgenic plants lines (overexpressing CesA2). FIG. 5H graphically illustrates Gene Ontology-Biological Process terms (GO-BP terms) of all DEGs in FIG. 5E for A5 transgenic plants lines (overexpressing CesA5). FIG. 5I graphically illustrates Gene Ontology-Biological Process terms (GO-BP terms) of all DEGs in FIG. 5E for A6 transgenic plants lines (overexpressing CesA6). The enrichment analyses of GO-BP terms relative to expectations were performed using a weighted method in combination with Fisher's exact test.
FIG. 6A-6E illustrate increased cellulose synthesis and biomass production in plant lines that overexpress CesA2 (A2), CesA5 (A5), and CesA6 (A6). FIG. 6A illustrates plant phenotypes at the flowering stage of plant genotypes for lines that overexpress CesA2 (A2), CesA5 (A5), and CesA6 (A6) compared to wild type. Scale bars, 15 mm. FIG. 6B graphically illustrates plant height (cm) of plant lines that overexpress CesA2 (A2), CesA5 (A5), and CesA6 (A6). FIG. 6C graphically illustrates dry weight (g) of 7-week-old mature plants of plant lines that overexpress CesA2 (A2), CesA5 (A5), and CesA6 (A6). Bars indicated means±SD (n=3 biological replicates), and at least 30 plants were measured for each replicate; **P<0.01 by Student's t-test. FIG. 6D shows transverse sections of 1st internode stems at the bolting stage of plant lines that overexpress CesA2 (A2), CesA5 (A5), and CesA6 (A6) compared to wild type using epilluorescence microscopy and calcofluor staining to visualize plant structures. Scale bars, 50 μm. FIG. 6E graphically illustrates absolute; crystalline cellulose contents per plant in 7-week-old inflorescence stems of mature plants of plant lines that overexpress CesA2 (A2), CesA5 (A5), and CesA6 (A6) compared to wild type plants. Bars indicated means±SD (n=3 biological replicates); **P<0.01 by Student's t-test.
FIG. 7A-7F illustrate enhanced secondary cell wall deposition in plant lines overexpressing CesA2, CesA5 and CesA6. FIG. 7A shows sclerenchyma cell walls in the 1st internode stem of 7-week-old Arabidopsis plants using transmission electron microscopy (TEM). PCW, primary cell wall; SCW, secondary cell wall; co, cortex; ph, phloem; ye, vessel; xf, xylary fibre; if, interfascicular fibre. FIG. 7B shows cell walls in xylary fiber tissues of plants that overexpress CesA2 (A2), CesA5 (A5), and CesA6 (A6). Scale bars, 1 μm. FIG. 7C graphically illustrates the width of the primary cell wall in plant lines overexpressing CesA2, CesA5 and CesA6. FIG. 7D graphically illustrates the width of the secondary cell walls of plant lines overexpressing CesA2, CesA5 and CesA6. Bars indicate means±SD (n=3 biological replicates); at least 60 cell walls were measured for each replicate; *P<0.05 and **P<0.01 by Student's t-test. FIG. 7E shows TEM images of cell walls in xylary fibre tissues from transgenic plant lines overexpressing CesA3 (A3), CesA7 (A7), and CesA9 (A9). Scale bars, 1 μm. FIG. 7F graphically illustrates the dry weight of seven-week-old inflorescence stems of mature transgenic plant lines overexpressirtg CesA3 (A3), CesA7 (A7), and CesA9 (A9). Bars indicate means±SD (n=3 biological replicates), and at least 30 plants were measured for each replicate; Student's t-test as **P<0.01 between empty vector (EV) and over-expression lines.
FIG. 8A-8C illustrate increased mechanical strength of reassembled crude cell walls in 1st internode stems of the plant lines overexpressing CesA6. FIG. 8A is a schematic flow diagram illustrating mechanical force measurements (Young's modulus) of reassembled crude cell walls in 1st internode stems of 7-week-old plants using atomic force microscopy (AFM), FIG. 8B graphically illustrates the mean values of Young's modulus of crude cell walls from transgenic plants that overexpress CesA6. FIG. 8C graphically illustrates the distribution of Young's modulus of crude cell walls from transgenic plants that overexpress CesA6. Bars indicated means of two biological replicates; 30 cell segments (n=30) were measured for each replicate; *P<0.05 and **P<0.01 by Wilcoxon test.
DETAILED DESCRIPTION
As described herein, increasing the expression levels of three primary cell wall cellulose synthase (CesA) genes (encoding CesA2, CesA5, and CesA6 enzymes), but not the CesA3, CesA9 or secondary cell wall CesA7 gene, can increase cellulose production within the cell walls of transgenic plant lines, as compared with wild-type plants that do not overexpress the CesA2, CesA5, and CesA6 enzymes.
Cellulose Synthases
Cellulose is composed of beta-1,4-linked glucan chains that interact with one another via hydrogen bonds to form paracrystalline microfibrils (Peng et al., 2002; Schneider et al., 2016; Somerville et al., 2004). As the most prominent and load-bearing component of many plant cell walls, cellulose plays a central role in plant mechanical strength and morphogenesis (Cosgrove, 2005; Liu et at, 2016). In most land plants, cellulose is synthesized by a large cellulose synthase (CesA) complex at the plasma membrane (Schneider et al 2016). In Arabidopsis, CesA1, CesA3 and one of four CesA6-like proteins (CesA6, CesA2, CesA5 and CesA9) are involved in primary wall cellulose synthesis, whereas CesA4, CesA7 and CesA8 are essential isoforms for secondary wall cellulose synthesis (Desprez et al., 2007; McFarlane et al., 2014; Persson et al., 2007; Taylor et al., 2003). Furthermore, CesA1 and CesA3 genes are essential for plant growth because mutation of each gene leads to lethality (Persson et al., 2007).
By comparison, mutations in any one of the CesA6-like genes (expressing CesA6, CesA2, CesA5 and CesA9 proteins) cause only mild growth phenotypes (Cann-Delgado et 2003; Scheible et al., 2001). However, cesa5 cesa6 double mutants are seedling lethal (Desprez et al., 2007), and cesa2 cesa6 cesa9 triple mutants are gamete lethal, probably due to CesA9 tissue-specific floral expression (Persson et al., 2007). CesA2 or CesA5 expression driven by a Cestio promoter onlypartially complements cesa6 mutant phenotypes (Desprez et al., 2007; Persson et al., 2007).
Because cellulose is important for plant biomass formation, increased production of this polymer in a plant is highly desirable, and many efforts have been undertaken to increase cellulose synthesis. However, even though CesA family genes were identified over two decades ago in some plants (Arioli et al., 1998; Pear et al, 1996), genetic manipulation of its members to enhance cellulose production has remained difficult. For instance, overexpression of CesA genes (mainly secondary wall CesAs) has not led to improved plant growth (Joshi et al., 2011; Li et al., 2017; Tan et al., 2015; Wang et al, 2016b).
However, as described herein, the inventors show that overexpression of any of the three CesA6-like genes CesA2, CesA5 or CesA6 can increase cellulose production in plants Arabidopsis. The overexpressing transgenic lines showed increased cell expansion and division, as well as enhanced secondary cell wall deposition. Hence, alterations in the expression of certain primary wall CesA genes (but not others) may enhance cellulose synthesis and biomass production in plants. An example of an Arabidopsis thaliana CesA2 protein is provided below as SEQ NO:1.
| 1 | MNTGGRLIAG SHNRNEFVLI NADESARIRS VQELSGQTCQ |
| |
| 41 | ICGDEIELTV SSELFVACNE CAFPVCRPCY EYERREGNQA |
| |
| 81 | CPQCKTRYKR IKGSPRVDGD DEEEEDIDDL EYEFDHGMDP |
| |
| 121 | EHAAEAALSS RLNTGRGGLD SAPPGSQIPL LTYCDEDADM |
| |
| 161 | YSDRHALIVP PSTGYGNRVY PAPFTDSSAP PQARSMVPQK |
| |
| 201 | DIAEYGYGSV AWKDRMEVWK RRQGEKLQVI KHEGGNNGRG |
| |
| 241 | SNDDDELDDP DMPMMDEGRQ PLSRKLPIRS SRINPYRMLI |
| |
| 281 | LCRLAILGLF FHYRILHPVN DAYGLWLTSV ICEIWFAVSW |
| |
| 321 | ILDQFPKWYP IERETYLDRL SLRYEKEGKP SGLAPVDVFV |
| |
| 361 | STVDLPKEPP LITANTVLSI LAVDYPVDKV ACYVSDDGAA |
| |
| 401 | MLTFEALSDT AEFARKWVPF CKKFNIEPRA PEWYFSQKMD |
| |
| 441 | YLKNKVHPAF VRERRAMKRD YEEFKVKINA LVATAQKVPE |
| |
| 481 | EGWTMQDGTP WPGNNVRDHP GMIQVFLGHS GVRDTDGNEL |
| |
| 521 | PRLVYVSREK RPGFDHHKKA GAMNSLIRVS AVLSNAPYLL |
| |
| 561 | NVDCDHYINN SKAIRESMCF MMDPQSGKKV CYVQFPQRFD |
| |
| 601 | GIDRHDRYSN RNVVFFDINM KGLDGTQGPI YVGTGCVFRR |
| |
| 641 | QALYGFDAPK KKKPPGKTCN CWPKWCCLCC GLRKKSKTKA |
| |
| 681 | KDKKTNTKET SKQIHALENV DEGVIVPVSN VEKRSEATQL |
| |
| 721 | KLEKKFGQSP VFVASAVLQN GGVPRNASPA CLLREAIQVI |
| |
| 761 | SCGYEDKTEW GKEIGWIYGS VTEDILTGFK MHCHGWRSVY |
| |
| 801 | CMPKRAAFKG SAPINLSDRL HQVLRWALGS VEIFLSRHCP |
| |
| 841 | IWYGYGGGLK WLERFSYINS VVYPWTLSPL IVYCSLPAVC |
| |
| 881 | LLTGKFIVPE ISNYAGILFM LMFISIAVTG ILEMQWGGVG |
| |
| 921 | IDDWWRNEQF WVIGGASSHL FALFQGLLKV LAGVNTNFTV |
| |
| 1001 | TSKAADDGAF SELYIFKWTT LLIPPTTLLI INIIGVIVGV |
| |
| 1041 | SDAISNGYDS WGPLFGRLFF ALWVIVHLYP FLKGMLGKQD |
| |
| 1081 | KMPTIIVVWS ILLASILTLL WVRVNPFVAK GGPVLEICGL |
| |
| 1121 | NCGV |
A nucleotide sequence encoding the
Arabidopsis thaliana CesA2 protein with SEQ ID NO:1 is provided below as SEQ ID NO:2.
| 1 |
ATGAATACTG GTGGTCGGCT CATTGGTGGC TCTCACAACA |
| |
| 41 |
GAAACGAATT CGTTCTCATT AACGCCGATG AGAGTGCCAG |
| |
| 81 |
AATACGATCA GTACAAGAAC TGAGTGGGCA AACATGTCAA |
| |
| 121 |
ATCTGTGGAG ATGAAATCGA ATTAACGGTT AGCAGTGAGC |
| |
| 161 |
TCTTTGTTGC TTGCAACGAA TGCGCATTCC CGGTTTGTAG |
| |
| 201 |
ACCATGCTAT GAGTATGAAC GTAGAGAAGG AAATCAAGCT |
| |
| 241 |
TGTCCTCAGT GCAAAACTCG ATACAAAAGG ATTAAAGGTA |
| |
| 281 |
GTCCACGGGT TGATGGAGAT GATGAAGAAG AAGAAGACAT |
| |
| 321 |
TGATGATCTT GAGTATGAGT TTGATCATGG GATGGACCCT |
| |
| 361 |
GAACATGCCG CTGAAGCCGC ACTCTCTTCA CGCCTTAACA |
| |
| 401 |
CCGGTCGTGG TGGATTGGAT TCAGCTCCAC CTGGCTCTCA |
| |
| 441 |
GATTCCTCTT TTGACTTATT GTGATGAAGA TGCTGATATG |
| |
| 481 |
TATTCTGATC GTCATGCTCT TATCGTGCCT CCTTCAACGG |
| |
| 521 |
GATATGGGAA TCGCGTCTAT CCTGCACCGT TTACAGATTC |
| |
| 561 |
TTCTGCACCT CCACAGGCGA GATCAATGGT TCCTCAGAAA |
| |
| 601 |
GATATTGCGG AATATGGTTA TGGAAGTGTT GCTTGGAAGG |
| |
| 641 |
ACCGTATGGA AGTTTGGAAG AGACGACAAG GCGAAAAGCT |
| |
| 681 |
TCAAGTCATT AAGCATGAAG GAGGAAACAA TGGTCGAGGT |
| |
| 721 |
TCCAATGATG ACGACGAACT AGATGATCCT GACATGCCTA |
| |
| 761 |
TGATGGATGA AGGAAGACAA CCTCTCTCAA GAAAGCTACC |
| |
| 801 |
TATTCGTTCA AGCAGAATAA ATCCTTACAG GATGTTAATT |
| |
| 841 |
CTGTGTCGCC TCGCGATTCT TGGTCTTTTC TTTCATTATA |
| |
| 881 |
GAATTCTCCA TCCAGTCAAT GATGCATATG GATTATGGTT |
| |
| 921 |
AACGTCAGTT ATATGCGAGA TATGGTTTGC AGTGTCTTGG |
| |
| 961 |
ATTCTTGATC AATTCCCCAA ATGGTATCCT ATAGAACGTG |
| |
| 1001 |
AAACATACCT CGATAGACTC TCTCTCAGGT ACGAGAAGGA |
| |
| 1041 |
AGGAAAACCG TCAGGATTAG CACCTGTTGA TGTTTTTGTT |
| |
| 1081 |
AGTACAGTGG ATCCGTTGAA AGAGCCACCC TTGATTACAG |
| |
| 1121 |
CAAACACAGT TCTTTCCATT CTAGCAGTTG ATTATCCTGT |
| |
| 1161 |
GGATAAGGTT GCGTGTTATG TATCAGACGA TGGTGCAGCT |
| |
| 1201 |
ATGCTTACAT TTGAAGCTCT CTCTGATAGA GCTGAGTTTG |
| |
| 1241 |
CTAGAAAATG GGTTCCTTTT TGTAAGAAGT TTAATATCGA |
| |
| 1281 |
GCCACGAGCT CCTGAGTGGT ATTTTTCTCA GAAGATGGAT |
| |
| 1321 |
TACCTGAAGA ACAAAGTTCA TCCTGGTTTT GTCAGGGAAC |
| |
| 1361 |
GTCGTGCTAT GAAGAGAGAT TATGAGGAGT TTAAAGTGAA |
| |
| 1401 |
GATAAATGCA CTGGTTGCTA CTGCACAGAA AGTGCCTGAG |
| |
| 1441 |
GAAGGTTGGA CTATGCAAGA TGGAACTCCT TGGCCTGGAA |
| |
| 1481 |
ACAACGTCCG TGACCATCCT GGAATGATTC AGGTGTTCTT |
| |
| 1521 |
GGGTCATAGT GGAGTTCGTG ATACGGATGG TAATGAGTTA |
| |
| 1561 |
CCACGTCTAG TGTATGTTTC TCGTGAGAAG CGGCCTGGAT |
| |
| 1601 |
TTGATCACCA CAAGAAAGCT GGAGCTATGA ATTCCTTGAT |
| |
| 1641 |
CCGAGTCTCT GCTGTTCTAT CAAACGCTCC TTACCTTCTT |
| |
| 1681 |
AATGTCGATT GTGATCACTA CATCAACAAC AGCAAAGCAA |
| |
| 1721 |
TTAGAGAATC TATGTGTTTC ATGATGGACC CGCAATCGGG |
| |
| 1761 |
AAAGAAAGTT TGTTATGTTC AGTTTCCGCA GAGATTTGAT |
| |
| 1801 |
GGGATTGATA GACATGATAG ATACTCAAAC CGTAACGTTG |
| |
| 1841 |
TGTTCTTTGA TATTAACATG AAAGGTCTTG ATGGGATACA |
| |
| 1881 |
AGGACCGATA TATGTCGGGA CAGGTTGTGT GTTTAGAAGA |
| |
| 1921 |
CAGGCTCTTT ATGGTTTTGA TGCACCAAAG AAGAAGAAAC |
| |
| 1961 |
CACCAGGCAA AACCTGTAAC TGTTGGCCTA AATGGTGTTG |
| |
| 2001 |
TTTGTGTTGT GGGTTGAGAA AGAAGAGTAA AACGAAAGCC |
| |
| 2041 |
AAAGATAAGA AAACTAACAC TAAAGAGACT TCAAAGCAGA |
| |
| 2081 |
TTCATGCGCT AGAGAATGTC GACGAAGGTG TTATCGTCCC |
| |
| 2121 |
AGTGTCAAAT GTTGAGAAGA GATCTGAAGC AACACAATTG |
| |
| 2161 |
AAATTGGAGA AGAAGTTTGG ACAATCTCCG GTTTTCGTTG |
| |
| 2201 |
CCTCTGCTGT TCTACAGAAC GGTGGAGTTC CCCGTAACGC |
| |
| 2241 |
AAGCCCCGCA TGTTTGTTAA GAGAAGCCAT TCAAGTTATT |
| |
| 2281 |
AGCTGCGGGT ACGAAGATAA AACCGAATGG GGAAAAGAGA |
| |
| 2321 |
TCGGGTGGAT TTATGGATCG GTGACTGAAG ATATCCTGAC |
| |
| 2361 |
GGGTTTCAAG ATGCATTGCC ATGGATGGAG ATCTGTGTAC |
| |
| 2401 |
TGTATGCCTA AGCGTGCAGC TTTTAAAGGA TCTGCTCCTA |
| |
| 2441 |
TTAACTTGTC AGATCGTCTT CATCAAGTTC TACGTTGGGC |
| |
| 2481 |
TCTTGGCTCT GTAGAGATTT TCTTGAGCAG ACATTGTCCG |
| |
| 2521 |
ATATGGTATG GTTATGGTGG TGGTTTAAAA TGGTTGGAGA |
| |
| 2561 |
GATTCTCTTA CATCAACTCT GTCGTCTATC CTTGGACTTC |
| |
| 2601 |
ACTTCCATTG ATCGTCTATT GTTCTCTCCC CGCGGTTTGT |
| |
| 2641 |
TTACTCACAG GAAAATTCAT CGTCCCTGAG ATAAGCAACT |
| |
| 2681 |
ACGCAGGTAT ACTCTTCATG CTCATGTTCA TATCCATAGC |
| |
| 2721 |
AGTAACTGGA ATCCTCGAAA TGCAATGGGG AGGTGTCGGA |
| |
| 2761 |
ATCGATGATT GGTGGAGAAA CGAGCAGTTT TGGGTAATCG |
| |
| 2801 |
GAGGGGCCTC CTCGCATCTA TTTGCTCTGT TTCAAGGTTT |
| |
| 2841 |
GCTCAAAGTT CTAGCCGGAG TTAACACGAA TTTCACAGTC |
| |
| 2881 |
ACTTCAAAAG CAGCAGACGA TGGAGCTTTC TCTGAGCTTT |
| |
| 2921 |
ACATCTTCAA GTGGACAACT TTGTTGATTC CTCCGACAAC |
| |
| 2961 |
ACTTCTGATC ATTAACATCA TTGGAGTTAT TGTCGGCGTT |
| |
| 3001 |
TCTGATGCCA TTAGCAATGG CTATGACTCA TGGGGACCTC |
| |
| 3041 |
TCTTTGGGAG ACTTTTCTTC GCTCTTTGGG TCATTGTTCA |
| |
| 3081 |
TTTATACCCA TTCCTCAAGG GAATGCTTGG GAAGCAAGAC |
| |
| 3121 |
AAAATGCCTA CGATTATTGT GGTCTGGTCT ATTCTTCTAG |
| |
| 3161 |
CTTCGATCTT GACACTCTTG TGGGTCAGAG TTAACCCGTT |
| |
| 3201 |
TGTGGCTAAA GGGGGACCAG TGTTGGAGAT CTGTGGTCTG |
| |
| 3241 |
AATTGTGGAA ACTAA |
An example of an Arabidopsis thaliana CesA5 protein is provided below as SEQ ID NO:3.
| 1 |
MNTGGRLIAG SHNRNEFVLI NADESARIRS VEELSGQTCQ |
| |
| 41 |
ICGDEIELSV DGESFVACNE CAFPVCRPCY EYERREGNQS |
| |
| 81 |
CPQCKTRYKR IKGSPRVEGD EEDDGIDDLD FEFDYSRSGL |
| |
| 121 |
ESETFSRRNS EFDLASAPPG SQIPLLTYGE EDVEISSDSH |
| |
| 161 |
ALIVSPSPGH IHRVHQPHFP DPAAHPRPMV PQKDLAVYGY |
| |
| 201 |
GSVAWKDRME EWKREQNEKY QVVKHDGDSS LGDGDDADIP |
| |
| 241 |
MMDEGRQPLS RKVPIKSSKI NPYRMLIVLR LVILGLFFHY |
| |
| 281 |
RILHPVNDAY ALWLISVICE IWFAVSWVLD QFPKWYPIER |
| |
| 321 |
ETYLDRLSLR YEKEGKPSEL AGVDVFVSTV DPMKEPPLIT |
| |
| 361 |
ANTVLSILAV DYPVDRVACY VSDDGAAMLT FEALSETAEF |
| |
| 401 |
ARKWVPFCKK YTIEPRAPEW YFCHKMDYLK NKVHPAFVRE |
| |
| 441 |
RRAMKRDYEE FKVKINALVA TAQKVPEEGW TMQDGTPWPG |
| |
| 481 |
NNVRDHPGMI QVFLGNNGVR DVENNELPRL VYVSREKRPG |
| |
| 521 |
FDHHKKAGAM NSLIRVSGVL SNAPYLLNVD CDHYINNSKA |
| |
| 561 |
LREAMCFMMD PQSGKKICYV QFPQRFDGID KSDRYSNRNV |
| |
| 601 |
VFFDINMKGL DGLQGPIYVG TGCVFRRQAL YGFDAPKKKK |
| |
| 641 |
TKRMTCNCWP KWCLFCCGLR KNRKSKTTDK KKKNREASKQ |
| |
| 681 |
IHALENIEEG TKGTNDAAKS PEAAQLKLEK KFGQSPVFVA |
| |
| 721 |
SAGMENGGLA RNASPASLLR EADQVISCGY EDKTEWGKEI |
| |
| 761 |
GWIYGSVTED ILTGFKMHSH GWRSVYCTPK IPAFKGSAPI |
| |
| 801 |
NLSDRLHQVL RWALGSVEIF LSRHCPIWYG YGGGLKWLER |
| |
| 841 |
LSYINSVVYP WTSIPLLVYC SLPAICLLTG KFIVPEISNY |
| |
| 881 |
ASILFMALFG SIAVTGILEM QWGKVGIDDW WRNEQFWVLG |
| |
| 921 |
GVSAHLFALF QGLLKVLAGV ETNFTVTSKA ADDGEFSELY |
| |
| 961 |
IFKWTSLLIP PTTLLIINVI GVIVGISDAI SNGYDSWGPL |
| |
| 1001 |
FGRLFFAFWV ILHLYPFLKG LLGKQDRMPT IILVWSILLA |
| |
| 1041 |
SILTLLWVRV NPFVAKGGPI LEICGLDCL |
A nucleotide sequence encoding the Arabidopsis thaliana CesA5 protein with SEQ ID NO:3 is provided below as SEQ ID NO:4.
| 1 |
ATGAATACTG GTGGTCGGCT CATCGCTGGT TCTCACAATA |
| |
| 41 |
GGAATGAGTT CGTGTTGATT AATGCAGACG AGAGTGCCAG |
| |
| 81 |
AATTAGATCA GTGGAAGAAC TAAGTGGACA AACATGTCAA |
| |
| 121 |
ATCTGTGGAG ATGAGATTGA GCTAAGTGTT GATGGAGAGT |
| |
| 161 |
CTTTTGTGGG ATGTAATGAA TGTGCTTTCC CTGTCTGTAG |
| |
| 201 |
ACCTTGCTAT GAGTATGAGA GACGAGAAGG AAACCAATCT |
| |
| 281 |
TGTCCTCAGT GCAAAACTCG TTACAAGCGC ATCAAAGGAA |
| |
| 321 |
GTCCAAGGGT TGAAGGAGAT GAGGAGGATG ATGGAATTGA |
| |
| 361 |
TGATCTTGAT TTTGAGTTTG ATTATAGTAG GAGTGGCCTT |
| |
| 401 |
GAATCTGAAA CTTTCTCTCG CCGCAACTCG GAGTTTGATT |
| |
| 441 |
TGGCCTCTGC TCCACCTGGC TCACAGATTC CTTTGTTAAC |
| |
| 521 |
TTATGGAGAG GAGGACGTTG AAATTTCTTC TGATAGTCAT |
| |
| 561 |
GCTCTCATTG TTTCTCCATC ACCTGGCCAT ATCCATAGGG |
| |
| 601 |
TTCATCAACC TCATTTTCCT GACCCCGCTG CACATCCAAG |
| |
| 641 |
ACCAATGGTA CCTCAGAAAG ACCTTGCGGT CTATGGATAT |
| |
| 681 |
GGAAGTGTTG CGTGGAAGGA TCGTATGGAG GAGTGGAAGA |
| |
| 721 |
GAAAGGAGAA CGAAAAATAT CAGGTGGTTA AACATGATGG |
| |
| 761 |
AGATTCTAGT CTTGGAGACG GAGATGATGC TGATATTCCT |
| |
| 801 |
ATGATGGATG AGGGAAGGCA GGCTTTGTCT AGGAAAGTAC |
| |
| 841 |
CGATAAAGTC GAGCAAAATA AATCCGTAGA GGATGCTAAT |
| |
| 881 |
TGTTCTGCGT CTTGTGATTC TCGGTCTCTT TTTCCATTAC |
| |
| 921 |
CGTATTCTTC ACCCCGTCAA TGATGCTTAC GCCTTGTGGC |
| |
| 961 |
TAATTTCTGT GATATGCGAA ATATGGTTTG CGGTTTCATG |
| |
| 1041 |
GGTTCTTGAT CAGTTCCCTA AATGGTATCC TATAGAAAGA |
| |
| 1081 |
GAGACATACT TGGACAGGCT CTCATTGAGG TACGAAAAAG |
| |
| 1121 |
AAGGGAAACC ATCTGAACTA GCTGGTGTTG ATGTTTTTGT |
| |
| 1161 |
GAGTACAGTG GATCCGATGA AAGAGGCTCC GCTTATTACA |
| |
| 1201 |
GCAAACACTG TTCTGTCTAT TCTTGGGGTT GATTATCCGG |
| |
| 1241 |
TAGACAGAGT TGCCTGTTAT GTTTCTGATG ATGGTGCTGG |
| |
| 1281 |
TATGCTTACT TTTGAAGCCC TTTCAGAAAC AGCAGAGTTT |
| |
| 1321 |
GCTAGGAAAT GGGTTCCTTT CTGTAAGAAA TACACTATCG |
| |
| 1361 |
AGGCACGAGG TCCCGAATGG TATTTTTGGC ACAAGATGGA |
| |
| 1401 |
TTATTTAAAG AATAAAGTTC ACCCTGCATT TGTTAGGGAA |
| |
| 1441 |
CGGCGAGCCA TGAAGAGAGA TTATGAAGAA TTGAAGGTTA |
| |
| 1481 |
AGATCAATGC TTTAGTTGCG AGTGCACAGA AAGTGGCTGA |
| |
| 1521 |
AGAAGGTTGG ACTATGCAAG AGGGTACTCC TTGGGCCGGT |
| |
| 1561 |
AATAACGTGC GAGATCACCC TGGCATGATC CAGGTATTCC |
| |
| 1601 |
TTGGAAATAA CGGTGTCCGC GATGTAGAAA ACAACGAGTT |
| |
| 1641 |
GCCTCGGCTG GTTTATGTTT CTCGTGAGAA GAGACCCGGA |
| |
| 1681 |
TTTGACCATC ACAAGAAGGC TGGAGCCATG AACTCCCTGA |
| |
| 1721 |
TACGAGTCTC TGGAGTTCTA TCAAATGCTC CTTATCTTCT |
| |
| 1761 |
AAATGTCGAT TGTGATCACT ACATCAATAA TAGCAAAGCT |
| |
| 1801 |
CTTAGAGAAG CAATGTGTTT CATGATGGAT CCTCAGTCGG |
| |
| 1841 |
GAAAGAAAAT TTGTTATGTT CAATTCCCTC AAAGATTCGA |
| |
| 1881 |
TGGGATTGAT AAAAGTGACA GATACTCTAA TCGTAATGTT |
| |
| 1921 |
GTATTCTTCG ATATTAATAT GAAAGGTTTG GATGGATTAC |
| |
| 1961 |
AAGGGCCTAT ATACGTGGGA ACCGGGTGTG TTTTTAGGAG |
| |
| 2001 |
ACAAGCACTT TATGGATTTG ATGCGCCAAA AAAGAAGAAG |
| |
| 2041 |
ACTAAGCGTA TGACTTGCAA TTGCTGGCCT AAGTGGTGTT |
| |
| 2081 |
TGTTTTGTTG TGGTCTAAGA AAGAATCGTA AGTCAAAGAC |
| |
| 2121 |
AACGGATAAG AAAAAGAAGA ACAGGGAAGC CTCAAAGGAG |
| |
| 2161 |
ATACACGCGC TAGAAAATAT CGAAGAGGGC ACCAAAGGCA |
| |
| 2201 |
CTAATGATGC GGCGAAATCA CCAGAGGCGG CACAATTGAA |
| |
| 2241 |
GTTGGAGAAG AAGTTTGGAC AGTCTCCTGT TTTTGTTGCG |
| |
| 2281 |
TCTGCTGGTA TGGAGAATGG TGGGCTTGCT AGGAATGCGA |
| |
| 2321 |
GTCCAGCTTC TCTGCTTAGA GAAGCCATCC AAGTCATTAG |
| |
| 2361 |
TTGTGGATAC GAAGATAAAA CCGAATGGGG AAAAGAGATT |
| |
| 2401 |
GGGTGGATCT ACGGTTCTGT CACCGAGGAT ATCCTTACGG |
| |
| 2441 |
GTTTCAAGAT GCATTCTCAT GGCTGGAGAT CGGTTTACTG |
| |
| 2481 |
TACACCTAAG ATACCGGCCT TTAAAGGATC AGCACCTATC |
| |
| 2521 |
AATCTTTCTG ACCGTCTTCA TCAAGTTCTT CGGTGGGCGC |
| |
| 2561 |
TCGGGTCTGT TGAGATTTTC TTGAGCAGAC ATTGTCCTAT |
| |
| 2601 |
TTGGTATGGT TATGGAGGTG GTTTGAAATG GCTTGAGAGA |
| |
| 2641 |
TTGTCTTACA TCAACTCTGT GGTTTATCCA TGGACCTCTA |
| |
| 2681 |
TTCCACTCCT TGTTTACTGT TCTCTCCCAG CTATCTGTCT |
| |
| 2721 |
TCTCACCGGA AAATTCATCG TCCCTGAGAT TAGCAACTAT |
| |
| 2761 |
GCAAGTATCC TCTTCATGGC ACTTTTCGGG TCGATTGCTG |
| |
| 2801 |
TAACGGGCAT TCTCGAGATG CAATGGGGTA AAGTAGGGAT |
| |
| 2841 |
CGATGATTGG TGGAGAAACG AACAGTTTTG GGTGATTGGA |
| |
| 2881 |
GGTGTTTCAG CTCATCTCTT TGCTCTCTTC CAAGGTCTCC |
| |
| 2921 |
TAAAGGTTTT AGCCGGTGTT GAGACAAACT TCACAGTTAC |
| |
| 2961 |
ATCTAAAGCA GCAGATGATG GTGAATTCTC TGAGCTTTAC |
| |
| 3001 |
ATCTTCAAAT GGACATCACT CTTGATCCCT CCAACCACAC |
| |
| 3041 |
TACTCATCAT AAACGTAATC GGAGTCATTG TGGGAATATC |
| |
| 3081 |
TGATGCGATC AGTAAGGGAT ATGACTCGTG GGGTCCTCTT |
| |
| 3121 |
TTCGGAAGAT TGTTCTTTGC CTTTTGGGTC ATCCTCCATC |
| |
| 3161 |
TATATCCTTT CCTTAAAGGT CTGCTTGGGA AACAAGACAG |
| |
| 3201 |
AATGCCTACA ATCATTCTTG TCTGGTCGAT CCTTCTCGCC |
| |
| 3241 |
TCTATCCTTA CGCTTCTTTG GGTACGAGTC AATCCGTTTG |
| |
| 3281 |
TGGCGAAAGG CGGTCCTATC CTCGAGATAT GTGGCTTGGA |
| |
| 3321 |
CTGCCTTTGA |
An example of an Arabidopsis thaliana CesA6 protein is provided below as SEQ ID NO:5.
| 1 |
MNTGGRLIAG SHNRNEFVLI NADENARIRS VQELSGQTCQ |
| |
| 41 |
ICRDEIELTV DGETFVACNE CAFPVGRPCY EYERREGNQA |
| |
| 81 |
CPQCKTRFKR LKGSPRVEGD EEEDDIDLDD NEFEYGNNGI |
| |
| 121 |
GFDQVSEGMS ISRRNSGFPQ SDLDSAPPGS QIPLLTYGDE |
| |
| 161 |
DVEISSDRHA LIVPPSLGGH GNRVHPVSLS DPTVAAHPRP |
| |
| 201 |
MVPQKDLAVY GYGSVAWKDR MEEWKRKQNE KLQVVRHEGD |
| |
| 241 |
PDFEDGDDAD FPMMDEGRQP LSRKIPIKSS KINPYRMLIV |
| |
| 281 |
LRLVILGLFF HYRILHPVKD AYALWLISVI CEIWFAVSWV |
| |
| 321 |
LDQFPKWYPI ERETYLDRLS LRYEKEGKPS GLSPVDVFVS |
| |
| 361 |
TVDPLKEPPL ITANTVLSIL AVDYPVDKVA CYVSDDGAAM |
| |
| 401 |
LTFEALSETA EFARKWVPFC KKYCIEPRAP EWYFCHKMDY |
| |
| 441 |
LKNKVHPAFV RERRAMKRDY EEFKVKINAL VATAQKVPED |
| |
| 481 |
GWTMQDGTPW PGNSVPDHPG MIQVFLGSDG VRDVENNELP |
| |
| 521 |
RLVYVSREKR PGFDHEKKAG ANNSLIRVSG VLSNAPYLLN |
| |
| 561 |
VDCDHYINNS KALREAMCFM MDPQSGKKIC YVQFPQRFDG |
| |
| 601 |
IDRHDRYSNR NVVFFDINMK GLDGLQGPIY VGTGCVFRRQ |
| |
| 641 |
ALYGFDAPKK KKGPRKTCNC WPKWCLLCFG SRKNRKAKTV |
| |
| 681 |
AADKKKKNRE ASKQIHALEN IEEGRVTKGS NVEQSTEAMQ |
| |
| 721 |
MKLEKKFGQS PVFVASARME NGGMARNASP ACLLKEAIQV |
| |
| 761 |
ISCGYEDKTE WGKEIGWIYG SVTEDILTGF KMHSHGWRSV |
| |
| 801 |
YCTPKLAAFK GSAPINLSDR LHQVLRWALG SVEIFLSRHC |
| |
| 841 |
PIWYGIGGGL KWLERLSYIN SVVYPWTSLP LIVYCSLPAI |
| |
| 881 |
CLLTGKFIVP EISNYASILF MALFSSIAIT GILEMQWGKV |
| |
| 921 |
GIDDWWRNEQ FWVIGGVSAH LFALFQGLLK VLAGVDTNFT |
| |
| 961 |
VTSKAADDGE FSDLYLFKWT SLLIPPMTLL IINVIGVIVG |
| |
| 1001 |
VSDAISNGYD SWGPLFGRLF FALWVIIHLY PFLKGLLGKQ |
| |
| 1041 |
DRMPTIIVVW SILLASILTL LWVRVNPFVA KGGPILEICG |
| |
| 1081 |
LDCL |
A nucleotide sequence encoding the Arabidopis thaliana CesA6 protein with SEQ ID NO:5 is provided below as SEQ ID NO:6.
| 1 |
ATGAACACCG GTGGTCGGTT AATCGCCGGT TCTCACAACA |
| |
| 41 |
GGAATGAGTT TGTCCTCATT AATGCCGATG AGAATGCCCG |
| |
| 81 |
AATAAGATCA GTCCAAGAGC TGAGTGGACA GACATGTCAA |
| |
| 121 |
ATCTGCAGAG ATGAGATCGA ATTGACTGTT GATGGAGAAC |
| |
| 161 |
CGTTTGTGGC ATGTAACGAA TGTGCATTCC CTGTGTGTAG |
| |
| 201 |
ACCTTGCTAT GAGTACGAAA GACGAGAAGG CAATCAAGCT |
| |
| 241 |
TGTCCACAGT GGAAAACCCG TTTCAAACGT CTTAAAGGAA |
| |
| 281 |
GTCCAAGAGT TGAAGGTGAT GAAGAGGAAG ATGACATTGA |
| |
| 321 |
TGATTTAGAC AATGAGTTTG AGTATGGAAA TAATGGGATT |
| |
| 361 |
GGATTTGATC AGGTTTCTGA AGGTATGTCA ATCTCTCGTC |
| |
| 401 |
GCAACTCCGG TTTCCCACAA TCTGATTTGG ATTCAGCTCC |
| |
| 441 |
ACCTGGCTCT CAGATTCCAT TGCTGACTTA CGGCGACGAG |
| |
| 481 |
GACGTTGAGA TTTCTTCTGA TAGACATGCT CTTATTGTTC |
| |
| 521 |
CTCCTTCACT TGGTGGTCAT GGCAATAGAG TTCATCCTGT |
| |
| 561 |
TTCTCTTTCT GACCCGACCG TGGCTGCACA TCCAAGGCCT |
| |
| 601 |
ATGGTACCTC AGAAAGATCT TGCGGTTTAT GGTTATGGAA |
| |
| 641 |
GTGTCGCTTG GAAAGATCGG ATGGAGGAAT GGAAGAGAAA |
| |
| 681 |
GCAGAATGAG AAACTTCAGG TTGTTAGGCA TGAAGGAGAT |
| |
| 721 |
CCTGATTTTG AAGATGGTGA TGATGCTGAT TTTCCAATGA |
| |
| 761 |
TGGATGAGGG AAGGCAGCCA TTGTCTAGGA AGATACCAAT |
| |
| 801 |
GAAATCGAGC AAGATAAATC CTTACCGGAT GTTAATTGTG |
| |
| 841 |
CTACGTCTTG TGATTCTTGG TCTCTTCTTT CACTACCGTA |
| |
| 881 |
TTCTTCACCC CGTCAAAGAT GCATATGCTT TGTGGCTTAT |
| |
| 921 |
TTCTGTTATA TGTGAGATAT GGTTTGCTGT TTCATGGGTT |
| |
| 961 |
CTTGATCAGT TCCCTAAATG GTACCCTATC GAGCGAGAAA |
| |
| 1001 |
CGTACTTGGA CCGACTCTCA TTAAGATATG AGAAAGAAGG |
| |
| 1041 |
aAAACCGTCG GGACTATCCC CTGTGGATGT ATTTGTTAGT |
| |
| 1081 |
ACAGTGGATC CATTGAAAGA GCCTCCGCTT ATTACTGCAA |
| |
| 1121 |
ATACTGTCTT GTCTATTCTT GCTGTTGATT ATCCTGTCGA |
| |
| 1161 |
TAAGGTTGCT TGTTACGTAT CTGATGATGG TGCTGCTATG |
| |
| 1201 |
CTTACTTTCG AAGCTCTTTC TGAGACCGCT GAATTCGCAA |
| |
| 1241 |
GGAAATGGGT TCCTTTCTGC AAGAAATATT GTATTGAGCC |
| |
| 1281 |
TCGTGCTCCC GAATGGTATT TCTGCCATAA AATGGACTAC |
| |
| 1321 |
TTGAAGAATA AAGTTCATCC CGCATTTGTT AGGGAGCGGC |
| |
| 1361 |
GAGCCATGAA GAGAGATTAT GAAGAATTCA AAGTAAAGAT |
| |
| 1401 |
CAATGCTTTA GTAGCAACAG CACAGAAAGT GCCTGAGGAT |
| |
| 1441 |
GGTTGGACTA TGCAAGACGG TACACCTTGG CCCGGTAATA |
| |
| 1481 |
GTGTGCGAGA TCATCCTGGC ATGATTCAGG TCTTCCTTGG |
| |
| 1521 |
AAGTGACGGT GTTCGTGATG TCGAAAACAA CGAGTTGCCT |
| |
| 1561 |
CGATTAGTTT ACGTTTCTCG TGAGAAGAGA CCCGGATTTG |
| |
| 1601 |
ATCACCATAA GAAGGCTGGA GCTATGAATT CCCTGATACG |
| |
| 1641 |
AGTCTCTGGG GTTCTATCAA ATGCTCCTTA CCTTCTGAAT |
| |
| 1681 |
GTCGATTGTG ATCACTACAT CAACAATAGC AAAGCTCTTA |
| |
| 1721 |
GAGAAGCAAT GTGGTTCATG ATGGATCCTC AGTCAGGAAA |
| |
| 1761 |
GAAAATCTGT TATGTTCAGT TCCCTCAAAG GTTCGATGGG |
| |
| 1801 |
ATTGATAGGC ACGATCGATA CTCAAAGCGC AATGTTGTGT |
| |
| 1841 |
TCTTTGATAT CAATATGAAA GGTTTGGATG GGCTACAAGG |
| |
| 1881 |
GCCTATATAC GTCGGTACAG GTTGTGTTTT CAGGAGGCAA |
| |
| 1921 |
GCGCTTTACG GATTTGATGC ACCGAAGAAG AAGAAGGGCC |
| |
| 1961 |
CACGTAAGAC ATGCAATTGC TGGCCAAAAT GGTGTCTCCT |
| |
| 2001 |
ATGTTTTGGT TCAAGAAAGA ATCGTAAAGC AAAGACAGTG |
| |
| 2041 |
GCTGCGGATA AGAAGAAGAA GAATAGGGAA GCGTCAAAGC |
| |
| 2081 |
AGATCCACGC ATTAaAAAAT ATCGAAGAGG GCCGCGTCAC |
| |
| 2121 |
TAAAGGTTCT AACGTAGAAC AGTCAACCGA GGCAATGCAA |
| |
| 2161 |
ATGAAGTTGG AGAAGAAATT TGGGCAGTCT CCTGTATTTG |
| |
| 2201 |
TTGCATCTGC GCGTATGGAG AATGGTGGGA TGGCTAGAAA |
| |
| 2241 |
CGCAAGCCCG GCTTGTCTGC TTAAAGAAGC CATCCAAGTC |
| |
| 2281 |
ATTAGTTGCG GATATGAAGA TAAAACTGAA TGGGGAAAAG |
| |
| 2321 |
AGATTGGGTG GATCTATGGT TCTGTTACCG AAGATATTCT |
| |
| 2361 |
TACGGGTTTT AAGATGCATT CTCATGGTTG GAGATCTGTT |
| |
| 2401 |
TATTGTACAC CAAAGTTAGC GGCTTTCAAA GGATCAGCTC |
| |
| 2441 |
CAATCAATCT TTCGGATCGT CTCCATCAAG TTCTTCGATG |
| |
| 2481 |
GGCGCTTGGG TCGGTTGAGA TTTTCTTGAG TAGGCATTGT |
| |
| 2521 |
CCTATTTGGT ATGGTTATGG AGGTGGGTTG AAATGGCTTG |
| |
| 2561 |
AGCGGTTGTC CTACATTAAC TCTGTGGTTT ACCCGTGGAC |
| |
| 2601 |
CTCTCTACCG CTCATCGTTT ACTGTTCTCT CCCTGCCATC |
| |
| 2641 |
TGTCTTCTCA CTGGAAAATT CATCGTTCCC GAGATTAGCA |
| |
| 2681 |
ACTATGCGAG TATCCTCTTC ATGGCGCTCT TCTCGTCGAT |
| |
| 2721 |
TGCAATAACG GGTATTCTCG AGATGCAATG GGGCAAAGTT |
| |
| 2761 |
GGGATCGATG ATTGGTGGAG AAACGAACAG TTTTGGGTCA |
| |
| 2801 |
TTGGAGGTGT TTCTGCGCAT CTGTTTGCTC TCTTCCAAGG |
| |
| 2841 |
TCTCCTCAAG GTTCTTGCTG GTGTCGACAC TAACTTCACA |
| |
| 2881 |
GTCACATCAA AAGCAGCTGA TGATGGAGAG TTCTCTGACC |
| |
| 2921 |
TTTACCTCTT CAAATGGACT TCACTTCTCA TCCCTCCAAT |
| |
| 2961 |
GACTCTACTC ATCATAAACG TCATTGGAGT CATAGTCGGA |
| |
| 3001 |
GTCTCTGATG CCATCAGCAA TGGATACGAC TCGTGGGGAC |
| |
| 3041 |
CGCTTTTCGG AAGACTGTTC TTTGCACTTT GGGTCATCAT |
| |
| 3081 |
TCATCTTTAC CCGTTCCTTA AAGGTTTGCT TGGGAAACAA |
| |
| 3121 |
GATAGAATGC CAACCATTAT TGTCGTCTGG TCCATCCTCC |
| |
| 3161 |
TGGCCTCGAT TCTTACACTT CTTTGGGTCC GGGTTAATCC |
| |
| 3201 |
GTTTGTGGCG AAAGGCGGTC CTATTCTCGA GATCTGTGGT |
| |
| 3241 |
TTAGACTGCT TGTGA |
A Gossypium hirsutum (cotton) CesA2 protein sequence is provided below as SEQ ID NO:7.
| 1 |
MDTGGRLIAG SHNRNEFVLI NADENARIKS VQELSGQTCQ |
| |
| 41 |
ICGDEIEITV DGEPEVACNE CAFPVCRPCY EYERREGNQA |
| |
| 81 |
CPQCKTRYKR IKGSPRVEGD EEEDGIDDLD NEFDYDASDP |
| |
| 121 |
QQVAEAMLNA RLNTGRGTHQ NASGMPASSE LDSSLPSSQI |
| |
| 161 |
PLLTYGEEDL EISADHHALI VPQFMGNGNR VHPMPCSDPS |
| |
| 201 |
VPLQPRPMVP KKDIAVYGYG SVAWKDRMEE WKKRQNDKLQ |
| |
| 241 |
VVKHEGGNDG GNFDGKELDD ADLPMMDEGR QPLSRKLPIP |
| |
| 281 |
SSKINPYRMI IILRLAILGL FFHYRLLHPV RDAYGLWLTS |
| |
| 321 |
VICEIWFAVS WILDQFPKWC PIERETYLDR LSLRYEKEGK |
| |
| 361 |
PSELASVDIF VSTVDPMKEP PLITANTVLS ILAVDYPVDK |
| |
| 401 |
VACYVSDDGA AMLTFEALSE TAEFARKWVP FCKKFNIEPR |
| |
| 441 |
APEWYFSQKI DYLRNKVHPA FVRERRAMKR EYEEFKVQIN |
| |
| 481 |
GLVATAQKVP EDGWTMQDGT PWPGNNVRDH PGMIQVFLGD |
| |
| 521 |
NGVRDVEGNE LPSLVYVSRE KRPGFEHHKK AGAMNALIRV |
| |
| 561 |
SAVLSNAPYL LNVDCDHYIN NSKALREAMC FMMDPTSGKK |
| |
| 601 |
VCYVQFPQRF DGIDRHDRYS NRNVVFFDIN MKGLDGLQGP |
| |
| 641 |
IYVGTGCVFR RQALYGFDAP VTKKPPGKTC NCLPKWCCFL |
| |
| 681 |
CCCSRKNKKQ KQKKEKTKKS KQREASKQIH ALENIEGAIS |
| |
| 721 |
ESNSQSSVTS QMKLEKKFGQ SPVFVASTLP EDGGVPQNAS |
| |
| 761 |
PASLLREAIQ VISCGYEDKT EWGKEVGWIY GSVTEDILTG |
| |
| 801 |
FKMHCHGWRS VYCIPKRPAF KGSAPINLSD RLHQVLRWAL |
| |
| 841 |
GSVEIFLSRH CPIWYGYGGG LKWLERFSYI NSVVYPWTSI |
| |
| 881 |
PLLVYCTLPA ICLLTGKFIV PEISNYASLV FMGLFISIAA |
| |
| 921 |
TGILEMQWGG VGIDDWWRNE QFWVIGGVSS HLFALFQGLL |
| |
| 961 |
KVLAGVSTSF TVTSKAADDG EFSELYLFKW TSLLIPPTTL |
| |
| 1001 |
LIINIVGVVV GISDAINNGY DSWGPFLGRL FFAFWVIIHL |
| |
| 1041 |
YPFLKGLLGK QDRMPTIILV WSILLASILT LMWVRINPFV |
| |
| 1081 |
SKDGPVLEIC GLNCDD |
The Gossypium hirsutum (cotton) CesA2 protein sequence with SEQ ID NO:7 has substantial sequence identity (more than 83%) to the Arabidopsis thaliana CesA2 protein with SEQ ID NO:1, as illustrated below.
| 83.7% identity in 1099 residues overlap; Score: 4885.0; Gap |
|
| frequency: 2.0% |
| Seq1 |
1 |
MNTGGRLIAGSHNRNEFVLINADESARIRSVQELSGQTCQICGDEIELTVSSELFVACNE |
|
| Seq7 |
1 |
MDTGGRLIAGSHNRNEFVLINADENARIKSVQELSGQTCQICGDEIEITVDGEPFVACNE |
| |
|
* ********************** *** ****************** ** * ****** |
| |
| Seq1 |
61 |
CAFPVCRPCYEYERREGNQACPQCKTRYKRIKGSPRVDGDDEEEEDIDDLEYEFDH-GMD |
| Seq7 |
61 |
CAFPVCRPCYEYERREGNQACPQCKTRYKRIKGSPRVEGD-EEEDGIDDLDNEFDYDASD |
| |
|
************************************* ** *** **** *** * |
| |
| Seq1 |
120 |
PEHAAEAALSSRLNTGRGG------------LDSAPPGSQIPLLTYCDEDADMYSDRHAL |
| Seq1 |
120 |
PQQVAEAMLNARLNTGRGTHQNASGMPASSELDSSLPSSQIPLLTYGEEDLEISADHHAL |
| |
|
* *** * ******* *** * ******** ** * *** |
| |
| Seq1 |
168 |
IVPPSTGYGNRVYPAPFTDSSAPPQARSMVPQKDIAEYGYGSVAWKDRMEVWKRRQGEKL |
| Seq7 |
180 |
IVPQFMGNGNRVHPMPCSDPSVPLQPRPMVPKKDIAVYGYGSVAWKDRMEEWKKRQNDKL |
| |
|
*** * **** * * * * * * * *** **** ************* ** ** ** |
| |
| Seq1 |
228 |
QVIKHEGGNNGRGSNDDDELDDPDMPMMDEGRQPLSRKLPIRSSRINPYRMLILCRLAIL |
| Seq7 |
240 |
QVVKHEGGNDG-GNFDGKELDDADLPMMDEGRQPLSRKLPIPSSKINPYRMIIILRLAIL |
| |
|
** ****** * * * **** * **************** ** ****** * ***** |
| |
| Seq1 |
288 |
GLFFHYRILHPVNDAYGLWLTSVICEIWFAVSWILDQFPKWYPIERETYLDRLSLRYEKE |
| Seq7 |
299 |
GLFFHYRLLHPVRDAYGLWLTSVICEIWFAVSWILDQFPKWCPIERETYLDRLSLRYEKE |
| |
|
******* **** **************************** ****************** |
| |
| Seq1 |
348 |
GKPSGLADVDVFVSTVDPLKEPPLITANTVLSILAVDYPVDKVACYVSDDGAAMLTFEAL |
| Seq7 |
359 |
GKPSELASVDIFVSTVDPMKEPPLITANTVLSILAVDYPVDKVACYVSDDGAAMLTFEAL |
| |
|
**** ** ** ******* ***************************************** |
| |
| Seq1 |
408 |
SDTAEFARKWVPFCKKFNIEPRAPEWYESQKMDYLKNKVHPAFVRERRAMKRDYEEFKVK |
| Seq7 |
419 |
SETAEFARKWVPFCKKFNIEPRAPEWYFSQKIDYLRNKVHPAFVRERRAMKREYEEFKVQ |
| |
|
* ***************************** *** **************** ****** |
| |
| Seq1 |
468 |
INALVATAQKVPEEGWTMQDGTPWPGNNVRDHPGMIQVFLGHSGVRDTDGNELPRLVYVS |
| Seq7 |
479 |
INGLVATAQKVPEDGWTMQDGTPWPGNNVRDHPGMIQVFLGDNGVRDVEGNELPSLVYVS |
| |
|
** ********** *************************** **** ***** ***** |
| |
| Seq1 |
528 |
REKRPGFDHHKKAGAMNSLIRVSAVLSNAPYLLNVDCDHYINNSKAIRESMCFMMDPQSG |
| Seq7 |
539 |
REKRPGFEHHKKAGAMNALIRVSAVLSNAPYLLNVDCDHYINNSKALREAMCFMMDPTSG |
| |
|
******* ********* **************************** ** ******* ** |
| |
| Seq1 |
588 |
KKVSYVQFPQRFDGIDRHDRYSNRNVVFFDINMKGLDGIQGPIYVGTGCVFRRQALYGFD |
| Seq7 |
599 |
KKVCYVQFPQRFDGIDRHDRYSNRNVVFFDINMKGLDGLQGPIYVGTGCVFRRQALYGFD |
| |
|
************************************** ********************* |
| |
| Seq1 |
648 |
APKKKKPPGKTCNCWPKWCC-LCCGLRKKSKTKAKDKKTNT---KETSKQIHALENVDEG |
| Seq7 |
659 |
APVTKKPPGKTCNCLPKWCCFLCCCSRKNKKQKQKKEKTKKSKQREASKQIHALENI-EG |
| |
|
** ********** ***** *** ** * * * ** * ********* ** |
| |
| Seq1 |
704 |
VIVPVSNVEKRSEATQLKLEKKFGQSPVFVASAVLQNGGVPRNASPACLLREAIQVISCG |
| Seq7 |
718 |
AISESNS--QSSVTSQMKLEKKFGQSPVFVASTLPEDGGVPQNASPASLLREATQVISCG |
| |
|
* * * *************** ***** **** ************ |
| |
| Seq1 |
764 |
YEDKTEWGKEIGWIYGSVTEDILTGFKMHCHGWRSVYCMPKRAAFKGSAPINLSDRLHQV |
| Seq7 |
776 |
YEDKTEWGKEVGWIYGSVTEDILTGFKMHCHGWRSVYCIPKRPAFKGSAPINLSDRLHQV |
| |
|
********** *************************** *** ***************** |
| |
| Seq1 |
824 |
LRWALGSVEIFLSRHCPIWYGYGGGLKWLERFSYINSVVYPWTSLPLIVYSSLPAVCLLT |
| Seq7 |
836 |
LRWALGSVEIFLSRHCPIWYGYGGGLKWLERFSYINSVVYPWTSIPLLVYCTLPAICLLT |
| |
|
******************************************** ** *** *** **** |
| |
| Seq1 |
884 |
GKFIVPEISNYAGILFMLMFISIAVTGILEMQWGGVGIDDWWRNEQFWVIGGASSHLFAL |
| Seq7 |
896 |
GKFIVPEISNYASLVFMGLFISIAATGILEMQWGGVGIDDWWRNEQFWVIGGVSSHLFAL |
| |
|
************ ** ***** *************************** ******* |
| |
| Seq1 |
944 |
FQGLLKVLAGVNTNFTVTSKAADDGAFSELYIFKWTTLLIPPTTLLIINIIGVIVGVSDA |
| Seq7 |
956 |
FQGLLKVLAGVSTSFTVTSKAADDGEFSELYLFKWTSLLIPPTTLLIINIVGVVVGISDA |
| |
|
*********** * *********** ***** **** ************* ** ** *** |
| |
| Seq1 |
1004 |
ISNGYDSWGPLFGRLFFALWVIVHLYPFLKGMLGKQDKMPTIIVVWSILLASILTTLWVR |
| Seq7 |
1016 |
INNGYDSWGPLFGRLFFAFWVIIHLYPFLKGLLGKQDRMPTTILVWSILLASILTLMWVR |
| |
|
* **************** *** ******** ***** ***** ************ *** |
| |
| Segl |
1064 |
VNPFVAKGGPVLEICGLNC |
| Seq7 |
1016 |
INPFVSKDGPVLEICGLNC |
| |
|
**** * *********** |
Another Gossypium hirsutum (cotton) CesA2 protein sequence is provided below as SEQ ID NO:8.
| 1 |
MDTGGRLIAG SHNRNEFVLI NADENARIKS VQELSGQTCO |
| |
| 41 |
ICGDEIEITV DGEPFVACNE CAFPVCRPCY EYERREGNQV |
| |
| 81 |
CPQCKTRYKR IKGSPRVEGD EEEDDIDDLD NEFDYDALDP |
| |
| 121 |
QQVAEAMLNA RINTGRGTHQ NAYGMPASSE LDSSLPSSQI |
| |
| 161 |
PLLTYGEEDS EISADHHALI VPQFMGNGNR VHPMPCSDPS |
| |
| 201 |
VPLQPRPMVP KKDIAVYGYG SVAWKDRMEE WKKRQNDKLQ |
| |
| 241 |
VVKHEGGNDG GNFDGKELDD ADLPMMDEGR QPLSRKLPIP |
| |
| 281 |
SSKINPYRMI IILRIAILGL FFHYRLLHPV RDAYGLWLTS |
| |
| 321 |
VICEIWFAVS WILDQFPKWC HTERETYLDR LSLRYEKEGK |
| |
| 361 |
PSELASVDIF VSTVDPMKEP PLITANTVLS ILAVDYPVDK |
| |
| 401 |
VACYVSDDGA AMLTFEALSE TAEFARKWVP FCKKFNIEPR |
| |
| 441 |
APEWYFSQKI DYLRNKVHPA FVRERRAMKR EYEEFKVQIN |
| |
| 481 |
GLVATAQKVP EDGWTMQDGT PWPGNNVRDH PGMIQVFLGD |
| |
| 521 |
NGVRDVEGNE LPSLVYVSRE KRPGFEHHKK AGAMNALIRV |
| |
| 561 |
SAVLSNAPYL LNVDCDHYIN NSKALREAMC FMMDPTSGKK |
| |
| 601 |
VCYVQFPQRF DGIDRHDRYS NRNVVFFDIN MKGLDGIQGP |
| |
| 641 |
IYVGTGCVFR RQALYGFDAP VTKYPPGKTC NCLPKWCCFL |
| |
| 681 |
CCCSRKNKKQ KQKKEKTKKS KQREASKQIH ALENIEGAIS |
| |
| 721 |
ESNSQSSVTS EMKLEKKFGQ SPVFVASTLL EDGGVPQNAS |
| |
| 761 |
PASLLREAIQ VISCGYEDKT EWGKEVGWMY GAVTEDILTG |
| |
| 801 |
FKMHCHGWRS VYCIPKRPAF KGSAPINLSD RLHQVLRWAL |
| |
| 841 |
GSVEIFLSRH CPIWYGYGGG LKWLERFSYI NSVVYPWTSI |
| |
| 881 |
PLLVYCTLPA ICLLTGKFIV PEISNYASLV FMGLFISIAA |
| |
| 921 |
TGILEMQWGG VGIDDWWRNE QFWVIGGVSS HLFALFQGLL |
| |
| 961 |
KVLAGVSTSF TVTSKAADDG EFSELYLFKW TSLLIPPTTL |
| |
| 1001 |
LIINIVGVVV GISDAINNGY DSWGPLFGRL FFAFWVIIHL |
| |
| 1041 |
YPFLKGLLGK QDRMPTIILV WSILLASILT LMWVRINPFV |
| |
| 1081 |
SKDGPLLEIC GLNCDD |
The Gossypium hirsutum (cotton) CesA2 protein sequence with SEQ ID NO:8 has substantial sequence identity (more than 83%) to the Arabidopsis thaliana CesA2 protein with SEQ ID NO:1, as illustrated below.
| 83.3% identity in 1099 residues overlap; Score. 48%9,0; Gap frequency: |
|
| 2.0% |
| Seq1 |
1 |
MNTGGRLIAGSHNRNEFVLINADESARIRSVQELSGQTCQICGDEIELTVSSELFVACNE |
|
| Seq8 |
1 |
MDTGGRLIAGSHNREEFVLINADENARIKSVQELSGQTCQICGDEIEITVDGEPFVACNE |
| |
|
* ********************** *** ****************** ** * ****** |
| |
| Seq1 |
61 |
CAFPVCRPCYEYERREGNQACPQCKTRYKRIKGSPRVDGDDEEEEDIDDLEYEFDH-GMD |
| Seq8 |
61 |
CAFPVCRPCYEYERREGNQVCPQCKTRYKRIKGSPRVEGD-EEEDDIDDLDNEFDYDALD |
| |
|
******************* ***************** ** *** ***** *** * |
| |
| Seq1 |
120 |
PEHAAEAALSSRLNTGRGG------------LDSAPPGSQIPLLTYCDEDADMYSDRHAL |
| Seq8 |
120 |
PQQVAEAMLNARINTGRGTHQNAYGMPASSELDSSLPSSQIPLLTYGEEDSEISADHHAL |
| |
|
* *** * * ***** *** * ******** ** * *** |
| |
| Seq1 |
168 |
IVPPSTGYGNRVYPAPFTDSSAPPQARSMVPQKDIAEYGYGSVAWKDRMEVWKRRQGEKL |
| Seq8 |
180 |
IVPQFMGNGNRVHPMPCSDPSVPLQPRPMVPKKDIAVYGYGSVAWKDRMEEWKKRQNDKL |
| |
|
*** * **** * * * * * * * *** **** ************* ** ** ** |
| |
| Seq1 |
228 |
QVIKHEGGNNGRGSNDDDELDDPDMPMMDEGRQPLSRKLPIRSSRINPYRMLILCRLAIL |
| Seq8 |
240 |
QVVKHEGGNDG-GNFDGKELDDADLPMMDEGRQPLSRKLPIPSSKINPYRMIIILRLAIL |
| |
|
** ****** * * * **** * **************** ** ****** * ***** |
| |
| Seq1 |
238 |
GLFFHYRILHPVNDAYGLWLTSVICEIWFAVSWILDQFPKWYPIERETYLDRISLRYEKE |
| Seq8 |
299 |
GLFFHYRLLHPVRDAYGLWLTSVICEIWFAVSWILDQFPKWCHIERETYLDRLSLRYEKE |
| |
|
******* **** **************************** ***************** |
| |
| Seq1 |
348 |
GKPSGLAPVDVFVSTVDPLKEPPLITANTVLSILAVDYPVDKVACYVSDDGALMLTFEAL |
| Seg8 |
339 |
GKPSELASVDIFVSTVDPMKEPPLITANTVLSILAVDYPVDKVACYVSDDGAAMLTFEAL |
| |
|
**** ** ** ******* ***************************************** |
| |
| Seq1 |
408 |
SDTAEFARKWVPFCKKFNIEPRAPEWYFSQKMDYLKNKVHPAFVRERRAMKRDYEEFKVK |
| Seq8 |
419 |
SETAEFARKWVPFCKKFNIEPRAPEWYESQKIDYLRNKVHPAFVRERRAMKREYEEFKVQ |
| |
|
* ***************************** *** **************** ****** |
| |
| Seq1 |
468 |
INALVATAQKVPEEGWTMQDGTPWPGNNVRDHPGMIQVFLGHSGVRDTDGNELPRLVYVS |
| Seq8 |
479 |
INGLVATAQKVPEDGWTMQDGTPWPGNNVRDHPGMIQVFLGDNGVRDVEGNELPSLVYVS |
| |
|
** ********** *************************** **** ***** ***** |
| |
| Seq1 |
528 |
REKRPGFDHHKKAGAMNSLIRVSAVLSNAPYLLNVDCDHYINNSKAIRESMCFMMDPQSG |
| Seq8 |
539 |
REKRPGFEHHKKAGAMNALIRVSAVLSNAPYLLNVDCDHYINNSKALREAMCFMMDPTSG |
| |
|
******* ********* **************************** ** ******* ** |
| |
| Seq1 |
538 |
KKVCYVQFPQRFDGIDRHDRYSNRNVVFFDINMKGLDGIQGPIYVGTGCVFRRQALYGFD |
| Seq8 |
599 |
KKVCYVQFPQRFDGIDRHDRYSNRNVVFFDINMKGLDGIQGPIYVGTGCVFRRQALYGFD |
| |
|
************************************************************ |
| |
| Seq1 |
648 |
APKKKKPPGKTCNCWPKWCC-LCCGLRKKSKTKAKDKKTNT---KETSKQIHALENVDEG |
| Seg8 |
659 |
APVTKKPPGKTCNCLPKWCCFLCCCSRKNKKQKQKKEKTKKSKQREASKQIHALENI-EG |
| |
|
** ********** ***** *** ** * * * ** * ********* ** |
| |
| Seq1 |
704 |
VIVPVSNVEKRSEATQLKLEKKEGQSPVFVASAVLQNGGVPRNASPACLLREAIQVISCG |
| Seq8 |
718 |
AISESNS--QSSVTSEMKLEKKEGQSPVFVASTLLEDGGVPQNASPASLLREAIQVISCG |
| |
|
* * *************** * **** ***** ************ |
| |
| Seq1 |
764 |
YEDKTEWGKEIGWIYGSVTEDILTGFKMHCHGWRSVYCMPKRAAFKGSAPINLSDRLHQV |
| Seq8 |
776 |
YEDKTEWGKEVGWMYGAVTEDILTGFKMHCHGWRSVYCIPKRPAFKGSAPINLSDRLHQV |
| |
|
********** ** ** ********************* *** ***************** |
| |
| Seq1 |
824 |
LRWALGSVEIFLSRHCPIWYGYGGGLKWLERFSYINSVVYPWTSLPLIVYCSLTAVCLLT |
| Seq6 |
836 |
LRWALGSVEIFLSRHCPIWYGYGGGLKWLERFSYINSVVYPWTSIPLLVYCTLPAICLLT |
| |
|
******************************************** ** *** *** **** |
| |
| Seq1 |
884 |
GKFIVPEISNYAGILFMLMFISIAVTGILEMQWGGVGIDDWWRNEQFWVIGGASSHLFAL |
| Seq8 |
896 |
GKFIVPEISNYASLVFMGLFISIAATGILEMQWGGVGIDDWWRNEQFWVIGGVSSHLFAL |
| |
|
************ ** ***** *************************** ******* |
| |
| Seq1 |
944 |
FQGLLKVLAGVNTNFTVTSKAADDGANSELYIFKWTTLLIPPTTLLIINIIGVIVGVSDA |
| Seq8 |
956 |
FQGLLKVLAGVSTSFTVTSKAADDGEFSELYLFKWTSLLIPPTTLLIINIVGVVVGISDA |
| |
|
*********** * *********** ***** **** ************* ** ** *** |
| |
| Seq1 |
1004 |
ISNGYDSWGPLFGRLFFALWVIVHLYPFLKGMLGKQDKMPTIIVVWSILLASILTLLWVR |
| Seq8 |
1016 |
INNGYDSWGPLFGRLFFAFWVIIHLYPFLKGLLGKQDRMPTIILVWSILLASILTLMWVR |
| |
|
* **************** *** ******** ***** ***** ************ *** |
| |
| Seq1 |
1064 |
VNPFVAKGGPVLEICGLNC |
| Seq8 |
1076 |
INPFVSKDGPLLEICGLNC |
| |
|
**** * ** ******** |
An example of Gossypium hirsutum (cotton) CesA5 protein is provided below as SEQ ID NO:9.
| 1 |
MDTKGRLVAG SHNRNEFVLI NADEVARVTS VKELSGQICQ |
| |
| 41 |
ICGDEIEISV DGEPFVACNE CAFPVCRACY EYERREGNQA |
| |
| 81 |
CPQCKTRYKR IKGCPRVEGD EEEDGADDLE NEFDIASHDR |
| |
| 121 |
RDPHHIAAAM LSGRYNINHG SQPHVSGIST PAELDAASVA |
| |
| 161 |
AGIPLLTYGQ EDVGISPDKH ALIVPPFMSR GKRVHPMPMP |
| |
| 201 |
DPSMTLPPRP MDPKKDLAVY GYGTVAWKER MEDWKKKQNE |
| |
| 241 |
KLQVVKHEGN NGDEFEDSDL PMMDEGRQPL SRKLPIPSSK |
| |
| 281 |
INPYRLIILL RLAVLGLFFH YRILHPVNDA YVLWLISVIC |
| |
| 321 |
EIWFAVSWIL DQFPKWYPIE RETYLDRLSL RYEKEGKPSE |
| |
| 361 |
LASVDVFVST VDPMKEPPLI TANTVLSILS VDYPVDKVAC |
| |
| 401 |
YVSDDGAAML TFEALSETSE FARKWVPFCK KFSIEPRAPE |
| |
| 441 |
WYFAQKVDYL RDKVDPTFVR ERRAMKREYE EFKVRINSLV |
| |
| 481 |
AMAQKVPEEG WTMQDGTPWP GNNVRDHPGM IQVFLGHDGV |
| |
| 521 |
RDIEGNELPR LIYVSREKRP GFDHHKKAGA MNSLVRVSAV |
| |
| 561 |
ISNAPFLLNV DCDHYINNSK ALREAMCFMM DPISGKKICY |
| |
| 601 |
VQFPQRFDGI DRHDRYSNRN VVFFDINMKG LDGIQGPIYV |
| |
| 641 |
GTGCVFRRQA LYGYDAPVKK KFPRRTCNCL PKWCCCCCCC |
| |
| 681 |
RSKRKNKKSK SIDKKKKEVP KHKHALENIE EGIEGIDNEK |
| |
| 721 |
SAIMPQIKFE KKFGQSPVFI ASTLMEDGGI PKGATTASLL |
| |
| 761 |
KEAIHVISCG YEDKTDWGKE VGWIYGSVTE DILTGFKMHC |
| |
| 801 |
HGWRSVYCIP KRPAFKGSAP INLSDRLHQV LRWALGSVEI |
| |
| 841 |
FLSRHCPIWY GYGCGLKSLE RFSYIASVVY PLTSVPLLVY |
| |
| 881 |
CTLPAICLLT GKFIVPEISN YASLLFMSLF IVIAVTSILE |
| |
| 921 |
MQWGGVGIHD WWRNEQFWVI GGVSSHLFAL FQGLLKVLAG |
| |
| 961 |
VNTNFTVTSK GGDDGEFSEL YLFKWTSLLI PPMTLLIINI |
| |
| 1001 |
IGVIVGISDA ISNGYDSWGP LFGRLFFAFW VIVHLYPFLK |
| |
| 1041 |
GLMGKQDRLP TIIVVWSILL ASIFSLLWAR VNPFISKGGI |
| |
| 1081 |
VLEVCGLNCD |
The Gossypium hirsutism (cotton) CesA5 protein sequence with SEQ ID NO:9 has substantial sequence identity (more than 79%) to the Arabidopsis thaliana CesA5 protein with SEQ ID NO:3, as illustrated below.
| 79.6% identity in 1093 residues overlap; Score: 4559,0; Gap frequency: |
|
| 2,7% |
| Seq3 |
1 |
MNTGGRLIAGSHNRNEFVLINADESARIRSVEELSGQTCQICGDEIELSVDGESFVACNE |
|
| Seq9 |
1 |
MDTKGRLVAGSHNRNEFVLINADEVARVTSVKELSGQICQICGDEIEISVDGEPFVACNE |
| |
|
* * *** **************** ** ** ***** ********* ***** ****** |
| |
| Seq3 |
61 |
CAFPVCRPCYEYERREGNQSCPQCKTRYKRIKGSPRVEGDEEDDGIDDLDFEFD------ |
| Seq9 |
61 |
CAFPVCRACYEYERREGNQACPQCKTRYKRIKGCPRVEGDEEEDGADDLENEFDIASHDR |
| |
|
******* *********** ************* ******** ** *** *** |
| |
| Seq3 |
115 |
--------------YSRSGLESETFSRRNSEFDLASAPPGSQIPLLTYGEEDVEISSDSH |
| Seq9 |
121 |
RDPHHIAAAMLSGRYNINHGSQPHVSGISTPAELDAASVAAGIPLLTYGQEDVGISPDKH |
| |
|
* * * * ******* *** ** * * |
| |
| Seq3 |
161 |
ALIVSPSPGHIHRVHQPHFPDPAAH--PRPMVPQKDLAVYGYGSVAWKDRMEEWKRKQNE |
| Seq9 |
161 |
ALIVPPFMSRGKRVHPMPMPDPSMTLPPRPMDPKKDLAVYGYGTVAWKERMEDWKKKQNE |
| |
|
**** * *** *** **** * ********* **** *** ** **** |
| |
| Seq3 |
219 |
KYQVVKHDGDSSLGDGDDADIPMMDEGRQPLSRKVPIKSSKINPYRMLIVLRLVILGLFF |
| Seq9 |
241 |
KLQVVKHEGNNG-DEFEDSDLPMMDEGRQPLSRKLPIPSSKINPYRLIILLRLAVLGLFF |
| |
|
* ***** * * * ************* ** ******** * *** ***** |
| |
| Seq3 |
279 |
HYRILHPVNDAYALWLISVICEIWFAVSWVLDQFPKWYPIERETYLDRLSLRYEKEGKPS |
| Seq9 |
300 |
HYRILHPVNDAYVLWLISVICEIWFAVSWILDQFPKWYPIERETYLDRLSLRYEKEGKPS |
| |
|
************ **************** ****************************** |
| |
| Seq3 |
339 |
ELAGVDVFVSTVDPMKEPPLITANTVLSILAVDYPVDRVACYVSDDGAAMLTFEALSETA |
| Seq9 |
360 |
ELASVDVFVSTVDPMKEPPLITANTVLSILSVDYPVDKVACYVSDDGAAMLTFEALSETS |
| |
|
*** ************************** ****** ********************* |
| |
| Seq3 |
399 |
EFARKWVPFCKKYTIEPRAPEWYFCHKMDYLKNKVHPAFVRERRAMKRDYEEFKVNINAL |
| Se39 |
420 |
EFARKWVPFCKKFSIEPRAPEWYFAQKVDYLRDKVDPTFVRERRAMKREYEEFKVRINSL |
| |
|
************ ********** * *** ** * ********** ****** ** * |
| |
| Seq3 |
459 |
VATAQKVPEEGWTMQDGTPWPGNNVRDHPGMIQVFLGNNGVRDVENNELPRLVYVSREKR |
| Seq9 |
480 |
VAMAQKVPEEGWTMQDGTPWPGNNVRDHPGMIQVFLGHDGVRDIEGNELPRLIYVSREKR |
| |
|
** ********************************** **** * ****** ******* |
| |
| Seq3 |
519 |
PGFDHHKKAGAMNSLIRVSGVLSNAPYLLNVDCDHYINNSKALREAMCFMMDPQSGKKIC |
| Seq9 |
540 |
PGFDHHKKAGAMNSLVRVSAVISNAPFLLNVDCDHYINNSKALREAMCFMMDPISGKKIC |
| |
|
*************** *** * **** ************************** ****** |
| |
| Seq3 |
579 |
YVQFPQRFDGIDKSDRYSNRNVVFFDINMKGLDGIQGPIYVGTGCVERRQALYGFDAPKK |
| Seq9 |
600 |
YVQFPQRFDGIDRHDRYSNRNVVFFDINMKGLDGIQGPIYVGTGCVFRRQALYGYDAPVK |
| |
|
************ ******************** ******************* *** * |
| |
| Seq3 |
639 |
KKTKRMTCNCWPKWCLFCC---GLRKNRKSKTTDKKKKNREASKQIHALENIEEGTKGTN |
| Seq9 |
660 |
KKPPRRTCNCLPKWCCCCCCCRSKRKNKKSKSIDKKKK--EVPKHKHALENIEEGIEGI- |
| |
|
** * **** **** ** *** *** ***** * * ********* * |
| |
| Seq3 |
696 |
DAAKSPEAAQLKLEKKEGQSPVFVASAGMENGGLARNASPASLLREAIQVISCGYEDKTE |
| Seq9 |
717 |
DNEKSALMPQIKFEKKFGQSPVFIASTLMEDGGIPKGATTASLLKEAIHVISCGYEDKTD |
| |
|
* ** * * ********** ** ** ** * **** *** ********** |
| |
| Seq3 |
756 |
WGKEIGWIYGSVTEDILTGFKMHSHGWRSVYCTPKIPAFKGSAPINLSDRLHQVLRWALG |
| Seq9 |
777 |
WGKEVGWIYGSVTEDILTGFKMHCHGWRSVYCIPKRPAFKGSAPINLSDRLHQVLRWALG |
| |
|
**** ****************** ******** ** ************************ |
| |
| Seq3 |
816 |
SVEIFLSRHCPIWYGYGGGLKWLERLSYINSVVYPWTSIPLLVYCSLPAICLLTGKFIVP |
| Seq9 |
837 |
SVEIFLSRHCPIWYGYGCGLKSLERFSYIASVVYPLTSVPLLVYCTLPAICLLTGKFIVP |
| |
|
***************** *** *** *** ***** ** ****** ************** |
| |
| Seq3 |
876 |
EISNYASILFMALFGSIAVTGILEMQWGKVGIDDWWRNEQFWVIGGVSAHLFALFQGLLK |
| Seq9 |
897 |
EISNYASLLFMSLFIVIAVTSILEMQWGGVGIHDWWRNEQFWVIGGVSSHLFALFQGILK |
| |
|
******* *** ** **** ******* *** *************** *********** |
| |
| Seq3 |
936 |
VLAGVETNTTVTSKAADDGEFSELYIFKWTSLLIPPTTLLIINVIGVIVGISDAISNGYD |
| Seq9 |
957 |
VLAGVNTNFTVTSKGGDDGEFSELYLFKWTSLLIPPMTLLIINIIGVIVGISDAISNGYD |
| |
|
***** ******** ********* ********** ****** **************** |
| |
| Seq3 |
996 |
SWGPLFGRLFFAFWVILHLYPFLKGLLGKQDRMPTIILVWSILLASILTLLWVRVNPFVA |
| Seq9 |
1017 |
SWGPLFGRLFFAFWVIVHLYPFLKGLMGKQDRLPTIIVVWSILLASIFSLLWARVNPFIS |
| |
|
**************** ********* ***** **** ********* *** ***** |
| |
| Seq3 |
1056 |
KGGPILEICGLDC |
| Seq9 |
1077 |
KGGIVLEVCGLNC |
| |
|
*** ** *** * |
An example of a Gossypium hirsutum (cotton) CesA6 protein lionaolog is provided below as SEQ NO:10.
| 1 |
MDTGGRLIAG SHNRNEFVLI NADENARIKS VKELSGQTCQ |
| |
| 41 |
ICGDEIEITV DGEPFVACNE CAFPVCRPCY EYERREGNQA |
| |
| 81 |
CPQCKTRYKR IKGSPRVEGD EEEDDIDDLD NEFDYDALDP |
| |
| 121 |
QQVAEAMLGG HLNTGRGFHP NGSGLPAHSE IDSFPPSSQI |
| |
| 161 |
PLLTYGEEHS EISADHHALI VPPFMGHGNR VHPMPYTDPA |
| |
| 201 |
VPLQPRPMVP KKDIAVYGYG SVAWKDRMEE WKKWQNEKLQ |
| |
| 241 |
VVKHKGGNDG GNGEELDDAD LPMNDEGRQP LSRKLPIPSS |
| |
| 281 |
KINPYRMIII IRLAILGLFF HYRLLHPVRD AYGLWLTSVI |
| |
| 321 |
CEIWFAVSWI LDQFPKWYPI ERETYLDRLS LRYEKEGKLS |
| |
| 361 |
ELAGIDVFVS TVDPMKEPPL ITANTVLSIL AVDYPVDKVA |
| |
| 401 |
CYVSDDGAAM LTFEALSETS EFARKWVPFC KKFNIEPRAP |
| |
| 441 |
EWYFSQKIDY LKNKVHPAFV RERRAMKREY EEFKVRINGL |
| |
| 481 |
VSAAQKVPED GWTMQDGTPW PGNCVRDHPG MIQVFLGHSG |
| |
| 521 |
VRDVEGNELP HLVYVSREKR PGFEHHKKAG AMNALIRVSS |
| |
| 561 |
VLSNAPYLLN VDCDHYINNS KALREAMCFM MDPTSGKKVC |
| |
| 601 |
YVQFPQRFDG IDRHDRYSNR NVVFFDINMK GLDGIQGPIY |
| |
| 641 |
VGTGCVFRRQ ALYGFDAPIT KKPPGKTCNC LPKWCCCLCC |
| |
| 681 |
CSRKNKKTKQ KKDKTKKSKQ REASKQIHAL ENIEEGISES |
| |
| 721 |
NTLKSSEASQ IKLEKKFGQS PVFVASTLLE DGGIPQNASP |
| |
| 761 |
ASLLSEAIQV ISCGYEDKTE WGKEVGWIYG SVTEDILTGF |
| |
| 801 |
KMHCHGWRSV YCIPKRPAFK GSAPINLSDR LHQVLRWALG |
| |
| 841 |
SVEIFLSRHC PIWYGYGGGL KNLERFSYIN SVVYPWTSIP |
| |
| 881 |
LLVYCTLPAI CLLTGKFIVP EISNYASLIF MALFISIAAT |
| |
| 921 |
GILEMQWGGV GIDDWWRNEQ FWVIGGVSSH LFALFQGLLK |
| |
| 961 |
VLAGVSTSFT VTSKAADDGE FSELYLFKWT SLLIPPTTLL |
| |
| 1001 |
VINIIGVVVG ISDAINNGYD SWGPLFGRLF FAFWVIIHLY |
| |
| 1041 |
PFLKGLLGKQ DRMPTIILVW SILLASILTL MWVRINPFVS |
| |
| 1081 |
KDGPVLEVCG LNCDD |
The Gossypium hirsutum (cotton) CesA6 protein sequence with SEQ ID NO:10 has substantial sequence identity (more than 83) to the Arabidopsis thaliana CesA5 protein with SEQ ID NO:5, as illustrated below.
| 83;3% identity in 1096 residues overlap; Score: 4859.0; Gap frequency: |
|
| 1.5% |
| Seq5 |
1 |
MNTGGRLIAGSHNRNEFVLINADENARIRSVQELSGQTCQICRDEIELTVDGEPFVACNE |
|
| Seq10 |
1 |
MDTGGRLIAGSHNRNEFVLINADENARIKSVKELSGQTCQICGDEIEITVDGEPFVACNE |
| |
|
* ************************** ** ********* **** ************* |
| |
| Seq5 |
61 |
CAFPVCRPCYEYERREGNQACPQCKTRFKRLKGSPRVEGDEEEDDIDDLDNEFEYGN--- |
| Seq10 |
61 |
CAFPVCRPCYEYERREGNQACPQCKTRYKRIKGSPRVEGDEEEDDIDDLDNEFDYDALDP |
| |
|
*************************** ** ********************** * |
| |
| Seq5 |
118 |
----NGIGFDQVSEGMSISRRNSGFP-QSDLDSAPPGSQIPLLTYGDEDVEISSDRHALI |
| Seq10 |
121 |
QQVAEAMLGGHLNTGRGFHPNGSGLPAHSEIDSFPPSSQIPLLTYGEEHSEISADHHALI |
| |
|
* ** * * ** ** ********* * *** * **** |
| |
| Seq5 |
173 |
VPPSLGGHGNRVHPVSLSDPTVAAHPRPMVPQKDLAVYGYGSVAWKDRMEEWKRIQNEKL |
| Seq10 |
181 |
VPPFMG-HGNRVHPMPYTDPAVPLQPRPMVPKKDIAVYGYGSVAWKDRMEEWKKWQNENL |
| |
|
*** * ******* ** * ****** ** ****************** ***** |
| |
| Seq5 |
233 |
QVVRHEGDPDFEDG---DDADFPMMDEGRQPLSRKIPIKSSKINPYRMLIVLRLVILGLF |
| Seq10 |
240 |
QVVKHKGGNDGGNGEELDDADLPMMDEGRQPLSRKLPIPSSNINPYRMIIIIRLAILGLF |
| |
|
*** * * * * **** ************* ** ********* * ** ***** |
| |
| Seq5 |
290 |
FHYRILHPVKDAYALWLISVICEIWFAVSWVLDQFPKWYPIERETYLDRLSLRYEKEGKP |
| Seq10 |
300 |
FHYRLLHPVRDAYGLWLTSVICEIWFAVSWILDQFPKWYPIERETYLDRLSLRYEKEGKL |
| |
|
**** **** *** *** ************ **************************** |
| |
| Seqb |
350 |
SGLSPVDVFVSTVDPLKEPPLITANTVLSILAVDYPVDKVACYVSDDGAAMLTFEALSET |
| Seq10 |
360 |
SELASIDVFVSTVDPMKEPPLITANTVLSILAVDYPVDKVACYVSDDGAAMLTFEALSET |
| |
|
* * ********* ******************************************** |
| |
| Seq5 |
410 |
AEFARKWVPFCKKYCIEPRAPEWYFCHKMDYLKNKVHPAFVRERRAMKRDYEEFKVKINA |
| Seq10 |
420 |
SEFARKWVPFCKKFNIEPRAPEWYFSQKIDYLKNKVHPAFVRERRAMKREYEEFKVRING |
| |
|
************* ********** * ******************** ****** ** |
| |
| Seq5 |
470 |
LVATAQKVPEDGWTMQDGTPWPGNSVRDHPGMIQVFLGSDGVRDVENNELPRLVYVSREK |
| Seq10 |
480 |
LVSAAQKVPEDGWTMQDGTPWPGNCVRDHPGMIQVFLGHSGVRDVEGNELPHLVYVSREK |
| |
|
** ******************** ************* ****** **** ******** |
| |
| Seq5 |
530 |
RPGFDHHKKAGAMNSLIRVSGVLSNAPYLLNVDCDHYINNSKALREAMCFMMDPQSGKKI |
| Seq10 |
540 |
RPGFEHHKKAGAMNALIRVSSVLSNAPYLLNVDCDHYINNSKALREAMCFMMDPTSGKKV |
| |
|
**** ********* ***** ********************************* **** |
| |
| Seq5 |
590 |
CYVQFPQRFDGIDRHDRYSNRNVVFFDINMKGLDGLQGPIYVGTGCVFRRQALYGFDAPK |
| Seq10 |
600 |
CYVQFPQRFDGIDRHDRYSNRNVVFFDINMNGLDGIQGPIYVGIGCVFRRQALYGFDAPI |
| |
|
*********************************** *********************** |
| |
| Seq5 |
650 |
KKKGPRKTCNCWPKWCL-LCFGSRKNRKAKTVA-ADKKKKNREASKQIHALENIEEGRVT |
| Seq10 |
660 |
TKKPPGKTCNCLPKWCCCLCCCSRKNKKTKQKKDKTKKSKQREASKQIHALENIEEG--I |
| |
|
** * ***** **** ** **** * * ** * **************** |
| |
| Seq5 |
708 |
KGSNVEQSTEAMQMKLEKKFGQSPVFVASARMENGGMARNASPACLLKEAIQVISCGYED |
| Seq10 |
718 |
SESNTLKSSEASQIKLEKKFGQSPVFVASTLLEDGGIPQNASPASLLSEASQVISCGYED |
| |
|
** * ** * *************** * ** ***** ** ************ |
| |
| Seq5 |
768 |
KTEWGKEIGWIYGSVTEDILTGFKMHSHGWRSVYCTPKLAAFKGSAPINLSDRLHQVLRW |
| Seq10 |
778 |
KTEWGKEVGWIYGSVTEDILTGFKMHCHGWRSVYCIPKRPAFKGSAPINLSDRLHQVLRW |
| |
|
******* ****************** ******** ** ******************** |
| |
| Seq5 |
828 |
ALGSVEIFLSRHCPIWYGYGGGLKWLERLSYINSVVYPWTSLPLIVYCSLPAICLLTGKF |
| Seq10 |
838 |
ALGSVEIFLSRHCPIWYGYGGGLKWLERFSYINSVVYPWTSIPLLVYCTLPAICLLIGKF |
| |
|
**************************** ************ ** *** *********** |
| |
| Seq5 |
888 |
IVPEISNYASILFMALFSSIAITGILEMQWGKVGIDDWWRNEQFWVIGGVSAHLFALFQG |
| Seq10 |
898 |
IVPEISNYASLIFMALFISIAATGILEMQWGGVGIDDWWRNEQFWVIGGVSSHLFALFQG |
| |
|
********** ***** *** ********* ******************* ******** |
| |
| Seq5 |
948 |
LLKVLAGVDTNFTVISKAADDGEFSDLYLFKWTSLLIPPMTLLIINVIGVIVGVSDAISN |
| Seq10 |
958 |
LLKVLAGVSTSFTVTSKAADDGEFSELYLFKWTSLLIPPTTLLVINIIGVVVGISDAINN |
| |
|
******** * ************** ************* *** ** *** ** **** * |
| |
| Seq5 |
1008 |
GYDSWGPLFGRLFFALWVIIHLYPFLKGLLGKQDRMPTIIVVWSILLASILTLLWVRVNP |
| Seq10 |
1018 |
GYDSWGPLFGRLFFAFWVIIHLYPFLKGLLGKQDRMPTIILVWSILLASILTLMWVRINP |
| |
|
*************** ************************ ************ *** ** |
| |
| Seq5 |
1068 |
FVAKGGPILEICGLDC |
| Seq10 |
1078 |
FVSKDGPVLEVCGLNC |
| |
|
** * ** ** *** * |
An example of an Populus tomentosa (poplar) CesA2 homolog protein is provided below as SEQ ID NO:11 (having at least 84% sequence identity to SEQ NO:1)
| 1 |
MNTGGRLIAG SHNRNEFVLI NADENARIKS VQELSGQVCH |
| |
| 41 |
ICGDEIEITV DGELFVACNE CAFPVCRPCY EYERREGNQA |
| |
| 81 |
CPQCKTRYKR LKGSPRVEGD EEEDDIDDLE HEFDYGNFDG |
| |
| 121 |
LSPEQVAEAM LASRMNTGRA SHSNISGIPT HGELDSSPLN |
| |
| 161 |
SKIPLLTYGE EDTEISSDRH ALIVPPSHGN RFHPISFPDP |
| |
| 201 |
SIPLAQPRPM VPKKDIAVYG YGSVAWKDRM EDWKKRQNDK |
| |
| 241 |
LQVVKHEGGN DNGNFEGDEL DDPDLPMMDE GRQPLSRKLP |
| |
| 281 |
IPSSKINPYR MIIIIRLVVV GLFFHYRILH PVNDAYGIWL |
| |
| 321 |
TSVICEIWFA VSWILDQFPK WYPIERETYL DRLSLRYEKE |
| |
| 361 |
GKPSELASVD VFVSTVDPMK EPPLITANTV LSILAVDYPV |
| |
| 401 |
DKVACYVSDD GAAMLTFEAL SETSEFARKW VPFCKKFNIE |
| |
| 441 |
PRAPEWYFSQ KMDYLKNKVH PAFVRERRAM KREYEEFKVK |
| |
| 481 |
INGLVATAQK VPEDGWTMQD GTPWPGNNVR DHPGMIQVFL |
| |
| 521 |
GQSGVRDVEG NELPRLVYVS REKRPGFEHH KKAGAMNALM |
| |
| 561 |
RVTAVLSNAP YLLNVDCDHY INNSRALREA MCFLMDPTSG |
| |
| 601 |
KKVCYVQFPQ RFDGIDRHDR YSNRNVVFFD INMKGLDGLQ |
| |
| 641 |
GPIYVGTGCV FRRQALYGYD APVKKRPPGK TCNCWPKWCC |
| |
| 681 |
LCCGSRKNKK LKQKKEKKKS KNREASKQIH ALENIEEGIE |
| |
| 721 |
ESTSEKSSET SQMKLEKKFG QSPVFVASTL LENGGVPRDA |
| |
| 761 |
SPASLLREAI QVISCGYEDK TEWGKEVGWI YGSVTEDILT |
| |
| 801 |
GFKMHCHGWR SVYCIPKRPA FKGSAPINLS DRLEQVLRWA |
| |
| 841 |
LGSVEIFFSR HCPIWYGYGG GLKWLERFSY INSVVYPWTS |
| |
| 881 |
IPLLVYCTLP AICLLTGKFI VPEISNYASI VFMALFISIA |
| |
| 921 |
ATGILEMQWG GVGIDDWWRN EQFWVIGGAS AHLFALFQGL |
| |
| 961 |
LKVLAGVSTN FTVTSKAADD GEFSELYLFK WTSLLIPPTT |
| |
| 1001 |
LIIMNIVGVV VGVSDAINNG YDSWGPLFGR LFFALWVIIH |
| |
| 1041 |
LYPFLKGLLG KQDRMPTIIL VWSILLASIL TLLWVRINPF |
| |
| 1081 |
VSKGGPVLEL CGLNCD |
An example of a Populus trichocarpa (poplar) CesA5 protein is provided below as SEQ ID NO:12 (having at least 83% sequence identity to SEQ ID NO:3).
| 1 |
MNTGGRLIAG SHNRNEFVLI NADENARIKS VQELSGQVCH |
| |
| 41 |
ICGDEIEITV DGEPFVACNE CAFPVCRPCY EYERREGNQA |
| |
| 81 |
CPQCKTRYKR LKGSPRVEGD EEEDDIDDLE REFDYGNFDG |
| |
| 121 |
LSPEQVAEAM LSSRMNTGRA SHSNISGIPT HGELDSSPLN |
| |
| 161 |
SKIPLLTYGE EDTEISSDRH ALIVPPSHGN RFHPISFPDP |
| |
| 201 |
SIPLAQPRPM VPKKDIAVYG YGSVAWKDRM EDWKKRQNDK |
| |
| 241 |
LQVVKHEGGH DNGNFEGDEL DDPDLPMMDE GRQPLSRKLP |
| |
| 281 |
IPSSKINPYR MIIILRLVVV GLFFHYRILH PVNDAYGLWL |
| |
| 321 |
TSVICEIWFA VSWILDQFPK WYPIERETYL DRLSLRYEKE |
| |
| 361 |
GKFSELASVD VFVSTVDPMK EPPLITANTV LSILAVDYPV |
| |
| 401 |
DKVACYVSDD GAAMLTFEAL SETSEFARKW VPFCKKFNIE |
| |
| 441 |
PRAPEWYFSQ KMDYLKNKVH PAFVRERRAM KREYEEFKVK |
| |
| 481 |
INGLVATAQK VPEDGWTMQD GTPWPGNNVR DHPGMIQVFL |
| |
| 521 |
GQSGVRDVEG NELPRLVYVS REKRPGFEHH KKAGAMNALM |
| |
| 561 |
RVTAVLSNAP YLLNVDCDHY INNSRALREA MCFLMDPTSG |
| |
| 601 |
KKVCYVQFPQ RFDGIDRHDR YSNRNVVFEF INMKGLDGLQ |
| |
| 641 |
GPIYVGTGCV FRRQALYGYD APVKKRPPGK TCNCWPNWCC |
| |
| 681 |
LFCGSRKNKK SKQKKEKKKS KNREASKQIH ALENIEEGIE |
| |
| 721 |
ESTSEKSSET SQMKLEKKFG QSPVFVASTL LENGGVPRDA |
| |
| 761 |
SPASLLREAI QVISCGYEDK TEWGKEVGWI YGSVTEDILT |
| |
| 801 |
GFKMHCHGWR SVYCIPKRPA FKGSAPINLS DRLHQVLRWA |
| |
| 841 |
LGSVEIFFSR HCPIWYGYGG GLKWLERFSY INSVVYPWTS |
| |
| 881 |
IPLLVYCTLP AICLLTGKFI VPEISNYASI VFMALFISIA |
| |
| 921 |
ATGILEMQWG GVGIDDWWRN EQFWVIGGAS AHLFALFQGL |
| |
| 961 |
LKVLAGVSTN FTVTSKAADD GEFSELYLFK WTSLLIPPTT |
| |
| 1001 |
LLIMNIVGVV VGVSDAINNG YDSWGPLFGR LFFALWVIIH |
| |
| 1041 |
LYPFLKGLLG KQDRMPTIIL VWSILLASIL TLLWVRINPF |
| |
| 1081 |
VSKGGPVLEL CGLNCD |
Au example of a Populus trichocarpa CesA6 homolog protein sequence is provided below as SEQ ID NO:13 (having at least 71%, sequence identity to SEQ ID NO:5).
| 1 |
MEVSAGLVAG SHNRNELVVI RRDGEFAPRS LERVSRQICH |
| |
| 41 |
ICGDDVGLTV DGELFVACNE CAFPICRTCY EYERKEGNQV |
| |
| 81 |
CPQCKTRFKR LKGCARVHGD DEEDGTDDLE NEFNFDGRNS |
| |
| 121 |
NRHDMQHHGG PESMLHYDPD LPHDLHHPLP RVPLLTNGQM |
| |
| 161 |
VDDIPPEQHA LVPSYMAPVG GDGKRIHPLP FSDSSLPAQP |
| |
| 201 |
RSLDPSKDLA AYGYGSIAWK ERMESWKQKQ DKLQIMKREN |
| |
| 241 |
GDYDDDDPDL PLMDEARQPL SRKMPIPSSQ INPYRMIIII |
| |
| 281 |
RLVVLGFFFH YRVTHPVNDA FALWLISVIC EIWFAVSWIL |
| |
| 321 |
DQFPKWLPID RETYLDRLSL RYEKEGQPSQ LSPVDIYVST |
| |
| 361 |
VDPLKEPPLV TANTVLSILA VDYPVDKISC YVSDDGAAML |
| |
| 401 |
TFEALSETSE FAKKWVPFCK KFSIEPRAPE FYFAQKIDYL |
| |
| 441 |
KDKVDASFVK ERRAMKREYE EFKVRVNALV AKAHKVPEDG |
| |
| 481 |
WTMQDGTPWP GNNVRDHPGM IQVFLGQSGG HDTDGNELPR |
| |
| 521 |
LVYVSREKRP GFNHHKKAGA MNALVRVSAV LSNARYLLNL |
| |
| 561 |
DCDHYINNSK ALRESMCFMM DPLLGKRVCY VQFPQRFDGI |
| |
| 601 |
DRNDRYANRN TVFFDINMKG LDGIQGPIYV GTGCVFRRHA |
| |
| 641 |
LYGYDAPKTK KPPTRTCNCL PKWCCGCFCS GRKKKKKTNK |
| |
| 681 |
PKSELKKRNS RTFAPVGTLE GIEEGIEGIE TENVAVTSEK |
| |
| 721 |
KLENKFGQSS VFVASTLLED GGTLKSASPA SLLKEAIHVI |
| |
| 761 |
SCGYEDKTEW GKEVGWIYGS VTEDILTGFK MHCHGWRSIY |
| |
| 801 |
CIPARPAFKG SAPINLSDRL HQVLRWALGS VEIFLSRHCP |
| |
| 841 |
LWYGYGGGLK WLERLSYINA TVYPLTSIPL LAYCTLPAVC |
| |
| 81 |
LLTGKFITPE LSNAASLWFL SLFICIFATS ILEMRWSGVG |
| |
| 921 |
IDEWWRNEQF WVIGGVSAHL FAVFQGLLKV LAGVDTNFTV |
| |
| 961 |
TSKGGDDDEF SELYAFKWTT LLIPPTTLLI INLVGVVAGV |
| |
| 1001 |
SNAINNGYES WGPLFGKLFF AFWVIVHLYP FLKGLLGRQN |
| |
| 1041 |
RTPTIIIVWS ILLASIFSLL WVRIDPFLAK SNGPLLEECG |
| |
| 1081 |
LDCN |
An example of a Eucalyptus grandis (eucalyptus) CesA2 homolog protein is provided below as SEQ ID NO:14 (having at least 83% sequence identity to SEQ ID NO: 1).
| 1 |
MNTGGRLIAG SHNRNEFVLI NADESSRIKS VKELSGQICQ |
| |
| 41 |
ICGDEVEIAD GELFVACNEC AFPVCRPCYE YERREGNQAC |
| |
| 81 |
PQCKTRYKRL KGSPRVEGDE EEDDIDDLDN EFDYDPSDPQ |
| |
| 121 |
HVAEKTFSSR LNYGRGAHRN ASGMPTDVES SPLSSQIPLL |
| |
| 161 |
TYGQEDAEIS PDQHALIVPP ATGHAYRVHP MPYPDSSNPL |
| |
| 201 |
HPRPMAPEKD ITLYGYGSVA WKDKMEKWRK KQNEKLQVVK |
| |
| 241 |
HEGAGDGGDF GSDELDDPDL PMMDEGRQPL SRKLPIPSSK |
| |
| 281 |
INPYRLLIIL RLVILGLFLH YRILHPVNDA YGLWLTSVIC |
| |
| 321 |
EIWFAVSWIL DQFPKWYPIE RETYLDRLSL RYEREGKPSE |
| |
| 361 |
LAPVDVFVST VDPMKEPPLI TANTVLSILA VDYPVDKVAC |
| |
| 401 |
YVSDDGAAML TFEALSETSE FAKKWVPFCK RFNIEPRAPE |
| |
| 441 |
WYFSQKMDYL KNKVHPEFVR ERRAIKREYE EFKVRINALV |
| |
| 481 |
AMAQKVPEEG WTMQDGTPWP GNNVRDHPGM IQVFLGHSGV |
| |
| 521 |
CDDDGNELPR LVYVSREKRP GFEHHKKAGA MNALIRVSAV |
| |
| 561 |
ISNAPYLLNV DCDHYINNSK ALREAMCFMM DPTSGKKVCY |
| |
| 601 |
VQFPQRFDGI DRHDRYSNRN VVFFDINMKG LDGLQGPIYV |
| |
| 641 |
GTGCVFRRQA LYGHDAPSKK KPPSKTCNCW PKWCCLCCGG |
| |
| 681 |
RKNKKGKTKK ERSKKTKNRE TSKQIHALEN IEEGVSEVSN |
| |
| 721 |
EKSSEMTQIK LEKKFGQSPV FVASTTLEDG GVPPDASPAS |
| |
| 761 |
LLKEAIQVIS CGYEDKTEWG KEVGWIYGSV TEDILTGFKM |
| |
| 801 |
HCHGWRSVYC IPKRPAFFGS APINISDRIH QVLRWALGSV |
| |
| 841 |
EIFLSRHCPI WYGYGGGLKW LERFSYINSV VYPWTSIPLI |
| |
| 881 |
VYCSLPAICL LTGQFIVPEI SNYASLVFMA LFISIAATGI |
| |
| 921 |
LEMQWGGVGI DDWWRNEQFW VIGGVSSHLF ALVQGLLKVL |
| |
| 961 |
GGVNTNFTVT SKAADDGAFS ELYIFKWTSL LIPPMTLLIM |
| |
| 1001 |
NIVGVVVGIS DAINNGYDSW GPLFGRLFFA FWVIVHLYPF |
| |
| 1041 |
LKGLLGKQDR MPTIVVVWSI LLASILTLLW VRINPFVSRD |
| |
| 1081 |
GPVLEVCGLN CD |
An example of a Eucalyptus grandis (eucalyptus) CesA5 protein is provided below as SEQ NO:15 (having at least 70% sequence identity to SEQ NO:3).
| 1 |
MEVSSGLVAG SHNRNELVVI RRENELGQKP LQKLSGQICQ |
| |
| 41 |
ICGDDVGLTV DGELFVACNE CAFPICRTCY EYERREGSQI |
| |
| 81 |
CPQCKTRFKR LRGCARVDGD EEEDGVDDLE NEFNEDGRHR |
| |
| 121 |
QEMDRQGYGA EAMLHGHMSY GRGSDLDLPH VHPLPQVPLL |
| |
| 161 |
ANGQMVDDVP PEHHALVPAY MGAGGGGGGG GKRIHPLPFT |
| |
| 201 |
DSGLPVQPRS MDPSKDLAAY GYGSVAWKER MESWKQKQEK |
| |
| 241 |
LQTMKNEKGG KEWDDDGDNP DLPLMDEARQ PLSRRLPISS |
| |
| 281 |
SQINPYRMII VIRLVVLGFF FHYRVVHPVN DAYALWLISV |
| |
| 321 |
ICEIWFGLSW ILDQFPKWLP IDRETYLDRL SLRYEKEGQP |
| |
| 361 |
SQLAPVDIFV STVDPLKEPP LVTANTVLSI LAVDYPVDKV |
| |
| 401 |
SCYVSDDGAA MLTFEALSET SEFARKWAPF CKKFNIEPRA |
| |
| 441 |
PEFYFAQKID YLKDKVEASF VKERRAMKRE YEEFKVRINA |
| |
| 481 |
LVAKAQKVPE EGWTMQDGTP WPGNNVRDHP GMIQVFLGQS |
| |
| 521 |
GGHDSDGNEL PRLVYVSREK RPGYNHHKKA GAMNALVRVS |
| |
| 561 |
AVLTNAPYLL NLDCDHYFNN SKAIREAMCF MVDPLIGKRV |
| |
| 601 |
CYVQFPQRFD GIDRHDRYAN RNTVFFDINM KGLDGIQGPI |
| |
| 641 |
YVGTGCVFRR LALYGYDAPK AKKPPTRTCN CLPKWCCCGC |
| |
| 681 |
CCSGKKKKKK TTKPKTELKK RFFKKKDAGT PPPLEGIEEG |
| |
| 721 |
IEVIESENPT PQHKLEKKFG QSSVFVASTL LEDGGTLKGT |
| |
| 761 |
SPASLLKEAI HVISCGYEDK TEWGKEVGWI YGSVTEDILT |
| |
| 801 |
GFKMHCHGWR SIYCIPARPA FKGSAPINLS DRLHQVLRWA |
| |
| 841 |
LGSIEIFLSR HCPLWYGYGG GLKWLERLSY INATVYPWTS |
| |
| 881 |
IPLLAYCTLP AVCLLTGKFI TPELSNVASL WFLSLFICIF |
| |
| 921 |
ATSILEMRWS GVGIEEWWRN EQFWVIGGVS AHLFAVFQGL |
| |
| 961 |
LKVLAGVDTN FTVTSKGGDD KEFSELYAFK WTTLLIPPTT |
| |
| 1001 |
LLIINLIGVV AGVSNAINNG HESWGPLFGK LFFAFWVIVH |
| |
| 1041 |
LYPFLKGLLG RQNRTPTIII VWSILLASTF SLLWVRIDPF |
| |
| 1081 |
LAKSDGPLLE ECGLDCN |
An example of a Eucalyptus grandis (eucalyptus) CesA6 bomolog protein sequence is provided below as SEQ ID NO:16 (having at least 78% sequence identity to SEQ ID NO:5).
| 1 | MDTGRLVTGS HNRNEIILIN ADEVGRVTCV KHLSGKICQI |
| |
| 41 | CADEIEITGD GEPFVACNEC AFPVCRHCYE YERSEGTQAC |
| |
| 81 | PHCKTRYKRI KGSPRVEGDE EEENTDDLER EFDIGESGRG |
| |
| 121 | NLHCMAEGMP STHLNFGPNL QTHASGFTTP SELDASSVVP |
| |
| 161 | EIPLLTYGQE NVGISFNKHA LIIPPLMGQG RRIHPMPNSD |
| |
| 201 | SSVPLPPRTL DPNKDSAVYG YGTVAWKERM EEWKKKQNER |
| |
| 241 | IQVVKHDRGS DGQEPDDADL PTMDEGRQPL SRKLPIPSSK |
| |
| 281 | ISPYRLIIIL RLVILGLFFH YRILHPVNDA YGLNLTSVIC |
| |
| 321 | EIWFAMSWIL DQFPKWYPIK RETYLDRLSL RYEKEERPSK |
| |
| 361 | LADIDIFVST VDPMKEPPLI TANTVLSILA VDYPVDKVAC |
| |
| 401 | YVSDDGAAML TFEALSETSE FAMKWVPFCK RFNIEPRAPE |
| |
| 441 | WYFSQKVDYL KDKVNPEFVR ERRDMKREYE EFKVRINGLV |
| |
| 481 | AMAQKVPEEG WTMQDGTPWP GNNVRDHPGM IQVFLGQNGD |
| |
| 521 | RDVEGNELPR LVYVSREKRP GFDHHKKAGA MNALVRVSAV |
| |
| 561 | ITNAPYLLNV DCDHYINNSK ALREAMCFMM DPISGKKICY |
| |
| 601 | VQFPQRFDGI DRHDRYSNRN VVFFDINMKG LDGIQGPIYV |
| |
| 641 | GTGCVFRRQA LYGYDAPIKK KPPGKTCNCW PKWCCLCCGS |
| |
| 681 | RKRGRKMKSN EQKKTLRNRE ASKQIHALEN IEEGIEGIDN |
| |
| 721 | EKSSLMSRVK FEKKFGQSPV FIATTLMEEG GVPKGATTAS |
| |
| 761 | LLKEAIHVIS CGYEDKTEWG KEVGWIYGSV TEDILTGFKM |
| |
| 801 | HCHGWRSVYC IPKRPAFKGS APINLSDRLH QVLRWALGSV |
| |
| 841 | EILLSRHCPI WYGYGCGLKW LERFSYINSV VYPLTSIPLI |
| |
| 881 | AYCTLPAVCL LTGKFIVPEI SNYASLIFMA LFISIAATGI |
| |
| 921 | LEMQWGGVGI HDWWRNEQFW VIGGVSCHLF ALFQGLLKVL |
| |
| 961 | AGVNTNFTVT SKAGDDGEFS ELYLFKWTSL LIPPLTLLIL |
| |
| 1001 | NIIGVIVGVS DAINNGYETW GPLFGKLLFA LWVIVHLYPF |
| |
| 1041 | LKGFMGKQDR LPTIIIVWAI LLASILTLLW VRINPFISKD |
| |
| 1081 | GIVLEVCGLD CN |
Transformation of Plant Cells
Plant cells can be modified to include expression cassettes or transgenes that can express any of the CesA proteins described herein. Such an expression cassette or transgene can include a promoter operably linked to a nucleic acid segment that encodes any of the CesA proteins described herein.
Promoters provide for expression of nRNA from the CesA nucleic acids. A CesA nucleic acid is operably linked to the promoter, for example, when it is located downstream from the promoter.
In some cases, the promoter can be a CesA native promoter. However, the promoter can in some cases be heterologous to the CesA nucleic acid segment. In other words, such a heterologous promoter may not be naturally linked to such a CesA nucleic acid segment. Instead, some expression cassettes and expression vectors have been recombinantly engineered to include a CesA nucleic acid segment operably linked to a heterologous promoter. Hence, the promoter can be heterologous to the nucleic acid segment that encodes the CesA protein. The nucleic acid segment that encodes the CesA protein can also be heterologous to the promoter.
A variety of promoters can be included in the expression cassettes and/or expression vectors. In some cases, the endogenous CesA promoter can be employed. Promoter regions are typically found in the flanking DNA upstream from the coding sequence in both prokaryotic and eukaryotic cells. A promoter sequence provides for regulation of transcription of the downstream gene sequence and typically includes from about 50 to about 2,000 nucleotide base pairs. Promoter sequences can also contain regulatory sequences such as enhancer sequences that can influence the level of gene expression. Some isolated promoter sequences can provide for gene expression of heterologous DNAs, that is a DNA different from the native or homologous DNA.
Promoters can be strong or weak, or inducible. A strong promoter provides for a high level of gene expression, whereas a weak promoter provides for a very low level of gene expression. An inducible promoter is a promoter that can turn on and off gene expression in response to an exogenously added agent, or in response to an environmental stimulus, or in response to a developmental stimulus. For example, a bacterial promoter such as the Ptac promoter can be induced to vary levels of gene expression depending on the level of isothiopropylgalactoside added to the transformed cells. Promoters can also provide for tissue specific or developmental regulation. Hence, in some cases, the promoter within such expression cassettes/vectors can be functional during plant development or growth. A strong promoter for heterologous DNAs can also be used and, in some cases, such a strong promoter can be advantageous because it provides for a sufficient level of gene expression for easy detection and selection of transformed cells and provides for a high level of gene expression when desired.
Expression cassettes/vectors can include, but are not limited to, a plant promoter such as the CaMV 35S promoter (Odell et al., Nature. 313:810-812 (1985)), or others such as CaMV 19S (Lawton et al., Plant Molecular Biology. 9:315-324 (1987)), nos (Ebert et al, Proc. Natl. Acad. Sci. USA. 84:5745-5749 (1987)), Adh1 (Walker et al., Proc. Natl. Acad. Sci. USA. 84:6624-6628 (1987)), sucrose synthase (Yang et al., Proc. Natl. Acad. Sci. USA. 87:4144-4148 (1990)), α-tubulin, ubiquitin, actin (Wang et al., Mol. Cell. Biol. 12:3399 (1992)), cab (Sullivan et al., Mol. Gen. Genet. 215:431 (1989)), PEPCase (Hudspeth et al., Plant Molecular Biology. 12:579-589 (1989)) or those associated with the R gene complex (Chandler et al., The Plant Cell. 1:1175-1183 (1989)). Further suitable promoters include the poplar xylem-specific secondary cell wall specific cellulose synthase 8 promoter, cauliflower mosaic virus promoter, the Z10 promoter from a gene encoding a 10 kD zein protein, a Z27 promoter from a gene encoding a 27 kD zein protein, inducible promoters, such as the light inducible promoter derived from the pea rbcS gene (Coruzzi et al., EMBO J. 3:1671 (1971)) and the actin promoter from rice (McElroy et al., The Plant Cell. 2:163-171 (1990)). Seed specific promoters, such as the phaseolin promoter from beans, may also be used (Sengupta-Gopalan, Proc. Natl. Acad. Sci. USA. 83:3320-3324 (1985). Other promoters useful in the practice of the invention are available to those of skill in the art.
Alternatively, novel tissue specific promoter sequences may be employed in the practice of the present invention. cDNA clones from particular tissues can be isolated and those clones that are expressed specifically in that tissue are identified, for example, using Northern blotting, Preferably, the gene isolated is not present in a high copy number but is relatively abundant in specific tissues. The promoter and control elements of corresponding genomic clones can then be localized using techniques available to those of skill in the art.
A CesA nucleic acid can be combined with the promoter by available methods to yield an expression cassette or transgene, for example, as described in Sambrook et al. (MOLECULAR CLONING: A LABORATORY MANUAL. Second Edition (Cold Spring Harbor, NY: Cold Spring Harbor Press (1989); MOLECULAR CLONING: A LABORATORY MANUAL. Third Edition (Cold Spring Harbor, NY: Cold Spring Harbor Press (2000)). Briefly, a plasmid containing a promoter such as the 35S CaMV promoter can be constructed as described in Jefferson (Plant Molecular Biology Reporter 5:387-405 (1987)) or obtained from Clontech Lab in Palo Alto, California (e.g., pBI121 or pBI221). Typically, these plasmids are constructed to have multiple cloning sites having specificity for different restriction enzymes downstream from the promoter. The CesA nucleic acids can be subcloned downstream from the promoter using restriction enzymes and positioned to ensure that the DNA is inserted in proper orientation with respect to the promoter so that the DNA can be expressed as sense or antisense RNA. Once the CesA nucleic acid is operably linked to a promoter, the expression cassette so formed can be subcloned into a plasmid or other vector (e.g., an expression vector).
In some embodiments, a cDNA clone encoding a CesA protein is synthesized, isolated, and/or obtained from a selected cell. In other embodiments, cDNA clones from other species (that encode a CesA protein) are isolated from selected plant tissues. For example, the nucleic acid encoding a CesA protein can be any nucleic acid with a coding region that hybridizes to SEQ ID NO:2, 4 or 6 and that has CesA activity. In another example, the CesA nucleic acid can encode a CesA protein with an amino acid sequence that has at least 90%, or at least 95%, or at least 96%, or at least 97%, at least 98%, or at least 99% sequence identity to SEQ ID NO:1, 3, 5, 7, 9, 10, 11, 12, 13, 14, 15, or 16. Using restriction endonucleases, the entire coding sequence for the CesA nucleic acid is subcloned downstream of the promoter in a 5′ to 3′ sense orientation.
In some cases, the endogenous CesA gene can be deleted and plant cells with such a deleted endogenous CesA gene can be can be transformed to include a CesA transgene, for example, by transformation of the plant cells with a CesA expression cassette or expression vector.
The frequency of occurrence of cells taking up exogenous (foreign) DNA can sometimes vary. However, certain cells from virtually any dicot or monocot species can be stably transformed, and these cells can be regenerated into transgenic plants, through the application of the techniques disclosed herein and those available to one of skill in the art. The plant cells, plants, and seeds can therefore be monocotyledons or dicotyledons.
The cell(s) that undergo transformation may be in a suspension cell culture or may be in an intact plant part, slidh as an immature embryo, or in a specialized plant tissue, such as callus, such as Type I or Type II callus.
Transformation of the cells of the plant tissue source can be conducted by any method available to those of skill in the art. Examples are: Transformation by direct DNA transfer into plant cells by electroporation (U.S. Pat. Nos. 5,384,253 and 5,472,869, Dekeyser et al., The Plant Cell. 2:591 602 (1990)); direct DNA transfer to plant cells by PEG precipitation (Hayashimoto et al., Plant Physiol. 93:857 863 (1990)); direct DNA transfer to plant cells by microprojectile bombardment (McCabe et al., Bio/Technology. 6:923 926 (1988); Gordon Kamm et al., The Plant Cell. 2:603 618 (1990); U.S. Pat. Nos. 5,489,520; 5,538,877; and 5,538,880) and DNA transfer to plant cells via infection with Agrobacterium. Methods such as microprojectile bombardment or electroporation can be carried out with “naked” DNA where the expression cassette may be simply carried on any E. coli derived plasmid cloning vector. In the case of viral vectors, it is desirable that the system retain replication functions, but lack functions for disease induction.
One method for dicot or monocot transformation, for example, involves infection of plant cells with Agrobacterium tumefaciens using the leaf disk protocol (Hoesch et al., Science 227:1229 1231 (1985). For example, fiber-producing plants (e.g., dicots) such as cotton, flax, hemp, jute, sisal, poplar, and eucalyptus can be transformed via use of Agrobacterium tumefaciens. Arabidopsis is a dicot that is useful for experintental purposes.
Monocots such as Zea mays can be transformed via microprojectile bombardment of embryogenic callus tissue or immature embryos, or by electroporation following partial enzymatic degradation of the cell wall with a pectinase containing enzyme (U.S. Pat. Nos. 5,384,253; and 5,472,869). For example, embryogenic cell lines derived from immature Zea mays embryos can be transformed by accelerated particle treatment as described by Gordon Kamm et al. (The Plant Cell. 2:603 618 (1990)) or U.S. Pat. Nos. 5,489,520; 5,538,877 and 5,538,880, cited above. Excised immature embryos can also be used as the target for transformation prior to tissue culture induction, selection and regeneration as described in U.S. application Ser. No. 08/112,245 and PCT publication WO 95/06128. Furthermore, methods for transformation of monocotyledonous plants utilizing Agrobacterium tumcfaciens have been described by Hiei et al. (European Patent 0 604 662, 1994) and Saito et al. (European Patent 0 672 752, 1995).
Methods such as microprojectile bombardment or electroporation are carried out with “naked” DNA where the expression cassette may be simply carried on any convenient plasmid cloning vector. In some cases, it may convenient to use a E. coli derived plasmid or cloning vector. In the case of viral vectors, it is desirable that the system retain replication functions, but lack functions for disease induction.
The choice of plant tissue source for transformation will depend on the nature of the host plant and the transformation protocol. Useful tissue sources include callus, suspension culture cells, protoplasts, leaf segments, stem segments, tassels, pollen, embryos, hypocotyls, tuber segments, meristematic regions, and the like. The tissue source is selected and transformed so that it retains the ability to regenerate whole, fertile plants following transformation, i.e., contains totipotent cells. Selection of tissue sources for transformation of monocots is described in detail in U.S. application Ser. No. 08/112,245 and PCT publication WO 95/06128.
The transformation is carried out under conditions directed to the plant tissue of choice. The plant cells or tissue are exposed to the DNA or RNA carrying the targeting vector and/or other nucleic acids for an effective period of time. This may range from a less than one second pulse of electricity for electroporation to a 2-3 day co-cultivation in the presence of plasmid bearing Agrobacterium cells. Buffers and media used will also vary with the plant tissue source and transformation protocol. Many transformation protocols employ a feeder layer of suspended culture cells (tobacco or Black Mexican Sweet corn, for example) on the surface of solid media plates, separated by a sterile filter paper disk from the plant cells or tissues being transformed.
Where one wishes to introduce DNA by means of electroporation, itis contemplated that the method of Krzyzek et al., (U.S. Pat. No. 5,384,253) may be advantageous. In this method, certain cell wall degrading enzymes, such as pectin degrading enzymes, are employed to render the target recipient cells more susceptible to transformation by electroporation than untreated cells. Alternatively, recipient cells can be made more susceptible to transformation, by mechanical wounding.
To effect transformation by electroporation, one may employ either friable tissues such as a suspension cell cultures, or embryogenic callus, or alternatively, one may transform immature embryos or other organized tissues directly. The cell walls of the preselected cells or organs can be partially degraded by exposing them to pectin degrading enzymes (pectinases or pectolyases) or mechanically wounding them in a controlled manner. Such cells would then be receptive to DNA uptake by electroporation, which may be carried out at this stage, and transformed cells then identified by a suitable selection or screening protocol dependent on the nature of the newly incorporated DNA.
A further advantageous method for delivering transforming DNA segments to plant cells is microprojectile bombardment. In this method, microparticles may be coated with DNA and delivered into cells by a propelling force. Exemplary particles include those comprised of tungsten, gold, platinum, and the like.
It is contemplated that in some instances DNA precipitation onto metal particles would not be necessary for DNA delivery to a recipient cell using microprojectile bombardment. In an illustrative embodiment, non-embryogenic cells were bombarded with intact cells of the bacteria E. coli or Agrobacterium tumefaciens containing plasmids with either the β-glucoronidase or bar gene engineered for expression in maize. Bacteria were inactivated by ethanol dehydration prior to bombardment. A low level of transient expression of the β-glucoronidase gene was observed 24-48 hours following DNA delivery. In addition, stable transformants containing the bar gene were recovered following bombardment with either E. coli or Agrobacterium tumefaciens cells. It is contemplated that particles may contain DNA rather than be coated with DNA. Hence it is proposed that particles may increase the level of DNA delivery but are not, in and of themselves, necessary to introduce DNA into plant cells.
An advantage of microprojectile bombardment, in addition to being an effective means of reproducibly stably transforming monocots, is that the isolation of protoplasts (Christou et al., PNAS. 84:3962 3966 (1987)), the formation of partially degraded cells, or the susceptibility to Agrobacterium infection is not required. An illustrative embodiment of a method for delivering DNA into maize cells by acceleration is a Biolistics Particle Delivery System, which can be used to propel particles coated with DNA or cells through a screen, such as a stainless steel or Nytex screen, onto a filter surface covered with maize cells cultured in suspension (Gordon Kamm et al., The Plant Cell. 2:603 618 (1990)). The screen disperses the particles so that they are not delivered to the recipient cells in large aggregates. It is believed that a screen intervening between the projectile apparatus and the cells to be bombarded reduces the size of projectile aggregate and may contribute to a higher frequency of transformation, by reducing damage inflicted on the recipient cells by an aggregated projectile.
For bombardment, cells in suspension are preferably concentrated on filters or solid culture medium. Alternatively, immature embryos or other target cells may be arranged on solid culture medium. The cells to be bombarded are positioned at an appropriate distance below the macroprojectile stopping plate. If desired, one or more screens are also positioned between the acceleration device and the cells to be bombarded. The techniques set forth here can provide up to 1000 or more foci of cells transiently expressing a marker gene. The number of cells in a focus which express the exogenous gene product 48 hours post bombardment often range from about 1 to 10 and average about 1 to 3.
In bombardment transformation, one may optimize the prebombardment culturing conditions and the bombardment parameters to yield the maximum numbers of stable transformants. Both the physical and biological parameters for bombardment can influence transformation frequency. Physical factors are those that involve manipulating the DNAlmicroprojectile precipitate or those that affect the path and velocity of either the macroprojectiles or microprojectiles. Biological factors include all steps involved in manipulation of cells before and immediately after bombardment, the osmotic adjustment of target cells to help alleviate the trauma associated with bombardment, and the nature of the transforming DNA, such as linearized DNA or intact supercoilecl plasmid DNA.
One may wish to adjust various bombardment parameters in small scale studies to fully optimize the conditions and/or to adjust physical parameters such as gap distance, flight distance, tissue distance, and helium pressure. One may also minimize the trauma reduction factors (TRFs) by modifying conditions which influence the physiological state of the recipient cells and which may therefore influence transformation and integration efficiencies. For example, the osmotic state, tissue hydration and the subculture stage or cell cycle of the recipient cells may be adjusted for optimum transformation. Execution of such routine adjustments will be known to those of skill in the art.
Examples of plants and/or plant cells that can be modified as described herein include fiber-producing, alfalfa (e.g., forage legume alfalfa), algae, apple, avocado, balsam, barley, broccoli, Brussels sprouts, cabbage, canola, cassava, cauliflower, cocoa, tole vegetables, collards, corn, cotton, cottonwood, crucifers, earthmoss, eucalyptus, grain legumes, grasses (e.g., forage grasses), hemp, jatropa, kale, kohlrabi, maize, miscanthus, moss, mustards, nut, nut sedge, oats, oil firewood trees, poplar, sorghum, sunflower, switchgrass, tobacco, tomato, turnips, and wheat. In some embodiments, the plant is a Brassicaceae or other Solanaceae species. In some embodiments, the plant or cell can be a fiber-producing plant, plant seed, or plant cell such as a cotton, hemp, poplar, or eucalyptus plant, seed, or cell. In some cases, the plant, seed, or plant cell can be a cotton species. In some cases, the plant, seed, or plant cell can be a tree species. In some embodiments, the plant, plant seed, and plant cell is not a species of Arabidopsis, for example, in some embodiments, the plant, plant seed, or plant cell is not an Arobidopsis thaliona plant, plant seed, or plant cell.
An exemplary embodiment of methods for identifying transformed cells involves exposing the bombarded cultures to a selective agent, such as a metabolic inhibitor, an antibiotic, herbicide or the like. Cells which have been transformed and have stably into grated a marker gene conferring resistance to the selective agent used, will grow and divide in culture. Sensitive cells will not be amenable to further culturing.
To use the bar-bialaphos or the EPSPS-glyphosate selective system, bombarded tissue is cultured for about 0-28 days on nonselective medium and subsequently transferred to medium containing from about 1-3 mg/l hialaphos or about 1-3 mM glyphosate, as appropriate. While ranges of about 1-3 mg/l hialaphos or about 1-3 mM glyphosate can be employed, it is proposed that ranges of at least about 0.1-50 mg/l hialaphos or at least about 0.1-50 mM glyphosate will find utility in the practice of the invention. Tissue can be placed on any porous, inert, solid or semi-solid support for bombardment, including but not limited to filters and solid culture medium. Bialaphos and glyphosate are provided as examples of agents suitable for selection of transformants, but the technique of this invention is not limited to them.
An example of a screenable marker trait is the red pigment produced under the control of the R-locus in maize. This pigment may be detected by culturing, cells on a solid support containing nutrient media capable of supporting growth at this stage and selecting cells from colonies (visible aggregates of cells) that are pigmented. These cells may be cultured further, either in suspension or on solid media. The R-locus is useful for selection of transformants from bombarded immature embryos. In a similar fashion, the introduction of the C1 and B genes will result in pigmented cells and/or tissues.
The enzyme luciferase is also useful as a screenable marker in the context of the present invention. In the presence of the substrate luciferin, cells expressing luciferase emit light which can be detected on photographic or X-ray film, in a luminometer (or liquid scintillation counter), by devices that enhance night vision, or by a highly light sensitive video camera, such as a photon counting camera. All of these assays are nondestructive and transformed cells may be cultured further following identification. The photon counting camera is especially valuable as it allows one to identify specific cells or groups of cells which are expressing luciferase and manipulate those in real time.
It is further contemplated that combinations of screenable and selectable markers may be useful for identification of transformed cells. For example, selection with a growth inhibiting compound, such as bialaphos or glyphosate at concentrations that provide 100% inhibition followed by screening of growing tissue for expression of a screenable marker gene such as luciferase would allow one to recover transformants from cell or tissue types that are not amenable to selection alone.
Regeneration and Seed Production
Cells that survive the exposure to the selective agent, or cells that have been scored positive in a screening assay, are cultured in media that supports regeneration of plants, One example of a growth regulator that can be used for such purposes is dicamba or 2,4-D. However, other growth regulators may be employed, including NAA, NAA+2,4-D or perhaps even picloram. Media improvement in these and like ways can facilitate the growth of cells at specific developmental stages. Tissue can be maintained on a basic media with growth regulators until sufficient tissue is available to begin plant regeneration efforts, or following repeated rounds of manual selection, until the morphology of the tissue is suitable for regeneration, at least two weeks, then transferred to media conducive to maturation of embryoids. Cultures are typically transferred every two weeks on this medium. Shoot development signals the time to transfer to medium lacking growth regulators.
The transformed cells, identified by selection or screening and cultured in an appropriate medium that supports regeneration, can then be allowed to mature into plants. Developing plantlets are transferred to soilless plant growth mix, and hardened, e.g., in an environmentally controlled chamber at about 85% relative humidity, about 600 ppm CO2, and at about 25-250 microeinsteins/sec·m2 of light. Plants can be matured either in a growth chamber or greenhouse. Plants are regenerated from about 6 weeks to 10 months after a transformant is identified, depending on the initial tissue. During regeneration, cells are grown on solid media in tissue culture vessels. Illustrative embodiments of such vessels are petty dishes and Plant Con™. Regenerating plants can be gown at about 19° C. to 28° C. After the regenerating plants have reached the stage of shoot and root development, they may be transferred to a greenhouse for further growth and testing.
Mature plants are then obtained from cell lines that are known to have the mutations. In some embodiments, the regenerated plants are self-pollinated. In addition, pollen obtained from the regenerated plants can be crossed to seed grown plants of agronomically important inbred lines. In some cases, pollen from plants of these inbred lines is used to pollinate regenerated plants. The trait is genetically characterized by evaluating the segregation of the trait in first and later generation progeny. The heritability and expression in plants of traits selected in tissue culture are of particular importance if the traits are to be commercially useful.
Regenerated plants can be repeatedly crossed to inbred plants to introgress the transgene into the genome of the inbred plants. This process is referred to as backcross conversion. When a sufficient number of crosses to the recurrent inbred parent have been completed to produce a product of the backcross conversion process that is substantially isogenic with the recurrent inbred parent except for the presence of the introduced expression cassette encoding a CesA, the plant can be self-pollinated at least once to produce a homozygous backcross converted inbred containing the transgene or expression cassette. Progeny of these plants are true breeding.
Alternatively, seed from transformed plant lines regenerated from transformed tissue cultures can be grown in the field and self-pollinated to generate true breeding plants.
Seed from the fertile transgenic plants can then be evaluated for the presence of the desired CesA genomic modification, e.g., the desired CesA expression cassette, and/or the expression of the desired CesA protein. Transgenic plant and/or seed tissue can be analyzed using standard methods such as SDS polyacrylamide gel electrophoresis, liquid chromatography (e.g., HPLC) or other means of detecting a mutation.
Once a transgenic plant with a mutant sequence and having improved growth and pathogen resistance is identified, seeds from such plants can be used to develop true breeding plants. The true breeding plants are used to develop a line of plants with improved growth and pathogen resistance relative to wild type, and acceptable insect resistance while still maintaining other desirable functional agronomic traits. Adding the mutation to other plants can be accomplished by hack-crossing with this trait and with plants that do not exhibit this trait and studying the pattern of itilieritiance in segregating generations. Those plants expressing the target trait (e.g., CesA overexpression, good growth) in a dominant fashion are preferably selected. Back-crossing is carried out by crossing the original fertile transgenic plants with a plant from an inbred line exhibiting desirable functional agronomic characteristics while not necessarily expressing the trait of increased herbicide and pathogen resistance and good plant growth. The resulting progeny are then crossed back to the parent that expresses the increased herbicide and pathogen resistance and good plant growth. The progeny from this cross will also segregate so that some of the progeny carry the trait and some do not. This back-crossing is repeated until an inbred line with the desirable functional agronomic traits, and with expression of the trait involving an increase in herbicide and pathogen resistance and good plant growth. Such herbicide and pathogen resistance as well as good plant growth can be expressed in a dominant fashion.
The new transgenic plants can also be evaluated for a battery of functional agronomic characteristics such as growth, lodging, kernel hardness, yield, resistance to disease and insect pests, drought resistance, and/or herbicide resistance.
Plants that may be improved by these methods include but are not limited to agricultural plants of all types, fiber-producing plants (cotton, flax, hemp, jute, sisal, poplar, and/or eucalyptus), forage plants (alfalfa, clover and fescue), grains (maize, wheat, barley, oats, rice, sorghum, millet and rye), grasses (switchgrass, prairie grass, wheat grass, sudangrass, sorghum, straw-producing plants), softwood, hardwood and other woody plants (e.g., those used for paper production such as poplar species, pine species, and eucalyptus). In some embodiments, the plant, cell or seed is of a fiber-producing plant species such as a cotton, flax, hemp, jute, sisal, poplar, and/or eucalyptus plant, cell or seed. In some embodiments, the plant type is a eucalyptus plant type. Examples of plants useful for pulp and paper production include most pine species such as loblolly pine, Jack pine, Southern pine, Radiata pine, spruce, Douglas fir and others. Hardwoods that can be modified as described herein include aspen, poplar, eucalyptus, and others. Trees such as poplar, aspen, willow, and the like can also be modified as described herein.
Determination of Stably Transformed Plant Tissues
To confirm the presence of CesA expression cassette in the regenerating plants, or seeds or progeny derived from the regenerated plant, a variety of assays may be performed. Such assays include, for example, molecular biological assays available to those of skill in the art, such as Southern and Northern blotting and PCR; biochemical assays, such as detecting the presence of a protein product, e.g., by immunological means (ELISAs and Western blots) or by enzymatic function; plant part assays, such as leaf, seed or root assays; and also, by analyzing the phenotype of the whole regenerated plant.
Whereas DNA analysis techniques may be conducted using DNA isolated from any part of a plant, RNA may only be expressed in particular cells or tissue types and so RNA for analysis can be obtained from those tissues. PCR techniques may also be used for detection and quantification of RNA produced from introduced CesA transgene or expression cassette. For example, PCR also be used to reverse transcribe RNA into DNA, using enzymes such as reverse transcriptase, and then this DNA can be amplified through PCR techniques.
Further information about the nature of the RNA product may be obtained by Northern blotting. This technique will demonstrate the presence of an RNA species and give information about the integrity of that RNA. The presence or absence of an RNA species (e.g., CesA RNA) can also be determined using dot or slot blot Northern hybridizations. These techniques are modifications of Northern blotting and also demonstrate the presence or absence of an RNA species.
While Southern blotting and PCR may used to detect the presence of a CesA expression cassette, they do not provide information as to whether the preselected DNA segment is being expressed. Expression may be evaluated by specifically identifying the protein products of the introduced CesA expression cassette or the introduced mutations, by detecting expression of CesA proteins, or evaluating the phenotypic changes brought about by such mutation.
Assays for the production and identification of specific proteins may make use of physical-chemical, structural, functional, or other properties of the proteins. Unique physical-chemical or structural properties allow the proteins to be separated and identified by electrophoretic procedures, such as native or denaturing gel electrophoresis or isoelectric focusing, or by chromatographic techniques such as ion exchange, liquid chromatography or gel exclusion chromatography. The unique structures of individual proteins offer opportunities for use of specific antibodies to detect their presence in formats such as an ELISA assay. Combinations of approaches may be employed with even greater specificity such as Western blotting in which antibodies are used to locate individual gene products, or the rbsence thereof, that have been separated by electrophoretic techniques. Additional techniques may be employed to absolutely confirm the identity of a mutation such as evaluation by screening for reduced transcription (or no transcription) of CesA mRNAs, by screening for the CesA mRNA or CesA protein expression. Amino acid sequencing following purification can also be employed. The Examples of this application also provide assay procedures for detecting and quantifying infection and plant growth. Other procedures may be additionally used.
The expression of a gene product can also be determined by evaluating the phenotypic results of its expression. These assays also may take many forms including but not limited to analyzing changes growth or growth characteristics (e.g., taller plants), detection of stronger fibers, observation of greater mechanical strength, or other physiological properties of the plant. Expression of selected DNA segments encoding different amino acids or having different sequences and may be detected by amino acid analysis or sequencing.
Definitions
Sequences of proteins and nucleic acids of the same function can vary from one organism to another (or from one species to another). Sequences described herein can also vary while retaining the same function. For example, in some cases the sequences described herein can have at least one, or at least two, or at least three, or at least five, or at least ten, or more amino acid or nucleotide differences relative to the sequence provided herein or relative to a wild type sequence. Such sequence variation can be expressed as a variation (or percent) sequence identity. As used herein “sequence identity” refers to amino acids or nucleotides that are the same at analogous positions between two amino acid or nucleic acid sequences. The sequence identity can be expressed as a percentage. The positions of identical amino acids or nucleotides within a protein or nucleic acid can also vary but alignment of two sequences can illuminate which positions are analogous. Hence, variant proteins timid nucleic acids can have at least 30%, at least 40%, at least 50%, 60%, at least 70%, or at least 75%, or at least 80%, or at least 85%, or at least 90%, or at least 95%, or at least 96%, or at least 97%, or at least 98%, or at least 99%, or at least 99.5% sequence identity to any of the sequences described herein, for example, by SEQ ID NO.
As used herein, “about” will be understood by persons of ordinary skill in the art and will vary to some extent depending upon the context in which it is used. If there are uses of the term which are not clear to persons of ordinary skill in the art, given the context in which it is used, “about” will mean up to plus or minus 10% of the particular term.
A promoter operable in a specified species or type of organism means that the promoter can facilitate expression of a coding region that is linked thereto.
The following Examples describe some experimental work performed during development of the invention.
Example 1
Materials and Methods
This Example describes some of the materials and methods used in the development of the invention.
Complete Arabidopsis AtCesA (AtCesA6, AtCesA2, AtCesA 5, AtCesA3, AtCesA9 and AtCesA7) coding regions (cDNAs) were cloned and driven by double 35S promoter in the binary vector pD1301s plasmid (Table 1).
| TABLE 1 |
| |
| Primers for over-expression vector construction. |
| |
|
|
Restriction |
|
|
| |
Primer |
|
Enzyme |
TM |
Length |
| Genes |
name |
Primer sequence (5′-3′) |
cutting site |
(° C.) |
(bp) |
| |
| AtCesA3 |
A3-F | GCTCTAGAATGGAATCC |
XbaI | |
60 |
3329 |
| |
SEQ ID |
GAAGGAGAAACC |
|
|
|
| |
NO: 17 |
|
|
|
|
| |
A3-R |
AACTGCAGCACCAAGA |
PstI |
|
|
| |
SEQ ID |
CAGAAGAACGAACAG |
|
|
|
| |
NO: 18 |
|
|
|
|
| |
| AtCesA6 |
A6-F |
AAAGAGCTCATGAACA |
SacI |
58 |
3255 |
| |
SEQ ID |
CCGGTGGTCGG |
|
|
|
| |
NO: 19 |
|
|
|
|
| |
A6-R |
AAATCTAGATCACAAG |
XbaI |
|
|
| |
SEQ ID |
CAGTCTAAACCACAG |
|
|
|
| |
NO: 20 |
|
|
|
|
| |
| AtCesA2 |
A2-F |
GCTCTAGAATGAATAC |
XbaI |
58 |
3255 |
| |
SEQ ID |
TGGTGGTCGGCTCAT |
|
|
|
| |
NO: 21 |
|
|
|
|
| |
A2-R |
AACTGCAGTTAGTTTC |
PstI |
|
|
| |
SEQ ID |
CACAATTCAGACCACAGA |
|
|
|
| |
NO: 22 |
|
|
|
|
| |
| AtCesA5 |
A5-F |
GCTCTAGAATGAATA |
XbaI |
58 |
3210 |
| |
SEQ ID |
CTGGTGGTCGGCTCATC |
|
|
|
| |
NO: 23 |
|
|
|
|
| |
A5-R |
AACTGCAGTCAAAGGC |
PstI |
|
|
| |
SEQ ID |
AGTCCAAGCCACATAT |
|
|
|
| |
NO: 24 |
|
|
|
|
| |
| AtCesA9 |
A9-F |
GCTCTAGAATGAACA |
XbaI |
56 |
3268 |
| |
SEQ ID |
CTGGAGGGAGACTC |
|
|
|
| |
NO: 25 |
|
|
|
|
| |
A9-R |
AACTGCAGCTCACTTT |
PstI |
|
|
| |
SEQ ID |
AAACAGTCAAGACCAC |
|
|
|
| |
NO: 26 |
|
|
|
|
| |
| AtCesA7 |
A7-F | GGGGTACCATGGAAG |
KpnI | |
60 |
3081 |
| |
SEQ ID |
CTAGCGCCGGTC |
|
|
|
| |
NO: 27 |
|
|
|
|
| |
A7-R |
ACGCGTCGACTCAGC |
SalI |
|
|
| |
SEQ ID |
AGTTGATGCCACACTTG |
|
|
|
| |
NO: 28 |
| |
The lines transformed with an empty vector (EV) were used as control, Transgenic plants were generated by introducing the constructs into an Agrobacterium tumfaciens strain GV3101, and transformation was carried out by floral dipping method.
(Zhang et al., 2006). T1 transgenic seedlings were selected on half (½) MS medium containing 50 mg/L hygromycin, and further confirmed by RT-PCR or Q-PCR. More than three hygromycin-resistant lines (independent transformation events) for each construct were selected to and propagated to homozygous states. Phenotypic characterization was performed on T5 homozygous transgenic lines.
Arabidopsis seeds were surface sterilized using 75% ethanol for 4 min, 10% sodium hypochlorite with 0.01% Triton X-100 for 3 min and washed in sterile water several times, then imbibed at 4° C. in the dark in sterile water containing 0.1% agar for three days and germinated on plates containing half MS media (1% sucrose; pH 5.8) in 1% agar. Plates were incubated in a near-vertical position at 22° C. under light-grown conditions (16-hours light/5-hours dark) for photo-morphogenesis or dark-grown conditions (24-hours dark) for skotomorphogenesis (development of seeds in the dark). The seedlings were transplanted to the soil after the second real leaf is clearly visible.
RNA Extraction and Q-PCR Measurement
Seedlings were germinated and grown on ½ MS medium for indicated number of days under light- or dark-grown conditions, and seedlings (hypocotyls, roots) were harvested in liquid nitrogen. Total RNA was isolated from the collected tissues using Trizol reagent (invitrogen, Carlsbad, CA). First-strand cDNA was obtained using OligodT and M-MLV reverse transcriptase (Promega, Madison, WI, USA). Q-PCR amplification was carried out on a Bio-Rad MyCycler thermal cycler with SYBER Premix ExTaq (TakaRa, Tokyo, Japan) according to the manufacturer's instruction, and AtGAPDH was used as the internal control. The PCR thermal cycle conditions were as follows: one cycle of 95° C. for 2 minutes, followed by 45 cycles of 95° C. for 15 seconds, 58° C. for 15 seconds and 72° C. for 25 seconds. The expression value of GAPDH was defined as 100, and the expression level of CesA genes was thus normalized to the expression level of GAPDH. All of the primers used in these assays are listed in Table 2. Three biological replications were performed.
| Genes | Primer name | Primer sequence (5′-3′) | (° C.) | DNA | cDNA |
| |
| AtCesA1 | QA1-F | AAGTGCTGCTATGTC | 58 | 401 | 295 |
| | SEQ ID NO: 29 | CAGTTCCC | | | |
| | QA1-R | TGTTGATGCCTCTCC | | | |
| | SEQ ID NO: 30 | TCTTTTCG | | | |
| |
| AtCesA3 | QA3-F | CCCTATCACCTCCAT | 58 | 334 | 179 |
| | SEQ ID NO: 31 | TCCTCTTCT | | | |
| | QA3-R | CGTCTATGCCTACGC | | | |
| | SEQ ID NO: 32 | CACTCC | | | |
| |
| AtCesA6 | QA6-F | ACAGCACAGAAAGT | 58 | 448 | 251 |
| | SEQ ID NO: 33 | GCCTGAG | | | |
| | QA6-R | GGAGCATTTGATAGA | | | |
| | SEQ ID NO: 34 | ACCCCA | | | |
| |
| AtCesA2 | QA2-F | TCGTCCCTGAGATAA | 58 | 231 | 147 |
| | SEQ ID NO: 35 | GCAACTAC | | | |
| | QA2-R | CCCCTCCGATTACCC | | | |
| | SEQ ID NO: 36 | AAAA | | | |
| |
| AtCesA5 | QA5-F | GATGCAATGGGGTA | 58 | 233 | 233 |
| | SEQ ID NO: 37 | AAGTAGGG | | | |
| | QA5-R | TGATGAGTAGTGTGG | | | |
| | SEQ ID NO: 38 | TTGGAGGG | | | |
| |
| AtCesA9 | QA9-F | GGAGGGAGACTCATT | 58 | 675 | 255 |
| | SEQ ID NO: 39 | GCTGG | | | |
| | QA9-R | TGTATCGGGTTCCGCA | | | |
| | SEQ ID NO: 40 | CTG | | | |
| |
| AtCesA4 | QA4-F | ATTCTGGGTGATTTGG | 58 | 190 | 190 |
| | SEQ ID NO: 41 | CGG | | | |
| | QA4-R | AATAATGAGAGTTGT | | | |
| | SEQ ID NO: 42 | CGGAGGG | | | |
| |
| AtCesA7 | QA7-F | TTCTTGCCTACTGTA | 58 | 231 | 152 |
| | SEQ ID NO: 43 | TCCTTCC | | | |
| | QA7-R | GCTAACTCCGCTCCA | | | |
| | SEQ ID NO: 44 | TCTCA | | | |
| |
| AtCesA8 | QA8-F | CATCCCAACGCTATC | 58 | 152 | 152 |
| | SEQ ID NO: 45 | AAACCTA | | | |
| | QA8-R | CTGAGACACCTCCAA | | | |
| | SEQ ID NO: 46 | TAACCCA | | | |
| |
| AtGAPDH | QGAPDH-F | GCAACATACGACGA | 58 | 398 | 217 |
| | SEQ ID NO: 47 | AATCAAGAA | | | |
| | QGAPDH-R | CGACACGAGAACTG | | | |
| | SEQ ID NO: 48 | TAACCCC |
| |
Total Protein Extraction and Western Blot Analysis
D9 seedlings were ground to a fine powder in liquid nitrogen, and 1.0 g powder was extracted using Plant Total Protein Lysis Buffer (Sangon Biotech, Shanghai, China; PL011) (1 mL Solution A, 10 μL Solution B, 10 μL Solution C) with protease inhibitors (1.0 mM Phenylmethanesulfonyl fluoride, 1.0 μM pepstatin A and 1.0 μM leupeptin). The extracts were transferred to 2-mL tubes under ultrasonic treatment on the ice for 20 min. The suspension liquid was incubated for 30 min at 4° C. under continuous stirring in the presence of 50 μL, 1% digitonin or 100 μL 20% Triton X-100. The homogenate was centrifuged at 12000 g for 30 min at 4° C. The protein concentration in the supernatant was determined using bicinchoninic acid Protein Assay Kit (Qcbio S&T). The AtCesA2, AtCesA5 and AtCesA6 protein levels were detected by Western blot analysis as described by Li et al. (2017). Purification of primary antibodies was performed using Protein A-Agarose and detected by Western blot analysis in WT. Antibody dilutions were performed as 1:250, 1:125 and 1:30 for AtCesA6, AtCesA2 and AtCesA5 antibodies, respectively.
Velocity and Density Measurements of GFP-CesA3 at the Plasma Membrane
To investigate the CesA dynamics in seedlings, the Arabidopsis transgenic overexpression lines were crossed with CesA marker proAtCesA3:GFP-AtCesA3 (Desprez et al., 2007). F1 seeds were surface sterilized and sown on ½ MS (plus 1% sucrose) plates where the seeds were stratified at 4° C. for 2 days. Afterwards, the plates were transferred to a growth chamber (22° C., light/dark 16 hours/8 hours), exposed to light about 3 hours and then covered with the aluminum foil. Etiolated hypocotyls were used for imaging after being vertically grown for 3 days. Images were obtained from epidermal cells within 2 mm below the apical hook. The enhanced etiolated hypocotyl phenotype of the overexpression lines was confirmed to assure that gene silencing of the overexpression constructs was not occurring.
The CesA velocity measurement and analysis were performed as described Ivakov et al. (2017). The density of CesAs was measured with the plugin TrackMate (see website at fiji.sc/TrackMate) in Fiji (see website at fiji.sc/Fiji). The time lapses were used for analysis and a median filter was applied. The particle diameter and the maximum/minimum signal intensity were used to avoid the interference of the noise and Golgi-localized CesAs. Significant differences were performed by Student's t-test. There were 578-1257 CesA3 particles detected with n≥4 cells from four different seedlings for each genotype.
Observation of Cellulose Macrofibrils by Atomic Force Microscopy (AFM)
The purified cellulose sample fractionations of D9 hypocotyls were performed as described by Li et al. (2017), with some minor modifications that hypocotyls were milled into fine powder under liquid nitrogen and then add 8% NaClO2 (10 mL). The precipitated residue was treated with 4 M KOH for 1 hour, washed with distilled water six times and resuspended in water for AFM scanning. The cellulose samples were suspended in ultra-high-purity water and placed on mica using a pipette. The mica was glued onto a metal disc (15 mm diameter) after removal of extra water under nitrogen and then placed on the piezo scanner of AFM (MultiMode VIII; Bruker, Santa Barbara, CA). AFM imaging was carried out in ScanAsyst-Air mode using BrukerScanAsyst-Air probes (tip radius, 2 nm and silicon nitride cantilever; spring constant, 0.4 N/m) with a slow scan rate of 1 Hz. All AFM images were 3rd-flattened and analyzed quantitatively using NanoScope Analysis software (Bruker). Three biological replications were performed each experiment, and 10 dots of each AFM image were randomly selected to measure the width (nm) 9 length (nm) by NanoScope Analysis software (Bruker). The average particle length/width of each image was calculated from the selected ten particles (n=10).
Hypocotyl, Root and Cell Length Measurements
To observe hypocotyl and root growth, Arabiclopsis seedlings were scanned using an HP Scanjet 8300 scanner at 600 dpi, the hypocotyl length of vertically grown seedlings was measured from hypocotyl base to the apical hook and the root length was measured (root tip to hypocotyl base) using ImageJ 1.32j (see website at rsb.info.nih.gov/ij/). Two-tailed t-tests were performed with Microsoft Excel software. For images of epidermal cell patterns, D9 hypocotyls were mounted and images of epidermal cells were viewed using differential interference contrast (80i; Nikon, Japan).
At least three biological replicates were performed each experiment, and more than 30 seedlings were measured each genotype. Cell lengths in recorded images were quantified using ImageJ, and epidermal cells of hypocotyl were visualized under confocal laser scanning microscopy (p58; Leica, Leica Microsystems, Nussloch, Germany) using 4-day-old dark-grown (D4) hypocotyls incubated in the dark for 10 min in a fresh solution of 115 mM (10 mg/mL) propidium iodide (PI; Naseer et al., 2012). PI was excited at 488 nm, and fluorescence was detected at 600-700 nm.
Cell Division Observation
Root meristem size was highlighted as the distance between the quiescent centre (QC) and the transition zone (TZ, indicating the position of the first elongating cortical cell), and the number of cortical cells was counted in a file extending from QC to TZ (Beemster and Baskin, 1998). To count the number of cortical cells, L9 root tips were mounted, and images viewed by differential interference contrast (80i; Nikon, Japan). At least three biological replications were performed each experiment, and more than 30 seedlings were measured each genotype. To visualize cell cycle progression in living cells, G2/M-specific marker proAtCYCB1; 1:AtCYCB1; 1-GFP (Ubeda-Tomas et al 2009) was crossed with different homozygous AtCesA6-like transgenic lines. Measurements of F1 hybrid seedlings were performed using confocal images of light-grown roots stained with P1. GFP was excited at 473 nm, and fluorescence was detected at 485-545 nm.
Observation of Cell Wall Structures by Transmission Electron Microscopy (TEM)
TEM was used to observe cell wall structures in the xylary fibre (xf) cells of the 1st inflorescence stems of 7-week-old plants. The samples were post-fixed in 2% (w/v) osmium tetroxide (OsO4) for 1 hour after extensively washing in the PBS buffer and embedded with Super Kit (Sigma-Aldrich, St. Louis, MO, USA). Sample sections were cut with an Ultracut E ultramicrotome (Leica) and picked up on formvar-coated copper grids. After post-staining with uranyl acetate and lead citrate, the specimens were viewed under a Hitachi H7500 transmission electron microscope. The width of three relatively fixed points on each cell wall was measured using ImageJ. More than 60 cell walls for each t genotype were measured. Significance differences were performed by Student's t-test. Three biological replications were performed.
Crude Cell Wall Extraction and Mechanical Force Measurement by AFM
The basal (1 cm) florescence stems from 7-week-old plants were ground under liquid nitrogen and then incubated at 70° C. in 96% (v/v) ethanol for 30 min. The pellet was successively washed with absolute ethanol, twice with 2:3 (v/v) chloroform:methanol, then once each with 65% (v/v), 80% (v/v) and absolute ethanol, and the remaining pellet was freeze-dried as crude cell wall material. The crude cell wall material was suspended in ultra-high-purity water, placed on new mica using a pipette and dried in air overnight. The mica was glued onto a metal disc (15 mm diameter) and placed on the piezo scanner of an AFM (MultiMode VIII; Bruker), A hard tip (RTESP; Milker) with radius of 8 nm, and spring constant of 40 N/m was used in the mechanical properties measurement. The precise spring constant was corrected by Sader method, and the deflection sensitivity was average determined by measuring a set of force-distance curves on the mica. The scan size was 10 μm×10 μm, and 16×16 FD curves were collected for every measurement, and 10 different cell segments were randomly selected for mechanical measurements each sample. The Young's modulus was calculated using Hertz model of the NanoScope analysis software, and Wilcoxon test was used to test significance of average Young's modulus (He et al., 2015). Two biological replications were performed each experiment.
Plant Height and Dry Weight Measurement
The homozygous lines were transplanted into soil as individual plant per basin; the plants were grown in a glasshouse at 22° C. under light-grown condition for 7 weeks in a fully randomized experimental design. The plant height was measured from the basal stem to the peaks of the mature Arabidopsis plants. Harvested 7-week-old inflorescence stems per plant, then dried under suitable temperature (55° C.) for 3-5 days and finally weighed by analytical balance. Three biological replications were performed each experiment, and more than 30 plants were measured each genotype. Significance analysis was performed by Student's t-test.
Plant Cell Wall Composition Fractionation and Determination
Plant cell wall fractionations and determination were performed as described by Jin et al. (2016), with some minor modifications for crystalline cellulose extraction. For crystalline cellulose extraction, one hundred D9 or L9 seedlings or the dry biomass powder of 7-week-old inflorescence steins (40 mesh) samples (0.1-1.0 g) were suspended in 5.0 mL acetic acidnitric acidwater (8:1:2, v/v/v) and heated for 1 h in a boiling water bath with stirring every 10 min. After centrifugation, the pellet was washed several times with 5.0 mL water and the remaining pellet was defined as crystalline cellulose sample. Total lignin was determined as described previously (Sun et al., 2017). At least three biological replications were performed.
Determining Monosaccharide Composition of Total Wall Polysaccharides by GC-MS
Both the seedlings and the dry biomass powder (40 mesh) samples (0.1-1.0 g) were washed twice with 5.0 ml, buffer and twice with 5.0 mL distilled water. The remaining pellet was stirred with 5.0 mL chloroform-methanol (1:1, v/v) for 1 h at 40° C. and washed twice with 5.0 mL methanol, followed by 5.0 mL acetone. The pellet was washed once with 5.0 mL distilled water. The remaining pellet was added with 5.0 mL aliquot of DMSO-water (9:1, v/v), vortexed for 3 min and then rocked gently on a shaker overnight. After centrifugation, the pellet was washed twice with 5.0 mL DMSO-water and then with 5.0 mL distilled water three times. The remaining pellet was defined as total wall polysaccharides and confirmed by determining monosaccharide composition with GC-MS as described previously (Xu et al., 2012). Three biological replications were performed.
RNA Sequencing and Analysis
Total RNA was isolated from the 6-day-old dark-grown (D6) seedlings (four samples, two biological replications) using Trizol reagent (Invitrogen). The RNA was checked for purity before performing RNA sequencing using NanoDrop 2000 (NanoDrop, Thermo-Fisher, USA). RNA samples with RNA integrity numbers greater than eight (>8) were selected for library preparation, and RNA concentration was detected on Qubit 2.0 (Invitrogen). The optimized total RNA of 0.1-4 μg was used for this protocol. For cDNA library construction, total RNA was processed using a TruSeq™ RNA Sample Preparation Kit (Illumina, Tokyo, Japan) according to the manufacturer's instructions. All samples were sequenced using an Illumina HiSeq 2000 sequencer (Anders et al., 2015).
Raw reads were described previously (Mortazavi et al., 2008). DEGs were applying the statistical tests for the group between transgenetic lines with wide type and performed by the DESeq R package (1.12.0). Then, P values were adjusted using the Benjamini and Hochberg method. A corrected P value of 0.001 and log 2 (fold change) of 1 was set as the thresholds for significant differential expression (Anders and Huber, 2010).
Gene ontology (GO) terms of differential expressed genes were derived from agriGO. GO subontology ‘biological process’ (GO-BP) was used for the gene-set enrichment analysis. TopGO from Bioconductor in R (see website at www.r-project.org/) was used to identify enriched GO terms (Du et al., 2010). This was performed for all DEGs. The enrichment analysis of GO-BP terms relative to its expectation was performed using a weighted method in combination with Fisher's exact test.
Microscopy Observation
Seven-week-old Arabidopsis 1st inflorescence stems were embedded with the 4% agar and then cut into sections of 100 μm thick by microtome (VT1000S; Leica). Stem sections were stained in calcofluor for 3 min and then rinsed, mounted in water, and observed and photographed under epilluorescence microscopy (Olympus BX-61, Retiga-4000DC digital camera).
Example 2
Overexpression of Three CesA6-Like Genes Enhances Seedling Growth
Either dark-grown (D) or light-grown (L) seedlings were studied to ascertain how different aspects of plant development correlated with changes in cellulose synthesis. The growth and transcript levels were investigated of the CesA genes associated with primary and secondary wall cellulose synthesis using real-time PCR (Q-PCR) analysis in Arabidopsis wild-type (WT; Col-0) seedlings (FIG. 1A-1G). Growth was consistently enhanced at both 9-day-old dark-grown (D9) hypocotyls and 9-day-old light-grown (L9) roots (FIG. 1E). These tissues were chosen to measure primary cell wall deposition relating to cell length and cell numbers, due to their relatively large tissue size and high primary wall CesA expression levels.
To ascertain whether overexpression of certain CesA proteins may improve plant growth and cellulose synthesis, CesA overexpressing lines driven by 35S promoter were generated in Arabidopsis wild type background, Growth of the homozygous transgenic progeny was monitored. At least three genetically independent homozygous transgenic lines were selected for analysis of each gene, and the lines were verified by Western blot analysis of protein levels (FIG. 1 ).
Compared with wild type and empty vector (EV) plants, plants of transgenic lines that overexpressed CesA2 (A2), CesA5 (A5) and CesA6 (A6), but not CesA3 (A3), CesA9 (A9) and CesA7 (A7), showed longer hypocotyl or root length (FIGS. 1B-1D). These data indicate that overexpression of certain CesA6-like genes can enhance seedling growth.
Example 3
CesA6-Like Gene Overexpression Increases Other Primary Wall CesA Expression
To investigate how the enhanced seedling growth was supported in the CesA overexpression lines (CesA2, CesA5 and CesA6), the expression levels of major CesA genes were evaluated in young transgenic seedlings by Q-PCR.
As shown in FIG. 2A-2F overexpression of one of the CesA2, CesA5 and CesA6 genes can enhance the expression of other CesA genes both in D9 hypocotyls (FIG. 2A) and in L9 roots (FIG. 2D). Notably, as shown in FIG. 2B, two major primary CesA genes (CesA1 and CesA3) also exhibited significantly increased expression levels, especially in D9 hypocotyls. While expressions of nearly all primary wall CesA genes were increased in the transgenic lines, the CesA3 expression was reduced in seedling roots of the lines (FIG. 2B, 2E). However, one of the major secondary wall CesA genes, the CesA8 gene, showed markedly decreased expression levels in both D9 hypocotyls and L9 roots (FIG. 2C, 2F). These data indicate that overexpression of any of the three CesA6-like genes could increase the expression of other primary wall CesA genes, with the exception of CesA9, which is mainly expressed in pollen tissues.
Example 4
CesA6-Like Gene Overexpression Increases Dynamic Movement of Primary Wall CesAs in the Plasma Membrane
To assess the behavior of increased primary wall CesA genes or the cellulose synthase complexes (CSCs), three overexpressing lines (A2, A5 and A6) were crossed the with the proAtCesA3:GFP-AtCes A3 marker line, in which primary wall CSC behavior may be assessed (Desprez et al., 2007). FIG. 3A illustrates that GFP-CesA3 is visible; and can be used to show dynamic movements of CesA3 in epidermal cells of D3 hypocotyls. As shown in FIG. 3B, compared to wild type, no major differences in GFP-CesA3 particle density were observed at the plasma membrane between the overexpressing lines and control in D3 hypocotyls. However, the GFPCesA3 particles in the plasma membrane moved significantly faster in the overexpressing lines, especially in A6 and A2 lines (FIG. 3C). Notably, the three overexpressing lines (A2, A5 and A6) showed a larger proportion of GFP-CesA3 particles moving with speeds higher than 300 nm/min (FIG. 3D). Thus, overexpression of the three CesA6-like genes may cause an increase in CSC motility at the plasma membrane.
Example 5
Cellulose Synthesis is Enhanced in Arabidopsis Transgenic Seedlings
To assess whether the transgenic lines produced more cellulose than wild type (WT), crystalline cellulose levels were measured in seedlings.
As shown in FIG. 4A-4B, compared to wild type, overexpression of one of the CesA2, CesA5 and CesA6 genes in plant lines A2, A5 and A6 shows that significantly increased levels of crystalline cellulose were present per plant in D9 and L9 seedlings. The increase in crystalline cellulose ranged from 5% to 11%. In terms of cell wall compositions, D9 seedlings of the three overexpressing lines had higher crystalline cellulose and pectin levels and relatively lower hemicelluloses levels per dry weight than those of WT (FIGS. 4D-4F). Based on the monosaccharide composition analysis of total wall polysaccharides, all three transgenic lines showed significantly lower proportions of rhamnose, fucose and mannose, with variations of other monosaccharides, compared to WT (FIG. 4G).
The properties of the cellulose were examined by observing the reassembly of macrofibrils in vitro under atomic force microscopy (AFM) from D9 hypocotyls. As shown in FIG. 4C, the CesA6 overexpressing plant lines exhibited larger, egg-shaped macrolibrils as compared to the WT material (exhibiting a five-fold increase in size), suggesting that overexpression of CesA6 genes can affect microfibril organization (FIG. 4C).
In summary, overexpression of CesA2, CesA5 and CesA6 proteins can enhance cellulose biosynthesis and influence the size of cellulose microfibril aggregates in vitro, perhaps caused by the increased movement of primary wall CesA proteins.
Example 6
Enhanced Cell Elongation and Division in Transgenic Seedlings
To assess what aspects of seedling growth were enhanced by the overexpression of CesA2, CesA5 and CesA6 proteins, cell elongation and division were evaluated.
First, the size of basal epidermal cells of D9 hypocotyls were measured. These cells were significantly longer in plant lines that overexpressed CesA2, CesA5 and CesA6 proteins as compared to WT (FIGS. 5A & 5C). Because the number of epidermal cells in a single vertical cal file (parallel to the direction of growth) is genetically fixed to approximately 20 cells in Arabidopsis hypocotyls (Gendreau et al., 1997), the inventors presumed that the increased hypocotyl lengths would mainly be due to enhanced cell elongation in the transgenic plants.
The cortical cell numbers of root apical meristems from the quiescent centres (QC) to the transition zone (TZ) in L9 seedlings were estimated to assess the causes for the increased root growth. The transgenic lines contained more cells in this region as compared to WT, indicating an enhanced cell division in these lines (FIG. 5B). To test this, plant lines overexpressing CesA2, CesA5 and CesA6 proteins were crossed with the proAtCYCB1; 1:AtCYCB1; 1-GFP marker line, a classic G2 (interphase) to M (mitotic phase) specific marker of the cell division cycle (Ferreira et al., 1994; Uheda-Tomas et al., 2009). Analyses of the progeny of these crosses revealed that the transgenic lines had more cells undergoing division than WT in L4 root tips, are detected by the increased green fluorescent foci visible in the roots (FIG. 5D). Thus, overexpression of CesA2, CesA5 and CesA6 proteins can enhance both cell elongation and division in Arabidopsis seedlings.
To investigate how overexpression of CesA2, CesA5 and CesA6 proteins influenced general gene expression, RNA sequencing experiments were performed of 6-day-old dark-grow (D6) WT, A2, A5 and A6 transgenic seedlings. Many genes included under Gene Ontology and Biological Process terms (GO and BP terms) associated with cell growth and cellulose synthesis showed clear differences in their expression in the transgenic lines, compared to wild type (FIG. 5E-5I). These changes indicate that the increase in the primary wall CesA genes can affect plant growth in other ways than simply making more cellulose.
Example 7
Increased Biomass Yields in Three CesA6-Like Transgenic Mature Plants
When the CesA2, CesA5 and CesA6 transgenic plants were grown on soil, it was noted that these plants were taller. These CesA2, CesA5 and CesA6 transgenic plants also had more dry weight compared to wild type plants after 7 weeks of growth (FIG. 6A-6C).
Microscopic observations were made of transverse sections of 1st internode stem that were stained with calcofluor, which stains glucans including cellulose (Haigler et al., 1980). FIG. 6D shows that stronger calcofluor fluorescence was present in plant lines overexpressing CesA2, CesA5 and CesA6 compared to wild type.
The cell wall composition of the 7-week-old inflorescence stems of mature plants were then analyzed. As shown in FIG. 6E, plant lines that overexpressed the CesA2, CesA5 and CesA6 genes contained more crystalline cellulose per plant (ranging from 29% to 37% increase) than wild type plants. These transgenic plants that overexpress CesA2, CesA5 and/or CesA6 also exhibited significantly higher crystalline cellulose and lignin levels with relatively lower hemicelluloses content per dry weight compared to wild type. However, no significant difference was found in the relative pectin levels among all enic lines and wild type plants.
Based on monosaccharide composition analysis of total wall polysaccharides, all mature transgenic plants showed a significant increase in xylose and a decrease in other monosaccharides, as compared to wild type. These data indicate that the enhanced biomass yields are mainly due to an increase in cellulose and lignin levels in the three plant lines that overexpress CesA2, CesA5 and/or CesA6 genes.
Example 8
Increased Secondary Wall Thickness in Transgenic Mature Plants
Because plant secondary cell walls represent the major biomass production site (Fan et al., 2017; Li et al., 2017), transmission electron microscopy (TEM) was used to observe the xylary fibre (xt) sclerenchyma cells in the 1st internode stem of 7-week-old Arahidopsis plants. As illustrated in FIG. 7A-7B, TEM revealed that plant lines that overexpress CesA2, CesA5 and/or CesA6 genes had much thicker cell walls in xylary fibre tissues, which are largely comprised of secondary walls. Quantification of the cell wall width showed that plant lines that overexpress CesA2, CesA5 anchor CesA6 genes have thicker primary walls than those of wild type plants (see FIG. 7C), consistent with their increased cellulose levels and large macrofibrils in reassembly assays of seedlings (see FIG. 4 ).
Notably, plant lines that overexpress CesA2, CesA5 and/or CesA6 genes also had remarkably increased secondary cell wall widths (more than two-fold) compared with wild type plants (FIG. 7D).
Hence, overexpression of CesA2, CesA5 and/or CesA6 genes can increase both primary and secondary wall deposition.
The impact of CesA3 and CesA9 overexpression on secondary cell wall formation was also examined in CesA3 and CesA9 transgenic plants (A3 and A9). Unlike CesA2 and CesA5, overexpression of CesA3 or CesA9 did not increase secondary cell wall widths (FIG. 7E-7F), consistent with its inability to enhance young seedling growth (FIG. 1B) and plant growth (FIG. 7F).
Surprisingly, despite the similar phenotypes observed in the young seedlings in comparison with wild type (FIG. 1B), the CesA7 overexpressing plants (A7) exhibited incomplete xylary fibre (xf) cell walls (FIG. 7E), indicating that simply overproducing secondary CesA genes is unlikely to increase secondary wall deposition. The incomplete walls observed for CesA7 overexpressing plants (A7) may be due to defects in cell wall integrity or may indicate cosuppression of other secondary wall genes (FIG. 7F).
Example 8
Increased Wall Mechanical Strength in Transgenic Mature Plants
As cell walls provide plants with mechanical strength (Fan et al., 2017). To evaluate the mechanical strength of transgenic plant, crude cell walls were extracted from the 1st internode stem of 7-week-old plants. The wall forces of these cell walls were evaluated by measuring the Young's modulus of the cell walls using AFM technology (FIG. 8A).
As shown in FIG. 8B, compared to wild type, plant lines that trans enically overexpress CesA2, CesA5 and/or CesA6 genes exhibited significantly enhanced mean mechanical strength with a higher proportion of Young's modulus values in the range from 10 to 100 GPa (FIG. 8C). Therefore, the CesA6 overexpression plants had relatively higher mechanical strength in the basal stems of plants, likely due to the enhanced secondary wall synthesis.
REFERENCES
- Anders, S. and Huber, W. (2010) Differential expression analysis for sequence count data, Genome Biol. 11, R106.
- Anders, S., Pyl, P. T. and Huber, W. (2015) HTSeq-a Python framework to work with high-throughput sequencing data. Bioinformatics, 31, 166-169.
- Arioli, T., Peng, L., Betzner, A. S., Burn, J., Wittke, W., Herth, W., Camilleri, C. et al. (1998) Molecular analysis of cellulose biosynthesis in Arabidopsis. Science, 279, 717-720.
- Beemster, G. T. and Baskin, T. I. (1998) Analysis of cell division and elongation underlying the developmental acceleration of root growth in Arabidopsis thaliana. Plant Physicol. 116, 1515-4526.
- Bischoff, V., Desprez, T., Mouille, G., Verabettes, S., Gotinean, M. and Hoffte, H. (2011) Phytochrome regulation of cellulose synthesis in Arabidopsis. Curr. Biol. 21, 1822-1827.
- Bringmann, M., Li, E., Sampathkumar, A., Kocabek, T., Hauser, M. T. Persson, S. (2012) POM-POM2/CELLULOSE SYNTHASE INTERACTING-1 is essential for the functional association of cellulose synthase and microtubules in Arabidopsis. Plant Cell, 24, 163-177.
- Burton, R. A. and Fincher, G. B. (2014) Plant cell wall engineering applications in biofuel production and improved human health. Curr. Opin. Plant Biol. 26, 79-84.
- Cano-Delgado, A., Penfield, S., Smith, C., Catley, M. Bevan, M. (2003) Reduced cellulose synthesis invokes lignification and defense responses in Arabidpsis thaliana. Plant J. 34, 351-362.
- Carroll, A. and Somerville, C. (2009) Cellulosic biofuels. Annu. Rev. Plant Biol. 60, 165-182.
- Carroll, A., Mansoori, N., Li, S., Lei, L., Verahettes, S., Visser, R. G. F., Somerville, C. et al. (2012) Complexes with mixed primary and secondary cellulose synthases are functional in Arabidopsis plants. Plant Physiol. 160, 726-737. Chen, S., Ehrhardt, D. W. and Somerville, C. R. (2010) Mutations of cellulose synthase (CESAI) phosphorylation sites modulate anisotropic cell expansion and bidirectional mobility of cellulose synthase. Proc. Natl Acad. Sci. USA, 107, 17188-17193.
- Chen, S., Jia, H., Zhao, H., Liu, D., Liu, Y., Liu, B., Bauer, S. et al. (2016) Anisotropic cell expansion is affected through the bidirectional mobility of cellulose synthase complexes and phosphorylation at two critical residues on CESA3. Plant Physiol. 171, 242-250.
- Cosgrove, D. J. (2005) Growth of plant cell wall. Nat. Rev. Mol. Cell Biol. 6, 850-861.
- Desprez, T., Jaranice, M., Crowell, E. F., Jouy, H., Poehylova, Z., Parcy, F., Hoffte, H. et al. (2007) Organization of cellulose synthase complexes involved in primary cell wall synthesis in Arabidopsis thaliana. Proc. Natl Acad. Sci. USA, 104, 15572-15577.
- Dolan, L., Janmaar, K., Willemsen, V., Linstead, P., Poethig, S., Roberts, K. and Scheres, B. (1993) Cellular organisation of the Arabidopsis thaliana root. Development, 110, 71-84.
- Du, Z., Thou, X., Ling, Y., Zhang, Z. and Sn, Z. (2010) agriGO: a GO analysis toolkit for the agricultural community. Nucleic Acids Res. 38, 64-70.
- Fagard, M., Desnos, T., Desprez, T., Goubet, F., Refregier, G., Mouille, G., McCann, M. et al. (2000) PROCUSTE1 encodes a cellulose synthase required for normal cell elongation specifically in roots and dark-grown hypocotyls of Arabidopsis. Plant Cell, 12, 2409-2424.
- Fan, C., Li, Y., Hu, Z., Hu, H., Wang, G., Li, A., Wang, Y. et al. (2017) Ectopic expressions of a novel OsExtenstin-like gene consistently enhance plant lodging resistance by regulating cell elongation and ca wall thickening in rice. Plant Biotechnol. J., https://doi.org/10.1111/pbi.12766.
- Farrokhi, N., Burton, R. A., Brownfield, L., Hrmova, M., Wilson, S. M., Bacic, A. and Fincher, G. B. (2006) Plant cell wall biosynthesis: genetic, biochemical and functional genomics approaches to the identification of key genes. Plant Biotechnol. J. 4, 145-167.
- Ferreira, P. C., Hemerly, A. S., Engler, J. D., van Montagu. M., Engler, G. and Inze, (1994) Developmental expression of the Arabidopsis cyclin gene cycl At. Plant Cell, 6, 1763-1774.
- Fujita, M., Himmelspach, R., Ward, J., Whittington, A., Hasenbein, N., Liu. C., Truong, T. T. et al. (2013) The anisotropyl D604N mutation in the Arabidopsis cellulose synthase1 catalytic domain reduces cell wall crystallinity and the velocity of cellulose synthase complexes. Plant Physiol. 162, 74-85.
- Gendreau, E., Trans, J., Desnos, T., Grandjean, O., Caboche, M. and Hofte, H. (1997) Cellular basis of hypocotyl growth in Arabidopsis thaliana. Plant Physiol. 114, 295-305.
- Griffiths, J. S., Tsai, A. Y. L., Xuc, H., Voinicine, C., Sola, K., Seifert, G. J., Mansfield, S. D. et al. (2014) SALT-OVERLY SENSITIVE5 mediates Arabidopsis seed coat mucilage adherence and organization through pectins. Plant Physiol. 165, 991-1004.
- Gu, F. W., Bringmann, M., Combs, J. R. Yang, J., Bergmann, D. C. and Nielsen, (2016) Arabidopsis CSLD5 functions in cell plate formation in a cell cycle-dependent manner. Plane Cell, 28, 1722-1737.
- Gutierrez, R., Lindeboom, J. J., Paredez, A. R., Emons, A. M. C. and Ehrhardt, D. W. (2009) Arabidopsis cortical microtubules position cellulose synthase delivery to the plasma membrane and interact with cellulose synthase trafficking compartments. Nat. Cell Biol. 11, 797-806.
- Haigler, C. H., Brown, R. M. Jr and Benziman, M. (1980) Calaoflror white ST alters the in vivo assembly of cellulose microfibrils. Science. 210, 903-906. Harholt, J., Suttangkakul. A. and Scheller, H. V. (2010) Biosynthesis of Pectin. Plant Pkvsiol. 153, 384-395.
- He, C., Ma, J. and Wang, L. (2015) A hemicellulose-bound form of silicon with potential to improve the mechanical properties and regeneration of the cell wall of rice. New Phytol. 206, 1051-1062.
- Hematy, K., Sado, P. E., Van Tuinen, A., Rochange, S., Desnos, T., Balzergue, S., Pelletier. S. et al. (2007) A receptor-like kinase mediates the response of Arabidopsis cells to the inhibition of cellulose synthesis. Curr Biol. 17, 922-931.
- Hunter, C. T., Kirienko, D. H., Sylvester, A. W., Peter, G. F., McCarty, D. R. and Koch, K. E. (2012) Cellulose synthase-like D1 is integral to normal cell division, expansion, and leaf development in maize. Plant Physiol. 158, 708-724.
- Ivakov. A., Flis, A., Apelt, F., Finfgeld, M., Scherer, U., Stitt, M., Kragier, F. et al. (2017) Cellulose synthesis and cell expansion are regulated by different mechanisms in growing Arabidopsis hypocotyls. Plant Cell, 29, 1305-1315. Jin, W. X., Chen. L., Hu, M., Sun, D., Li, A., Li, Y., Hu, Z. et al. (2016) Tween-80 is effective for enhancing steam-exploded biomass enzymatic saccharification and ethanol production by specifically lessening cellulase absorption with lignin in common reed. Appl. Energ. 175, 82-90.
- Joshi, C. P., Thamannagowda, S., Fujino, T., Gou, J. Q., Avci, U., Haigler, C. H., McDonnell, L. M., et al. (2011) Perturbation of wood cellulose synthesis causes pleiotropic effects in transgenic Aapen. Mol. Plant, 4, 331-345.
- Keegstra, K. (2010) Plant cell walls. Plant Physiol. 154, 483-486.
- Landrein, B. and Hamant, O. (2013) How mechanical stress controls microtubule behavior and morphogenesis in plants: history, experiments and revisited theories. Plant J. 75, 324-338.
- Le Gall, H., Philippe, F., Domon, J. M., Gillet, F., Pelloux, J. and Rayon. C. (2015) Cell wall metabolism in response to abiotic stress. Plants, 4, 12-166.
- Li, F., Xie, G., Huang, J., Zhang, R., Li, Y., Zhang, M., Wang, Y. et al. (2017) OsCESA9 conserved-site mutation leads to largely enhanced plant lodging resistance and biomass enzymatic saccharification by reducing cellulose DP and crystallinity in rice. Plant Biotechnol. J., 15, 1093-1104.
- Liu, Z., Schneider, R., Kesten, C., Zhang, Y., Somssich, M., Fernie, A. R. and Persson, S. (2016) Cellulose-microtubule uncoupling proteins prevent lateral displacement of microtubules during cellulose synthesis in Arabidopsis. Dev. Cell, 38, 305-315.
- Malinovsky, F. G., Fangel. J. U. and Willats, W. G. T. (2014) The role of the cell wall in plant immunity. Front. Plant Sci. 5, 178.
- McFarlane, H. E., Doring, A. and Persson, S. (2014) The cell biology of cellulose synthesis. Annu. Rev. Plant Biol. 65, 69-94.
- Mende, V., Griffiths, J. S., Persson, S., Stork, J., Downie A. B., Voiniciuc, C., Haughn, G. W. et al. (2011) Subfunctionalization of cellulose synthases in seed coat epidermal cells mediates secondary radial wall synthesis and mucilage attachment. Plant Physiol. 157, 441-453.
- Miart, F., Desprez, T., Biot, F., Morin, H., Belcram, K., Hofte, H., Gonneau. M. et al. (2014) Spatio-tetnporal analysis of cellulose synthesis during cell plate formation in Arabidopsis. Plant J. 77, 71-84.
- Mortazavi, A., Williams, B. A., Mccue, K., Schaeffer. L. and Wold, B. (2008) Mapping and quantifying mammalian transcriptones by RNA-Seq. Nat. Methods. 5, 621-628.
- Naseer, S., Lee, Y., Lapierre, C., Franke, R., Nawrath, C. and Geldner, N. (2012) Casparian strip diffusion barrier in Arabidopsis is made of a lignin polymer without suberin. Proc. Natl Acad. Sci. USA, 109, 10101-10106.
- Paredez, A. R., Somerville, C. R. and Ehrhardt, D. W. (2006) Visualization of cellulose synthase demonstrates functional association with microtubules. Science, 312, 1491-1495.
- Pear, J. R., Kawagoe, Y., Schreckengost, W. E., Delmer, D. P. and Stalker, D. M. (1996) Higher plants contain homologs of the bacterial celA genes encoding the catalytic subunit of cellulose synthase. Proc. Natl Acad. Sci. USA. 93, 12637-12642.
- Peng, L., Kawagoe, Y., Hogan, P. and Delmer, D. (2002) Sitosterol-beta-glucoside as primer for cellulose synthesis in plants. Science, 295, 147-150.
- Persson, S., Paredez, A., Carroll. A., Palsdottir. H., Doblin, M., Poindexter, P., Khitrov, N. et al. (2007) Genetic evidence for three unique components in primary cell-wall cellulose synthase complexes in Arabidopsis. Proc. Nati Acad. Sci. USA, 104, 15566-15571.
- Sanchez-Rodriguez, C., Ketelaar, K., Schneider, R., Villalobos, J. A., Somerville, C. R., Persson. S. and Wallace, I. S. (2017) BRASSINOSTEROID INSENSITIVE2 negatively regulates cellulose synthesis in Arabidopsis by phosphorylating cellulose synthase 1. Proc. Natl Acad. Sci. USA, 114, 3533-3538.
- Scheible, W. R., Eshed, R., Richmond, T., Delmer, D. and Somerville, C. (2001) Modifications of cellulose synthase confer resistance to isoxaben and thiazolichnone herbicides in Arabidopsis Ixrl mutants. Proc. Natl Acad. Sci. USA, 98, 10079-10084.
- Scheller, H. V. and Ulvskov, P. (201.0) Hemicelluloses. Annu. Rev. Plant Biol. 61, 263-289.
- Schneider. R., Hanak, T., Persson. S. and Voigt, C. A. (2016) Cellulose and callose synthesis and organization in focus, what's new? Curr. Opin. Plant Biol. 34, 9-16. Schuetz, M., Smith, R. and Ellis, B. (2013) Xylem tissue specification, patterning, and differentiation mechanisms. J. Exp. Bot. 64, 11-31.
- Somerville. C. (2006) Cellulose synthesis in higher plants. Annu. Rev. Cell Dev. Biol. 22, 53-78.
- Somerville, C., Bauer, S., Brininstool. G., Facette, M., Hamann, T., Milne, J., Osborne, E. et al. (2004) Toward a systems approach to understanding plant-cell walls. Science, 306, 2206-2211.
- Sullivan, S., Ralet, M. C., Berger, A., Diatloff, E., Bischoff, V., Gonneau, M.,
- Marion-Poll, A. et al. (2011) CESA5 is required for the synthesis of cellulose with a role in structuring the adherent mucilage of Arabidopsis seeds. Pleat Physiol. 156, 1725-1739.
- Sun, D., Alam, A., Tu, Y., Zhou, S., Wang, Y., Xia, T., Huang, J. et al. (20 17) Steam-exploded biomass saccharification is predominately ected ba lignocellulose porosity and largely enhanced by Tween-80 in Miscanthus. Bioresour. Technol. 239, 74-81.
- Szymanski., D. B. and Cosgrove, D. J. (2009) Dynamic coordination of cytoskeletal and cell wall systems during plant cell morphogenesis. Curr. Biol. 19, 800-811.
- Tan, H., Shirley, N. J., R. R., Henderson, M., Dhugga, K. S., Mayo, G. M., Fincher, G. B. et al. (2015) Powerful regulatory systems and post-transcriptional gene silencing resist increases in cellulose content in cell walls of barley. BMC Plant Biol. 15, 62.
- Taylor, N. G., Howells, R. M., Huttly, A. K., Vickers, K. and Turner, S. R. (2003) Interactions among three distinct CesA proteins essential for cellulose synthesis. Proc. Natl Acad. Sci. USA, 100, 1450-4455.
- Ubeda-Tomas, S., Federici, F., Casimiro, I., Beemster, G. T., Bhalerao, R., Swarup, R., Doerner, P. et al, (2009) Gibberellin signaling in the endodermis controls Arabidopsis root meristem size. Curr. Biol. 19, 1194-1199.
- Wang, T., McFarlane, H. E. and Persson, S. (2016a) The impact of abiotic factors on cellulose synthesis. J. Exp. Bot. 67, 543-552.
- Wang. Y., Fan. C., Hu, H., Li, Y., Sun. D. and Peng, L. (2016b) Genetic modification of plant cell walls to enhance biomass yield and hiofuel production in bioenergy crops. Biotechnol. Adv. 34, 997-1017.
- Xu, N., Zhang, W., Ken, S. F., Liu, F., Zhao, C. Q., Liao, H. F., Xu, Z. L. et al. (2012)
- Hemicelluloses negatively affect lignocellulose crystallinity for MO biomass digestibility under NaOH and H2SO4 pretreatments in Miscanthus. Biotechnol. Biofuels. 5, 58.
- Yoshikawa, T., Eiguchi, M., Hibara, K., Ito, J. and Nagato, Y. (2013) Rice slender leaf 1 gene encodes cellulose synthase-like D4 and is specifically expressed in M-phase cells to regulate cell proliferation. J. Exp. Bot. 64, 2049-2061.
- Zhang, X., Henriques, R., Lin, S., Niu, Q. and Chua. N. H. (2006) Agrobacterium-mediated transformation of Arabidopsis thaliana using the floral dip method, Nat. Protec. 1, 641-646.
- Zhang, L., Bai, M., Wu, J., Zhu, J., Wang, H., Zhang, Z., Wang, W. et al (2009) Antagonistic HLH/bHLH transcription factors mediate brassinosteroid regulation of cell elongation and plant development in rice and Arabidopsis, Plant Cell, 21, 3767.
All patents and publications referenced or mentioned herein are indicative of the levels of skill of those skilled in the art to which the invention pertains, and each such referenced patent or publication is hereby specifically incorporated by reference to the same extent as if it had been orporated by reference in its entirety individually or set forth herein in its entirety. Applicants reserve the right to physically incorporate into this specification any and all materials and information from any such cited patents or publications.
The following statements are intended to describe and summarize various embodiments of the invention according to the foregoing description in the specification.
Statements:
-
- 1. A transgenic plant, plant seed, or plant cell comprising an expression cassette comprising a promoter operably linked to a nucleic acid segment encoding a CesA protein with at least 70% sequence identity to any of SEQ ID NO:1, 3 5, 7, 8, 9, 10, 11, 12, 13, 14, 15, or 16.
- 2. The transgenic plant, plant seed, or plant cell of statement 1, wherein the nucleic acid segment can selectively hybridize to a DNA with a SEQ ID NO:2, 4, or 6 sequence.
- 3. The transgenic plant, plant seed, or plant cell of statement 1 or 2, wherein the nucleic acid segment can selectively hybridize to a DNA with a SEQ ID NO:2, 4, or 6 sequence under stringent hybridization conditions.
- 4. The transgenic plant, plant seed, or plant cell of statement 1, 2, or 3, wherein the nucleic acid segment can selectively hybridize to a DNA with a SEQ NO:2, 4, or 6 sequence under stringent hybridization conditions comprising a wash in 0.1×SSC, 0.1% SDS at 65° C.
- 5. The transgenic plant, plant seed, or plant cell of statement 1-3 or 4, wherein the CesA protein is not a CesA3, CesA9, or CesA7 protein.
- 6. The transgenic plant, plant seed, or plant cell of statement 1-4 or 5, wherein the CesA protein is a CesA2, CesA5, or CesA6 protein.
- 7. The transgenic plant, plant seed, or plant cell of statement 1-5 or 6, wherein the CesA protein enhances seedling growth.
- 8. The transgenic plant, plant seed, or plant cell of statement 1-6 or 7, wherein the transgenic plant is at least about 1%, or about 2%, or about 3 or about 4%, or about 5%, or about 6%, or about 7%, or about 8%, or about 9%, or about 10% taller than a control plant without the expression cassette (e.g., a wild type or parental plant without the expression cassette).
- 9. The transgenic plant, plant seed, or plant cell of statement 1-7 or 8, wherein the transgenic plant or the transgenic plant cell has increased CesA1 and CesA3 expression compared to CesA1 and CesA3 expression a control plant without the expression cassette (e.g., a wild type or parental plant without the expression cassette).
- 10. The transgenic plant, plant seed, or plant cell of statement 1-8 or 9, wherein the transgenic plant or the transgenic plant cell has at least 2-fold, at least 3-fold, at least 4-fold, at least 5-fold greater CesA1 expression compared to CesA1 expression a control plant without the expression cassette (e.g., a wild type or parental plant without the expression cassette),
- 11. The transgenic plant, plant seed, or plant cell of statement 1-9 or 10, wherein the transgenic plant or the transgenic plant cell has at least about 1%, or about 2%, or about 3%, or about 4%, or about 5%, or about 6%, or about 7%, or about 8%, or about 9%, or about 10%, or about 12%, or about 13%, or about 14%, or about 15% greater CesA3 expression compared to CesA3 expression a control plant without the expression cassette (e.g., a wild type or parental plant without the expression cassette).
- 12. The transgenic plant, plant seed, or plant cell of statement 1-10 or 11, wherein the transgenic plant has CesA3 particles that move faster than CesA3 panicle in a control plant without the expression cassette (e.g., a wild type or parental plant without the expression cassette).
- 13. The transgenic plant, plant seed, or plant cell of statement 1-11 or 12, wherein the transgenic plant has CesA3 particles that move at speeds at least 50 nm/min, or at least 100 mm/min, or at least 150 nm/min, or at least 200 nm/min, or at least 250 nm/min, or at least 275 nm/min, or at least 300 nm/min faster than CesA3 particle in a control plant without the expression cassette (e.g., a wild type or parental plant without the expression cassette).
- 14. The transgenic plant, plant seed, or plant cell of statement 1-12 or 13, wherein the transgenic plant has increased cellulose synthesis than cellulose synthesis in a control plant without the expression cassette (e.g., a wild type or parental plant without the expression cassette).
- 15. The transgenic plant, plant seed, or plant cell of statement 1-13 or 14, wherein the transgenic plant has at least 2%, or at least 3%, or at least 4%, or at least 5%, or at least 6%, or at least 7%, or at least 8%, or at least 9%, or at least 10%, or at least 11% more cellulose compared to cellulose content in a control plant without the expression cassette (e.g., a wild type or parental plant without the expression cassette).
- 16. The transgenic plant, plant seed, or plant cell of statement 1-14 or 15, wherein the transgenic plant has hypocotyl basal epidermal cells that are at least 5%, or at least 8%, or at least 9%, or at least 10%, or at least 11%, or at least 12%, or at least 13%, or at least 15%, or at least 17%, or at least 18%, or at least 20%, or at least 21%, or at least 22%, or at least 23%, or at least 25%, or at least 27%, or at least 28%, or at least 30%, or at least 31%, or at least 32%, or at least 33%, or at least 35%, or at least 37%, or at least 40% longer than hypocotyl basal epidermal cells in a control plant without the expression cassette (e.g., a wild type or parental plant without the expression cassette).
- 17. The transgenic plant, plant seed, or plant cell of statement 1-15 or 16, wherein the transgenic plant has at least 5%, or at least 8%, or at least 9%, or at least 10%, or at least 11%, or at least 12%, or at least 13%, or at least 15%, or at least 17%, or at least 18%, or at least 20%, or at least 21%, or at least 22%, or at least 23%, or at least 25%, or at least 27%, or at least 28%, or at least 30%, or at least 31%, or at least 32%, or at least 33%, or at least 35%, or at least 37%, or at least 40% more or longer root tip (apical meristem) cells than in a control plant without the expression cassette (e.g., a wild type or parental plant without the expression cassette).
- 18. The transgenic plant, plant seed, or plant cell of statement 1-16 or 17, wherein the transgenic plant has at least 5%, or at least 10%, or at least 12%, or at least 15%, or at least 20%, or at least 22%, or at least 23%, or at least 25%, or at least 27%, or at least 28%, or at least 29%, or at least 30%, or at least 31%, or at least 32%, or at least 254% or at least 27%, or at least 28%, or at least 30%, or at least 31%, or at least 32%, or at least 33%, or at least 34%, or at least 35%, or at least 36%, or at least 37%, or at least 38%, or at least 39%, or at least 40% more crystalline cellulose than in a control plant without the expression cassette (e.g., a wild type or parental plant without the expression cassette).
- 19. The transgenic plant, plant seed, or plant cell of statement 1-17 or 18, wherein the transgenic plant has at least 1.5-fold, at least 1.7-fold, at least 2-fold, at least 2.2-fold, least 2.5-fold, least 2.7-fold, at least 3-fold wider secondary cell wall than in a control plant without the expression cassette (e.g., a wild type or parental plant without the expression cassette).
- 20. The transgenic plant, plant seed, or plant cell of statement 1-18 or 19, wherein the plant is a monocot or a dicot.
- 21. The transgenic plant, plant seed, or plant cell of statement 1-19 or 20, wherein the plant, plant seed, or plant cell is an agricultural plant.
- 22. The transgenic plant, plant seed, or plant cell of statement 1-20 or 21, wherein the plant, plant seed, or plant cell is a fiber-producing plant (cotton, flax, hemp, jute, sisal, poplar, eucalyptus), forage plant (alfalfa, clover and fescue), grain (maize, wheat, barley, oats, rice, sorghum, millet and rye), grass (switchgrass, prairie grass, wheat grass, sudangrass, sorghum, straw-producing plants), softwood, or hardwood (e.g., those used for paper production such as poplar species, pine species, and eucalyptus) plant, plant seed, or plant cell.
- 23. The transgenic plant, plant seed, or plant cell of statement 1-21 or 22, wherein the plant, plant seed, or plant cell is a cotton, flax, hemp, jute, sisal, poplar, or eucalyptus plant, plant seed, or plant cell.
- 24. An expression cassette comprising a promoter operably linked to a nucleic acid segment encoding a CesA protein with at least 70% sequence identity to any of SEQ ID NO:1, 3, 5, 7, 8, 9, 10, 11, 12, 13, 14, 15, or 16.
- 25. The expression cassette of statement 24, wherein the nucleic acid segment can selectively hybridize to a DNA with a SEQ ID NO:2, 4, or 6 sequence.
- 26. The expression cassette of statement 24 or 25, wherein the nucleic acid segment can selectively hybridize to a DNA with a SEQ ID NO:2, 4, or 6 sequence under stringent hybridization conditions.
- 27. The expression cassette of statement 24, 25, or 26, wherein the nucleic acid segment can selectively hybridize to a DNA with a SEQ ID NO:2, 4, or 6 sequence under stringent hybridization conditions comprising a wash in 0.1×SSC, 0.1% SDS at 65° C.
- 28. The expression cassette of statement 24-26 or 27, wherein the CesA protein is not a CesA3, CesA9, or CesA7 protein.
- 29. The expression cassette of statement 24-27 or 28, wherein the CesA protein is a CesA2, CesA5, or CesA6 protein.
- 30. A method comprising transforming a plant cell with the expression cassette of statement 24-28 or 29 to generate a transgenic pant cell and generating a transgenic plant therefrom.
- 31. The method of statement 30, which does not comprise transforming a plant cell with the expression cassette that comprises a promoter operably linked to a nucleic acid segment encoding a CesA3, CesA9, or CesA7 protein.
- 32. The method of statement 30 or 31, wherein the plant cell and the plant are each a monocot or a dicot.
- 33. The method of statement 30, 31 or 32, wherein the plant and the plant cell are each an agricultural plant.
- 34. The method of statement 30-32, or 33, wherein the plant and the plant cell are each a fiber-producing plant (cotton, flax, hemp, jute, sisal, poplar, or eucalyptus), forage plant (alfalfa, clover and fescue), grain (maize, wheat, barley, oats, rice, sorghum, millet and rye), grass (switchgrass, prairie grass, wheat grass, sudangrass, sorghum, straw-producing plants), softwood, or hardwood (e.g., those used for paper production such as poplar species, pine species, and eucalyptus) plant, plant seed, or plant cell.
- 35. The method of statement 30-33 or 34, wherein the plant and the plant cell are each a cotton, flax, hemp, jute, sisal, poplar, or eucalyptus plant, plant seed, or plant cell.
- 36. The method of statement 30-34 or 35, wherein the transgenic plant is at least about 1%, or about 2%, or about 3%, or about 4%, or about 5%, or about 6%, or about 7 or about 8%, or about 9%, or about 10% taller than a control plant without the expression cassette (e.g., a wild type or parental plant without the expression cassette).
- 37. The method of statement 30-35 or 36, wherein the transgenic plant or the transgenic plant cell has increased CesA1 and CesA3 expression compared to CesA1 and CesA3 expression a control plant without the expression cassette (e.g., a wild type or parental plant without the expression cassette).
- 38. The method of statement 30-36 or 37, wherein the transgenic plant or the transgenic plant cell has at least 2-fold, at least 3-fold, at least 4-fold, at least 5-fold greater CesA1 expression compared to CesA1 expression a control plant without the expression cassette (e.g., a wild type or parental plant without the expression cassette).
- 39. The method of statement 30-37 or 38, wherein the transgenic plant or the transgenic plant cell has at least about 1%, or about 2%, or about 3%, or about 4%, or about 5%, or about 6%, or about 7%, or about 8%, or about 9%, or about 10%, or about 12%, or about 13%, or about 14%, or about 15% greater CesA3 expression compared to CesA3 expression a control plant without the expression cassette (e.g., a wild type or parental plant without the expression cassette).
- 40. The method of statement 30-38 or wherein the transgenic plant has CesA3 particles that move faster than CesA3 particle in a control plant without the expression cassette (e.g., a wild type or parental plant without the expression cassette).
- 41. The method of statement 30-39 or 40, wherein the transgenic plant has CesA3 particles that move at speeds at least 50 nm/min, or at least 100 nm/min, or at least 150 nm/min, or at least 200 nm/min, or at least 250 nm/min, or at least 275 nm/min, or at least 300 nm/min faster than CesA3 particle in a control plant without the expression cassette (e.g., a wild type or parental plant without the expression cassette).
- 42. The method of statement 30-40 or 41, wherein the transgenic plant has increased cellulose synthesis than cellulose synthesis in a control plant without the expression cassette (e.g., a wild type or parental plant without the expression cassette).
- 43. The method of statement 30-41 or 42, wherein the transgenic plant has at least 2%, or at least 3%, or at least 4%, or at least 5%, or at least 6%, or at least 7%, or at least 8%, or at least 9%, or at least 10%, or at least 11% increased cellulose synthesis than cellulose synthesis in a control plant without the expression cassette (e.g., a wild type or parental plant without the expression cassette).
- 44. The method of statement 30-42 or 43, wherein the transgenic plant has hypocotyl nasal epidermal cells that are at least 5%, or at least 8%, or at least 9%, or at least 10%, or at least 11%, or at least 12%, or at least 13%, or at least 15%, or at least 17%, or at least 18%, or at least 20%, or at least 21% or at least 22%, or at least 23%, or at least 25%, or at least 27%, or at least 28%, or at least 30%, or at least 31%, or at least 32%, or at least 33%, or at least 35%, or at least 37%, or at least 40% longer than hypocotyl basal epidermal cells in a control plant without the expression cassette (e.g., a wild type or parental plant without the expression cassette).
- 45. The method of statement 30-43 or 44, wherein the transgenic plant has at east 5%, or at least 8%, or at least 9%, or at least 10%, or at least 11%, or at least 12%, or at least 13%, or at least 15%, or at least 17%, or at least 18%, or at least 20%, or at least 21%, or at least 22%, or at least 23%, or at least 25%, or at least 27%, or at least 28%, or at least 30%, or at least 31%, or at least 32%, or at least 33%, or at least 35%, or at least 37%, or at least 40% more root tip (apical meristem) cells than in a control plant without the expression cassette (e.g., a wild type or parental plant without the expression cassette).
- 46. The method of statement 30-44 or 45, wherein the transgenic plant has at least 5%, or at least 10%, or at least 12%, or at least 15%, or at least 20%, or at least 22%, or at least 23%, or at least 25%, or at least 27%, or at least 28%, or at least 29%, or at least 30%, or at least 31%, or at least 32%, or at least 25%, or at least 27%, or at least 28%, or at least 30%, or at least 31%, or at least 32%, or at least 33%, or at least 34%, or at least 35%, or at least 36%, or at least 37%, or at least 38%, or at least 39%, or at least 40% more crystalline cellulose than in a control plant without the expression cassette (e.g., a wild type or parental plant without the expression cassette).
- 47. The method of statement 30-45 or 46, wherein the transgenic plant has at least 1.5-fold, at least 1.7-fold, at least 2-fold, at least 2.2-fold, least 2.5-fold, least 2.7-fold, at least 3-fold wider secondary cell wall than in a control plant without the expression cassette (e.g., wild type or parental plant without the expression cassette).
- 48. The method of statement 30-46 or 47, wherein primary wall CesA complex (cellulose synthase complex, CSC) movement is accelerated in the transgenic plant relative to primary wall CesA complex (cellulose synthase complex, CSC) movement in a control plant without the expression cassette (e.g., a wild type or parental plant without the expression cassette).
- 49. The method of statement 30-47 or 48, wherein average primary wall CesA complex (cellulose synthase complex, CSC) movement is accelerated in the transgenic plant by at least 2%, or at least 3%, or at least 4%, or at least 5%, or at least 6%, or at least 7%, or at least 8%, or at least 9%, or at least 10%, or at least 11%, or at least 12%, or at least 13%, or at least 14%, or at least 15% relative to average primary wall CesA complex (cellulose synthase complex, CSC) movement in a control plant without the expression cassette (e.g., a wild type or parental plant without the expression cassette).
- 50. The method of statement 30-48 or 49, wherein the transgenic plant has an increased mean fiber length in the transgenic plant hypocotyl, root, stem, cotton boll, or a combination thereof, relative to mean fiber length of hypocotyls, roots, stems, or cotton bolls, respectively, in a control plant without the expression cassette (e.g., a wild type or parental plant without the expression cassette).
- 51. The method of statement 30-49 or 50, wherein the transgenic plant has a mean fiber length in the transgenic plant hypocotyl fibers, root fibers, stem fibers, or cotton (boll) fibers, that is at least 2%, or at least 3%, or at least 4%, or at least 5%, or at least 6%, or at least 7%, or at least 8%, or at least 9%, or at least 10%, or at least 11%, or at least 12%, or at least 13%, or at least 14%, or at least 15%, or at least 16%, or at least 17%, or at least 18%, or at least 19%, or at least 20%, or at least 21%, or at least 22%, or at least 23%, or at least 24%, or at least 25% longer than mean fiber length of fibers in hypocotyls, roots, stems, or cotton (boll), respectively, in a control plant without the expression cassette (e.g., a wild type or parental plant without the expression cassette).
- 52. The method of statement 30-50 or 51, further comprising harvesting biomass or fiber from the transgenic plant.
- 53. The method of statement 30-51 or 52, further comprising harvesting cotton from the transgenic plant.
The specific products, consortia, methods and compositions described herein are representative of preferred embodiments and are exemplary and not intended as limitations on the scope of the invention. Other objects, aspects, and embodiments will occur to those skilled in the art upon consideration of this specification and are encompassed within the spirit of the invention as defined by the scope of the claims. It will be readily apparent to one skilled in the art that varying substitutions and modifications may be made to the invention disclosed herein without departing from the scope and spirit of the invention. The invention illustratively described herein suitably may be practiced in the absence of any element or elements, or limitation or limitations, which is not specifically disclosed herein as essential.
The specific plants, seeds, cells, expression cassettes, products, methods and compositions illustratively described herein suitably may be practiced in differing orders of steps, and the methods and processes are not necessarily restricted to the orders of steps indicated herein or in the claims. As used herein and in the appended claims, the singular forms “a,” “an,” and “the” include plural reference unless the context clearly dictates otherwise. Thus, for example, a reference to “a plant,” “a microbe,” “a compound,” “a nucleic acid” or “a promoter” includes a plurality of such microbes, compounds, nucleic acids or promoters (for example, a solution of plants, microbes, compounds or nucleic acids, or a series of promoters), and so forth.
Under no circumstances may the patent be interpreted to be limited to the specific examples or embodiments or methods specifically disclosed herein. Under no circumstances may the patent be interpreted to be limited by any statement made by any Examiner or any other official or employee of the Patent and Trademark Office unless such statement is specifically and without qualification or reservation expressly adopted in a responsive writing by Applicants.
The terms and expressions that have been employed are used as terms of description and not of and there is no intent in the use of such terms and expressions to exclude any equivalent of the features shown and described or portions thereof, but it is recognized that various modifications are possible within the scope of the invention as claimed. Thus, it will understood that although the present invention has been specifically disclosed by preferred embodiments and optional features, modification and variation of the concepts herein disclosed may be resorted to by those skilled in the art, and that such modifications and variations are considered to be within the scope of this invention as defined by the appended claims and statements of the invention.