US12061532B2 - Interface for visualizing and improving model performance - Google Patents
Interface for visualizing and improving model performance Download PDFInfo
- Publication number
- US12061532B2 US12061532B2 US16/230,613 US201816230613A US12061532B2 US 12061532 B2 US12061532 B2 US 12061532B2 US 201816230613 A US201816230613 A US 201816230613A US 12061532 B2 US12061532 B2 US 12061532B2
- Authority
- US
- United States
- Prior art keywords
- model
- performance
- cost
- characterizing
- data
- Prior art date
- Legal status (The legal status is an assumption and is not a legal conclusion. Google has not performed a legal analysis and makes no representation as to the accuracy of the status listed.)
- Active, expires
Links
Images


Classifications
-
- G—PHYSICS
- G06—COMPUTING OR CALCULATING; COUNTING
- G06F—ELECTRIC DIGITAL DATA PROCESSING
- G06F11/00—Error detection; Error correction; Monitoring
- G06F11/30—Monitoring
- G06F11/34—Recording or statistical evaluation of computer activity, e.g. of down time, of input/output operation ; Recording or statistical evaluation of user activity, e.g. usability assessment
- G06F11/3447—Performance evaluation by modeling
-
- G—PHYSICS
- G06—COMPUTING OR CALCULATING; COUNTING
- G06F—ELECTRIC DIGITAL DATA PROCESSING
- G06F16/00—Information retrieval; Database structures therefor; File system structures therefor
- G06F16/90—Details of database functions independent of the retrieved data types
- G06F16/901—Indexing; Data structures therefor; Storage structures
- G06F16/9024—Graphs; Linked lists
-
- G—PHYSICS
- G06—COMPUTING OR CALCULATING; COUNTING
- G06N—COMPUTING ARRANGEMENTS BASED ON SPECIFIC COMPUTATIONAL MODELS
- G06N20/00—Machine learning
-
- G—PHYSICS
- G06—COMPUTING OR CALCULATING; COUNTING
- G06N—COMPUTING ARRANGEMENTS BASED ON SPECIFIC COMPUTATIONAL MODELS
- G06N3/00—Computing arrangements based on biological models
- G06N3/02—Neural networks
- G06N3/08—Learning methods
-
- G—PHYSICS
- G06—COMPUTING OR CALCULATING; COUNTING
- G06N—COMPUTING ARRANGEMENTS BASED ON SPECIFIC COMPUTATIONAL MODELS
- G06N3/00—Computing arrangements based on biological models
- G06N3/02—Neural networks
- G06N3/08—Learning methods
- G06N3/09—Supervised learning
-
- G—PHYSICS
- G06—COMPUTING OR CALCULATING; COUNTING
- G06N—COMPUTING ARRANGEMENTS BASED ON SPECIFIC COMPUTATIONAL MODELS
- G06N7/00—Computing arrangements based on specific mathematical models
- G06N7/01—Probabilistic graphical models, e.g. probabilistic networks
-
- G06T11/206—
-
- G—PHYSICS
- G06—COMPUTING OR CALCULATING; COUNTING
- G06T—IMAGE DATA PROCESSING OR GENERATION, IN GENERAL
- G06T11/00—Two-dimensional [2D] image generation
- G06T11/20—Drawing from basic elements
- G06T11/26—Drawing of charts or graphs
-
- G—PHYSICS
- G06—COMPUTING OR CALCULATING; COUNTING
- G06T—IMAGE DATA PROCESSING OR GENERATION, IN GENERAL
- G06T2200/00—Indexing scheme for image data processing or generation, in general
- G06T2200/24—Indexing scheme for image data processing or generation, in general involving graphical user interfaces [GUIs]
Definitions
- the subject matter described herein relates to an interface for visualizing and improving model performance.
- accuracy may not be a reliable metric for characterizing performance of a predictive algorithm. This is because accuracy can yield misleading results, particularly to a non-expert business user and particularly where the data set is unbalanced or cost of error of false negatives and false positives is mismatched.
- An unbalanced dataset can be one in which the numbers of observations in different classes vary. For example, if there were 95 cats and only 5 dogs in the data, a particular classifier might classify all the observations as cats. The overall accuracy would be 95%, but the classifier would have a 100% recognition rate (e.g., true positive rate, sensitivity) for the cat class but a 0% recognition rate for the dog class.
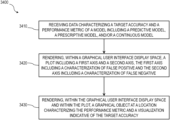
- a method includes receiving, via a graphical user interface, data characterizing user input specifying a cost of error of a prediction, a model type requirement, and a computational resource allocation for model development; determining, based on the received data and using a model, a prediction of model performance; and rendering, within the graphical user interface, a plot including a first axis, a second axis, and a region characterizing the determined prediction of model performance, the first axis including a characterization of a first performance metric and the second axis including a characterization of a second performance metric.
- the model can be trained with training data obtained from observations of users utilizing a model development platform.
- the training data can include metadata of historical training data, historical selected model requirements, historical computational resource allocations, and/or historical resultant model performance.
- the metadata of historical training data can include a number of rows of the historical training data, a number of columns of the historical training data, a number of observed values for each variable in the historical training data, a standard deviation of values of the historical training data, and/or a metric of data skew of the historical training data.
- the method can include determining a balance metric characterizing a relative proportion of observed classes within a dataset; and rendering, within the graphical user interface, a line or region indicative of a target accuracy based on the determined balance metric.
- the method can include receiving user input characterizing a relative cost of false negative and relative cost of false positive; and rendering a line indicative of constant cost weighted according to the received user input characterizing the relative cost of false negative and relative cost of false positive.
- the method can include receiving user input characterizing a target accuracy; determining a probability of developing a model according to the target accuracy, the model type requirement, and the computational resource allocation; and rendering, within the graphical user interface, a visualization characterizing the probability.
- the method can include determining, by a model generator, a candidate model based on the received data characterizing the user input and a dataset; determining a performance for each of a plurality of subgroups of the candidate model, the determining based on the dataset; and identifying subgroups of the candidate model that underperform relative to the plurality of subgroups of the candidate model or over perform relative to the plurality of subgroups of the candidate model.
- the method can include rendering, within the graphical user interface, a visualization of relative performance of the identified subgroups; and rendering, within the graphical user interface, a graphical object prompting a user for a course of action including terminating further training of the model, creating a split-model, and/or removing the subgroup from the dataset.
- the method can include rendering a first line indicative of target accuracy, a second line indicative of constant accuracy, and a third line indicative of constant cost; and receiving data characterizing a target accuracy and a performance metric of a candidate model; rendering a region indicative of the target accuracy, the region indicative of the target accuracy bounded by at least: the first line indicative of the target accuracy and an origin of the plot; a second line indicative of constant accuracy and the origin; or a second line indicative of constant accuracy, the third line indicative of constant cost, and the origin; wherein the first performance metric includes rate of false positive, count of false positive, cost of false positive, benefit missed by false positive, true positive, benefit of true positive, benefit of minimizing false positive, benefit of maximizing true positive or a combination thereof; the second performance metric includes rate of false negative, count of false negative, cost of false negative, benefit missed by false negative, true negative, benefit of true negative, benefit of minimizing false negative, benefit of maximizing true negative, or a combination thereof.
- the method can include rendering, within the plot, a plurality
- Non-transitory computer program products i.e., physically embodied computer program products
- store instructions which when executed by one or more data processors of one or more computing systems, causes at least one data processor to perform operations herein.
- computer systems are also described that may include one or more data processors and memory coupled to the one or more data processors. The memory may temporarily or permanently store instructions that cause at least one processor to perform one or more of the operations described herein.
- methods can be implemented by one or more data processors either within a single computing system or distributed among two or more computing systems.
- Such computing systems can be connected and can exchange data and/or commands or other instructions or the like via one or more connections, including but not limited to a connection over a network (e.g. the Internet, a wireless wide area network, a local area network, a wide area network, a wired network, or the like), via a direct connection between one or more of the multiple computing systems, etc.
- a network e.g. the Internet, a wireless wide area network, a local
- FIG. 1 illustrates an exemplary graphical user interface (GUI) display space for determining and/or assessing predictive models
- FIG. 2 is a variation of the example interface shown in FIG. 1 ;
- FIG. 3 is an example interface illustrating visualization of multiple candidate model performance during generation of candidate models
- FIG. 4 illustrates an example of juxtaposing details of multiple candidate model performance relative to one another
- FIG. 5 illustrates the interface providing a recommendation to increase the model finding budget where the system has predicted that the probability of generating a model that meets the requirements is low;
- FIG. 6 illustrates the performance of a model over time
- FIG. 7 is an example illustrating performance of three different models over time
- FIGS. 8 - 9 illustrate an example interface with models filtered by a data characteristic
- FIG. 10 is an example interface illustrating a prompt to a user when a model is generated that achieves the target accuracy
- FIG. 11 illustrates an interface recommending customer information and customer revenue data, and the interface indicates locations that the respective types of data can be typically found;
- FIGS. 12 - 16 illustrate interfaces of an example platform according to an example implementation of the current subject matter
- FIGS. 17 - 20 illustrate additional example interfaces that can enable a user to analyze the data subgroup performance
- FIG. 21 - 24 illustrate additional example interfaces that can visualize outliers and provide a recommendation to take action to improve model performance
- FIGS. 25 - 33 illustrate additional example implementations of plots for visualizing model performance
- FIG. 34 is a process flow diagram illustrating an example process enabling an improved interface that can enable deeper understanding of a model's performance.
- FIG. 35 is a system block diagram illustrating an example implementation according to some aspects of the current subject matter.
- the current subject matter includes an improved user interface for visualizing and assessing models, such as predictive models (e.g., classifiers) and prescriptive models.
- models such as predictive models (e.g., classifiers) and prescriptive models.
- the improved interface can enable deeper understanding of a model's performance, particularly for a non-expert business user.
- the performance of the model can be presented in a manner that conveys a complex performance assessment simply and in an intuitive format.
- the improved interface can enable improved understanding of a predictive model's performance by presenting, in a single visualization, a model's false positive rate; false negative rate; a target accuracy; tradeoff between false positive rate and false negative rate; how biased a model may be as a result of an unbalanced dataset; and cost/benefit analysis.
- the current subject matter is not limited to predictive modeling and can apply to a broad range of learning and predictive techniques.
- the current subject matter can apply to prescriptive algorithms (e.g., making a certain change would change the output by an amount or percent), continuous variable predictions, and the like, and is not limited to classification.
- the current subject matter can apply to models for continuous variables that can include establishing a percentage threshold or numerical threshold above which predictions can be considered to be overestimates or underestimates. For example, if the predicted revenue was more than 25% higher than the actual revenue, then it can be considered an overestimate. A prediction within 25%+ or ⁇ of the actual can be considered accurate, for example, although thresholds can be asymmetrical.
- a target accuracy can be visualized within a rate of false positive versus rate of false negative plot and in a manner that can be indicative of data balance.
- the target accuracy as presented visually can provide an intuitive representation that the data is unbalanced and to what degree. This can provide a user with a deeper understanding of the data without requiring specific domain expertise (e.g., pre-knowledge of the degree of unbalance within the data).
- data can be up sampled or down sampled for model training, and require an adjustment back to expected real world observation rates, or future expected rates.
- the current subject matter can improve data and model understanding even without unbalanced data.
- Traditional measures like precision, recall, log-loss, and the like are complicated and can be difficult to compare multiple models visually against one another, particularly when the models are trained on different datasets or processes.
- Some implementations of the current subject matter include graphing attributes that are comparable across models, and graphing them in a manner such that models can be compared against one another easily and intuitively, even when the models relate to different domains.
- FIG. 1 illustrates an exemplary graphical user interface (GUI) display space for determining and/or assessing predictive models.
- GUI graphical user interface
- the GUI display space in FIG. 1 can include a graphical representation of the assessment of the predictive models.
- the graphical representation can provide the user with various information associated with the assessment of predictive models in an efficient manner.
- the graphical representation can be indicative of predictive model characteristics and/or model requirements provided as an input by the user.
- the graphical representation can include information associated with the selected model types, performance metrics associated with the models, and the like.
- FIG. 2 is a variation of the example interface shown in FIG. 1 .
- the graphical representation can include a plot of performance metrics of the performance models.
- a first axis 105 e.g., x-axis
- a second axis 110 e.g., y-axis
- the axis can be representative of other or additional performance metrics.
- the origin of the plot 115 can be representative of perfect accuracy (e.g., no false positives and no false negatives).
- a performance metric of a performance model can be represented by a graphical object 120 (e.g., a point, an asterisk, and the like, illustrated in FIG. 3 ).
- a shape and/or color the graphical object can indicate a characteristic of the model.
- triangular graphical objects can indicate a model is of low complexity
- a square can indicate a model is of medium complexity
- a circle can indicate a model of high complexity.
- Other shapes and model characteristics are possible.
- the location of the graphical object can be indicative of false positive rate value and false negative rate value associated with the performance of the model.
- a location of the graphical object can be representative of the false positive rate and false negative rate associated with the performance model.
- a location of the graphical object with respect to the x-axis 105 can be representative of false positive rate of the performance model
- location of the graphical object with respect to the y-axis 110 can be representative of false negative rate of the performance model.
- a distance of the graphical object from the origin can be representative of an effective accuracy associated with the performance metric. For example, as the distance from the origin increases, the effective accuracy associated with the performance metric decreases, and vice versa.
- the plot can include a visual representation of predictive model characteristics provided by the user.
- input target accuracy can be represented by a color-coded region (“light green”) 125 on the plot.
- the color-coded region can include the origin of the plot (e.g., representative of perfect accuracy) 115 .
- the shape of the color-coded target region 125 can be determined by an arch tangent to the relative cost curve 135 and/or the accuracy curve 130 , can include a conic section such as hyperbola, parabola, or section of ellipse, and the like.
- the entirety of the target area 125 can be bounded by the target accuracy, target cost curves 135 , and the perfect model point (e.g., origin) 115 .
- the size of the color-coded region 125 can be inversely proportional to the input target accuracy. Presence of the graphical object 120 in the color-coded region 125 can indicate that the performance of the model has an accuracy greater than or equal to the input target accuracy. Additional color coded regions can be added to show accuracy bands representing an accuracy scale or the performance of random selection.
- the interface for visualizing and assessing predictive models can be included in a platform and/or interface enabling improved predictive model generation.
- a target accuracy 145 e.g., false negative and false positive
- model requirements 155 e.g., whether it is human-understandable, auditable, capable of providing real-time results, and doesn't change without approval
- a budget for model development 150 can be specified by a user.
- a prediction as to the probability of developing a predictive model with the requested parameters can be determined and presented to the user.
- the current subject matter can provide a user with an indication of what model performance may be achieved and without having to develop and test a number of candidate models. Further, such an approach can inform a user if a model with the specified requirements is unlikely to be developed or not feasible.
- the GUI display space can include one or more interactive graphical objects through which a user can input predictive model characteristics, model requirements, and the like.
- the predictive model characteristics can include, for example, relative cost of error of the model (e.g., ratio between the cost impact of false positive results and false negative results of the model), target accuracy of the model, model finding budget, and the like.
- the model requirements 155 can include, for example, that the model be human-understandable (e.g., the trained model can be analyzed and understood by a user, a characteristic not possessed by deep learning algorithms, for example).
- the model requirements 155 can include, for example that the model be auditable, a characteristic that can indicate whether the model type is capable of exporting aspects of the model and/or decisions made to a format for review by a regulator or other entity.
- the model requirements 155 can include, for example, that the model provide real-time results, a characteristics that can indicate whether the model requires batch mode processing to perform a prediction.
- the model requirements 155 can include, for example, that the model doesn't change without approval (e.g., is immutable), a characteristics that can indicate whether the model is changing as interactions happen (e.g., when the model is live). Other requirements are possible.
- a user can provide user input by typing input values (e.g., value of target accuracy, model finding budget, and the like), clicking on an interactive object representative of an input value (e.g., icons), dragging a sliding bar (e.g., sliding bar representative of relative cost of error), and the like.
- initial settings can be provided by automated recommendations generated by an artificial intelligence application trained on historical user input.
- the user can initiate a search for model types based on the user input (e.g., by clicking on “Find AI Models” icon).
- model recommendations can be displayed on the GUI display space.
- the model recommendations can be generated by a predictive model generator that can receive user inputs and generate one or more predictive model recommendations based on the input.
- the model recommendations can include, for example, a selected list of model types (e.g., linear regression, logistic regression, K-means, and the like), number of desirable model types, total number of available number types, and the like.
- a first predictive model can be generated for a first model type in the selected list of model types. This can be done, for example, by training a first model associated with the first model type with a first portion of a predetermined training data.
- the first performance model can be evaluated (e.g., in real-time) based on a second portion of the predetermined data.
- One or more performance metrics e.g., false positive rate, false negative rate, and the like
- the plot can further include a second color-coded region indicative of a system estimate of expected outcomes 160 (also referred to as a zone of possibilities).
- a zone of possible models 160 can be determined from a relative cost of error (e.g., false negative and false positive), model requirements (e.g., whether it is human-understandable, auditable, capable of providing real-time results, and doesn't change without approval), and a budget for model development.
- the zone of possible models 160 can estimate or predict likely achievable model performance such as false positive rate, false negative rate (overestimate max, underestimate max).
- the zone of possible models 160 can be determined with a predictive model trained on observations of users utilizing the platform, including characteristics of the data (e.g., metadata relating to the training data), what model requirements are selected, what computational resource budgets are utilized (e.g., resources, servers, computational time, and the like), and the performance of models generated from those user inputs.
- the characteristics of the data can include metadata such as number of rows, columns, number of observed values for each variable (e.g., degrees of freedom), standard deviation, skew, and the like.
- the actual underlying data is not required, rather a metric or determination of data complexity and observations regarding which kinds of algorithms performed well against which kinds of data, how long they took to train, and the like.
- the zone of possible models 160 can be visualized within a rate of false positive versus rate of false negative plot and, similar to the target accuracy and in some implementations, in a manner that can be indicative of data balance. If it is predicted that a model meeting the user input model requirements is possible, the expected outcomes region can be visualized as overlapping with a region indicative of the target accuracy, and can be color coded (e.g., green). If it is predicted that a model meeting the user input model requirements is not possible (or low likelihood), the expected outcomes region can be visualized as not overlapping with the region 125 indicative of the target accuracy, and can be color coded accordingly (e.g., orange).
- the size of the expected outcomes 160 can be indicative of the range of possible accuracies. For example, the larger the size of the expected outcomes region 160 , the larger the range of possible models. Distance of the expected outcomes from the origin of the plot can be inversely proportional to accuracies of predictive models likely to be generated.
- the plot can include an accuracy line 130 indicative of a constant accuracy (e.g., a line characterizing the sum of false negatives and false positives remaining constant).
- a constant accuracy e.g., constant value for sum of false negatives and false positives
- the distance of the expected outcomes from the target accuracy region can graphically express a likelihood of finding the model with a performance that fits the user's performance requirements.
- the plot can include a cost of error line 135 indicative of accuracy as weighted by a relative cost of error.
- a cost of error line 135 can reflect a user input indicating that false negatives are more costly than false positives, or vice versa.
- the cost of error line 135 can reflect a utility or cost function in which the cost of false negatives and the cost of false positives are not equal.
- FIG. 25 is another example implementation of a plot for visualizing model performance.
- Axis A and B can include a characterization of false positive and a characterization of false negative, respectfully.
- P can indicate the perfect model point
- T can indicate the target area
- E can represent the expected outcome range
- R can represent the random model line.
- the characterization of rate of false positive can include rate of false positive, count of false positive, cost of false positive, benefit missed by false positive, true positive, benefit of true positive, benefit of minimizing false positive, projected benefit of true negative over a specified future time period (such as 1 month), or benefit of maximizing true positive.
- the characterization of rate of false negative can include rate of false negative, count of false negative, cost of false negative, benefit missed by false negative, true negative, benefit of true negative, benefit of minimizing false negative, projected benefit of true positive over a specified future time period (such as 1 month), or benefit of maximizing true negative.
- the projected benefit can relate to any cost or benefit metric.
- the lower limit for accuracy, R can indicate a random model, or a trivial model such as always True or always False, or an existing model.
- FIG. 26 illustrates another example implementation of a plot for visualizing model performance.
- FIG. 26 is similar to that shown in FIG. 25 , although the A and B axes are flipped illustrating true positive/true negative, benefit of true positive/true negative, overall benefit of minimizing false positive/false negative, or maximizing true positive/true negative.
- FIG. 27 illustrates another example implementation of a plot for visualizing model performance.
- constant cost C and constant accuracy D curves are illustrated.
- the target T is bounded by both constant cost C and constant accuracy D.
- FIGS. 28 - 30 illustrate additional example implementation of a plot for visualizing model performance.
- the target area T can be the entire region bounded by C and D, rather than a curve.
- FIG. 31 illustrates another example implementation of a plot for visualizing model performance in which the target T is bounded by D and isolinear lines C define a scale of constant accuracy or constant cost levels.
- the isolinear lines enable an intuitive visualization for constant cost or accuracy across a range of costs and accuracies.
- the target area T in can be represented by a curve (e.g., curve tangent, conical curve, hyperbola, parabola, ellipse, and the like) to D.
- the platform in response to a user selecting “find AI models” can start to generate candidate predictive models including training those models and assessing their performance. As models are generated and their performance is assessed, their performance can be plotted on the plot of false positives versus false negatives.
- FIG. 3 is an example interface illustrating visualization of multiple candidate model performance during generation of candidate models. After each candidate model is generated, its performance can be plotted on the plot. In addition, a remaining budget can be updated (e.g., to illustrate how much of the budget has been spent on model building) as well as a probability of successfully generating a model that will achieve the target accuracy.
- the graphical objects can appear in the plot in real-time providing the user with an up-to-date snapshot of the model generation process.
- the current subject matter can provide an interface that enables a user to make decisions regarding the model generation process, such as terminating the process early if it is unlikely that a model with be generated with the required accuracy.
- the interface in FIG. 3 can present the highest model accuracy, lowest false positive rate and lowest false negative rate for the candidate models that can been generated.
- the platform can generate a number of candidate models, assess their performance, and display their performance visually and juxtaposed to convey performance of a model relative to one another in a simple and intuitive manner. Such an approach can enable a user to develop multiple candidate models and choose, from the multiple candidate models, one or more final models.
- FIG. 4 illustrates an example of juxtaposing details of multiple candidate model performance relative to one another.
- the interface enables a user to select one or more model graphical objects (right), and list details 405 of the generated model (left).
- details of the top performing models can be listed left in order of performance.
- the listing of model details can include a graphical object representing the performance of the model relative to the target accuracy.
- the graphical object can be in the form of spark line doughnut, pie, bar chart, and/or the like.
- FIG. 4 illustrates an exemplary GUI display space that can provides the user with the results of prediction model generation (e.g., by the predictive model generator).
- the GUI display space in FIG. 4 can include the plot described in FIG. 1 .
- the plot can include graphical objects that are indicative of performance metrics of the generated predictive models (“candidate models”).
- One or more of the graphical objects can be visually discernable (e.g., highlighted) in the plot, and information of candidate models associated with the discernable graphical object can be presented adjacent to the plot.
- the user can highlight additional model indicators using a mouse or touch interaction and get additional information on the desired objects.
- Predictive model information can include one or more of name of the model, model type, time taken to generate the predictive model, complexity of the model, model accuracy, and the like.
- the GUI display space in FIG. 4 can include a graphical object indicative of the available budget for searching/determining predictive models.
- the GUI display space can include a graphical object indicative of a likelihood of success in determining a predictive model having desirable model characteristic (e.g., desirable target accuracy).
- the GUI display space can include graphical objects that indicate the highest accuracy value, the lowest false positive value, the lowest false negative value, and the like, of the generated candidate models.
- the GUI display space in FIG. 4 can automatically update in real-time.
- the new graphical objects can appear in the GUI display space and/or existing graphical object can be replaced with updated graphical objects.
- the updates can be based on new results generated by the predictive model generator (e.g., generation of new predictive models). For example, when a new candidate model is generated, a graphical object associated with the performance metric of the newly generated candidate model may appear in the plot. Graphical objects associated with available budget, probability of success, highest model accuracy value, lowest false positive value, and lowest false negative value can be updated.
- Determining the optimal modeling technique requires an understanding of the business objectives as well as the performance tradeoffs of different techniques. It can often be difficult to know the optimal selection at the beginning of a modeling project. As models are run, additional information is revealed. This information can include model fit statistics for different types of models, relative predictive value of terms and interactions, subgroups with lower or higher accuracy predictions than average. For example, as models are developed, a specific class of models may be performing well relative to other classes of models and with a current dataset even though the specific class of models may have not performed as well for similar datasets in the past.
- This approach can start with a mix of models (e.g., an ordered list of model types to train with the data set) biased to the desired objective (e.g. lowest complexity, highest accuracy).
- models e.g., an ordered list of model types to train with the data set
- the desired objective e.g. lowest complexity, highest accuracy
- the model mix can primarily select algorithms that typically produce smaller models that are auditable and capable of being deployed for real time predictions, like logistic and linear regression.
- the model mix can primarily select algorithms that tend to produce the highest accuracy for similar datasets, like deep learning and neural net.
- the initial mix (e.g., an initial ordered list of model types, a set, and the like) may include model types with a lower complexity.
- a small sampling (e.g., one, two, etc.) of complex models can be included to the mix (e.g., ordered list, set, and the like) to determine if the higher complexity models perform significantly better than the simpler models for the given dataset.
- models can also run (e.g., be trained) to determine how additional model types perform. While the model mix can be determined by the user's business objectives, other modeling types may be run to determine the optimal model type. For example, the user looking for the highest accuracy might expect a neural net, or deep learning model to produce the best predictions, however, running a few decisions trees, or linear regressions may reveal that the more sophisticated models are only marginally higher accuracy, in this case the user might want to focus further development on simpler models to reduce cost and gain the benefits of less complex models. In the run for the user looking for real time predictions, if the model mix only ran simpler models, the user may not realize that a more advanced model might produce significant accuracy gains. Running a few advanced models could identify higher accuracy models that might be worth trading off some desired functionality of simpler models.
- the initial model types to use for generating candidate models can include primarily models of a type expected to perform better based on historical data, representative examples of different classes of algorithms can be included to confirm that a given dataset performs similarly to historically similar datasets.
- the ratio of model types being run can be adjusted in an attempt to maximize the desired outcome, within stated business objectives.
- certain model types can outperform others, as the initial model runs complete, certain types of models may emerge as leading candidates for delivering the best model performance for the data.
- the model mix can then adjust, increasing the percentage of models run that are similar to the types of models that have shown positive results.
- the top performing models that fit the stated business objective can be identified and presented to the user. For example, if more complex models are performing better for a given dataset, even though simpler models had performed better for similar datasets in the past, then a greater proportion of complex models will be tested in this case.
- Historic performance of similar datasets can determine the initial mix of models (e.g., list, set, and the like), the mix can be updated during the model development process as more information about the performance characteristics of the specific dataset is determined.
- the user can specify a model characteristic such as explainability that can exclude certain classes of models that are expected to perform well for this type of dataset.
- the system can run a small number of such models regardless to quantify the impact of the model characteristic choices. If model types that do not fit the stated business objectives are found to have better performance, users can be notified and provided an opportunity to revisit their business objectives. For example, the system can point out that deep learning models were 15% more accurate than explainable models and then the user can revisit the decision to exclude models that were not explainable.
- the platform can prompt a user to input whether they want to continue with the model building process.
- FIG. 10 is an example interface illustrating a prompt to a user when a model is generated that achieves the target accuracy. Since the target accuracy is achieved a user may wish to not spend the entire model building budget. A recommendation can be provided.
- the model generation platform can learn from user input and model generation regarding what approaches to model generation results in quality predictive models. For example, the model generation platform can learn, over time, best practices for model development. Based on those best practices and in some implementations, the model generation platform can provide recommendations to a user during the model building specification and during generation. For example, the model generation platform can identify that a certain type or class of models would likely result in a better performing model based on the balance of the dataset used for training and the required accuracy. As another example, the model generation platform can identify that a user has specified a budget that is too low given the target accuracy, and recommend a new budget that would result in a higher probability of finding a model to achieve the target accuracy. For example, FIG.
- the model generation platform can also automatically act upon the learned best practices, for example, optimizing which models are trained on which types of servers based on which classes of models are more likely to benefit from more expensive resources such as servers with GPUs or greater amounts of memory, and which classes of algorithms can be assigned to cheaper servers without cost impact. As more powerful servers cost more per hour, the model generating platform can leverage best practices learned from historical runs to optimize the expected total cost of training a set of models by allocating models optimally to the type of servers that would minimize the total cost of training such models.
- FIG. 5 illustrates an exemplary GUI display space that indicates to the user that the predictive models cannot be generated based on the user inputs (e.g., predictive model characteristics, model requirements, and the like). For example, higher target accuracies of predictive models can require larger computational resources and/or longer computational times. This can result in higher budgets required to search/generate predictive models of higher target accuracies. If the model finding budget provided by the user is less than the expected budget, the GUI display space can indicate to the user that the model finding budget is likely deficient. Additionally, a recommended budget that is likely to be sufficient for searching/generating predictive models having desirable characteristics provided by the user (e.g., input target accuracy) can be provided in the GUI display space. In some implementations, the plot in the GUI display space can display the first color-coded region representative of the target accuracy and the expected outcomes.
- the plot in the GUI display space can display the first color-coded region representative of the target accuracy and the expected outcomes.
- the model generation platform can automatically identify subgroups of data within a dataset during model generation and/or for a model that is in production (e.g., being used for classification on real data, is considered “live”, and the like) for which the model has a lower performance relative to other subgroups of data.
- a recommended course of action for the user can be provided to improve the associated predictive model. These recommended courses of action can include terminating further training of the model, creating a split-model (e.g., an additional model for the lower performing subgroup), and to remove the subgroup from the dataset. If multiple models all underperform with the same subgroup, then that subgroup can be flagged for additional action.
- An interface can be provided during the model generation process for implementing the recommendation, including terminating model generation, splitting the model, and modification of the training set.
- FIG. 4 illustrates an interface during model generation in which underperforming subgroups have been identified, and a recommendation 410 to take action to improve model performance is provided.
- the recommendation 410 can include splitting models, terminating the remainder of the model generation run, and to remove subgroups manually.
- FIG. 21 - 24 illustrate additional example interfaces that can visualize subgroups for which the models are underperforming and provide a recommendation to take action to improve model performance.
- That subgroup can be flagged for action as the data quality for that subgroup is likely poor or the underlying behavior for the subgroup is more unpredictable. Additional information can be gained by the relative performance of different model types across subgroups. Subgroups that perform better with models using higher order interactions of terms can indicate interactions are more important within these subgroups.
- the system can also automatically generate derived variables (e.g. combination of product and country) based on an automated evaluation of which specific variable interactions are performing the best in such models. These derived variables can then be made available to simpler models that do not consider higher order variable interactions.
- Subgroups with exceptionally high accuracy can indicate areas where post-outcome information (e.g., data leakage) existed in the training data that may not have been known prior to the event. (e.g., units sold used in a prediction of revenue). Findings in these subgroups can be used to improve data quality or recommend the classes of models most likely to perform for various subgroups.
- post-outcome information e.g., data leakage
- Findings in these subgroups can be used to improve data quality or recommend the classes of models most likely to perform for various subgroups.
- the practice of generating specific models for underperforming subgroups, and running a large number of models poses the risk of overfitting the data. This risk can be mitigated by recommending simpler models that have similar performance characteristics to more complex models or by using several advisor models in combination.
- the system can optimize ensemble models by observing which classes of algorithms perform better as an ensemble based on the historical performance of such ensembles on datasets with similar characteristics.
- a score or other metric of data subgroup performance can be monitored across subgroups for a model.
- Data subgroups can be flagged and visualized, along with their performance and over time.
- FIGS. 17 - 20 illustrate additional example interfaces that can enable a user to analyze the data subgroup performance.
- this visualization can be provided for multiple models, allowing analysis of a common subgroup for multiple models over time. For example, if a data subgroup relates to transactions originating in China, the visualization can enable analysis of multiple model's performance against all transactions originating in China and over time.
- the data subgroup associated with China can be automatically flagged as underperforming for analysis. Multiple subgroups can be presented in an ordered list based on their relative impact on overall model performance. Such an approach can enable improved model generation and performance.
- the model generation platform can monitor performance of a generated model while the generated model is in production (e.g., being used for classification on real or live data).
- the model generation platform can assess performance of the model over time and present an interface that shows the performance varying over time.
- Such an interface can include worm plots showing the assessed performance at different points in time.
- An interactive graphical control can be included that allows a user to move between different points in time. By visualizing model performance over time, model understanding can be improved. For example, FIG. 6 illustrates the performance of a model over time.
- An interactive graphical control is included below the plot of false positives and false negatives and enables a user to move through time to assess performance and other characteristics of the model over time.
- the performance of multiple models can be juxtaposed and assessed over time.
- FIG. 7 is an example illustrating performance of three different models over time. The performance over time of each model is represented by a worm block where the darker graphical object indicates the current or most recent performance while the lighter (e.g., gray) indicates historical performance.
- An interactive graphical control is included below the plot of false positives and false negatives and enables a user to move through time to assess performance and other characteristics of the models over time.
- a single visualization can include multiple worm diagrams for respective data subgroups.
- data can be grouped into subgroups and performance of a predictive model with respect to each subgroup can be shown as a worm diagram.
- Representing performance of data subgroups over time enables a user to identify a subgroup that is behaving poorly over time relative to other subgroups.
- the platform can automatically determine that a model can be improved and provide a recommendation to stratify or split a model based on the performance of subgroups of models.
- a model type to use with data associated with the subgroup subject to a split can be recommended.
- FIGS. 8 - 9 illustrate an example interface with models filtered by a data characteristic.
- the size of a graphical object or icon forming part of a worm diagram can indicate a relative proportion size of the data.
- the size of each bubble can be rescaled at each time point.
- the size of the bullet indicates the growth rate of that subgroup. For example, in a current point in time, the graphical objects or icons forming parts of the worm diagram can rescale to the same size dots with the relative size of the next period dots indicating relative growth in size.
- Some aspects of the current subject matter can include automatically generating blueprints or guides for a user by observing and modeling historical user behavior.
- the result can include an auto-generated blueprint that can guide a user, who may be inexperienced in certain types of data analysis, to perform advanced analysis. For example, business users typically don't know how to create a sales win/loss analysis.
- Some implementations of the current subject matter can learn, from user behavior that occurred during prior sales win/loss analysis, a blueprint for user action (e.g., best practices) to create a win/loss analysis.
- the blueprint can enable an interface to walk a user through creating an advanced scenario including identifying the appropriate variables, identifying the appropriate data sources (example data sources can be recommended), identifying the appropriate data granularity (e.g. whether each row should represent a customer or an opportunity), identifying specific data columns or rows to include or exclude, and the like.
- blueprints can be learned from identified enterprise integrations, including identifying appropriate data sets for a particular task.
- FIG. 12 is an illustration of an example user interface for guiding a user through data analysis such as a win/loss analysis.
- Data that is typically used can be presented along with a link or description of a common source of the data. For example, in FIG. 11 , customer information and customer revenue are recommended data, and the interface indicates locations that the respective types of data can be typically found.
- the user may input additional information, which can be used for tailoring the interface and platform for the user including for use in predicting actions and providing recommendations for the user.
- Example interfaces of an example platform according to an implementation of the current subject matter is illustrated in FIGS. 12 - 16 .
- Confusion matrices are commonly used to convey model accuracy.
- a confusion matrix also known as an error matrix, can include a specific table layout that allows visualization of the performance of an algorithm. Each row of the matrix can represent the instances in a predicted class while each column represents the instances in an actual class (or vice versa).
- the name stems from the fact that it makes it easy to see if the system is confusing two classes (e.g., commonly mislabeling one as another).
- adding physical scale to each area of a confusion matrix provides easier visual interpretability to traditional confusion matrices or can be used to show additional relevant dimensions (e.g. frequency, financial impact, and the like).
- the visualization can provide a representation of the overall benefit of model accuracy. Adjustments can be provided to ensure the representation is consistent with actual data. For example, the ratio of actual outcomes can be adjusted to compensate for training data that is up sampled or down sampled, the count of records per period can also be adjusted to provide a more accurate estimate. For example, the training data may have 50% True and 50% False examples while the production data is expected to be 80% True and 20% False.
- the weights for the confusion matrix can be updated to reflect the expected matrix when the model predicts based on the expected mix in production data.
- Y indicates correct prediction
- Y′ indicates incorrect prediction
- X indicates positive outcome
- X′ indicates negative outcome.
- K relates to performance where the outcome is a correct prediction and positive outcome
- S is a correct prediction and negative outcome
- F is an incorrect prediction and negative outcome
- L is the incorrect prediction and positive outcome.
- the size of each region can be indicative of scale or of the relative benefits and costs. Another example visual is illustrated in FIG. 33
- Running additional models to improve accuracy has a direct financial cost. Knowing the benefit of correct predictions, incorrect predictions, and the quantity of predictions over a given period, it is possible to determine the optimal tradeoff of accuracy to modeling cost. Using the accuracy tradeoff in conjunction with a prediction of potential accuracy improvement from additional modeling expenditures, it is possible to determine optimal model generation expenditure. Model generation can be paused when the optimal balance is achieved. This can be possible by detecting and predicting model convergence, the maximum accuracy possible in a given training dataset.
- Models tend to degrade over time causing a negative impact on the target business outcome. Models are usually upgraded on a set schedule, or as model performance drops below a given threshold. Knowing the financial benefit of correct predictions, incorrect predictions, and the quantity of predictions over a given period, the cost of model degradation can be determined. As with initial model development, using the accuracy tradeoff in conjunction with a prediction of potential accuracy improvement from additional modeling expenditures, it can be possible to determine the optimal model update expenditure to maximize overall profitability. This can be applied to model maintenance to inform users when the financial threshold for updating the model has been reached.
- FIG. 34 is a process flow diagram illustrating an example process 3400 enabling an improved interface that can enable deeper understanding of a model's performance.
- the model can include classifiers, predictors, and/or prescriptive models (e.g., a predictive model, a prescriptive model, and/or a continuous model).
- a plot can be rendered within a graphical user interface display space.
- the plot can include a first axis and a second axis.
- the first axis can include a characterization of false positive and the second axis including a characterization of false negative.
- the characterization of rate of false positive can include rate of false positive, count of false positive, cost of false positive, benefit missed by false positive, true positive, benefit of true positive, benefit of minimizing false positive, or benefit of maximizing true positive.
- the characterization of rate of false negative can include rate of false negative, cost of false negative, count of false negative, benefit missed by false negative, true negative, benefit of true negative, benefit of minimizing false negative, or benefit of maximizing true negative.
- a graphical object can be rendered within the graphical user interface display space and within the plot.
- the graphical object can be rendered at a location characterizing the performance metric.
- a visualization indicative of the target accuracy can be rendered.
- a region indicative of the target accuracy can be rendered. The region can be indicative of the target accuracy and can be bounded by at least: a first line indicative of the target accuracy and an origin of the plot; the second line indicative of constant accuracy and the origin; or the second line indicative of constant accuracy, the third line indicative of constant cost, and the origin.
- a second line indicative of constant accuracy can be rendered and a third line indicative of constant cost can be rendered.
- a balance metric characterizing a relative proportion of observed classes within a dataset can be determined.
- the line indicative of the target accuracy can include a curved line, a degree of curvature of the line indicative of the target accuracy based on the determined balance metric.
- User input characterizing a relative cost of false negative and relative cost of false positive can be received.
- a line indicative of constant cost weighted according to the received user input can be rendered.
- data characterizing a second performance metric of a second model can be received.
- a second graphical object at a second location characterizing the second performance metric can be rendered within the graphical user interface display space and within the plot.
- the graphical object can include a shape and/or color indicative of a characteristic of the model, the characteristic including a complexity metric.
- the performance metric of the model can include a first rate of false positive value and a first rate of false negative value.
- the location of the graphical object with respect to the first axis can be indicative of first false positive rate value and the location of the graphical object with respect to the second axis is indicative of the first false negative rate value.
- a first interactive graphical object characterizing a first input value of a model generator can be rendered in the graphical user interface display space.
- User interaction with the first interactive graphical object and indicative of the first input value can be received.
- One or more candidate models can be determined based on the received data characterizing user interaction with the first interactive graphical object.
- a second graphical object indicative of the one or more candidate models can be rendered.
- User input specifying the target accuracy, a relative cost of error, model requirements, and a budget for model development can be received.
- a probability of developing a predictive model according to the target accuracy, the relative cost of error, the model requirements, and the budget for model development can be determined.
- a visualization characterizing the probability can be rendered within the graphical user interface display space.
- a range of expected outcomes can be determined using a predictive model trained on observations of users developing models.
- the observations can include characteristics of training datasets, selected model requirements, selected model development budgets, and performance of models generated.
- a second region indicative of the determined range of expected outcomes can be rendered within the plot.
- Training of a first candidate model can be caused based at least on the received user input specifying the relative cost of error, the model requirements, and the budget for model development.
- a performance metric of the first candidate model can be determined.
- a second graphical object at a location characterizing the performance metric of the first candidate model can be rendered within the graphical user interface display space and within the plot.
- the subject matter described herein provides many technical advantages. For example, users are often unable to interpret the meaning of overall accuracy and can deploy models unaware that even a model with an apparently high accuracy percentage could underperform random selection, the current subject matter can provide context to clearly identify relative performance. By providing a relative cost tradeoff, users may not need to know the exact values of false positives to false negatives, they simply can understand the relative cost of one to the other to develop a cost optimized target. By developing a target prior to model development, there can be a clear business driven success criteria, which can prevent spending additional time and resources driving for ever high performance. Automatically pausing additional model runs when a goal is achieved, or the probability of a successful outcome drops below a certain threshold, allows users to start an analysis with low risk of wasting their specified budget.
- Identifying subgroups where models are underperforming, performing suspiciously well, or responding differently to certain model types can provide valuable information to assist in improving future models with far less effort than would be needed traditionally to identify similar information. Blueprints highlighting data that is likely useful and where it usually resides can allow users to identify and locate additional information that they might not have initially considered.
- the range of expected outcomes can provide calibration before an analysis is run by providing the performance of similar analyses and provide a realistic probability of achieving the desired performance.
- the range of expected outcomes can also provide feedback as results from model runs begin to appear by showing if results are underperforming expectation or are perhaps too good to be true. Deployed models can typically require extensive monitoring, or frequent updates, to make sure they continue to meet the desired performance objectives, which can prove costly.
- the current subject matter can be configured to be implemented in a system 3600 , as shown in FIG. 35 .
- the system 3500 can include one or more of a processor 3610 , a memory 3620 , a storage device 3630 , and an input/output device 3640 .
- Each of the components 3610 , 3620 , 3630 and 3640 can be interconnected using a system bus 3650 .
- the processor 3610 can be configured to process instructions for execution within the system 3600 .
- the processor 3610 can be a single-threaded processor. In alternate implementations, the processor 3610 can be a multi-threaded processor.
- the processor 3610 can be further configured to process instructions stored in the memory 3620 or on the storage device 3630 , including receiving or sending information through the input/output device 3640 .
- the memory 3620 can store information within the system 3600 .
- the memory 3620 can be a computer-readable medium.
- the memory 3620 can be a volatile memory unit.
- the memory 3620 can be a non-volatile memory unit.
- the storage device 3630 can be capable of providing mass storage for the system 3600 .
- the storage device 3630 can be a computer-readable medium.
- the storage device 3630 can be a hard disk device, an optical disk device, a tape device, non-volatile solid state memory, or any other type of storage device.
- the input/output device 3640 can be configured to provide input/output operations for the system 3600 .
- the input/output device 3640 can include a keyboard and/or pointing device.
- the input/output device 3640 can include a display unit for displaying graphical user interfaces.
- One or more aspects or features of the subject matter described herein can be realized in digital electronic circuitry, integrated circuitry, specially designed application specific integrated circuits (ASICs), field programmable gate arrays (FPGAs) computer hardware, firmware, software, and/or combinations thereof.
- ASICs application specific integrated circuits
- FPGAs field programmable gate arrays
- These various aspects or features can include implementation in one or more computer programs that are executable and/or interpretable on a programmable system including at least one programmable processor, which can be special or general purpose, coupled to receive data and instructions from, and to transmit data and instructions to, a storage system, at least one input device, and at least one output device.
- the programmable system or computing system may include clients and servers.
- a client and server are generally remote from each other and typically interact through a communication network. The relationship of client and server arises by virtue of computer programs running on the respective computers and having a client-server relationship to each other.
- machine-readable signal refers to any signal used to provide machine instructions and/or data to a programmable processor.
- the machine-readable medium can store such machine instructions non-transitorily, such as for example as would a non-transient solid-state memory or a magnetic hard drive or any equivalent storage medium.
- the machine-readable medium can alternatively or additionally store such machine instructions in a transient manner, such as for example as would a processor cache or other random access memory associated with one or more physical processor cores.
- one or more aspects or features of the subject matter described herein can be implemented on a computer having a display device, such as for example a cathode ray tube (CRT) or a liquid crystal display (LCD) or a light emitting diode (LED) monitor for displaying information to the user and a keyboard and a pointing device, such as for example a mouse or a trackball, by which the user may provide input to the computer.
- a display device such as for example a cathode ray tube (CRT) or a liquid crystal display (LCD) or a light emitting diode (LED) monitor for displaying information to the user and a keyboard and a pointing device, such as for example a mouse or a trackball, by which the user may provide input to the computer.
- CTR cathode ray tube
- LCD liquid crystal display
- LED light emitting diode
- keyboard and a pointing device such as for example a mouse or a trackball
- Other kinds of devices can be used to provide
- phrases such as “at least one of” or “one or more of” may occur followed by a conjunctive list of elements or features.
- the term “and/or” may also occur in a list of two or more elements or features. Unless otherwise implicitly or explicitly contradicted by the context in which it is used, such a phrase is intended to mean any of the listed elements or features individually or any of the recited elements or features in combination with any of the other recited elements or features.
- the phrases “at least one of A and B;” “one or more of A and B;” and “A and/or B” are each intended to mean “A alone, B alone, or A and B together.”
- a similar interpretation is also intended for lists including three or more items.
- the phrases “at least one of A, B, and C;” “one or more of A, B, and C;” and “A, B, and/or C” are each intended to mean “A alone, B alone, C alone, A and B together, A and C together, B and C together, or A and B and C together.”
- use of the term “based on,” above and in the claims is intended to mean, “based at least in part on,” such that an unrecited feature or element is also permissible.
Landscapes
- Engineering & Computer Science (AREA)
- Theoretical Computer Science (AREA)
- Physics & Mathematics (AREA)
- General Physics & Mathematics (AREA)
- General Engineering & Computer Science (AREA)
- Software Systems (AREA)
- Data Mining & Analysis (AREA)
- Computing Systems (AREA)
- Artificial Intelligence (AREA)
- Evolutionary Computation (AREA)
- Mathematical Physics (AREA)
- Life Sciences & Earth Sciences (AREA)
- Databases & Information Systems (AREA)
- Biomedical Technology (AREA)
- Computational Linguistics (AREA)
- Health & Medical Sciences (AREA)
- Molecular Biology (AREA)
- General Health & Medical Sciences (AREA)
- Biophysics (AREA)
- Medical Informatics (AREA)
- Computer Vision & Pattern Recognition (AREA)
- Computer Hardware Design (AREA)
- Bioinformatics & Cheminformatics (AREA)
- Bioinformatics & Computational Biology (AREA)
- Evolutionary Biology (AREA)
- Quality & Reliability (AREA)
- Computational Mathematics (AREA)
- Mathematical Optimization (AREA)
- Probability & Statistics with Applications (AREA)
- Pure & Applied Mathematics (AREA)
- Algebra (AREA)
- Mathematical Analysis (AREA)
- User Interface Of Digital Computer (AREA)
- Management, Administration, Business Operations System, And Electronic Commerce (AREA)
Abstract
Description
Claims (20)
Priority Applications (2)
| Application Number | Priority Date | Filing Date | Title |
|---|---|---|---|
| US16/230,613 US12061532B2 (en) | 2018-10-15 | 2018-12-21 | Interface for visualizing and improving model performance |
| US18/799,674 US20250045183A1 (en) | 2018-10-15 | 2024-08-09 | Interface for Visualizing and Improving Model Performance |
Applications Claiming Priority (3)
| Application Number | Priority Date | Filing Date | Title |
|---|---|---|---|
| US201862745966P | 2018-10-15 | 2018-10-15 | |
| US16/169,208 US10586164B1 (en) | 2018-10-15 | 2018-10-24 | Interface for visualizing and improving model performance |
| US16/230,613 US12061532B2 (en) | 2018-10-15 | 2018-12-21 | Interface for visualizing and improving model performance |
Related Parent Applications (1)
| Application Number | Title | Priority Date | Filing Date |
|---|---|---|---|
| US16/169,208 Continuation US10586164B1 (en) | 2018-10-15 | 2018-10-24 | Interface for visualizing and improving model performance |
Related Child Applications (1)
| Application Number | Title | Priority Date | Filing Date |
|---|---|---|---|
| US18/799,674 Continuation US20250045183A1 (en) | 2018-10-15 | 2024-08-09 | Interface for Visualizing and Improving Model Performance |
Publications (2)
| Publication Number | Publication Date |
|---|---|
| US20200118018A1 US20200118018A1 (en) | 2020-04-16 |
| US12061532B2 true US12061532B2 (en) | 2024-08-13 |
Family
ID=69723518
Family Applications (6)
| Application Number | Title | Priority Date | Filing Date |
|---|---|---|---|
| US16/169,208 Active US10586164B1 (en) | 2018-10-15 | 2018-10-24 | Interface for visualizing and improving model performance |
| US16/230,655 Active 2041-04-20 US11429508B2 (en) | 2018-10-15 | 2018-12-21 | Interface for visualizing and improving model performance |
| US16/230,613 Active 2042-11-15 US12061532B2 (en) | 2018-10-15 | 2018-12-21 | Interface for visualizing and improving model performance |
| US17/812,246 Active US11892932B2 (en) | 2018-10-15 | 2022-07-13 | Interface for visualizing and improving model performance |
| US18/390,056 Pending US20240118986A1 (en) | 2018-10-15 | 2023-12-20 | Interface for visualizing and improving model performance |
| US18/799,674 Pending US20250045183A1 (en) | 2018-10-15 | 2024-08-09 | Interface for Visualizing and Improving Model Performance |
Family Applications Before (2)
| Application Number | Title | Priority Date | Filing Date |
|---|---|---|---|
| US16/169,208 Active US10586164B1 (en) | 2018-10-15 | 2018-10-24 | Interface for visualizing and improving model performance |
| US16/230,655 Active 2041-04-20 US11429508B2 (en) | 2018-10-15 | 2018-12-21 | Interface for visualizing and improving model performance |
Family Applications After (3)
| Application Number | Title | Priority Date | Filing Date |
|---|---|---|---|
| US17/812,246 Active US11892932B2 (en) | 2018-10-15 | 2022-07-13 | Interface for visualizing and improving model performance |
| US18/390,056 Pending US20240118986A1 (en) | 2018-10-15 | 2023-12-20 | Interface for visualizing and improving model performance |
| US18/799,674 Pending US20250045183A1 (en) | 2018-10-15 | 2024-08-09 | Interface for Visualizing and Improving Model Performance |
Country Status (1)
| Country | Link |
|---|---|
| US (6) | US10586164B1 (en) |
Families Citing this family (16)
| Publication number | Priority date | Publication date | Assignee | Title |
|---|---|---|---|---|
| US11409549B2 (en) | 2018-10-15 | 2022-08-09 | AIble Inc. | Interface for generating models with customizable interface configurations |
| US10586164B1 (en) | 2018-10-15 | 2020-03-10 | AIble Inc. | Interface for visualizing and improving model performance |
| US10936768B2 (en) | 2018-10-15 | 2021-03-02 | Aible, Inc. | Interface for visualizing and improving model performance |
| CN112789636A (en) * | 2018-10-26 | 2021-05-11 | 索尼公司 | Information processing apparatus, information processing method, and program |
| US11544724B1 (en) | 2019-01-09 | 2023-01-03 | Blue Yonder Group, Inc. | System and method of cyclic boosting for explainable supervised machine learning |
| US10997608B1 (en) * | 2019-12-12 | 2021-05-04 | Sift Science, Inc. | Systems and methods for insult rate testing and reconfiguring an automated decisioning workflow computer for improving a machine learning-based digital fraud and digital abuse mitigation platform |
| US20220067573A1 (en) * | 2020-08-31 | 2022-03-03 | Accenture Global Solutions Limited | In-production model optimization |
| US12124925B2 (en) | 2020-09-03 | 2024-10-22 | The Toronto-Dominion Bank | Dynamic analysis and monitoring of machine learning processes |
| CN113407180B (en) * | 2021-05-28 | 2022-11-01 | 济南浪潮数据技术有限公司 | Configuration page generation method, system, equipment and medium |
| US11816186B2 (en) * | 2021-07-26 | 2023-11-14 | Raytheon Company | Architecture for dynamic ML model drift evaluation and visualization on a GUI |
| US11693721B2 (en) * | 2021-09-25 | 2023-07-04 | Intel Corporation | Creating robustness scores for selected portions of a computing infrastructure |
| US12003489B2 (en) | 2021-12-07 | 2024-06-04 | Intel Corporation | Mechanisms to reduce exposure of sensitive telemetry data in computing networks |
| KR102521906B1 (en) * | 2022-03-23 | 2023-04-14 | 오픈마루 주식회사 | A method for inducing user interaction with respect to performance problems of middleware constituting the micro-service architecture and for providing the problem-solving process |
| US12462192B2 (en) | 2022-05-18 | 2025-11-04 | International Business Machines Corporation | Adaptive retraining of an artificial intelligence model by detecting a data drift, a concept drift, and a model drift |
| US20240312081A1 (en) * | 2023-03-17 | 2024-09-19 | Caplight Technologies, Inc. | Data interpolation platform |
| US20260072702A1 (en) * | 2024-09-06 | 2026-03-12 | Dell Products L.P. | HANDLING ARTIFICIAL INTELLIGENCE (AI) MODELS FOR HUMAN INTERFACE DEVICES (HIDs) |
Citations (58)
| Publication number | Priority date | Publication date | Assignee | Title |
|---|---|---|---|---|
| US20050234697A1 (en) | 2004-04-16 | 2005-10-20 | Pinto Stephen K | Predictive model management |
| US20070299833A1 (en) | 2006-06-21 | 2007-12-27 | Timo-Pekka Viljamaa | Network-based determination of user content preferences |
| US20090299896A1 (en) | 2008-05-29 | 2009-12-03 | Mingyuan Zhang | Computer-Implemented Systems And Methods For Integrated Model Validation For Compliance And Credit Risk |
| US20100153330A1 (en) | 2008-12-12 | 2010-06-17 | Vitage Technologies Pvt. Ltd. | Proactive Information Technology Infrastructure Management |
| US20100196941A1 (en) | 2007-07-30 | 2010-08-05 | The Regents Of The University Of Michigan | Multi-Analyte Analysis of Saliva Biomarkers as Predictors of Periodontal and Pre-Implant Disease |
| US20100205521A1 (en) | 2009-02-11 | 2010-08-12 | Microsoft Corporation | Displaying multiple row and column header areas in a summary table |
| US7797313B1 (en) | 2006-03-28 | 2010-09-14 | Symantec Operating Corporation | Relevance ranking in a computer system |
| US20110161857A1 (en) | 2009-12-30 | 2011-06-30 | Cerner Innovation, Inc. | Graphic for Displaying Multiple Assessments of Critical Care Performance |
| US20110225584A1 (en) | 2010-03-11 | 2011-09-15 | International Business Machines Corporation | Managing model building components of data analysis applications |
| US20110231499A1 (en) | 2010-03-22 | 2011-09-22 | Research In Motion Limited | Management and display of grouped messages on a communication device |
| US20120198342A1 (en) | 2011-01-28 | 2012-08-02 | International Business Machines Corporation | Automatic generation of task scripts from web browsing interaction history |
| US20130041860A1 (en) | 2011-08-10 | 2013-02-14 | International Business Machines Corporation | Predicting influence in social networks |
| US20130055268A1 (en) | 2011-08-31 | 2013-02-28 | International Business Machines Corporation | Automated web task procedures based on an analysis of actions in web browsing history logs |
| US20130198569A1 (en) | 2012-02-01 | 2013-08-01 | Empirix Inc. | Method of embedding configuration data in a non-configuration document |
| US20140315742A1 (en) | 2011-09-29 | 2014-10-23 | Meso Scale Technologies, Llc | Biodosimetry panels and methods |
| US20150039652A1 (en) | 2013-08-01 | 2015-02-05 | Alpha Beta Analytics, LLC | Systems and methods for automated analysis, screening and reporting of group performance |
| US20150039552A1 (en) | 2013-08-05 | 2015-02-05 | Applied Materials, Inc. | Method and apparatus for optimizing profit in predictive systems |
| US20150269244A1 (en) * | 2013-12-28 | 2015-09-24 | Evolv Inc. | Clustering analysis of retention probabilities |
| US9336483B1 (en) | 2015-04-03 | 2016-05-10 | Pearson Education, Inc. | Dynamically updated neural network structures for content distribution networks |
| US20160203509A1 (en) | 2015-01-14 | 2016-07-14 | Globys, Inc. | Churn Modeling Based On Subscriber Contextual And Behavioral Factors |
| US20160232457A1 (en) | 2015-02-11 | 2016-08-11 | Skytree, Inc. | User Interface for Unified Data Science Platform Including Management of Models, Experiments, Data Sets, Projects, Actions and Features |
| US20160350671A1 (en) | 2015-05-28 | 2016-12-01 | Predikto, Inc | Dynamically updated predictive modeling of systems and processes |
| US20160350870A1 (en) | 2015-05-29 | 2016-12-01 | Intuit Inc. | Method and system for identifying users who benefit from filing itemized deductions to reduce an average time consumed for users preparing tax returns with a tax return preparation system |
| US20160350673A1 (en) | 2015-05-26 | 2016-12-01 | Oracle International Corporation | System and method providing automatic completion of task structures in a project plan |
| US20160371601A1 (en) | 2015-06-18 | 2016-12-22 | International Business Machines Corporation | Quality-directed adaptive analytic retraining |
| US20170004584A1 (en) | 2015-06-30 | 2017-01-05 | Intuit Inc. | Systems, methods and articles for providing tax recommendations |
| US20170090990A1 (en) * | 2015-09-25 | 2017-03-30 | Microsoft Technology Licensing, Llc | Modeling resource usage for a job |
| US20170148027A1 (en) | 2015-11-24 | 2017-05-25 | Vesta Corporation | Training and selection of multiple fraud detection models |
| US20170184602A1 (en) | 2014-04-24 | 2017-06-29 | Pfizer Inc. | Cancer treatment |
| US20170368258A1 (en) | 2014-12-22 | 2017-12-28 | Medicus Engineering Aps | Closed-loop control of insulin infusion |
| US20180046935A1 (en) | 2016-08-09 | 2018-02-15 | Microsoft Technology Licensing, Llc | Interactive performance visualization of multi-class classifier |
| US20180046926A1 (en) | 2014-05-23 | 2018-02-15 | DataRobot, Inc. | Systems for time-series predictive data analytics, and related methods and apparatus |
| US20180067118A1 (en) | 2016-09-02 | 2018-03-08 | Bioinfra Inc. | Method for using information on complex biomarker group to diagnose lung cancer in a subject and diagnostic kit and computing system using the same |
| US20180080937A1 (en) | 2015-03-27 | 2018-03-22 | Deutsches Krebsforschungszentrum Stiftung des öffentlichen Rechts | Biomarker Panel For Diagnosing Cancer |
| US20180137424A1 (en) * | 2016-11-17 | 2018-05-17 | General Electric Company | Methods and systems for identifying gaps in predictive model ontology |
| US20180248905A1 (en) | 2017-02-24 | 2018-08-30 | Ciena Corporation | Systems and methods to detect abnormal behavior in networks |
| US20180260920A1 (en) | 2017-03-08 | 2018-09-13 | Nrg Energy, Inc. | Method and system for determining energy management strategies |
| US20180277246A1 (en) | 2017-03-24 | 2018-09-27 | Medtronic Minimed, Inc. | Patient data management systems and conversational interaction methods |
| US20180322951A1 (en) | 2015-11-03 | 2018-11-08 | Koninklijke Philips N.V. | Prediction of acute respiratory disease syndrome (ards) based on patients' physiological responses |
| US20180346151A1 (en) | 2017-05-30 | 2018-12-06 | The Boeing Company | Advanced analytic methods and systems utilizing trust-weighted machine learning models |
| US20180351972A1 (en) | 2017-05-31 | 2018-12-06 | Infoblox Inc. | Inline dga detection with deep networks |
| US10209974B1 (en) | 2017-12-04 | 2019-02-19 | Banjo, Inc | Automated model management methods |
| US20190087071A1 (en) * | 2017-09-17 | 2019-03-21 | Ge Inspection Technologies, Lp | Industrial asset intelligence |
| US20190112659A1 (en) | 2015-08-06 | 2019-04-18 | The University Of Utah Research Foundation | Methods of identifying male fertility status and embryo quality |
| US20190318266A1 (en) | 2016-11-09 | 2019-10-17 | Bioinfra Life Science Inc. | Two-class classification method for predicting class to which specific item belongs, and computing device using same |
| US20200004863A1 (en) | 2018-06-29 | 2020-01-02 | Accenture Global Solutions Limited | Management of extract transform load (etl) jobs via a model that is based on a bayesian network |
| US20200068759A1 (en) * | 2018-08-24 | 2020-02-27 | Rockwell Automation Technologies, Inc. | Nozzle performance analytics |
| US10586164B1 (en) | 2018-10-15 | 2020-03-10 | AIble Inc. | Interface for visualizing and improving model performance |
| US20200117765A1 (en) | 2018-10-15 | 2020-04-16 | AIble Inc. | Interface for visualizing and improving model performance |
| US20200117490A1 (en) | 2018-10-15 | 2020-04-16 | AIble Inc. | Interface for Generating Models with Customizable Interface Configurations |
| US20200160998A1 (en) | 2018-11-21 | 2020-05-21 | The Regents Of The University Of Michigan | Predicting Intensive Care Transfers And Other Unforeseen Events Using Machine Learning |
| US20200178875A1 (en) | 2016-05-04 | 2020-06-11 | Mensia Technologies | Predictive neuromarkers of alzheimer's disease |
| US20200199676A1 (en) | 2017-07-18 | 2020-06-25 | The Research Foundation For The State University Of New York | Biomarkers for intracranial aneurysm |
| US20200233315A1 (en) | 2017-03-27 | 2020-07-23 | Asml Netherlands B.V. | Optimizing an apparatus for multi-stage processing of product units |
| US10817647B1 (en) | 2017-10-26 | 2020-10-27 | Wells Fargo Bank, N.A. | Report automation system |
| US20200386762A1 (en) | 2017-01-18 | 2020-12-10 | Biocrates Life Sciences Ag | Metabolic biomarker set for assessing ovarian cancer |
| US20210113673A1 (en) | 2017-04-19 | 2021-04-22 | Gritstone Oncology, Inc. | Neoantigen Identification, Manufacture, and Use |
| US11227047B1 (en) | 2018-06-29 | 2022-01-18 | Fireeye Security Holdings Us Llc | System and method for improved end-to-end cybersecurity machine learning and deployment |
-
2018
- 2018-10-24 US US16/169,208 patent/US10586164B1/en active Active
- 2018-12-21 US US16/230,655 patent/US11429508B2/en active Active
- 2018-12-21 US US16/230,613 patent/US12061532B2/en active Active
-
2022
- 2022-07-13 US US17/812,246 patent/US11892932B2/en active Active
-
2023
- 2023-12-20 US US18/390,056 patent/US20240118986A1/en active Pending
-
2024
- 2024-08-09 US US18/799,674 patent/US20250045183A1/en active Pending
Patent Citations (65)
| Publication number | Priority date | Publication date | Assignee | Title |
|---|---|---|---|---|
| US20050234697A1 (en) | 2004-04-16 | 2005-10-20 | Pinto Stephen K | Predictive model management |
| US7797313B1 (en) | 2006-03-28 | 2010-09-14 | Symantec Operating Corporation | Relevance ranking in a computer system |
| US20070299833A1 (en) | 2006-06-21 | 2007-12-27 | Timo-Pekka Viljamaa | Network-based determination of user content preferences |
| US20100196941A1 (en) | 2007-07-30 | 2010-08-05 | The Regents Of The University Of Michigan | Multi-Analyte Analysis of Saliva Biomarkers as Predictors of Periodontal and Pre-Implant Disease |
| US20090299896A1 (en) | 2008-05-29 | 2009-12-03 | Mingyuan Zhang | Computer-Implemented Systems And Methods For Integrated Model Validation For Compliance And Credit Risk |
| US20100153330A1 (en) | 2008-12-12 | 2010-06-17 | Vitage Technologies Pvt. Ltd. | Proactive Information Technology Infrastructure Management |
| US20100205521A1 (en) | 2009-02-11 | 2010-08-12 | Microsoft Corporation | Displaying multiple row and column header areas in a summary table |
| US20110161857A1 (en) | 2009-12-30 | 2011-06-30 | Cerner Innovation, Inc. | Graphic for Displaying Multiple Assessments of Critical Care Performance |
| US20110225584A1 (en) | 2010-03-11 | 2011-09-15 | International Business Machines Corporation | Managing model building components of data analysis applications |
| US20110231499A1 (en) | 2010-03-22 | 2011-09-22 | Research In Motion Limited | Management and display of grouped messages on a communication device |
| US20120198342A1 (en) | 2011-01-28 | 2012-08-02 | International Business Machines Corporation | Automatic generation of task scripts from web browsing interaction history |
| US20130041860A1 (en) | 2011-08-10 | 2013-02-14 | International Business Machines Corporation | Predicting influence in social networks |
| US20130055268A1 (en) | 2011-08-31 | 2013-02-28 | International Business Machines Corporation | Automated web task procedures based on an analysis of actions in web browsing history logs |
| US20140315742A1 (en) | 2011-09-29 | 2014-10-23 | Meso Scale Technologies, Llc | Biodosimetry panels and methods |
| US20130198569A1 (en) | 2012-02-01 | 2013-08-01 | Empirix Inc. | Method of embedding configuration data in a non-configuration document |
| US20150039652A1 (en) | 2013-08-01 | 2015-02-05 | Alpha Beta Analytics, LLC | Systems and methods for automated analysis, screening and reporting of group performance |
| US20150039552A1 (en) | 2013-08-05 | 2015-02-05 | Applied Materials, Inc. | Method and apparatus for optimizing profit in predictive systems |
| US20150269244A1 (en) * | 2013-12-28 | 2015-09-24 | Evolv Inc. | Clustering analysis of retention probabilities |
| US20170184602A1 (en) | 2014-04-24 | 2017-06-29 | Pfizer Inc. | Cancer treatment |
| US20180046926A1 (en) | 2014-05-23 | 2018-02-15 | DataRobot, Inc. | Systems for time-series predictive data analytics, and related methods and apparatus |
| US20170368258A1 (en) | 2014-12-22 | 2017-12-28 | Medicus Engineering Aps | Closed-loop control of insulin infusion |
| US20160203509A1 (en) | 2015-01-14 | 2016-07-14 | Globys, Inc. | Churn Modeling Based On Subscriber Contextual And Behavioral Factors |
| US20160232457A1 (en) | 2015-02-11 | 2016-08-11 | Skytree, Inc. | User Interface for Unified Data Science Platform Including Management of Models, Experiments, Data Sets, Projects, Actions and Features |
| US20180080937A1 (en) | 2015-03-27 | 2018-03-22 | Deutsches Krebsforschungszentrum Stiftung des öffentlichen Rechts | Biomarker Panel For Diagnosing Cancer |
| US9336483B1 (en) | 2015-04-03 | 2016-05-10 | Pearson Education, Inc. | Dynamically updated neural network structures for content distribution networks |
| US20160350673A1 (en) | 2015-05-26 | 2016-12-01 | Oracle International Corporation | System and method providing automatic completion of task structures in a project plan |
| US20160350671A1 (en) | 2015-05-28 | 2016-12-01 | Predikto, Inc | Dynamically updated predictive modeling of systems and processes |
| US20160350870A1 (en) | 2015-05-29 | 2016-12-01 | Intuit Inc. | Method and system for identifying users who benefit from filing itemized deductions to reduce an average time consumed for users preparing tax returns with a tax return preparation system |
| US20160371601A1 (en) | 2015-06-18 | 2016-12-22 | International Business Machines Corporation | Quality-directed adaptive analytic retraining |
| US20170004584A1 (en) | 2015-06-30 | 2017-01-05 | Intuit Inc. | Systems, methods and articles for providing tax recommendations |
| US20190112659A1 (en) | 2015-08-06 | 2019-04-18 | The University Of Utah Research Foundation | Methods of identifying male fertility status and embryo quality |
| US20170090990A1 (en) * | 2015-09-25 | 2017-03-30 | Microsoft Technology Licensing, Llc | Modeling resource usage for a job |
| US20180322951A1 (en) | 2015-11-03 | 2018-11-08 | Koninklijke Philips N.V. | Prediction of acute respiratory disease syndrome (ards) based on patients' physiological responses |
| US20170148027A1 (en) | 2015-11-24 | 2017-05-25 | Vesta Corporation | Training and selection of multiple fraud detection models |
| US20200178875A1 (en) | 2016-05-04 | 2020-06-11 | Mensia Technologies | Predictive neuromarkers of alzheimer's disease |
| US20180046935A1 (en) | 2016-08-09 | 2018-02-15 | Microsoft Technology Licensing, Llc | Interactive performance visualization of multi-class classifier |
| US20180067118A1 (en) | 2016-09-02 | 2018-03-08 | Bioinfra Inc. | Method for using information on complex biomarker group to diagnose lung cancer in a subject and diagnostic kit and computing system using the same |
| US20190318266A1 (en) | 2016-11-09 | 2019-10-17 | Bioinfra Life Science Inc. | Two-class classification method for predicting class to which specific item belongs, and computing device using same |
| US20180137424A1 (en) * | 2016-11-17 | 2018-05-17 | General Electric Company | Methods and systems for identifying gaps in predictive model ontology |
| US20200386762A1 (en) | 2017-01-18 | 2020-12-10 | Biocrates Life Sciences Ag | Metabolic biomarker set for assessing ovarian cancer |
| US20180248905A1 (en) | 2017-02-24 | 2018-08-30 | Ciena Corporation | Systems and methods to detect abnormal behavior in networks |
| US20180260920A1 (en) | 2017-03-08 | 2018-09-13 | Nrg Energy, Inc. | Method and system for determining energy management strategies |
| US20180277246A1 (en) | 2017-03-24 | 2018-09-27 | Medtronic Minimed, Inc. | Patient data management systems and conversational interaction methods |
| US20200233315A1 (en) | 2017-03-27 | 2020-07-23 | Asml Netherlands B.V. | Optimizing an apparatus for multi-stage processing of product units |
| US20210113673A1 (en) | 2017-04-19 | 2021-04-22 | Gritstone Oncology, Inc. | Neoantigen Identification, Manufacture, and Use |
| US20180346151A1 (en) | 2017-05-30 | 2018-12-06 | The Boeing Company | Advanced analytic methods and systems utilizing trust-weighted machine learning models |
| US20180351972A1 (en) | 2017-05-31 | 2018-12-06 | Infoblox Inc. | Inline dga detection with deep networks |
| US20200199676A1 (en) | 2017-07-18 | 2020-06-25 | The Research Foundation For The State University Of New York | Biomarkers for intracranial aneurysm |
| US20190087071A1 (en) * | 2017-09-17 | 2019-03-21 | Ge Inspection Technologies, Lp | Industrial asset intelligence |
| US10817647B1 (en) | 2017-10-26 | 2020-10-27 | Wells Fargo Bank, N.A. | Report automation system |
| US10209974B1 (en) | 2017-12-04 | 2019-02-19 | Banjo, Inc | Automated model management methods |
| US11227047B1 (en) | 2018-06-29 | 2022-01-18 | Fireeye Security Holdings Us Llc | System and method for improved end-to-end cybersecurity machine learning and deployment |
| US20200004863A1 (en) | 2018-06-29 | 2020-01-02 | Accenture Global Solutions Limited | Management of extract transform load (etl) jobs via a model that is based on a bayesian network |
| US20200068759A1 (en) * | 2018-08-24 | 2020-02-27 | Rockwell Automation Technologies, Inc. | Nozzle performance analytics |
| US10936768B2 (en) | 2018-10-15 | 2021-03-02 | Aible, Inc. | Interface for visualizing and improving model performance |
| US20200117490A1 (en) | 2018-10-15 | 2020-04-16 | AIble Inc. | Interface for Generating Models with Customizable Interface Configurations |
| US20200117765A1 (en) | 2018-10-15 | 2020-04-16 | AIble Inc. | Interface for visualizing and improving model performance |
| US20200118019A1 (en) | 2018-10-15 | 2020-04-16 | AIble Inc. | Interface for Visualizing and Improving Model Performance |
| US20210141976A1 (en) | 2018-10-15 | 2021-05-13 | AIble Inc. | Interface for visualizing and improving model performance |
| US10586164B1 (en) | 2018-10-15 | 2020-03-10 | AIble Inc. | Interface for visualizing and improving model performance |
| US11409549B2 (en) | 2018-10-15 | 2022-08-09 | AIble Inc. | Interface for generating models with customizable interface configurations |
| US11429508B2 (en) | 2018-10-15 | 2022-08-30 | AIble Inc. | Interface for visualizing and improving model performance |
| US20220308904A1 (en) | 2018-10-15 | 2022-09-29 | AIble Inc. | Interface for generating models with customizable interface configurations |
| US20220342793A1 (en) | 2018-10-15 | 2022-10-27 | AIble Inc. | Interface for visualizing and improving model performance |
| US20200160998A1 (en) | 2018-11-21 | 2020-05-21 | The Regents Of The University Of Michigan | Predicting Intensive Care Transfers And Other Unforeseen Events Using Machine Learning |
Non-Patent Citations (1)
| Title |
|---|
| Drummond et al. (2000) "Explicitly Representing Expected Cost: An Alternative to ROC Representation", Proceedings of the sixth ACM SIGKDD international conference on Knowledge discovery and data mining, 10 pages. |
Also Published As
| Publication number | Publication date |
|---|---|
| US20240118986A1 (en) | 2024-04-11 |
| US11429508B2 (en) | 2022-08-30 |
| US20200118018A1 (en) | 2020-04-16 |
| US20200118019A1 (en) | 2020-04-16 |
| US11892932B2 (en) | 2024-02-06 |
| US20220342793A1 (en) | 2022-10-27 |
| US10586164B1 (en) | 2020-03-10 |
| US20250045183A1 (en) | 2025-02-06 |
Similar Documents
| Publication | Publication Date | Title |
|---|---|---|
| US11892932B2 (en) | Interface for visualizing and improving model performance | |
| US12511139B2 (en) | Interface for generating models with customizable interface configurations | |
| US10936768B2 (en) | Interface for visualizing and improving model performance | |
| CN113614757B (en) | System and method for human-machine hybrid prediction of events | |
| CN112085205B (en) | Method and system for automatically training machine learning model | |
| US8990145B2 (en) | Probabilistic data mining model comparison | |
| US11527313B1 (en) | Computer network architecture with machine learning and artificial intelligence and care groupings | |
| US20240289876A1 (en) | Systems and methods for automatically generated digital predictive insights for user interfaces | |
| US11436434B2 (en) | Machine learning techniques to identify predictive features and predictive values for each feature | |
| US20190102361A1 (en) | Automatically detecting and managing anomalies in statistical models | |
| EP4024203B1 (en) | System performance optimization | |
| US12299427B1 (en) | Generating degree of development of structured processes using automatically calibrated queries | |
| US12566976B2 (en) | Machine learning system for forecasting customer demand | |
| US20250284761A1 (en) | Apparatus and a method for the identification of dynamic sub-targets | |
| Saif | Software Effort Estimation for Successful Software Application Development | |
| US20190236473A1 (en) | Autonomous Hybrid Analytics Modeling Platform | |
| US11829918B2 (en) | Automatically learning process characteristics for model optimization | |
| US12386639B1 (en) | Apparatus and method for dynamic generation of visual elements in a user-interface | |
| US12443967B2 (en) | Apparatus and methods for high-order system growth modeling | |
| Geetha et al. | XGBoost-Based Predictive Analytics for Employee Retention in Large Organizations | |
| WO2025080778A1 (en) | Dynamic visualization for the performance evaluation of machine learning models and any other type of predictive model | |
| US20220284368A1 (en) | Automatically Learning Process Characteristics for Model Optimization | |
| ANTHONYSAMY | CUSTOMER CHURN LIKELIHOOD PREDICTION FOR TELECOMMUNICATION SERVICES USING MACHINE LEARNING |
Legal Events
| Date | Code | Title | Description |
|---|---|---|---|
| FEPP | Fee payment procedure |
Free format text: ENTITY STATUS SET TO UNDISCOUNTED (ORIGINAL EVENT CODE: BIG.); ENTITY STATUS OF PATENT OWNER: SMALL ENTITY |
|
| AS | Assignment |
Owner name: AIBLE INC., CALIFORNIA Free format text: ASSIGNMENT OF ASSIGNORS INTEREST;ASSIGNORS:SENGUPTA, ARIJIT;WRAY, JONATHAN;NUDELMAN, GRIGORY;AND OTHERS;SIGNING DATES FROM 20181105 TO 20181123;REEL/FRAME:047881/0333 |
|
| FEPP | Fee payment procedure |
Free format text: ENTITY STATUS SET TO SMALL (ORIGINAL EVENT CODE: SMAL); ENTITY STATUS OF PATENT OWNER: SMALL ENTITY |
|
| STPP | Information on status: patent application and granting procedure in general |
Free format text: DOCKETED NEW CASE - READY FOR EXAMINATION |
|
| STPP | Information on status: patent application and granting procedure in general |
Free format text: NON FINAL ACTION MAILED |
|
| STPP | Information on status: patent application and granting procedure in general |
Free format text: RESPONSE TO NON-FINAL OFFICE ACTION ENTERED AND FORWARDED TO EXAMINER |
|
| STPP | Information on status: patent application and granting procedure in general |
Free format text: FINAL REJECTION MAILED |
|
| STPP | Information on status: patent application and granting procedure in general |
Free format text: RESPONSE AFTER FINAL ACTION FORWARDED TO EXAMINER |
|
| STPP | Information on status: patent application and granting procedure in general |
Free format text: NOTICE OF ALLOWANCE MAILED -- APPLICATION RECEIVED IN OFFICE OF PUBLICATIONS |
|
| ZAAA | Notice of allowance and fees due |
Free format text: ORIGINAL CODE: NOA |
|
| ZAAB | Notice of allowance mailed |
Free format text: ORIGINAL CODE: MN/=. |
|
| STPP | Information on status: patent application and granting procedure in general |
Free format text: AWAITING TC RESP., ISSUE FEE NOT PAID |
|
| STPP | Information on status: patent application and granting procedure in general |
Free format text: PUBLICATIONS -- ISSUE FEE PAYMENT RECEIVED |
|
| STPP | Information on status: patent application and granting procedure in general |
Free format text: PUBLICATIONS -- ISSUE FEE PAYMENT VERIFIED |
|
| STCF | Information on status: patent grant |
Free format text: PATENTED CASE |