US12016701B2 - Quantitative differentiation of tumor heterogeneity using diffusion MR imaging data - Google Patents
Quantitative differentiation of tumor heterogeneity using diffusion MR imaging data Download PDFInfo
- Publication number
- US12016701B2 US12016701B2 US16/329,608 US201716329608A US12016701B2 US 12016701 B2 US12016701 B2 US 12016701B2 US 201716329608 A US201716329608 A US 201716329608A US 12016701 B2 US12016701 B2 US 12016701B2
- Authority
- US
- United States
- Prior art keywords
- grade
- tumor
- diffusion
- spectrum
- adc
- Prior art date
- Legal status (The legal status is an assumption and is not a legal conclusion. Google has not performed a legal analysis and makes no representation as to the accuracy of the status listed.)
- Active, expires
Links
Images


Classifications
-
- A—HUMAN NECESSITIES
- A61—MEDICAL OR VETERINARY SCIENCE; HYGIENE
- A61B—DIAGNOSIS; SURGERY; IDENTIFICATION
- A61B5/00—Measuring for diagnostic purposes; Identification of persons
- A61B5/48—Other medical applications
- A61B5/4887—Locating particular structures in or on the body
-
- A—HUMAN NECESSITIES
- A61—MEDICAL OR VETERINARY SCIENCE; HYGIENE
- A61B—DIAGNOSIS; SURGERY; IDENTIFICATION
- A61B5/00—Measuring for diagnostic purposes; Identification of persons
- A61B5/0033—Features or image-related aspects of imaging apparatus, e.g. for MRI, optical tomography or impedance tomography apparatus; Arrangements of imaging apparatus in a room
- A61B5/004—Features or image-related aspects of imaging apparatus, e.g. for MRI, optical tomography or impedance tomography apparatus; Arrangements of imaging apparatus in a room adapted for image acquisition of a particular organ or body part
-
- A—HUMAN NECESSITIES
- A61—MEDICAL OR VETERINARY SCIENCE; HYGIENE
- A61B—DIAGNOSIS; SURGERY; IDENTIFICATION
- A61B5/00—Measuring for diagnostic purposes; Identification of persons
- A61B5/05—Detecting, measuring or recording for diagnosis by means of electric currents or magnetic fields; Measuring using microwaves or radio waves
- A61B5/055—Detecting, measuring or recording for diagnosis by means of electric currents or magnetic fields; Measuring using microwaves or radio waves involving electronic [EMR] or nuclear [NMR] magnetic resonance, e.g. magnetic resonance imaging
-
- A—HUMAN NECESSITIES
- A61—MEDICAL OR VETERINARY SCIENCE; HYGIENE
- A61B—DIAGNOSIS; SURGERY; IDENTIFICATION
- A61B5/00—Measuring for diagnostic purposes; Identification of persons
- A61B5/72—Signal processing specially adapted for physiological signals or for diagnostic purposes
- A61B5/7235—Details of waveform analysis
- A61B5/7264—Classification of physiological signals or data, e.g. using neural networks, statistical classifiers, expert systems or fuzzy systems
-
- A—HUMAN NECESSITIES
- A61—MEDICAL OR VETERINARY SCIENCE; HYGIENE
- A61B—DIAGNOSIS; SURGERY; IDENTIFICATION
- A61B5/00—Measuring for diagnostic purposes; Identification of persons
- A61B5/72—Signal processing specially adapted for physiological signals or for diagnostic purposes
- A61B5/7271—Specific aspects of physiological measurement analysis
-
- A—HUMAN NECESSITIES
- A61—MEDICAL OR VETERINARY SCIENCE; HYGIENE
- A61B—DIAGNOSIS; SURGERY; IDENTIFICATION
- A61B5/00—Measuring for diagnostic purposes; Identification of persons
- A61B5/74—Details of notification to user or communication with user or patient; User input means
- A61B5/742—Details of notification to user or communication with user or patient; User input means using visual displays
- A61B5/743—Displaying an image simultaneously with additional graphical information, e.g. symbols, charts, function plots
-
- G—PHYSICS
- G01—MEASURING; TESTING
- G01R—MEASURING ELECTRIC VARIABLES; MEASURING MAGNETIC VARIABLES
- G01R33/00—Arrangements or instruments for measuring magnetic variables
- G01R33/20—Arrangements or instruments for measuring magnetic variables involving magnetic resonance
- G01R33/44—Arrangements or instruments for measuring magnetic variables involving magnetic resonance using nuclear magnetic resonance [NMR]
- G01R33/48—NMR imaging systems
- G01R33/54—Signal processing systems, e.g. using pulse sequences ; Generation or control of pulse sequences; Operator console
- G01R33/56—Image enhancement or correction, e.g. subtraction or averaging techniques, e.g. improvement of signal-to-noise ratio and resolution
- G01R33/5602—Image enhancement or correction, e.g. subtraction or averaging techniques, e.g. improvement of signal-to-noise ratio and resolution by filtering or weighting based on different relaxation times within the sample, e.g. T1 weighting using an inversion pulse
-
- G—PHYSICS
- G01—MEASURING; TESTING
- G01R—MEASURING ELECTRIC VARIABLES; MEASURING MAGNETIC VARIABLES
- G01R33/00—Arrangements or instruments for measuring magnetic variables
- G01R33/20—Arrangements or instruments for measuring magnetic variables involving magnetic resonance
- G01R33/44—Arrangements or instruments for measuring magnetic variables involving magnetic resonance using nuclear magnetic resonance [NMR]
- G01R33/48—NMR imaging systems
- G01R33/54—Signal processing systems, e.g. using pulse sequences ; Generation or control of pulse sequences; Operator console
- G01R33/56—Image enhancement or correction, e.g. subtraction or averaging techniques, e.g. improvement of signal-to-noise ratio and resolution
- G01R33/563—Image enhancement or correction, e.g. subtraction or averaging techniques, e.g. improvement of signal-to-noise ratio and resolution of moving material, e.g. flow contrast angiography
- G01R33/56341—Diffusion imaging
-
- G—PHYSICS
- G16—INFORMATION AND COMMUNICATION TECHNOLOGY [ICT] SPECIALLY ADAPTED FOR SPECIFIC APPLICATION FIELDS
- G16H—HEALTHCARE INFORMATICS, i.e. INFORMATION AND COMMUNICATION TECHNOLOGY [ICT] SPECIALLY ADAPTED FOR THE HANDLING OR PROCESSING OF MEDICAL OR HEALTHCARE DATA
- G16H50/00—ICT specially adapted for medical diagnosis, medical simulation or medical data mining; ICT specially adapted for detecting, monitoring or modelling epidemics or pandemics
- G16H50/20—ICT specially adapted for medical diagnosis, medical simulation or medical data mining; ICT specially adapted for detecting, monitoring or modelling epidemics or pandemics for computer-aided diagnosis, e.g. based on medical expert systems
Definitions
- the present disclosure generally relates to methods for imaging and diagnosing tumors using diffusion basis spectrum imaging MRI with extended isotropic spectrum (DBSI-EIS). More particularly, the disclosure related to quantitatively differentiating tumor heterogeneity using DBSI-EIS.
- DBSI-EIS diffusion basis spectrum imaging MRI with extended isotropic spectrum
- Existing standards of care for diagnosing many tumors includes MRI imaging to identify general characterizing features of the lesion or tumor, including the location, size, and extent of the tumor.
- the MRI visualization is followed by a biopsy to better characterize the cells and other structures associated with the tumor including grade(s) of tumor cells, vascularization of the tumor, and the heterogeneity of the tumor cells.
- the biopsy may provide information used to inform an appropriate course of treatment.
- the tumor may be positioned within close proximity to delicate structures and as a result may not be amenable to biopsy.
- the tumor may be positioned deep within the brain beneath brain tissues associated with important cognitive function. Because the insertion of a biopsy needle into a tumor so located would potentially result in significant brain damage to the patient, other diagnostic tools may be used instead of biopsy.
- PET imaging such as fluoradopa (FDOPA) PET imaging using to image brain tumors.
- FDOPA fluoradopa
- PET tracers intrinsically intrude radiation into the patient, may be challenging to introduce across the blood brain barrier into the brain of a patient.
- PET tracers are designed to bind specifically to particular cell types, and may provide an incomplete visualization due to the heterogeneity of tumor cell types within some tumors.
- a non-invasive imaging method for tumors that includes non-radiative and multiple contrast features will provide a tool to enhance the standard of care for tumor patients.
- DBSI diffusion basis spectrum imaging
- FIG. 1 is an illustration of diffusion magnetic resonance (MR) signal response when diffusion tensor imaging (DTI) is applied to a single white matter tract of coherent axonal fibers.
- MR diffusion magnetic resonance
- FIG. 2 is an illustration of exemplary DTI results corresponding to scenarios in which different tissue components are included within a scanned volume.
- FIG. 3 A is a flowchart of an exemplary noninvasive process to quantify complex CNS white matter pathology.
- FIGS. 3 B and 3 C are a flowchart of an exemplary method for determining diffusivities of fibers and isotropic components within a tissue.
- FIG. 4 A is a 2D illustration of the design of an exemplary 99-direction diffusion-weighting scheme, where each diffusion-weighting direction is selected based on the grid point location.
- FIG. 4 B is a 3D model of the design of an exemplary 99-direction diffusion-weighting scheme, where each diffusion-weighting direction is selected based on the 3D grid locations.
- FIG. 5 is an illustration of an exemplary diffusion basis set for DBSI.
- FIG. 6 is an illustration of an exemplary optimization process of DBSI basis set.
- FIG. 7 A is an illustration of determining the number of fibers and primary directions of candidate fibers using DBSI for a single fiber tract.
- FIG. 7 B is an illustration of determining the number of fibers and primary directions of candidate fibers using DBSI for a two-fiber 170 tract.
- FIG. 8 is an illustration of an exemplar optimization process for determining the directional diffusivity of each candidate fiber, isotropic components and corresponding volume ratios using DBSI.
- FIG. 9 is an image of diffusion basis spectrum imaging (DBSI) results reflecting demyelination as increased radial diffusivity in the presence of axonal injury, and inflammation in contrast to the failure of DTI to detect the pathology.
- DBSI diffusion basis spectrum imaging
- FIG. 10 is a graph of myelin basic protein in a MBP-positive area derived from DBSI of FIG. 9 .
- FIG. 11 is a graph of the radial diffusivity derived using DBSI of FIG. 9 .
- FIG. 12 is an image of DBSI results detecting axonal injury in the presence of demyelination and inflammation.
- FIG. 13 is a graph of the axial diffusivity of the DBSI of FIG. 12 .
- FIG. 15 is a graph of axonal fiber tract density was also derived using DBSI expressing as volume ratio of the DBSI of FIG. 12 .
- FIG. 17 is a graph of the percentage of inflammatory cell infiltration thought to be in the cells of the illustration of FIG. 16 .
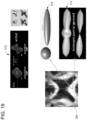
- FIG. 18 is an exemplary phantom of mouse trigeminal nerves embedded in gel with known in vivo DTI character.
- FIG. 19 is a comparison of diffusion spectrum imaging (DSI) and DBSI from a human subject.
- FIG. 20 is a diffusion tensor imaging (DTI) for mouse trigeminal nerve embedded in gel.
- FIG. 21 is a DBSI for mouse trigeminal nerve embedded in gel.
- FIG. 22 is an illustration of heterogeneous pathology within one image voxel of interested white matter lesion.
- FIG. 23 is an illustration of conventional invasive histology.
- FIG. 24 A is a detailed view of the DBSI-derived MBP fraction of the scan of FIG. 22 .
- FIG. 24 B is a detailed view of the DBSI-derived SMI-31 fraction of the scan of FIG. 22 .
- FIG. 24 C is a detailed view of the DBSI-derived DAPI fraction of the scan of FIG. 22 .
- FIG. 24 D is a detailed view of the DBSI-derived water fraction of the scan of FIG. 22 .
- FIG. 25 is a detailed view of the DBSI-derived MBP fraction of the scan of FIG. 22 in the center surrounded by conventional invasive histology images from five selected regions.
- FIG. 26 is a detailed view of the DBSI-derived SMI-31 intensity of the scan of FIG. 22 in the center surrounded by conventional invasive histology images from five selected regions.
- FIG. 27 is a detailed view of the DBSI-derived DAPI intensity of the scan of FIG. 22 in the center surrounded by conventional invasive histology images from five selected regions.
- FIG. 28 A is a view of a DAPI staining of a fixed mouse trigeminal nerve and a comparison of isotropic diffusion spectra with gel.
- FIG. 28 B is a view of a SMI-31 staining of a fixed mouse trigeminal nerve and a comparison of isotropic diffusion spectra with gel.
- FIG. 29 is a graph of the nucleus and axon counts by IHC of FIG. 28 B .
- FIG. 30 is a graph of the DBSI derived cell percentage and fiber percentage of FIG. 28 B .
- FIG. 31 is an illustration of a typical DBSI-derived spectrum of isotropic diffusivity from a fixed mouse trigeminal nerve juxtaposed with gel.
- FIG. 32 is a comparison of DBSI-derived gel fractions to those measured by T2W MRI signal intensity.
- FIG. 33 is a graph of ⁇ ⁇ derived from trigeminal nerves with and without gel.
- FIG. 34 is a graph of ⁇ ⁇ derived from trigeminal nerves with and without gel.
- FIG. 35 is an illustration of six fixed trigeminal nerves grouped into three pairs of crossing fibers at 32°, 58°, and 91° juxtaposed with 2% agarose gel.
- FIG. 36 is an illustration of a three-fiber crossing phantom forming a triangle.
- FIG. 37 A is a graph of an axial diffusivity ⁇ 1 ⁇ of a first fiber.
- FIG. 37 B is a graph of a volume ratio f 2 of a second fiber.
- FIG. 37 C is a graph of axial diffusivity ⁇ 2 ⁇ of the second fiber.
- FIG. 37 D is a graph of radial diffusivity ⁇ 2 ⁇ of the second fiber.
- FIG. 38 A is an MC-simulation-derived graph displaying fiber ratio, water ratio, cell ratio, cell ADC, and fiber radial diffusivity of diffusion MRI data generated in silico.
- FIG. 38 B is an MC-simulation-derived graph displaying fiber axial diffusivity, water ADC of diffusion MRI data generated in silico.
- FIG. 39 is a CRLB based optimization of a one-fiber and a two-isotropic compartments diffusion model.
- FIG. 40 A is an illustration of the DTI signature of a normal axon.
- FIG. 40 B is an illustration of the DTI signature of myelin damage.
- FIG. 40 C is an illustration of the DTI signature of axonal injury.
- FIG. 40 D is an illustration of the DTI signature of axonal injury and myelin damage.
- FIG. 40 E is an illustration of the DTI signature of cells.
- FIG. 40 F is an illustration of the DTI signature of tissue loss.
- FIG. 41 is an illustration of the procedure to calculate individual pathology maps.
- FIG. 42 is an image of in vivo DBSI derived ⁇ ⁇ , ⁇ ⁇ , and cell fraction maps of mice from each time point with the corresponding axon (SMI-31), myelin (MBP), and nucleus (DAPI) staining.
- SI-31 axon
- MBP myelin
- DAPI nucleus
- FIG. 43 is a cross-sectional time course of in vivo DBSI derived ⁇ ⁇ from B6-EAE mice at baseline (control), onset, peak, and chronic disease states.
- FIG. 44 is a cross-sectional time course of in vivo DBSI derived ⁇ ⁇ from B6-EAE mice at baseline (control), onset, peak, and chronic disease states.
- FIG. 45 is a cross-sectional time course of in vivo DBSI derived cell intensity percentage from B6-EAE mice at baseline (control), onset, peak, and chronic disease states.
- FIG. 46 is a cross-sectional time course of in vivo DBSI derived water intensity percentage from B6-EAE mice at baseline (control), onset, peak, and chronic disease states.
- FIG. 47 is an ex vivo DBSI of a human MS autopsy spinal cord specimen.
- FIG. 48 is ex vivo histology images of a human MS autopsy spinal cord specimen.
- FIG. 49 is T1W MRI images of mouse spinal cords.
- FIG. 50 is a quantitative analysis of a percentage enhancement map of FIG. 49 .
- FIG. 51 is a schematic block diagram of an MRI system in one aspect.
- FIG. 52 is a schematic block diagram of an example server system.
- FIG. 53 is a block diagram of an example computing device.
- FIG. 54 is a flow chart illustrating a modified DBSI imaging method in one aspect.
- FIG. 55 is a graph summarizing the isotropic diffusion spectrum and structures associated with isotropic diffusion within various ranges of ADC on the isotropic diffusion spectrum.
- FIG. 56 is a flowchart summarizing a machine learning method of identifying isotropic spectrum signals in one aspect.
- FIG. 57 contains images of a patient using perfusion imaging, FLAIR imaging, and T1 MRI imaging with Gd contrast.
- FIG. 58 contains images of a patient using FDOPA PET imaging.
- FIG. 59 contains a series of DBSI-EIS images with contrast corresponding to grade of brain tumor cell and a corresponding FDOPA PET image of a patient.
- FIG. 60 contains a series of perfusion images comparing DBSI-EIS and DSC perfusion imaging.
- FIG. 61 contains images of a patient using perfusion imaging, FLAIR imaging, FDOPA PET imaging, and T1 MRI imaging with Gd contrast.
- FIG. 62 contains a series of DBSI-EIS images with contrast based on BO, as well as the isotropic spectrum signals for cellularity and perfusion.
- FIG. 63 contains a series of DBSI-EIS images of a patient with contrast corresponding to grade of brain tumor cell.
- FIG. 64 contains images of a patient using perfusion imaging, FLAIR imaging, FDOPA PET imaging, and ADC contrast imaging.
- FIG. 65 is a series of DBSI images of a patient.
- FIG. 66 contains a series of DBSI-EIS images of a patient with contrast corresponding to grade of brain tumor cell.
- FIG. 67 is a graph summarizing mean SUVbw as a function of frame time.
- FIG. 68 contains images of a patient using perfusion imaging, FLAIR imaging, and FDOPA PET imaging.
- FIG. 69 contains additional images of a patient of FIG. 68 using FLAIR imaging and FDOPA PET imaging.
- FIG. 70 contains a series of DBSI-EIS images of a patient with contrast corresponding to grade of brain tumor cell.
- FIG. 71 contains images of a patient using perfusion imaging, FLAIR imaging, FDOPA PET imaging, and T1 MRI imaging with Gd contrast.
- FIG. 72 is a series of DBSI images of a patient.
- FIG. 73 contains a series of DBSI-EIS images of a patient with contrast corresponding to grade of brain tumor cell.
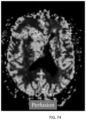
- FIG. 74 contains a perfusion image of a patient.
- FIG. 75 contains images of a patient using FLAIR imaging and FDOPA PET imaging.
- FIG. 76 contains a series of DBSI-EIS images of a patient with contrast corresponding to grade of brain tumor cell.
- FIG. 77 is a display of a series of DBSI-EIS images of a patient in a movie-type GUI format.
- FIG. 78 A is a block diagram of DBSI-EIS, or neuro-immune imaging (NII).
- FIG. 78 B is a sample graph the isotropic spectrum with isotropic ADC values for various signals.
- FIG. 79 is a graph showing the ADC values of tumor cells, such as Glioma grade 4, Glioma grade 3, Glioma grade 2, and extracellular water.
- FIG. 80 A is an FDOPA image showing heterogeneous 3D spatial distributions for Glioma tumor cells.
- FIG. 80 B is a DBSI-EIS image showing heterogeneous 3D spatial distributions for Glioma grade 2 tumor cells and DBSI-EIS tumor cell fraction.
- FIG. 80 C is a DBSI-EIS image showing heterogeneous 3D spatial distributions for Glioma grade 3 tumor cells and DBSI-EIS tumor cell fraction.
- FIG. 80 D is a DBSI-EIS image showing heterogeneous 3D spatial distributions for Glioma grade 4 tumor cells and DBSI-EIS tumor cell fraction.
- FIG. 81 A is a 3D spatial distribution for all grades.
- FIG. 81 B is a DBSI-EIS perfusion 3D distribution.
- FIG. 82 A is an FDOPA image of a patient with an oligodendroglioma WHO grade II.
- FIG. 82 B is a FLAIR image of the patient of FIG. 82 A with an oligodendroglioma WHO grade II.
- FIG. 83 A is a DBSI-EIS grade 2 image of the patient of FIG. 82 A .
- FIG. 83 B is a DBSI-EIS grade 3 image of the patient of FIG. 82 A .
- FIG. 83 C is a DBSI-EIS grade 4 image of the patient of FIG. 82 A .
- FIG. 84 shows DBSI-EIS-derived tumor grade ratios for low grade gliomas for several patients.
- FIG. 85 A is a DBSI-EIS grade 2 image of a patient with an oligodendroglioma WHO grade III.
- FIG. 85 B is a DBSI-EIS grade 3 image of the patient of FIG. 85 A .
- FIG. 85 C is a DBSI-EIS grade 4 image of the patient of FIG. 85 A .
- FIG. 86 A is a DBSI-EIS grade 2 image of a patient with a glioblastoma WHO grade IV.
- FIG. 86 B is a DBSI-EIS grade 3 image of the patient of FIG. 86 A .
- FIG. 86 C is a DBSI-EIS grade 4 image of the patient of FIG. 86 A .
- FIG. 87 shows DBSI-EIS-derived tumor grade ratios for high grade gliomas for several patients.
- FIG. 88 A is an FDOPA image of the patient of FIG. 82 A with an oligodendroglioma WHO grade II.
- FIG. 88 B is a FLAIR image of the patient of FIG. 82 A .
- FIG. 88 C is a DSC perfusion image of the patient of FIG. 82 A .
- FIG. 88 D is a DBSI-EIS perfusion image of the patient of FIG. 82 A .
- FIG. 89 A is an FDOPA image of the patient of FIG. 85 A with an oligodendroglioma WHO grade III.
- FIG. 89 B is a FLAIR image of the patient of FIG. 85 A.
- FIG. 89 C is a DSC perfusion image of the patient of FIG. 85 A .
- FIG. 89 D is a DBSI-EIS perfusion image of the patient of FIG. 85 A .
- FIG. 90 A is an FDOPA image of the patient of FIG. 86 A with an oligodendroglioma WHO grade IV.
- FIG. 90 B is a FLAIR image of the patient of FIG. 86 A .
- FIG. 90 C is a DSC perfusion image of the patient of FIG. 86 A .
- FIG. 90 D is a DBSI-EIS perfusion image of the patient of FIG. 86 A .
- FIG. 91 is a graph showing how DBSI-EIS derived perfusion fraction correlates to DSC CBV.
- MRI magnetic resonance imaging
- DBSI diffusion basis spectrum imaging
- dMRI diffusion MRI
- DTI diffusion tensor imaging
- ADC apparent diffusion coefficient
- mDBSI modified DBSI
- H&E staining haemotoxylin and eosin staining
- DWI diffusion-weighted imaging
- DCE Dynamic Contrast Enhanced Imaging
- T1W T1-weighted imaging
- T2W T2-weighted imaging.
- the following discussion relates generally to magnetic resonance imaging (MRI) and, more particularly, to diffusion magnetic resonance data provided by an MRI scanner.
- MRI magnetic resonance imaging
- the following discussion relates generally to magnetic resonance imaging (MRI) and, more particularly, to diffusion magnetic resonance data provided by an MRI scanner.
- MRI magnetic resonance imaging
- CNS white matter neuropathology has been derived typically from occasional biopsies consisting of small tissue samples of unusual cases. These autopsies usually derive from patients with end-stage disease and often have long postmortem delay artifacts due tissue degradation. It is therefore advantageous to have a noninvasive imaging tool to accurately quantify and better understand the chronic and non-fatal injury in CNS disease during the whole course of the individual patient.
- DTI Diffusion tensor imaging
- a diffusion MRI technique is discussed herein to noninvasively study and quantify complicated CNS diseases in a noninvasive fashion without the limitation of invasive histological examinations.
- Such embodiments facilitate improved results compared to diffusion tensor imaging (DTI).
- DTI diffusion tensor imaging
- the directional diffusivities derived from DTI measurements describe water movement parallel to ( ⁇ 11 , axial diffusivity) and perpendicular to ( ⁇ L , radial diffusivity) axonal tracts. It was previously proposed and validated that decreased ⁇ 11 is associated with axonal injury and dysfunction, and increased ⁇ L is associated with myelin injury in mouse models of white matter injury.
- the presence of inflammation, edema, or gliosis during CNS white matter injury may impact the DTI measurement.
- inflammation is the resulting isotropic component of diffusion, due to the increased extracellular water and the infiltrating immune cells. This component complicates the DTI measurements and distorts the estimated directional diffusivity and anisotropy preventing its accurate interpretation of underlying pathologies.
- similar isotropic diffusion tensor component may result from the loss of CNS tissues in the chronic MS lesions, spinal cord injury (SCI), or traumatic brain injury (TBI).
- SCI spinal cord injury
- TBI traumatic brain injury
- the currently used DTI protocol is not able to resolve this isotropic component or differentiate inflammation from tissue loss. Only an averaged diffusion tensor reflecting the overall effect can be obtained from existing DTI methods.
- DTI fails to (1) correctly describe axonal fiber directions in crossing white matter tracts, or (2) accurately reflect the complex white matter pathologies such as vasogenic edema, inflammation, and tissue loss commonly coexisting with axonal and myelin damages. Even recently developed existing systems are not capable of resolving white matter pathologies in complex tissue scenarios.
- a noninvasive process based on diffusion MRI technique is described herein to facilitate accurately quantifying the complex human CNS white matter pathology where the current DTI and its relevant improvements have failed.
- diffusion basis spectrum imaging DBSI
- the quantity and primary direction of diffusion tensor components within a tissue volume resulting from white matter pathology is determined using diffusion MRI before constructing the multi-tensor model. After the identification of each diffusion tensor component corresponding to individual pathology, the diffusivity and volume ratio of each component can be derived accordingly.
- the quantity of candidate fibers and their associated primary directions are calculated first by DBSI based on a combination of diffusion basis set best describing the measured diffusion magnetic resonance data.
- An isotropic diffusion component is also considered to improve the computation accuracy.
- DBSI is used to compute the axial diffusivity, indicating water diffusion parallel to the fiber, and radial diffusivity, indicating water diffusion perpendicular to the fiber.
- a diffusivity spectrum of isotropic diffusion components, such as those resulting from inflammation or tissue loss, as well as associated volume ratios of all candidate fibers and isotropic components may be calculated.
- An exemplary embodiment employs diffusion basis spectrum imaging (DBSI) to facilitate an accurate diagnosis of CNS white matter pathology.
- DBSI diffusion basis spectrum imaging
- Each diffusion tensor's directional diffusivity as well as its primary orientation is derived using the less stringent diffusion tensor acquisition schemes retaining DTI's applicability in clinical settings.
- Preliminary data in mouse corpus callosum, spinal cord injury, and phantoms demonstrates that DBSI is capable of identifying different underlying pathologies accurately estimating the extent of cell infiltration, axonal fiber density in corpus callosum of cuprizone treatment, as well as estimating tissue loss in chronic mouse spinal cord injury.
- Diffusion phantoms have also been designed and fabricated for a quantitative evaluation of DBSI and existing DTI methods.
- the exemplary embodiment of diffusion MRI described herein resolves the multi-tensor complication resulting from diverse pathologies in CNS white matter to quantitatively derive diffusion parameters of crossing fibers as well as reflecting the actual pathologies.
- This unique capability of the proposed process and the exemplary DBSI method has the potential to differentiate acute inflammation from chronic tissue loss in patients. Such capability can estimate the extent of acute inflammation guiding the use of anti-inflammatory treatment and chronic tissue damage guiding the effort in axonal/neuronal preservation.
- There are many potential clinical applications of the proposed process For example, it can document the efficacy of stem cell treatment in axonal regeneration by clearly estimating the isotropic component of the implanted cells while reflecting the axonal regeneration by quantifying the anisotropic component changes after cell transplantation.
- DBSI could be applied in clinical drug trial treating CNS diseases, tumors, and injury by accurately reflecting the progression of clinical and preclinical pathologies.
- DTI DTI-induced diffusion anisotropy of CNS tissues for a detailed description of the underlying tissue injury based on the changed diffusion character.
- DTI diffusion anisotropy of CNS tissues for a detailed description of the underlying tissue injury based on the changed diffusion character.
- measurement is not always obtainable in diseased tissues due to the complicated cellular responses to the pathology or the presence of crossing fibers.
- DTI 10 The fundamental operation of DTI 10 can be explained by examining an MRI signal 12 under the influence of diffusion weighting gradients 14 .
- the MRI signal response can be expressed as shown in FIG. 1 .
- DTI assumes that there is only a pure coherent axonal fiber tract in the measured tissue and the signal response to diffusion weighting gradients is well described by the diffusion weighted (DW) profile.
- the insufficiency of DTI can be demonstrated by examining the diffusion ellipsoid responding to the different tissue components that typically seen in CNS tissues with and without pathology, as shown in FIG. 2 .
- FIG. 2 illustrates exemplary DTI results corresponding to scenarios with the different tissue components (objects), including (A) ideal coherent single fiber 20 (spinal cord white matter or optic nerves), (B) fiber 20 plus an isotropic component 22 (tissue loss, inflammation, or edema), (C) two crossing fibers 24 , and (D) two crossing fibers 24 with an isotropic component 22 . If fiber 20 of (A) is of interest and the target for a DTI measurement as demonstrated, the correct DTI result for the ideal fiber result 26 . Nevertheless, the various mixed conditions result in misrepresentations 28 , 30 , and 32 of the targeted fiber, which is the major shortcoming of DTI.
- objects including (A) ideal coherent single fiber 20 (spinal cord white matter or optic nerves), (B) fiber 20 plus an isotropic component 22 (tissue loss, inflammation, or edema), (C) two crossing fibers 24 , and (D) two crossing fibers 24 with an isotropic component 22 .
- fiber 20 of (A)
- FIG. 3 A is a flow chart 100 illustrating the basic steps contemplated to detect and differentiate the underlying CNS white matter pathologies.
- a multi-direction, multi-weighting diffusion MRI scan is conducted 102 utilizing a signal acquisition and processing component.
- a multi-tensor diffusion model is constructed 104 , and the multi-tensor model is solved 106 to obtain the parameters and coefficients of the model.
- a multiple-tensor based DBSI, or diffusivity component is provided ( FIGS. 3 B and 3 C ).
- the method illustrated may be used to determine diffusivity of each diffusion tensor component within a tissue.
- an MRI scan is performed 108 .
- subjects are set up 110 in MRI scanner and a multi-direction diffusion MRI scan is performed 112 .
- a diffusion MRI dataset is obtained 114 .
- number of fibers and their primary orientation is determined 115 .
- determining 115 the number of fibers and their primary orientation a diffusion MRI signal is projected 116 onto diffusion a basis and a computation error is evaluated.
- a nonlinear optimization procedure is performed 118 to compute optimized directional diffusivities for diffusion basis. It is determined 120 whether the fibers are converged and optimized. If the fibers are determined 120 not to have been converged and optimized, the current directional diffusivities for both diffusion basis and isotropic components are updated 122 . After update 122 , a diffusion basis using current directional diffusivities and isotropic component is constructed 124 and projected 116 is performed again. If the fibers are determined 120 to have been converged and optimized, the number of fibers based on projection of diffusion MRI data onto optimized diffusion basis set is determined 126 .
- diffusivities of each fiber and isotropic components are determined 128 .
- a multi-tensor model with isotropic component using current directional diffusivities for each fiber is constructed 130 .
- a multi-tensor model is solved 132 and evaluated for computational error.
- a nonlinear optimization procedure is performed 134 to compute optimized directional diffusivities for each fiber. It is determined 136 whether the fibers are converged and optimized. If the fibers are determined 136 not to have been converged and optimized, the current directional diffusivities for each fiber are updated 138 and the multi-tensor model is constructed 130 again. If the fibers are determined 136 to have been converged and optimized, a final directional diffusivity for each fiber is computed 140 . Additionally, a mean diffusivity of each isotropic component, and a volume ratio of all components is computed 140 .
- FIGS. 4 A and 4 B are an illustration of the design of an exemplary 99-direction diffusion-weighting scheme.
- each diffusion-weighting direction is selected based on the grid point location.
- the first diffusion weighting direction 144 is from origin (0, 0) to grid point (1, 0)
- the second diffusion weighting direction 146 is from (0, 0) to (1, 1), and so on.
- 99 diffusion directions are selected based on the 3D grid locations 148 shown by 3D model 150 in FIG. 4 B .
- DBSI Similar to diffusion basis function decomposition (DBFD), DBSI employs the following multi-tensor model as the first-step analysis:
- FIG. 5 illustrates a diffusion basis set 152 with 40 diffusion bases 154 .
- each diffusion basis 154 represents a candidate fiber orientation, and the diffusion basis 154 set is uniformly distributed in the 3D space.
- the real fiber is treated as the linear combination of the entire diffusion basis set.
- DBSI performs a nonlinear searching to estimate the optimal values of ⁇ and ⁇ ⁇ best fitting the acquired diffusion weighted data.
- Isotropic tensor component is uniquely incorporated in DBSI to improve the accuracy, as shown in Equation 2.
- Each S i is computed using the least square estimation under the nonnegative constraint (S i ⁇ 0) and the basic principle of sparsity as employed in DBFD during the nonlinear optimization procedure. After the optimization, the number of fibers and their primary axis directions are estimated similar to DBFD.
- a unique feature of this disclosure is that the shape of each diffusion basis is not prefixed as in DBFD method. Instead, the basis shape is optimized during the optimization process to estimate both ⁇ ⁇ and ⁇ ⁇ .
- This optimization process is demonstrated in FIG. 6 using a single axonal fiber 156 as the example.
- experimental data is fitted by the linear combination of a diffusion basis set 154 with fitting error improved through iterations 158 , 160 , 162 , and 164 until the optimal coefficients of linear combination of diffusion basis are estimated 166 .
- iteration 158 has a fitting error of 0.6
- iteration 160 has a fitting error of 0.4
- iteration 162 has a fitting error of 0.2
- iteration 164 has a fitting error of 0.04.
- the isotropic component is also considered according to Equation 2 in this process (not shown) to improve the optimization accuracy.
- FIGS. 7 A and 7 B the diffusion basis 154 with direction close to that of the axonal fiber 156 contributes more significantly to the linear combination with higher magnitude of the coefficients S i .
- the diffusion basis 154 with direction away from that of the axonal fiber 156 has limited contribution to the coefficient of linear combination of the basis set fitting the experimental data.
- FIG. 7 A demonstrates a single fiber 168 tract and
- FIG. 7 B demonstrates a two-fiber 170 tract.
- DBSI determines the number and primary direction of fibers according to the description of Equation 1. Each coefficient is associated with one diffusion tensor basis at a particular direction. These preliminary coefficients are grouped based on the magnitude and the closeness in orientations of the associated basis diffusion tensor. Coefficients smaller than a threshold determined by raw signal SNR are ignored. Significant coefficients with closely oriented (within 15 degrees) diffusion basis tensors are grouped as one fiber. The threshold of 15 degrees is set based on the desired angular resolution. Once the grouping process is complete, the averaged direction of the grouped diffusion basis is defined as the primary direction of the fiber.
- DBSI constructs another multi-tensor model with the assumption of axial symmetry.
- a set of isotropic tensor components are included in the model:
- S k is the measured diffusion weighted signal at diffusion gradient direction ⁇ right arrow over (b) ⁇ k .
- L is the number of estimated fibers in the imaging voxel.
- ⁇ ⁇ _i and ⁇ ⁇ _i are the axial and radial diffusivity of the ith fiber.
- ⁇ i is the angle between the diffusion gradient ⁇ right arrow over (b) ⁇ k and the primary direction of ith estimated fiber.
- an optimization process 170 is used to search the best directional diffusivities for each candidate fiber and compute all the volume ratios of each diffusion component.
- a first optimization 174 includes candidate fibers 175 with a fitting error of 0.4.
- a second optimization 176 includes candidate fibers 175 with a fitting error of 0.2
- a third optimization 178 includes candidate fibers 175 with a fitting error of 0.1
- a fourth optimization 180 includes candidate fibers 175 with a fitting error of 0.02
- the fitting error is smaller than 2%, which falls within the acceptable range. Therefore, the directional diffusivity of each candidate fiber 175 , and corresponding volume ratios computed after the optimization 180 are determined as the final DBSI results.
- the nonlinear optimization procedure is executed based on criteria including maximal iteration numbers, tolerance of mesh size, tolerance of variable, tolerance of function, accepted accuracy, and many other criteria set according to the need. Once some or all of these criteria are met according to the preset level, the optimization procedure is considered satisfactorily fit the data and the optimization stops.
- the cuprizone model was again employed to compare conventional DTI with the new DBSI analysis. Striking contrast between DTI and DBSI was observed at the corpus callosum from C57BL/6 mice treated with cuprizone for 4 weeks. DTI failed to detect demyelination and overestimated axonal injury even with 99-direction diffusion weighting, while offering no information on inflammation. However, DBSI correctly reflected the presence of demyelination ( FIG. 9 ), axonal injury ( FIG. 10 ), and inflammation ( FIG. 11 ).
- myelin basic protein 186 immunostaining significant demyelination in the caudal corpus callosum is seen by reduced MBP-positive area 188 ( FIG. 10 ) and increased radial diffusivity 190 ( FIG. 11 ) derived using DBSI. Consistent with previous reports, lack of increase in DTI derived radial diffusivity failed to reflect the histological finding of demyelination ( FIG. 12 ).
- the axonal fiber tract density 194 ( FIG. 15 ) was also derived using DBSI expressing as volume ratio. Due to the infiltrating inflammatory cells, the density of axonal fiber tracts was reduced from 93% to 77%, a finding not available for conventional DTI.
- FIG. 16 illustrates inflammatory cell infiltration 196 derived using DBSI.
- the inflammatory cell infiltration 196 is to be 16.9% (20.4 ⁇ 3.5) of total volume in 4-week cuprizone treated corpus callosum 184 , above the baseline 3.5% cellular content. This is consistent with the significantly increased DAPI positive stains in the same region; information has not been available using DTI.
- 99-direction diffusion weighted images are analyzed following one or more operations described above to determine the number of intravoxel fibers and isotropic components on a laboratory fabricated phantom containing mouse trigeminal nerves with known in vivo DTI character and isotropic gel as shown in FIG. 18 .
- Diffusion weighted MRI was performed on the phantom using 99 distinct diffusion weighting gradients for both DTI 200 and DBSI 202 analysis.
- DTI 200 and DBSI 202 estimated the isotropic apparent diffusion coefficient to be identical at 1.91 ⁇ m 2 /ms suggesting both methods are accurate for simple medium.
- the isotropic gel component was not identified.
- Another fiber phantom 210 was built to contain two mouse trigeminal nerves crossing each other at 90° with isotropic gel. As expected that DTI failed to identify the two crossing fibers or the gel. In contrast, DBSI was able to identify the presence of two fibers crossing at 90° estimating fiber orientations of (1, 0, 0) and (0, 0, 1). The diffusion anisotropy of the two fibers was estimated to be 0.81 and 0.83 respectively. Correct volume ratio was also estimated by DBSI to report 19% of (1, 0, 0) fiber, 19% of (0, 0, 1) fiber, 52% of gel, and 10% of cell component.
- Methods described herein facilitate determination of an axial diffusivity, a radial diffusivity, and/or a volume ratio of a scanned volume of tissue with increased accuracy relative to known methods, which are distinguishable at least as follows.
- FIG. 19 is a comparison of diffusion spectrum imaging (DSI) 212 and DBSI 214 from human subjects 216 .
- DSI 212 is a method that attempts to directly measure the probability distribution function of the displacement of water molecules without an assumption of tissue structure or the shape of probability distribution function. It was proposed to identify multiple fibers within an image voxel.
- ODF orientation distribution function
- DSI effectively estimates angles of crossing fibers.
- its ODF based analysis does not offer other crucial quantitative information of water diffusion relevant to tissue physiology and pathology such as the apparent diffusion coefficients, diffusion anisotropy, or the volume ratio of different components. Therefore, DSI's applications are limited to fiber tracking.
- the presence of an isotropic component within the image voxel is an important biomarker for cell infiltration, edema, and tissue loss. As shown in FIG. 19 , the isotropic diffusion component is ignored in DSI 212 operation for the better estimation of the fiber orientation. In contrast, DBSI 214 quantitatively separates the isotropic from fiber component with accurate isotropic diffusivity assessment.
- DBSI requires high diffusion weighting gradients of various magnitudes and directions to accurately estimate the ODF, a typically impractical challenge on regular clinical MR scanners.
- DBSI facilitates operation with the clinically used diffusion weighting gradient strength and smaller number of directions.
- DBSI may be performed on clinical MR scanners with typical hardware resources.
- FIG. 20 is a diffusion tensor imaging (DTI) 216 for mouse trigeminal nerve embedded in gel
- FIG. 21 is a DBSI 218 for mouse trigeminal nerve embedded in gel.
- DTI 216 derived radial diffusivity is very dependent on the tissue environment, and inaccurate assessment is common due to both the intra- and inter-voxel partial volume effect as demonstrated in FIG. 20 .
- DTI 216 significantly over estimated the radial diffusivity 220
- DBSI 218 correctly quantified diffusivities 222 , anisotropy, and volume ratios of all components.
- anisotropic diffusion 75.9 ⁇ 2.6%: axon fibers
- restricted isotropic diffusion (12.1 ⁇ 0.99%: cells)
- non-restricted isotropic diffusion (12.1 ⁇ 2.5%: extra-axonal and extracellular water).
- the assignment of cell and water components was based on the DBSI-derived spectrum of isotropic diffusion.
- FIGS. 24 A- 24 D are detailed views of the intensities of the scan of FIG. 22 .
- FIG. 24 A represents intact myelin
- FIG. 24 B represents intact axons
- FIG. 24 C represents cell nucleus
- FIG. 24 D represents tissue loss.
- each nerve bundle can be further estimated and classified according to the structure and/or pathology ( FIG. 40 ). Homogenous pathological change in a coherent white matter tract bundle exhibits a unique signature of DTI-derived directional diffusivities ( FIG. 41 A ). To demonstrate the effect of complex pathologies, spinal cord white matter, a simple nerve bundle without fiber crossing, was examined. To properly model spinal cord white matter lesions containing heterogeneous and co-existing pathologies ( FIG.
- diffusion weighted MR signal was modeled as a linear combination of a series of anisotropic diffusion tensors (representing heterogeneous axon fibers with different pathology) plus a spectrum of isotropic diffusion components (representing inflammation associated cell infiltration and edema, or tissue loss), Eq. [5]:
- M ⁇ N is the total number of possible anisotropic tensor types distributed within physiological and pathological ranges, which can be classified into five groups: (A) normal axon; (B) demyelinated axon (increased ⁇ ⁇ _i , and unchanged ⁇ ⁇ _i ) (C) injured axon (unchanged ⁇ ⁇ _i , and decreased ⁇ ⁇ _i ), (D) injured axon with demyelination (increased ⁇ ⁇ _i , and decreased ⁇ ⁇ _i ), and (F) tissue loss (significantly increased ⁇ ⁇ _i or ⁇ ⁇ _i ).
- Mean ⁇ 2 ⁇ STD of DBSI-derived ⁇ ⁇ on normal spinal cord white matter is used as threshold to define the decreased ⁇ ID >Mean ⁇ 6 ⁇ STD indicates significant ⁇ ⁇ _i increase.
- Mean+2 ⁇ STD of DBSI-derived ⁇ ⁇ is used as threshold to define the increased ⁇ ⁇ _i .
- the non-diffusion weighted signal intensity fraction (f ij ) of the anisotropic tensors belonging to each group were summed up to compute individual pathology component map ( FIG. 41 B ): (Map A) the normal axon density; (Map B) demyelinated axon density; (Map C) injured axon density; (Map D) injured and demyelinated axon density; and (Map F) density map of tissue loss.
- Isotropic diffusion component (Map E) was computed as the summation of fractions from all the isotropic components (h p ).
- FIG. 29 illustrates a DAPI 224 and SMI-31 226 staining of a fixed mouse trigeminal nerve and a comparison of isotropic diffusion spectra with gel.
- nucleus and axon staining was performed using 4′,6′-diamidino-2-phenylindole (DAPI) and phosphorylated neurofilament (SMI-31) to count cells (4109 ⁇ 629/mm 2 ) and axons (25434 ⁇ 8505/mm 2 ).
- DAPI 4′,6′-diamidino-2-phenylindole
- SI-31 phosphorylated neurofilament
- the DBSI-determined gel water fraction closely matches that determined using T2W MRI as shown in FIG. 31 - 32 , suggesting the potential of DBSI to estimate edematous water from more freely diffusing water in regions of tissue loss.
- the derived fiber directional diffusivities with and without gel are comparable as shown in FIGS. 33 and 34 , indicating that DBSI can correctly assess fiber diffusion properties in the presence of edema or tissue loss.
- FIG. 35 is an illustration of six fixed trigeminal nerves grouped into three pairs of crossing fibers at 32°, 58°, and 91° juxtaposed with 2% agarose gel.
- DBSI-estimated crossing fiber angles 300 compare favorably with those derived using an orientation distribution function (ODF) by DSI 302 and general q-sampling imaging (GQI) 304 .
- ODF orientation distribution function
- GQI general q-sampling imaging
- DBSI-derived gel percentages were 15%, 14%, and 50%, in close agreement with T2W MRI determined 18%, 13%, and 45%.
- DSI 302 and GQI 304 failed to resolve crossing FIGS. 33 and 34 comparable ⁇ ⁇ (A), ⁇ ⁇ (B) derived from trigeminal nerves with and without gel was confirmed by Bland-Altman plots.
- FIGS. 37 A- 37 D illustrate the relative CRLB (rCRLB for axial diffusivities ( ⁇ 1 ⁇ , ⁇ 2 ⁇ ) of both fibers, and the volume ratio (f 2 ) and radial diffusivity ( ⁇ 2 ⁇ ) of the second fiber as a function of SNR.
- FIGS. 38 A and 38 B are graphs pertaining to diffusion MRI data representative of a single-fiber with restricted isotropic diffusion and nonrestricted isotropic diffusion were generated in silico via Monte Carlo simulations.
- DBSI revealed cell infiltration at peak EAE, consistent with DAPI staining and clearly indicating the presence of inflammation ( FIGS. 42 and 45 ).
- Quantitative analysis of the ventrolateral white matter DBSI parameters closely reflects the same pathology profile suggested by IHC shown in FIGS. 43 - 46 .
- DBSI reflects axon and myelin injury more accurately than that previously determined by DTI, and correctly depicts inflammatory pathological features of the spinal cord white matter from EAE mice in terms of both cell infiltration and vasogenic edema as shown in FIGS. 45 and 46 .
- a segment of autopsy cervical spinal cord, fixed in 10% formalin, from 54 years old Caucasian female with 22-year disease duration was examined on a 4.7-T preclinical MR scanner: Varian DirectDriveTM console, 15-cm inner diameter, actively shielded Magnex gradient coil (60 G/cm, 270 ⁇ s rise time).
- Tissue contained in a 3-ml syringe with 10% formalin was placed in a custom-made solenoid coil for data acquisition using the following parameters: TR 2s, TE 39 ms, A 20 ms, ⁇ 8 ms, slice thickness 0.5 mm, number of slices 5, field-of-view 2.4 ⁇ 2.4 cm 2 , number of averages 1, data matrix 192 ⁇ 192.
- Spherical Harmonic Decomposition has been proposed as a method for classifying imaging voxels into isotropic, single-, and multi-fiber components based on SHD coefficients.
- SHD cannot accurately estimate the intra-voxel fiber numbers, fiber volume fractions, fiber anisotropy, or fiber orientations. Even in the simple case of two fibers, it is not possible to use SHD to uniquely determine the intra-voxel fiber numbers and orientation since both the volume fraction and relative fiber orientations interfere with the higher order SHD components in a similar fashion. Similar to DSI, SHD also requires high diffusion weighting gradients. In contrast, DBSI facilitates separating and quantifying the isotropic and individual anisotropic (fiber) components while maintaining the use of low diffusion weighting gradient magnitudes.
- Q-ball imaging of the human brain is a method closely related to DSI.
- DSI the ODF is reconstructed by sampling the diffusion signal on a Cartesian grid, Fourier transformation, followed by the radial projection.
- Q-ball imaging acquires the diffusion signal spherically and reconstructs the ODF directly on the sphere.
- the spherical inversion is accomplished with the reciprocal space funk radon transform (FRT), a transformation of spherical functions that maps one function of the sphere to another.
- FRT reciprocal space funk radon transform
- Q-ball and DSI are theoretically equivalent and generate similar ODF.
- q-ball methods are not capable of estimating fiber angles as well as quantifying multiple tensor parameters.
- ICA Independent Component Analysis
- HARDI high angular resolution diffusion imaging
- HARDI fails in voxels with more than 2 fibers; (ii) HARDI does not work in voxels with more than 1 isotropic component, which is commonly seen in pathological conditions with both cell infiltration and edema; (iii) HARDI fails to compute isotropic diffusivity, improving fiber orientation estimation at the expense of removing the isotropic diffusion component; (iv) HARDI cannot compute the absolute axial and radial diffusivities for each component fiber; (v) HARDI cannot compute the true volume fractions of each fiber or isotropic component.
- DBSI facilitates achieving all the goals enumerated above because it may be used to solve for issues that HARDI ignores or simplifies.
- HARDI-based methods have aimed to enhance the tools available for fiber tracking but do not compute the directional diffusivities of fibers, the isotropic diffusivity, or true volume fractions.
- DBSI facilitates not only resolving the primary direction of each fiber component, but also identifying and quantifying one or more other physical properties available from the diffusion measurements.
- CNS white matter pathology maps corresponding to the classic immunohistochemistry staining of excised tissues may be generated. For example, based on the axial diffusivity distribution intact (or injured) axonal fiber tract fraction may be estimated and the fraction distribution map may be generated to reflect the classic phosphorylated neurofilament (SMI-31, for intact axons), or dephosphorylated neurofilament (SMI-32, for injured axons), staining.
- the restricted isotropic diffusion component estimated using DBSI constitutes a map of cell distribution corresponding to nucleus counting using DAPI staining on the fixed tissue allowing a direct estimate the extent of inflammation in patient CNS white matter.
- DBSI provides the opportunity for efficient assessment of disease-modifying interventions and allows treatment planning to reflect individual patient response.
- the DBSI method, or DBSI with extended isotropic spectrum (DBSI-EIS), disclosed herein above may be modified to enable a DBSI-based diagnostic method configured to quantitatively differentiate different types or grades of tumor cells as well as to identify regions of hyperperfusion or hypoperfusion associated with the tumor.
- a noninvasive, non-radiative technique to provide multiple parametric images to profile the heterogeneity of tumors is disclosed. Using the disclosed method, tumor cell microstructures (cells with different grades), edema, and vascular structures that perfuse the tumor may be measured in a single clinical imaging scan.
- a method for analyzing a diffusion basis spectrum imaging MRI including obtaining a plurality of diffusion magnetic resonance (MR) signals for a plurality of voxels representing at least a portion of a patient tissue; computing, by a processor, an anisotropic d if fusion portion and an isotropic diffusion portion of the diffusion MR signals; calculating, by the processor, an isotropic diffusion spectrum from the isotropic diffusion portion of the diffusion MR signals, the isotropic diffusion spectrum comprising a plurality of apparent diffusion coefficient (ADC) values; and calculating, by the processor, an associated percent contribution of each ADC value to a total isotropic diffusion spectrum magnitude.
- MR diffusion magnetic resonance
- the isotropic diffusion spectrum may include an extended isotropic diffusion spectrum.
- the method may further include calculating at least one isotropic spectrum signal comprising a portion of the isotropic diffusion spectrum between a first ADC threshold value and a second ADC threshold value, wherein one or more isotropic spectrum signals are associated with a structure within the patient.
- the method may include obtaining a plurality of diffusion MR signals for a plurality of voxels representing at least a portion of a patient tissue; computing, by a processor, an anisotropic diffusion portion and an isotropic diffusion portion of the diffusion MR signals; calculating, by the processor, an isotropic diffusion spectrum from the isotropic diffusion portion of the diffusion MR signals, the isotropic diffusion spectrum comprising a plurality of apparent diffusion coefficient (ADC) values; calculating, by the processor, an associated percent contribution of each ADC value to a total isotropic spectrum magnitude; calculating, by the processor, at least one isotropic spectrum signal comprising a portion of the isotropic diffusion spectrum between a first ADC threshold value and a second ADC threshold value, each isotropic spectrum signal associated with a structure within the patient; and generating at least one DBSI image comprising a map of at least one isotropic spectrum signal, the map comprising
- DBSI-EIS parameter values and pathology findings exhibited an excellent correlation.
- various grades of tumor cells produced isotropic diffusion signals that were selectively partitioned into subranges of apparent diffusion coefficients (ADCs) within the isotropic diffusion spectrum produced by DBSI-EIS methods.
- ADCs apparent diffusion coefficients
- perfusion associated with tumors produced isotropic diffusion signals that occupy a range of the isotropic spectrum characterized by ADC values above the ADC range previously analyzed using the previous DBSI method described herein above.
- the DBSI-EIS method may visualize and quantify the heterogeneity of tumor grade, indicating those areas where the tumor is more aggressive, and therefore may require different treatment strategies.
- the ability to identify tumor heterogeneity in various aspects of the disclosed method has significant clinical implications during the diagnosis and treatment period, since the most malignant portion of a tumor may be targeted and under-diagnosis due to incorrect biopsy sampling can be avoided. Further, areas of recurrent tumor may be more easily identified in the treatment follow-up period against a background of abnormal signals that typically includes a mix of both tumor-related and post-treatment changes.
- the DBSI-EIS method disclosed herein overcomes at least several of the limitations of existing methods.
- the disclosed DBSI-EIS method may reduce the time to diagnose a tumor in a patient.
- Anatomical imaging alone requires ominous time-dependent morphological changes such as invasion, gross tumor growth or new lymphadenopathy required to diagnose failure of treatment.
- PET/CT physiological imaging requires a time delay before accurate diagnosis, as it can only be performed 6-8 weeks after end of treatment of most tumors to avoid false positive results. This time lag in imaging diagnosis may result in delayed treatment or treatment modification, which potentially negatively impacts the patients' morbidity and mortality.
- DBSI-EIS may identify response to therapy within a very short time frame after termination of treatment. Similarly DBSI-EIS may potentially identify recurrence of a tumor in a shorter time frame than anatomical imaging alone.
- the DBSI-EIS method disclosed herein enables multi-parametric imaging beyond the capabilities of existing visualization methods such as PET/CT.
- PET/CT imaging typically provides a single parameter of disease burden, abnormal tracer activity.
- the DBSI-EIS method disclosed herein enables the evaluation of multiple parameters in a single study, such as cellularity, perfusion and neuroinflammatory/edema markers.
- the DBSI-EIS method disclosed herein enables visualization of perfusion at higher spatial resolution than existing methods, such as DCE or DSC-based perfusion imaging, allowing for more accurate identification of subtle abnormal areas of increased relative cerebral blood volume (rCBV) associated with brain tumors.
- rCBV relative cerebral blood volume
- the modified DBSI method disclosed herein provides high-quality imaging of multiple parameters of tumors non-invasively and without need for extrinsic radiative markers.
- DBSI may be utilized repeatedly on a patient to detect a condition, diagnose a condition, monitor the effects of a treatment, and provide follow-up imaging without limitations associated with invasive procedures such as lumbar punctures or the accrual of markers such as gadolinium or radiative PET tracers in the tissues of a patient.
- FIG. 54 is a flow chart illustrating a modified DBSI method 5100 in one aspect.
- the method 5100 includes obtaining diffusion MRI data measured from a patient at 5102 .
- the diffusion MRI data includes a plurality of diffusion MR signals associated with a plurality of voxels representing a region of interest within the patient including, but not limited to, the skull or brain of the patient.
- the plurality of diffusion MR signals obtained at step S 102 may be subjected to analysis using a diffusion basis spectrum imaging with extended isotropic spectrum (DBSI-EIS) at step S 104 .
- DBSI-EIS may also be known as neuro-immune imaging (NII).
- DBSI-EIS is a modification of the DBSI method described herein above.
- DBSI-EIS determined an anisotropic portion of the diffusion MR signals and an isotropic portion of the diffusion MR signals using the previous analysis described herein above in association with Equation 2, Equation 3, and Equation 4.
- the anisotropic portion of the diffusion MR signals is used to calculate a plurality of anisotropic tensor signals related to neuronal integrity at 5106 .
- anisotropic signals include: ⁇ ⁇ and ⁇ ⁇ for each identified fiber within a voxel, fiber direction, and fiber volume fraction.
- changes in any one or more of the anisotropic signals may indicate distortion or displacement of neuron fibers due to tumor growth.
- changes in any one or more of the anisotropic signals may indicate white matter or gray matter injury/loss.
- the method 5100 may further include calculating a plurality of isotropic spectrum signals at 5108 .
- the isotropic spectrum signals include subsets of the isotropic portion of the diffusion MR signals associated with a range of apparent diffusion coefficients (ADCs) as described herein previously.
- FIGS. 55 , 78 B, and 79 are graphs illustrating schematically an extended isotropic spectrum obtained in association with the DBSI-EIS method. It is to be noted that the isotropic spectrum analyzed according to various aspects of the DBSI-EIS method 5100 is characterized by ADC values ranging from 0 up to about 50 ⁇ m t /ms.
- the isotropic spectrum analyzed may be characterized by ADC values ranging from about 0 to about 10 mm 2 /s, from about 0 to about 20 ⁇ 10 ⁇ 3 mm 2 /s, from about 0 to about 30 ⁇ 10 ⁇ 3 mm 2 /s, from about 0 to about 40 ⁇ 10 ⁇ 3 mm 2 /s, and from about 0 mm 2 /s and about 50 ⁇ 10 ⁇ 3 mm 2 /s.
- the ADC values characterizing the isotropic spectrum analyzed by the previous DBSI method described herein above typically ranged from 0 to about 3 ⁇ m t /ms, as illustrated in FIG. 31 .
- neuro-immune imaging can provide multiple parametrical quantification of different grades of tumor cells and capillary blood perfusion within the tumor in a single clinical imaging scan.
- the grading system used herein is the World Health Organization (WHO) grading system.
- the WHO grade has four categories of tumors. Grade I tumors are slow-growing, nonmalignant, and associated with long-term survival. Grade II tumors are relatively slow-growing but sometimes recur as higher grade tumors. They can be nonmalignant or malignant. Grade III tumors are malignant and often recur as higher grade tumors. Grade IV tumors reproduce rapidly and are very aggressive malignant tumors. Generally speaking, the lower grades can have less aggressive biology.
- the isotropic spectrum signals may be correlated with specific structures associated with a tumor in a patient including, but not limited to, resident healthy cells, tumor cells of various grades and/or types (a grade 1/2 brain tumor cell, a grade 3 brain tumor cell, a grade 4 tumor cell), edema, cerebrospinal fluid (CSF), and perfusion associated with the tumor.
- each isotropic spectrum signal may include a portion of the isotropic spectrum falling between ADC threshold values.
- the ADC threshold values of tumor cells are between the ADC threshold values of resident cells on the lower end and CSF and perfusion ADC threshold values on the upper end.
- grade 4 tumor cells may be correlated with a portion of the isotropic diffusion spectrum between ADC threshold values 5502 and 5504
- grade 3 tumor cells may be correlated with a portion of the isotropic diffusion spectrum between ADC threshold values 5504 and 5506
- grade 1/2 tumor cells may be correlated with a portion of the isotropic diffusion spectrum between ADC threshold values 5506 and 5508
- perfusion associated with a tumor may be correlated with a portion of the isotropic diffusion spectrum between ADC threshold values 5510 and 5512 .
- FIGS. 80 A- 80 D are exemplary heterogeneous 3D spatial distributions for glioma tumor cells with different grades, where the scale below each image indicates the NII tumor cell fraction.
- FIG. 81 A is an exemplary 3D spatial distribution for all grades
- FIG. 81 B is an exemplary DBSI-EIS perfusion 3D distribution.
- the isotropic spectrum signals may be correlated with specific structures by an analysis of DBSI-EIS measurements along with corresponding clinical data obtained from the same structures using imaging modalities other than the DBSI-EIS method.
- any known clinical data may be used to associate isotropic spectrum signals with specific patient structures, including, but not limited to biopsy or autopsy data, CT data, PET data, any other suitable imaging modality.
- the MRI visualization is followed by a biopsy to better characterize the cells and other structures associated with the tumor including grade(s) of tumor cells, vascularization of the tumor, and the heterogeneity of the tumor cells. The biopsy may provide information used to inform an appropriate course of treatment.
- any known analysis method may be used to compare the DBSI-EIS isotropic spectra to clinical data without limitation.
- a machine learning or expert system may be used to identify specific isotropic spectrum signals and to associate the isotropic spectrum signals with specific structures associated with tumors in various patients.
- FIG. 56 is a schematic diagram summarizing a machine learning/expert system approach to identifying isotropic spectrum signals.
- training data obtained from various clinical data including, but not limited to, biopsy PET images, biopsy, autopsy, CT, PET, and other clinical data, may be transferred into an expert system.
- the expert system may identify a plurality of thresholds that define the upper and lower ADC values of specific isotropic spectrum signals associated with specific structures in the patient.
- any known suitable methods associated with machine learning may be used by the expert system to identify the plurality of thresholds.
- the expert system such as an IBM Watson Health expert system, may make use of a method involving optimization of one or more cost functions to identify the plurality of threshold values.
- the DBSI-EIS method may be used to characterize and quantify heterogeneity of diseased tissue of a patient.
- the DBSI-EIS method may be used to characterize and quantify heterogeneity in a tumor in a patient, such as a brain tumor.
- the DBSI-EIS method may identify one or more anisotropic tensor signals related to neuronal integrity (i.e. injury or loss of white or gray matter due to tumor) as described herein above. Further, the DBSI-EIS method may further identify extended isotropic spectrum signals comprising subranges of the isotropic spectrum falling between upper and lower threshold values.
- the isotropic spectrum signals can be between ADC values of about 0 mm 2 /s and about 50 ⁇ 10 ⁇ 3 mm 2 /s.
- grade 4 tumor cells, grade 3 tumor cells, and grade 1 ⁇ 2 tumor cells may be correlated with a portion of the isotropic diffusion spectrum between ADC threshold values of about 0 mm 2 /s and about 2 ⁇ 10 ⁇ 3 mm 2 /s.
- edema and CSF may be correlated with a portion of the isotropic diffusion spectrum between ADC threshold values of about 1.8 ⁇ 10 ⁇ 3 mm 2 /s and about 4 ⁇ 10 ⁇ 3 mm 2 /s.
- perfusion associated with a tumor may be correlated with a portion of the isotropic diffusion spectrum between ADC threshold values of about 4 ⁇ 10 ⁇ 3 mm 2 /s and about 10 ⁇ 10 ⁇ 3 mm 2 /s.
- Non-tumor tissue or resident cells may be correlated with a portion of the isotropic diffusion spectrum between ADC threshold values of 0 mm 2 /s and about 0.3 ⁇ 10 ⁇ 3 mm 2 /s.
- Tumor cells may be correlated with a portion of the isotropic diffusion spectrum under an ADC threshold value less than the ADC value for CSF and more than the ADC value for non-tumor tissue.
- Tumor cells may be correlated with a portion of the isotropic diffusion spectrum under an ADC threshold value of 3 ⁇ 10 ⁇ 3 mm 2 /s or between ADC threshold values of about 0.25 ⁇ 10 ⁇ 3 mm 2 /s and about 3 ⁇ 10 ⁇ 3 mm 2 /s.
- Grade 4 tumor cells, grade 3 tumor cells, and grade 1/2 tumor cells may be correlated with a portion of the isotropic diffusion spectrum between ADC threshold values of about 0 mm 2 /s and about 1.5 ⁇ 10 ⁇ 3 mm 2 /s or about 1.8 ⁇ 10 ⁇ 3 mm 2 /s.
- Grade 4 tumor tissue may be correlated with a portion of the isotropic diffusion spectrum between ADC threshold values of between about 0.25 ⁇ 10 ⁇ 3 mm 2 /s or 0.3 ⁇ 10 ⁇ 3 mm 2 /s and about 0.5 ⁇ 10 ⁇ 3 mm 2 /s.
- Grade 3 tumor tissue may be correlated with a portion of the isotropic diffusion spectrum between ADC threshold values of between about 0.5 ⁇ 10 ⁇ 3 mm 2 /s and about 0.8 ⁇ 10 ⁇ 3 mm 2 /s.
- Grade 2 tumor tissue may be correlated with a portion of the isotropic diffusion spectrum between ADC threshold values of between about 0.8 and about 1.5 ⁇ 10 ⁇ 3 mm 2 /s or about 1.8 ⁇ 10 ⁇ 3 mm 2 /s.
- Edema may be correlated with a portion of the isotropic diffusion spectrum between ADC threshold values of about 1.8 ⁇ 10 ⁇ 3 mm 2 /s and about 2.5 ⁇ 10 ⁇ 3 mm 2 /s.
- CSF may be correlated with a portion of the isotropic diffusion spectrum between ADC threshold values of about 2.5 ⁇ 10 ⁇ 3 mm 2 /s and about 4 ⁇ 10 ⁇ 3 mm 2 /s.
- Perfusion may be correlated with a portion of the isotropic diffusion spectrum between ADC threshold values of between about 4 ⁇ 10 ⁇ 3 mm 2 /s and about 10 ⁇ 10 ⁇ 3 mm 2 /s.
- Perfusion may be correlated with a portion of the isotropic diffusion spectrum greater than about 10 ⁇ 10 ⁇ 3 mm 2 /s.
- Perfusion associated with a tumor may be correlated with a portion of the isotropic diffusion spectrum ADC threshold values of greater than 3 ⁇ 10 ⁇ 3 mm 2 /s or between about 4 ⁇ 10 ⁇ 3 mm 2 /s and about 50 ⁇ 10 ⁇ 3 mm 2 /s.
- the thresholds may be selected based on published studies, patient data, and histology studies and the threshold selection may be further refined and optimized. Multiple diffusion time based diffusion MRI method may improve the accuracy of grade separation.
- the DBSI-EIS method may use the ADC threshold values according to Table 1:
- the range of ADC values can be between 0 mm 2 /s and about 50 ⁇ 10 ⁇ 3 mm 2 /s.
- an ADC values can be about 0.01 ⁇ 10 ⁇ 3 mm 2 /s; about 0.02 ⁇ 10 ⁇ 3 mm 2 /s; about 0.03 ⁇ 10 ⁇ 3 mm 2 /s; about 0.04 ⁇ 10 ⁇ 3 mm 2 /s; about 0.05 ⁇ 10 ⁇ 3 mm 2 /s; about 0.06 ⁇ 10 ⁇ 3 mm 2 /s; about 0.07 ⁇ 10 ⁇ 3 mm 2 /s; about 0.08 ⁇ 10 ⁇ 3 mm 2 /s; about 0.09 ⁇ 10 ⁇ 3 mm 2 /s; about 0.1 ⁇ 10 ⁇ 3 mm 2 /s; about 0.2 ⁇ 10 ⁇ 3 mm 2 /s; about 0.3 ⁇ 10 ⁇ 3 mm 2 /s; about 0.4 ⁇ 10 ⁇ 3 mm 2 /s; about 0.5 ⁇ 10 ⁇ 3 mm 2 /s
- the method may further include using the perfusion data from the extended isotropic spectrum to inform the threshold values or the grading of tumors.
- the DBSI-EIS perfusion data generally correlates to CBV values, which generally correlates to tumor grade.
- the method may further include determining a presence and an abundance of at least one structure within the patient based on a map of at least one extended isotropic spectrum signal.
- the map may include a projection of a percent contribution of one isotropic spectrum signal to the total isotropic spectrum onto an image reconstructed using the plurality of voxels.
- the map may be displayed as a percentage contribution of each isotropic spectrum signal to the total isotropic spectrum.
- FIGS. 84 and 87 A and 87 B are pie charts of isotropic spectrum signals of various patients showing the percent contribution of grade 2 tumor cells, grade 3 tumor cells, grade 4 tumor cells, and non-tumor cells.
- the grade of the tumor is the highest grade of tumor cells identified in the patient beyond a threshold of about 5%.
- the tumor is graded based on the highest grade tumor cell with a percent contribution greater than about 5%. If a cell fraction of grade 4 tumor cells is greater than 5% of the sum of non-tumor cells and tumor cell fraction, the tumor is classified as a grade 4 tumor. If the cell fraction of the grade 4 tumor cells is less than 5% and the cell fraction of grade 3 tumor cells is more than 5%, the tumor is classified as a grade 3 tumor. If the cell fraction of grade 4 tumor cells is less than 5% and the cell fraction of grade 3 tumor cells is less than 5%, then the tumor is classified as a low grade or grade 1/2 tumor.
- FIG. 84 shows pie charts for patients with grade 2 tumors
- FIG. 87 A shows a patient with a grade 3 tumor
- FIG. 87 B shows a patient with a grade 4 tumor.
- the DBSI-EIS method has been presented with respect to brain tumors. It is to be noted that the DBSI-EIS method may be applied similarly to a wide variety of tissues and disorders characterized by heterogeneous tissues or cells types associated with distinct isotropic spectrum signals.
- Non-limiting examples of disorders or tissues compatible with the DBSI-EIS method include: various kind of tumor/cancer (brain, spinal cord, prostate, ovarian, uterine, breast, and cervical cancer etc.); degeneration diseases (stroke, traumatic brain injury, Alzheimer's disease, Parkinson, ALS, multiple sclerosis, etc.), muscular injury and disorders (cardiac injury/inflammation due to disease and treatment, uterine/cervix injury/inflammation, skeleton muscle atrophy, etc.), acoustic neuroma; astrocytoma; anaplastic astrocytoma; anaplastic ependymoma; anaplastic oligodendroglioma; atypical teratoid rhaboid tumor (ATRT); brain stem glioma, chordoma; central neurocytoma; chondrosarcoma; choroid plexus; CNS lymphoma; craniopharyngioma; cysts; diffuse astrocytom
- the method may further include assessing prognosis, planning therapeutic intervention, or predicting therapeutic response.
- the method may further include diagnosing a subject with a tumor grade or a plurality of tumor grades.
- the method may further include administering a treatment and monitoring treatment response or tumor recurrence.
- the DBSI-EIS images obtained using the methods described herein above may be displayed to a user in any suitable known format including, but not limited to: a graph of a plurality of anisotropic signal values or isotropic spectrum signal values, a grey-scale map of a plurality of anisotropic signal values or isotropic spectrum signal values, a two-dimensional (2D) movie format, a three-dimensional (3D) movie format, or any other suitable display format.
- the DBSI-EIS images may be displayed using a movie-style graphical user interface (GUI) to display individual maps corresponding to imaging slices in succession.
- GUI movie-style graphical user interface
- 77 is a screen-shot of a GUI 7700 displaying a series of 2D maps 7702 in which the color scale 7703 corresponds to a single ADC value along an isotropic diffusion spectrum as a percentage of the contribution to the total isotropic diffusion spectrum.
- Each map is displayed as a frame in a movie displayed by the GUI 7700 .
- the GUI may include a numerical display 7704 that may update as each frame is displayed.
- the numerical display 7704 may display the frame number in the series of maps.
- the numerical display 7704 may display the ADC value corresponding to the color map 7703 for a particular frame.
- the GUI display 7700 may further include a play button 7708 that may toggle between an ON position (to display the series of ADC maps) and an OFF position (to pause the display on a selected ADC map in the series).
- a play button 7708 for detecting the presence of at least one structure in a patient tissue.
- the system may include an MRI scanner configured to obtain a plurality of diffusion MR signals for a plurality of voxels representing the patient tissue; and a computer system comprising a processor.
- the computer system may be configured to receive the plurality of diffusion data from the MRI scanner.
- the processor may be configured compute an anisotropic diffusion portion and an isotropic diffusion portion of the diffusion MR signals; calculate an isotropic diffusion spectrum, comprising a plurality of apparent diffusion coefficient (ADC) values; and calculate an associated percent contribution of each ADC value to a total isotropic spectrum magnitude.
- the isotropic diffusion spectrum may include an extended isotropic diffusion spectrum.
- the processor may be further configured to calculate at least one isotropic spectrum signal comprising a portion of the isotropic spectrum between a first ADC threshold value and a second ADC threshold value, each isotropic spectrum signal associated with a structure within the patient.
- the processor may be further configured to determine a presence and an abundance of at least one structure within the patient based on a map of at least one extended isotropic spectrum signal.
- the map may include a percent contribution of at least one isotropic spectrum signal to the total isotropic spectrum.
- FIG. 51 is an illustration of an MRI imaging system 1000 in one aspect.
- the MRI system 1000 may include an MRI scanner 1100 operatively coupled and/or in communication with a computer system 1200 .
- the computer system 1200 is configured to receive data including, but not limited to, diffusion data, from the MRI scanner 1100 , and is further configured to execute a plurality of stored executable instructions encoding one or more aspects of the MRI method as described herein above.
- the computer system 1200 may be further configured to operate the MRI scanner 1100 to obtain, for example, diffusion data by executing an additional plurality of stored executable instructions.
- imaging system environment is not intended to suggest any limitation as to the scope of use or functionality of any aspect of the invention. Moreover, the imaging system environment should not be interpreted as having any dependency or requirement relating to any one or combination of components illustrated in the exemplary operating environment.
- imaging systems, environments, and/or configurations examples include, but are not limited to, personal computers, server computers, hand-held or laptop devices, multiprocessor systems, microprocessor-based systems, set top boxes, programmable consumer electronics, mobile telephones, network PCs, minicomputers, mainframe computers, distributed computing environments that include any of the above systems or devices, and the like.
- Computer systems refer to any known computing device and computer system. As described herein, all such computer systems include a processor and a memory. However, any processor in a computer system referred to herein may also refer to one or more processors wherein the processor may be in one computing device or a plurality of computing devices acting in parallel. Additionally, any memory in a computer device referred to herein may also refer to one or more memories wherein the memories may be in one computing device or a plurality of computing devices acting in parallel.
- processor refers to central processing units, microprocessors, microcontrollers, reduced instruction set circuits (RISC), application specific integrated circuits (ASIC), logic circuits, and any other circuit or processor capable of executing the functions described herein.
- RISC reduced instruction set circuits
- ASIC application specific integrated circuits
- processor any other circuit or processor capable of executing the functions described herein.
- database may refer to either a body of data, a relational database management system (RDBMS), or to both.
- RDBMS relational database management system
- a database may include any collection of data including hierarchical databases, relational databases, flat file databases, object-relational databases, object oriented databases, and any other structured collection of records or data that is stored in a computer system.
- RDBMS's include, but are not limited to including, Oracle® Database, MySQL, IBM® DB2, Microsoft® SQL Server, Sybase®, and PostgreSQL.
- any database may be used that enables the systems and methods described herein.
- a computer program is provided to enable the data processing of the MRI method as described herein above, and this program is embodied on a computer readable medium.
- the computer system is executed on a single computer system, without requiring a connection to a server computer.
- the computer system is run in a Windows® environment (Windows is a registered trademark of Microsoft Corporation, Redmond, Washington).
- the computer system is run on a mainframe environment and a UNIX® server environment (UNIX is a registered trademark of X/Open Company Limited located in Reading, Berkshire, United Kingdom).
- the computer system is run in any suitable operating system environment.
- the computer program is flexible and designed to run in various different environments without compromising any major functionality.
- the computer system includes multiple components distributed among a plurality of computing devices. One or more components may be in the form of computer-executable instructions embodied in a computer-readable medium.
- the computer system may be configured as a server system.
- FIG. 52 illustrates an example configuration of a server system 301 used to receive measurements from the MRI scanner 1100 (not illustrated).
- server system 301 may also include, but is not limited to, a database server.
- server system 301 performs all of the steps used to implement the MRI imaging method as described herein above.
- the computer system and/or database may be fully or partially implemented in a cloud computing environment such that data from the database is received from one or more computers (not shown) within the computer system or remote from the computer system.
- the server system 301 includes a processor 305 for executing instructions. Instructions may be stored in a memory area 310 , for example.
- the processor 305 may include one or more processing units (e.g., in a multi-core configuration) for executing instructions.
- the instructions may be executed within a variety of different operating systems on the server system 301 , such as UNIX, LINUX, Microsoft Windows®, etc. It should also be appreciated that upon initiation of a computer-based method, various instructions may be executed during initialization. Some operations may be required in order to perform one or more processes described herein, while other operations may be more general and/or specific to a particular programming language (e.g., C, C#, C++, Java, or any other suitable programming languages).
- a particular programming language e.g., C, C#, C++, Java, or any other suitable programming languages.
- the processor 305 is operatively coupled to a communication interface 315 such that server system 301 is capable of communicating with a remote device, such as the MRI scanner 1100 , a user system, or another server system 301 .
- communication interface 315 may receive requests (e.g., requests to provide an interactive user interface to receive sensor inputs and to control one or more devices of system 1000 from a client system via the Internet.
- Storage device 134 is any computer-operated hardware suitable for storing and/or retrieving data.
- storage device 134 is integrated in server system 301 .
- server system 301 may include one or more hard disk drives as storage device 134 .
- storage device 134 is external to server system 301 and may be accessed by a plurality of server systems 301 .
- storage device 134 may include multiple storage units such as hard disks or solid state disks in a redundant array of inexpensive disks (RAID) configuration.
- Storage device 134 may include a storage area network (SAN) and/or a network attached storage (NAS) system.
- SAN storage area network
- NAS network attached storage
- processor 305 is operatively coupled to storage device 134 via a storage interface 320 .
- Storage interface 320 is any component capable of providing processor 305 with access to storage device 134 .
- Storage interface 320 may include, for example, an Advanced Technology Attachment (ATA) adapter, a Serial ATA (SATA) adapter, a Small Computer System Interface (SCSI) adapter, a RAID controller, a SAN adapter, a network adapter, and/or any component providing processor 305 with access to storage device 134 .
- ATA Advanced Technology Attachment
- SATA Serial ATA
- SCSI Small Computer System Interface
- Memory area 310 may include, but are not limited to, random access memory (RAM) such as dynamic RAM (DRAM) or static RAM (SRAM), read-only memory (ROM), erasable programmable read-only memory (EPROM), electrically erasable programmable read-only memory (EEPROM), non-volatile RAM (NVRAM), registers, hard disk memory, a removable disk, a CD-ROM, or any other form of computer-readable storage medium known in the art.
- RAM random access memory
- DRAM dynamic RAM
- SRAM static RAM
- ROM read-only memory
- EPROM erasable programmable read-only memory
- EEPROM electrically erasable programmable read-only memory
- NVRAM non-volatile RAM
- registers hard disk memory, a removable disk, a CD-ROM, or any other form of computer-readable storage medium known in the art.
- the above memory types are exemplary only, and are thus not limiting as to the types of memory usable for storage of a computer program.
- the computer system may be provided in the form of a computing device, such as a computing device 402 (shown in FIG. 53 ).
- Computing device 402 includes a processor 404 for executing instructions.
- executable instructions are stored in a memory area 406 .
- Processor 404 may include one or more processing units (e.g., in a multi-core configuration).
- Memory area 406 is any device allowing information such as executable instructions and/or other data to be stored and retrieved.
- Memory area 406 may include one or more computer-readable media. Therefore, the memory can be a non-transitory memory.
- the memory included in the computing device 402 may include a plurality of modules.
- Each module may include instructions configured to execute using at least one processor.
- the instructions contained in the plurality of modules may implement at least part of the method for simultaneously regulating a plurality of process parameters as described herein when executed by the one or more processors of the computing device.
- Non-limiting examples of modules stored in the memory of the computing device include: a first module to receive measurements from one or more sensors and a second module to control one or more devices of the MRI imaging system 1000 .
- Computing device 402 also includes one media output component 408 for presenting information to a user 400 .
- Media output component 408 is any component capable of conveying information to user 400 .
- media output component 408 includes an output adapter such as a video adapter and/or an audio adapter.
- An output adapter is operatively coupled to processor 404 and is further configured to be operatively coupled to an output device such as a display device (e.g., a liquid crystal display (LCD), organic light emitting diode (OLED) display, cathode ray tube (CRT), or “electronic ink” display) or an audio output device (e.g., a speaker or headphones).
- a display device e.g., a liquid crystal display (LCD), organic light emitting diode (OLED) display, cathode ray tube (CRT), or “electronic ink” display
- an audio output device e.g., a speaker or headphones.
- client computing device 402 includes an input device 410 for receiving input from user 400 .
- Input device 410 may include, for example, a keyboard, a pointing device, a mouse, a stylus, a touch sensitive panel (e.g., a touch pad or a touch screen), a camera, a gyroscope, an accelerometer, a position detector, and/or an audio input device.
- a single component such as a touch screen may function as both an output device of media output component 408 and input device 410 .
- Computing device 402 may also include a communication interface 412 , which is configured to communicatively couple to a remote device such as server system 302 or a web server.
- Communication interface 412 may include, for example, a wired or wireless network adapter or a wireless data transceiver for use with a mobile phone network (e.g., Global System for Mobile communications (GSM), 3G, 4G or Bluetooth) or other mobile data network (e.g., Worldwide Interoperability for Microwave Access (WI MAX)).
- GSM Global System for Mobile communications
- 3G, 4G or Bluetooth Wireless Fidelity
- WI MAX Worldwide Interoperability for Microwave Access
- Stored in memory 406 are, for example, computer-readable instructions for providing a user interface to user 400 via media output component 408 and, optionally, receiving and processing input from input device 410 .
- a user interface may include, among other possibilities, a web browser and an application. Web browsers enable users 400 to display and interact with media and other information typically embedded on a web page or a website from a web server. An application allows users 400 to interact with a server application.
- DSP digital signal processor
- ASIC application specific integrated circuit
- FPGA field programmable gate array
- exemplary general purpose processors include, but are not limited to only including, microprocessors, conventional processors, controllers, microcontrollers, state machines, or a combination of computing devices.
- DBSI-EIS images showing contrast based on the isotropic spectrum signal for Grade 4 glioblastoma cells, Grade 3 glioblastoma cells, Grade 1/2 glioblastoma cells, and a comparison FDOPA PET image are shown in FIG. 59 .
- FIG. 60 is a series of images comparing DSC perfusion imaging and corresponding DBSI perfusion imaging. DBSI-EIS correctly indicated this patient has Grade 2 tumor without higher grade components. DBSI perfusion is consistent with DSC images.
- the results of this experiment demonstrated the ability of DBSI-EIS to identify structural heterogeneity in a recurrent oligodendroglioma lesion, including various grades of glioblastoma and perfusion.
- DBSI-EIS images showing contrast based on the isotropic spectrum signal for Grade 4 glioblastoma cells, Grade 3 glioblastoma cells, Grade 1/2 glioblastoma cells, and a comparison FDOPA PET image are shown in FIG. 63 .
- DBSI-EIS accurately found that the tumor is grade II without hyper perfusion, consistent with pathology study and PET images.
- the results of this experiment demonstrated the ability of DBSI-EIS to identify structural heterogeneity in a recurrent oligodendroglioma lesion, including various grades of glioblastoma and perfusion.
- Example 3 DBSI-EIS Imaging of Diffuse Astrocytoma
- DBSI-EIS images showing contrast based on the isotropic spectrum signal for Grade 4 glioblastoma cells, Grade 3 glioblastoma cells, Grade 1/2 glioblastoma cells, and a comparison FDOPA PET image are shown in FIG. 66 .
- FIG. 67 is a graph summarizing mean SUVbw as a function of frame time, summarizing the PET FDOPA tracer binding dynamics. Referring to FIG. 67 there was no FDOPA evidence detecting tumor cells, which was inconsistent with pathology studies showing a Grade 2 tumor in this patient.
- DBSI-EIS images showing contrast based on the isotropic spectrum signal for Grade 4 glioblastoma cells, Grade 3 glioblastoma cells, and Grade 1/2 glioblastoma cells are shown in FIG. 70 .
- PET FDOPA failed to identify the tumor cells, but DBSI-EIS accurately detected the correct tumor type and was consistent with pathology biopsy study.
- the results of this experiment demonstrated the ability of DBSI-EIS to identify structural heterogeneity in a diffuse astrocytoma lesion, including various grades of glioblastoma and perfusion.
- DBSI-EIS images obtained using the previous DBSI method described herein above showing contrast based on free water, perfusion, and tumor is in FIG. 72 .
- DBSI-EIS images showing contrast based on the isotropic spectrum signal for Grade 4 glioblastoma cells, Grade 3 glioblastoma cells, and Grade 1/2 glioblastoma cells are shown in FIG. 73 .
- the results of this experiment demonstrated the ability of DBSI-EIS to identify structural heterogeneity in an oligodendroglioma lesion, including various grades of glioblastoma and perfusion.
- DBSI-EIS image the heterogeneity of brain lesions and tumors.
- a 47 year-old white male with flair lesion in the right frontal lobe was imaged using perfusion imaging ( FIG. 74 ), FLAIR imaging, and FDOPA PET imaging (see FIG. 75 ).
- DBSI-EIS images showing contrast based on the isotropic spectrum signal for Grade 4 glioblastoma cells, Grade 3 glioblastoma cells, and Grade 1/2 glioblastoma cells are shown in FIG. 76 .
- DBSI-EIS identify the grade 3 tumor cell more in the peripheral zone of the tumor less in the center, consistent to pathology studies
- the results of this experiment demonstrated the ability of DBSI-EIS to identify structural heterogeneity in an oligodendroglioma lesion, including various grades of glioblastoma and perfusion.
- the PET and MRI imaging were performed on a 3.0 Tesla PET/MRI system, Siemens Biograph mMR scanner (Siemens Health Care, Er Weg, Germany).
- FDOPA farnesoid Compared to normal brain tissue, brain tumors have increased uptake of FDOPA, and FDOPA uptake can be measured with PET. FDOPA is transported across the blood-brain barrier, and LAT1, an amino acid transporter, is one established marker of prognosis.
- a 66 year-old female with a recurrent oligodendroglioma WHO grade II tumor was imaged using FDOPA PET imaging (see FIG. 82 A and FIG. 88 A ), FLAIR imaging (see FIG. 82 B and FIG. 88 B ), and perfusion imaging (see FIG. 88 C and FIG. 88 D ).
- DBSI-EIS images showing contrast based on the isotropic spectrum signal for Grade 4 glioblastoma cells, Grade 3 glioblastoma cells, and Grade 1/2 glioblastoma cells are shown in FIGS. 83 A- 83 C .
- DBSI-EIS (NII) detected grade 2 tumor cells dominated at the site of biopsy (arrow and white square region), which was consistent with pathological study.
- FIG. 91 is a graph showing how DBSI-EIS derived perfusion fraction correlates to DSC CBV.
- NII DBSI-EIS
- FIG. 84 shows DBSI-EIS-derived tumor grade ratios for low grade gliomas for several patients.
- a 48 year-old male with a newly diagnosed oligodendroglioma WHO grade III tumor was imaged using FDOPA PET imaging (see FIG. 89 A ), FLAIR imaging (see FIG. 89 B ), and perfusion imaging (see FIG. 89 C and FIG. 89 D ).
- DBSI-EIS images showing contrast based on the isotropic spectrum signal for Grade 4 glioblastoma cells, Grade 3 glioblastoma cells, and Grade 1/2 glioblastoma cells are shown in FIGS. 85 A- 85 C .
- DBSI-EIS (NII) detected grade 2 and 3 tumor cells at the site of biopsy (arrow and white square region), which was consistent with pathological study.
- FIG. 87 A shows DBSI-EIS-derived tumor grade ratios for the grade 3 glioma for this patient.
- a 62 year-old male with a newly diagnosed glioblastoma WHO grade IV tumor was imaged using FDOPA PET imaging (see FIG. 90 A ), FLAIR imaging (see FIG. 90 B ), and perfusion imaging (see FIG. 90 C and FIG. 90 D ).
- DBSI-EIS images showing contrast based on the isotropic spectrum signal for Grade 4 glioblastoma cells, Grade 3 glioblastoma cells, and Grade 1/2 glioblastoma cells are shown in FIGS. 86 A- 86 C .
- DBSI-EIS (NII) detected grade 2, 3, and 4 tumor cells at the site of biopsy (arrow and white square region), which was consistent with pathological study. The tumor for this patient has substantial FDOPA uptake and matching FLAIR signal.
- FIG. 91 is a graph showing how DBSI-EIS derived perfusion fraction correlates to DSC CBV.
- NII DBSI-EIS
- FIG. 87 B shows DBSI-EIS-derived tumor grade ratios for the grade 4 glioma for this patient.
Landscapes
- Health & Medical Sciences (AREA)
- Life Sciences & Earth Sciences (AREA)
- Physics & Mathematics (AREA)
- Engineering & Computer Science (AREA)
- Nuclear Medicine, Radiotherapy & Molecular Imaging (AREA)
- General Health & Medical Sciences (AREA)
- Radiology & Medical Imaging (AREA)
- Biomedical Technology (AREA)
- Surgery (AREA)
- Veterinary Medicine (AREA)
- Public Health (AREA)
- Animal Behavior & Ethology (AREA)
- Biophysics (AREA)
- Pathology (AREA)
- Molecular Biology (AREA)
- Heart & Thoracic Surgery (AREA)
- Medical Informatics (AREA)
- Signal Processing (AREA)
- High Energy & Nuclear Physics (AREA)
- Artificial Intelligence (AREA)
- General Physics & Mathematics (AREA)
- Condensed Matter Physics & Semiconductors (AREA)
- Computer Vision & Pattern Recognition (AREA)
- Physiology (AREA)
- Psychiatry (AREA)
- Vascular Medicine (AREA)
- Evolutionary Computation (AREA)
- Fuzzy Systems (AREA)
- Mathematical Physics (AREA)
- Magnetic Resonance Imaging Apparatus (AREA)
- Medicines Containing Antibodies Or Antigens For Use As Internal Diagnostic Agents (AREA)
Abstract
Description
fij is the non-diffusion weighted signal intensity fraction of the anisotropic tensor delineated by (λ⊥_i, λ∥_i). As demonstrated by the schematic plot in
| TABLE 1 |
| Isotropic Spectrum Signals: Brain Tumors |
| Lower ADC | Upper ADC | |
| Threshold | Threshold | |
| Tissue/Cell Type | (×10−3 mm2/s) | (×10−3 mm2/s) |
| |
0 | 0.3 |
| |
0.3 | 0.5 |
| | ||
| Grade | ||
| 3 | 0.5 | 0.8 |
| | ||
| Grade | ||
| 1/2 | 0.8 | 1.8 |
| Glioblastoma | ||
| Edema | 1.8 | 2.5 |
| CSF | 2.5 | 4 |
| |
4 | 10 or more |
Claims (19)
Priority Applications (1)
| Application Number | Priority Date | Filing Date | Title |
|---|---|---|---|
| US16/329,608 US12016701B2 (en) | 2016-08-30 | 2017-08-30 | Quantitative differentiation of tumor heterogeneity using diffusion MR imaging data |
Applications Claiming Priority (3)
| Application Number | Priority Date | Filing Date | Title |
|---|---|---|---|
| US201662381223P | 2016-08-30 | 2016-08-30 | |
| US16/329,608 US12016701B2 (en) | 2016-08-30 | 2017-08-30 | Quantitative differentiation of tumor heterogeneity using diffusion MR imaging data |
| PCT/US2017/049440 WO2018045072A1 (en) | 2016-08-30 | 2017-08-30 | Quantitative differentiation of tumor heterogeneity using diffusion mr imaging data |
Publications (3)
| Publication Number | Publication Date |
|---|---|
| US20190223789A1 US20190223789A1 (en) | 2019-07-25 |
| US20210177348A9 US20210177348A9 (en) | 2021-06-17 |
| US12016701B2 true US12016701B2 (en) | 2024-06-25 |
Family
ID=61309351
Family Applications (1)
| Application Number | Title | Priority Date | Filing Date |
|---|---|---|---|
| US16/329,608 Active 2038-12-29 US12016701B2 (en) | 2016-08-30 | 2017-08-30 | Quantitative differentiation of tumor heterogeneity using diffusion MR imaging data |
Country Status (2)
| Country | Link |
|---|---|
| US (1) | US12016701B2 (en) |
| WO (1) | WO2018045072A1 (en) |
Families Citing this family (12)
| Publication number | Priority date | Publication date | Assignee | Title |
|---|---|---|---|---|
| EP3336572B1 (en) * | 2017-04-21 | 2020-09-23 | Siemens Healthcare GmbH | Determination of diffusion parameters via a comparison of magnetic resonance measurements with calculated datasets |
| KR101847342B1 (en) * | 2017-05-08 | 2018-04-11 | (주)센텍코리아 | Wearable body fat burning measurement device |
| US10831854B2 (en) * | 2018-03-08 | 2020-11-10 | International Business Machines Corporation | Web-based medical image viewer with web database |
| US10712412B2 (en) * | 2018-04-23 | 2020-07-14 | Wisconsin Alumni Research Foundation | System and method for stimulated echo based mapping (STEM) using magnetic resonance imaging (MRI) |
| CN111354442A (en) * | 2018-12-20 | 2020-06-30 | 中国医药大学附设医院 | Tumor imaging deep learning-assisted prognosis prediction system and method for cervical cancer patients |
| TWI681406B (en) * | 2018-12-20 | 2020-01-01 | 中國醫藥大學附設醫院 | Deep learning of tumor image-aided prediction of prognosis of patients with uterine cervical cancer system, method and computer program product thereof |
| US20250116740A1 (en) * | 2020-08-31 | 2025-04-10 | Jinghua Wang | System and method for detecting the transport of substances across a biological barrier |
| US20240290487A1 (en) * | 2021-03-16 | 2024-08-29 | Cornell University | Systems and methods for using deep-learning algorithms to facilitate decision making in gynecologic practice |
| ES3057364T3 (en) * | 2021-04-28 | 2026-03-02 | Inst Nat Sante Rech Med | System for helping diagnosing aggressive prostate cancers and related method |
| US12456197B2 (en) * | 2022-05-24 | 2025-10-28 | International Business Machines Corporation | Lesion detection and segmentation |
| CN121729176A (en) * | 2023-04-07 | 2026-03-24 | 哈佛学院院长及董事 | Magnetic Resonance Imaging Calibration System and Method |
| CN117422722B (en) * | 2023-12-19 | 2024-03-29 | 北京智源人工智能研究院 | Method and device for evaluating tumor prognosis characteristics based on ADC (analog-to-digital converter) image |
Citations (10)
| Publication number | Priority date | Publication date | Assignee | Title |
|---|---|---|---|---|
| US20030208116A1 (en) * | 2000-06-06 | 2003-11-06 | Zhengrong Liang | Computer aided treatment planning and visualization with image registration and fusion |
| US20080267468A1 (en) * | 2006-10-10 | 2008-10-30 | Paul Geiger | System and Method for Segmenting a Region in a Medical Image |
| US20100309223A1 (en) * | 2009-06-04 | 2010-12-09 | Ibm Corporation | Efficient memory management for path determination in memory space limited parallel processing systems |
| US20110282183A1 (en) * | 2010-05-17 | 2011-11-17 | Washington University In St. Louis | Diagnosis Of Central Nervous System White Matter Pathology Using Diffusion MRI |
| US20120049845A1 (en) | 2009-03-30 | 2012-03-01 | Hitachi, Ltd. | Magnetic resonance device |
| US20120280686A1 (en) | 2011-05-06 | 2012-11-08 | The Regents Of The University Of California | Measuring biological tissue parameters using diffusion magnetic resonance imaging |
| WO2013025487A1 (en) | 2011-08-12 | 2013-02-21 | The United States Of America, As Represented By The Secretary, Dpt Of Health And Human Services | Spin echo sequences for diffusion weighted imaging of moving media |
| WO2015057745A1 (en) | 2013-10-14 | 2015-04-23 | The Trustees Of Dartmouth College | High-resolution diffusion-weighted magnetic resonance imaging |
| US20150253410A1 (en) | 2012-09-28 | 2015-09-10 | Children's Medical Center Corporation | Diffusion-weighted mri using multiple b-values and constant echo time |
| US20160157746A1 (en) * | 2014-12-01 | 2016-06-09 | The Regents Of The University Of California | Diffusion reproducibility evaluation and measurement (dream)-mri imaging methods |
-
2017
- 2017-08-30 US US16/329,608 patent/US12016701B2/en active Active
- 2017-08-30 WO PCT/US2017/049440 patent/WO2018045072A1/en not_active Ceased
Patent Citations (10)
| Publication number | Priority date | Publication date | Assignee | Title |
|---|---|---|---|---|
| US20030208116A1 (en) * | 2000-06-06 | 2003-11-06 | Zhengrong Liang | Computer aided treatment planning and visualization with image registration and fusion |
| US20080267468A1 (en) * | 2006-10-10 | 2008-10-30 | Paul Geiger | System and Method for Segmenting a Region in a Medical Image |
| US20120049845A1 (en) | 2009-03-30 | 2012-03-01 | Hitachi, Ltd. | Magnetic resonance device |
| US20100309223A1 (en) * | 2009-06-04 | 2010-12-09 | Ibm Corporation | Efficient memory management for path determination in memory space limited parallel processing systems |
| US20110282183A1 (en) * | 2010-05-17 | 2011-11-17 | Washington University In St. Louis | Diagnosis Of Central Nervous System White Matter Pathology Using Diffusion MRI |
| US20120280686A1 (en) | 2011-05-06 | 2012-11-08 | The Regents Of The University Of California | Measuring biological tissue parameters using diffusion magnetic resonance imaging |
| WO2013025487A1 (en) | 2011-08-12 | 2013-02-21 | The United States Of America, As Represented By The Secretary, Dpt Of Health And Human Services | Spin echo sequences for diffusion weighted imaging of moving media |
| US20150253410A1 (en) | 2012-09-28 | 2015-09-10 | Children's Medical Center Corporation | Diffusion-weighted mri using multiple b-values and constant echo time |
| WO2015057745A1 (en) | 2013-10-14 | 2015-04-23 | The Trustees Of Dartmouth College | High-resolution diffusion-weighted magnetic resonance imaging |
| US20160157746A1 (en) * | 2014-12-01 | 2016-06-09 | The Regents Of The University Of California | Diffusion reproducibility evaluation and measurement (dream)-mri imaging methods |
Non-Patent Citations (15)
| Title |
|---|
| Bihan, Denis Le., The ‘wet mind’: water and functional neuroimaging, Physics In Medicine and Biology, 2007, pp. R57-R90, vol. 52, IOP Publishing. |
| Castillo M, Smith JK, Kwock L, Wilber K. Apparent diffusion coefficients in the evaluation of high-grade cerebral gliomas. AJNR Am J Neuroradiol. Jan. 2001;22(1):60-4. PMID: 11158889; PMCID: PMC7975568. (Year: 2001). * |
| Cheng YS, Lin C, Cheng YP, Yu YL, Tang CT, Hueng DY. Epithelial cell transformation sequence 2 is a potential biomarker of unfavorable survival in human gliomas. Neurol India. Jul.-Aug. 2014;62(4):406-9. doi: 10.4103/0028-3886.141278. PMID: 25237947. (Year: 2014). * |
| Cheng YW, Chung HW, Chen CY, Chou MC. Diffusion tensor imaging with cerebrospinal fluid suppression and signal-to-noise preservation using acquisition combining fluid-attenuated inversion recovery and conventional imaging: comparison of fiber tracking . Eur J Radiol. Jul. 2011;79(1): (Year: 2011). * |
| Chiang CW, Wang Y, Sun P, Lin TH, Trinkaus K, Cross AH, Song SK. Quantifying white matter tract diffusion parameters in the presence of increased extra-fiber cellularity and vasogenic edema. Neuroimage. Nov. 1, 2014;101:310-9. doi: 10.1016/j.neuroimage.2014.06.064. Epub Jul. 11, 2014. (Year: 2014). * |
| Huisman TA. Diffusion-weighted and diffusion tensor imaging of the brain, made easy. Cancer Imaging. Oct. 4, 2010;10 Spec No. A(1A):S163-71. doi: 10.1102/1470-7330.2010.9023. PMID: 20880787; PMCID: PMC2967146. (Year: 2010). * |
| Huisman, T A G M. "Diffusion-weighted and diffusion tensor imaging of the brain, made easy." Cancer imaging : the official publication of the International Cancer Imaging Society vol. 10 Spec No. A, 1A S163-71. Oct. 4, 2010, doi: 10.1102/1470-7330.2010.9023 (Year: 2010). * |
| International Search Report and Written Opinion for PCT Application No. PCT/US2017/049440 dated Nov. 7, 2017 (7 pages). |
| Murakami R, Hirai T, Sugahara T, Fukuoka H, Toya R, Nishimura S, Kitajima M, Okuda T, Nakamura H, Oya N, Kuratsu J, Yamashita Y. Grading astrocytic tumors by using apparent diffusion coefficient parameters: superiority of a one- versus two-parameter pilot method. Radiology. Jun. 2009; (Year: 2009). * |
| Murakami, R., Author Affiliations1From the Departments of Radiation Oncology (R.M., Caulo, M., Chu, H. H., Kang, Y. (Jun. 1, 2009). Grading Astrocytic Tumors by Using Apparent Diffusion Coefficient Parameters: Superiority of a One- versus Two-Parameter Pilot Method. Radiology. (Year: 2009). * |
| Murphy et al., "Magnetic Resonance Imaging Biomarker of Axon Loss Reflects Cervical Spondylotic Myelopathy Severity," Spine 41(9): 751-756 (May 2016). Retrieved from the Internet: <URL: https://www.ncbi.nlm.nih.gov/pubmed/26650876>. |
| Osamu Togao, Akio Hiwatashi, Koji Yamashita, Kazufumi Kikuchi, Masahiro Mizoguchi, Koji Yoshimoto, Satoshi O. Suzuki, Toru Iwaki, Makoto Obara, Marc Van Cauteren, Hiroshi Honda, Differentiation of high-grade and low-grade diffuse gliomas by intravoxel incoherent motion MR imaging, Neuro-Oncology (Year: 2015). * |
| Pradhan S, Bonekamp S, Gillen JS, Rowland LM, Wijtenburg SA, Edden RA, Barker PB. Comparison of single voxel brain MRS AT 3T and 7T using 32-channel head coils. Magn Reson Imaging. Oct. 2015;33(8):1013-8. doi: 10.1016/j.mri.2015.06.003. Epub Jun. 25, 2015. PMID: 26117693; PMCID: PMC4549223. (Year: 2015). * |
| Togao O, Hiwatashi A, Yamashita K, Kikuchi K, Mizoguchi M, Yoshimoto K, Suzuki SO, Iwaki T, Obara M, Van Cauteren M, Honda H. Differentiation of high-grade and low-grade diffuse gliomas by intravoxel incoherent motion MR imaging. Neuro Oncol. Jan. 2016; 18 (Year: 2016). * |
| Wang Y, Sun P, Wang Q, Trinkaus K, Schmidt RE, Naismith RT, Cross AH, Song SK. Differentiation and quantification of inflammation, demyelination and axon injury or loss in multiple sclerosis. Brain. May 2015;138(Pt 5):1223-38. doi: 10.1093/brain/awv046. Epub Feb. 26, 2015. (Year: 2015). * |
Also Published As
| Publication number | Publication date |
|---|---|
| US20190223789A1 (en) | 2019-07-25 |
| US20210177348A9 (en) | 2021-06-17 |
| WO2018045072A1 (en) | 2018-03-08 |
Similar Documents
| Publication | Publication Date | Title |
|---|---|---|
| US12016701B2 (en) | Quantitative differentiation of tumor heterogeneity using diffusion MR imaging data | |
| US10962619B2 (en) | Diagnosis of central nervous system white matter pathology using diffusion MRI | |
| US11672468B2 (en) | System and method for multi-modality quantification of neuroinflammation in central nervous system diseases | |
| Tong et al. | Advanced imaging of brain metastases: from augmenting visualization and improving diagnosis to evaluating treatment response | |
| Shenton et al. | A review of magnetic resonance imaging and diffusion tensor imaging findings in mild traumatic brain injury | |
| US20180055408A1 (en) | Quantitative differentiation of inflammation from solid tumors, heart and nerve injury | |
| Tsien et al. | Clinical applications for diffusion magnetic resonance imaging in radiotherapy | |
| Chawla et al. | Metabolic and physiologic magnetic resonance imaging in distinguishing true progression from pseudoprogression in patients with glioblastoma | |
| WO2019241266A1 (en) | Black-box assessment of disease and response-to-therapy by t1 or t2* weighted dce-mri | |
| US20230089375A1 (en) | 3d image analysis platform for neurological conditions | |
| US12430766B2 (en) | Methods and systems for analyzing brain lesions with longitudinal 3D MRI data | |
| Benzakoun et al. | Anatomical and functional MR imaging to define tumoral boundaries and characterize lesions in neuro-oncology | |
| Coolens et al. | Comparison of voxel-wise tumor perfusion changes measured with dynamic contrast-enhanced (DCE) MRI and volumetric DCE CT in patients with metastatic brain cancer treated with radiosurgery | |
| Loução et al. | A fast protocol for multiparametric characterisation of diffusion in the brain and brain tumours | |
| US20250204783A1 (en) | System and method for assessment of neuro-inflammation using magnetic resonance imaging (mri) | |
| Mostardeiro et al. | Whole-brain 3D MR fingerprinting brain imaging: clinical validation and feasibility to patients with meningioma | |
| CN116740066B (en) | Methods and devices for assessing cerebral oxygen uptake fraction and cerebral oxygen metabolic rate based on QSM | |
| Harritz et al. | Exploring IVIM‐DKI and DKI for Assessing Microvascular and Microstructural Changes After Traumatic Brain Injury | |
| Elliott et al. | Development and benchmarking diffusion magnetic resonance imaging analysis for integration into radiation treatment planning | |
| Chong | The Application of Diffusion MRI in Neurosurgery | |
| Lannan | Validation of MRtrix tractography for clinical use | |
| Gangolli et al. | Longitudinal MAP-MRI-based Assessment of Tissue Microstructural Alterations in Acute mTBI | |
| Ould Ismail et al. | Freewater EstimatoR using iNtErpolated iniTialization (FERNET): toward accurate estimation of free water in peritumoral region using single-shell diffusion MRI data | |
| Gangolli et al. | Quantifying Longitudinal Microstructural Changes in Mild Traumatic Brain Injury Patients with Mean Apparent Propagator MRI | |
| Tayebi et al. | BRAIN COMMUNICATIONS |
Legal Events
| Date | Code | Title | Description |
|---|---|---|---|
| STPP | Information on status: patent application and granting procedure in general |
Free format text: DOCKETED NEW CASE - READY FOR EXAMINATION |
|
| AS | Assignment |
Owner name: WASHINGTON UNIVERSITY, MISSOURI Free format text: ASSIGNMENT OF ASSIGNORS INTEREST;ASSIGNORS:WANG, YONG;BENZINGER, TAMMIE;GUZMAN, GLORIA;AND OTHERS;SIGNING DATES FROM 20190815 TO 20190826;REEL/FRAME:050177/0916 Owner name: WASHINGTON UNIVERSITY, MISSOURI Free format text: ASSIGNMENT OF ASSIGNORS INTEREST;ASSIGNORS:WANG, YONG;BENZINGER, TAMMIE;GUZMAN, GLORIA;AND OTHERS;SIGNING DATES FROM 20190815 TO 20190826;REEL/FRAME:050177/0967 |
|
| AS | Assignment |
Owner name: NATIONAL INSTITUTES OF HEALTH (NIH), U.S. DEPT. OF HEALTH AND HUMAN SERVICES (DHHS), U.S. GOVERNMENT, MARYLAND Free format text: CONFIRMATORY LICENSE;ASSIGNOR:WASHINGTON UNIVERSITY;REEL/FRAME:052626/0578 Effective date: 20200507 |
|
| STPP | Information on status: patent application and granting procedure in general |
Free format text: NON FINAL ACTION MAILED |
|
| STPP | Information on status: patent application and granting procedure in general |
Free format text: RESPONSE TO NON-FINAL OFFICE ACTION ENTERED AND FORWARDED TO EXAMINER |
|
| STPP | Information on status: patent application and granting procedure in general |
Free format text: FINAL REJECTION MAILED |
|
| STPP | Information on status: patent application and granting procedure in general |
Free format text: RESPONSE AFTER FINAL ACTION FORWARDED TO EXAMINER |
|
| STPP | Information on status: patent application and granting procedure in general |
Free format text: ADVISORY ACTION MAILED |
|
| STPP | Information on status: patent application and granting procedure in general |
Free format text: DOCKETED NEW CASE - READY FOR EXAMINATION |
|
| STPP | Information on status: patent application and granting procedure in general |
Free format text: NON FINAL ACTION MAILED |
|
| STPP | Information on status: patent application and granting procedure in general |
Free format text: RESPONSE TO NON-FINAL OFFICE ACTION ENTERED AND FORWARDED TO EXAMINER |
|
| STPP | Information on status: patent application and granting procedure in general |
Free format text: ADVISORY ACTION MAILED |
|
| STPP | Information on status: patent application and granting procedure in general |
Free format text: NON FINAL ACTION MAILED |
|
| STPP | Information on status: patent application and granting procedure in general |
Free format text: RESPONSE TO NON-FINAL OFFICE ACTION ENTERED AND FORWARDED TO EXAMINER |
|
| STPP | Information on status: patent application and granting procedure in general |
Free format text: NOTICE OF ALLOWANCE MAILED -- APPLICATION RECEIVED IN OFFICE OF PUBLICATIONS |
|
| ZAAB | Notice of allowance mailed |
Free format text: ORIGINAL CODE: MN/=. |
|
| STPP | Information on status: patent application and granting procedure in general |
Free format text: PUBLICATIONS -- ISSUE FEE PAYMENT RECEIVED |
|
| STPP | Information on status: patent application and granting procedure in general |
Free format text: PUBLICATIONS -- ISSUE FEE PAYMENT VERIFIED |
|
| STCF | Information on status: patent grant |
Free format text: PATENTED CASE |