US11892291B2 - Systems and methods improving optical coherence tomography (OCT) image resolution using k-linearization (KL) and dispersion correction (DC) - Google Patents
Systems and methods improving optical coherence tomography (OCT) image resolution using k-linearization (KL) and dispersion correction (DC) Download PDFInfo
- Publication number
- US11892291B2 US11892291B2 US17/666,726 US202217666726A US11892291B2 US 11892291 B2 US11892291 B2 US 11892291B2 US 202217666726 A US202217666726 A US 202217666726A US 11892291 B2 US11892291 B2 US 11892291B2
- Authority
- US
- United States
- Prior art keywords
- mirror
- mirror measurement
- signal
- measurement
- oct
- Prior art date
- Legal status (The legal status is an assumption and is not a legal conclusion. Google has not performed a legal analysis and makes no representation as to the accuracy of the status listed.)
- Active, expires
Links
- 238000000034 method Methods 0.000 title claims abstract description 137
- 239000006185 dispersion Substances 0.000 title claims abstract description 76
- 238000012937 correction Methods 0.000 title claims abstract description 25
- 238000012014 optical coherence tomography Methods 0.000 title description 120
- 230000003287 optical effect Effects 0.000 claims abstract description 51
- 230000003595 spectral effect Effects 0.000 claims abstract description 46
- 238000005259 measurement Methods 0.000 claims description 157
- 230000006870 function Effects 0.000 claims description 60
- 230000015654 memory Effects 0.000 claims description 24
- 230000004044 response Effects 0.000 claims description 22
- 238000012545 processing Methods 0.000 claims description 19
- 238000004891 communication Methods 0.000 claims description 11
- 238000012952 Resampling Methods 0.000 claims description 9
- 238000001228 spectrum Methods 0.000 abstract description 76
- 230000008569 process Effects 0.000 abstract description 34
- 238000004422 calculation algorithm Methods 0.000 abstract description 14
- 238000012986 modification Methods 0.000 abstract description 4
- 230000004048 modification Effects 0.000 abstract description 4
- 238000003384 imaging method Methods 0.000 description 58
- 239000000523 sample Substances 0.000 description 47
- 238000005516 engineering process Methods 0.000 description 29
- 238000005070 sampling Methods 0.000 description 27
- 238000005457 optimization Methods 0.000 description 9
- 238000004590 computer program Methods 0.000 description 8
- 238000010586 diagram Methods 0.000 description 7
- 238000003860 storage Methods 0.000 description 7
- 230000006872 improvement Effects 0.000 description 6
- 239000000835 fiber Substances 0.000 description 5
- 238000013480 data collection Methods 0.000 description 4
- 239000013307 optical fiber Substances 0.000 description 4
- 230000009471 action Effects 0.000 description 3
- 230000008901 benefit Effects 0.000 description 3
- 230000008859 change Effects 0.000 description 3
- 210000004351 coronary vessel Anatomy 0.000 description 3
- 238000001514 detection method Methods 0.000 description 3
- 238000001727 in vivo Methods 0.000 description 3
- 239000000203 mixture Substances 0.000 description 3
- 239000004065 semiconductor Substances 0.000 description 3
- 230000005540 biological transmission Effects 0.000 description 2
- 238000011960 computer-aided design Methods 0.000 description 2
- 238000007689 inspection Methods 0.000 description 2
- 238000012804 iterative process Methods 0.000 description 2
- 238000004519 manufacturing process Methods 0.000 description 2
- 230000006855 networking Effects 0.000 description 2
- 238000012805 post-processing Methods 0.000 description 2
- 238000006467 substitution reaction Methods 0.000 description 2
- 230000002792 vascular Effects 0.000 description 2
- 238000012935 Averaging Methods 0.000 description 1
- OYPRJOBELJOOCE-UHFFFAOYSA-N Calcium Chemical compound [Ca] OYPRJOBELJOOCE-UHFFFAOYSA-N 0.000 description 1
- 208000031481 Pathologic Constriction Diseases 0.000 description 1
- 238000002399 angioplasty Methods 0.000 description 1
- 238000013459 approach Methods 0.000 description 1
- 230000000903 blocking effect Effects 0.000 description 1
- 210000004204 blood vessel Anatomy 0.000 description 1
- 229910052791 calcium Inorganic materials 0.000 description 1
- 239000011575 calcium Substances 0.000 description 1
- 238000004364 calculation method Methods 0.000 description 1
- 230000015556 catabolic process Effects 0.000 description 1
- 238000006243 chemical reaction Methods 0.000 description 1
- 230000001427 coherent effect Effects 0.000 description 1
- 239000002131 composite material Substances 0.000 description 1
- 238000010276 construction Methods 0.000 description 1
- 208000029078 coronary artery disease Diseases 0.000 description 1
- 230000003247 decreasing effect Effects 0.000 description 1
- 238000006731 degradation reaction Methods 0.000 description 1
- 230000001934 delay Effects 0.000 description 1
- 230000023077 detection of light stimulus Effects 0.000 description 1
- 238000002059 diagnostic imaging Methods 0.000 description 1
- 238000002405 diagnostic procedure Methods 0.000 description 1
- 230000002526 effect on cardiovascular system Effects 0.000 description 1
- 230000000694 effects Effects 0.000 description 1
- 230000008030 elimination Effects 0.000 description 1
- 238000003379 elimination reaction Methods 0.000 description 1
- 230000004927 fusion Effects 0.000 description 1
- 238000011065 in-situ storage Methods 0.000 description 1
- 238000005305 interferometry Methods 0.000 description 1
- 239000000463 material Substances 0.000 description 1
- 230000009022 nonlinear effect Effects 0.000 description 1
- 210000000056 organ Anatomy 0.000 description 1
- 230000037361 pathway Effects 0.000 description 1
- 229920003223 poly(pyromellitimide-1,4-diphenyl ether) Polymers 0.000 description 1
- 239000002096 quantum dot Substances 0.000 description 1
- 238000002310 reflectometry Methods 0.000 description 1
- 238000011160 research Methods 0.000 description 1
- 208000037804 stenosis Diseases 0.000 description 1
- 230000036262 stenosis Effects 0.000 description 1
- 230000001629 suppression Effects 0.000 description 1
- 238000001356 surgical procedure Methods 0.000 description 1
- 238000012360 testing method Methods 0.000 description 1
- 238000003325 tomography Methods 0.000 description 1
- 230000001131 transforming effect Effects 0.000 description 1
Images


Classifications
-
- G—PHYSICS
- G01—MEASURING; TESTING
- G01B—MEASURING LENGTH, THICKNESS OR SIMILAR LINEAR DIMENSIONS; MEASURING ANGLES; MEASURING AREAS; MEASURING IRREGULARITIES OF SURFACES OR CONTOURS
- G01B9/00—Measuring instruments characterised by the use of optical techniques
- G01B9/02—Interferometers
- G01B9/0209—Low-coherence interferometers
- G01B9/02091—Tomographic interferometers, e.g. based on optical coherence
-
- G—PHYSICS
- G01—MEASURING; TESTING
- G01B—MEASURING LENGTH, THICKNESS OR SIMILAR LINEAR DIMENSIONS; MEASURING ANGLES; MEASURING AREAS; MEASURING IRREGULARITIES OF SURFACES OR CONTOURS
- G01B9/00—Measuring instruments characterised by the use of optical techniques
- G01B9/02—Interferometers
- G01B9/02001—Interferometers characterised by controlling or generating intrinsic radiation properties
- G01B9/02002—Interferometers characterised by controlling or generating intrinsic radiation properties using two or more frequencies
- G01B9/02004—Interferometers characterised by controlling or generating intrinsic radiation properties using two or more frequencies using frequency scans
-
- G—PHYSICS
- G01—MEASURING; TESTING
- G01B—MEASURING LENGTH, THICKNESS OR SIMILAR LINEAR DIMENSIONS; MEASURING ANGLES; MEASURING AREAS; MEASURING IRREGULARITIES OF SURFACES OR CONTOURS
- G01B9/00—Measuring instruments characterised by the use of optical techniques
- G01B9/02—Interferometers
- G01B9/02055—Reduction or prevention of errors; Testing; Calibration
- G01B9/02062—Active error reduction, i.e. varying with time
- G01B9/02064—Active error reduction, i.e. varying with time by particular adjustment of coherence gate, i.e. adjusting position of zero path difference in low coherence interferometry
-
- G—PHYSICS
- G01—MEASURING; TESTING
- G01B—MEASURING LENGTH, THICKNESS OR SIMILAR LINEAR DIMENSIONS; MEASURING ANGLES; MEASURING AREAS; MEASURING IRREGULARITIES OF SURFACES OR CONTOURS
- G01B9/00—Measuring instruments characterised by the use of optical techniques
- G01B9/02—Interferometers
- G01B9/02055—Reduction or prevention of errors; Testing; Calibration
- G01B9/0207—Error reduction by correction of the measurement signal based on independently determined error sources, e.g. using a reference interferometer
- G01B9/02072—Error reduction by correction of the measurement signal based on independently determined error sources, e.g. using a reference interferometer by calibration or testing of interferometer
-
- G—PHYSICS
- G01—MEASURING; TESTING
- G01B—MEASURING LENGTH, THICKNESS OR SIMILAR LINEAR DIMENSIONS; MEASURING ANGLES; MEASURING AREAS; MEASURING IRREGULARITIES OF SURFACES OR CONTOURS
- G01B9/00—Measuring instruments characterised by the use of optical techniques
- G01B9/02—Interferometers
- G01B9/02083—Interferometers characterised by particular signal processing and presentation
- G01B9/02084—Processing in the Fourier or frequency domain when not imaged in the frequency domain
-
- G—PHYSICS
- G01—MEASURING; TESTING
- G01B—MEASURING LENGTH, THICKNESS OR SIMILAR LINEAR DIMENSIONS; MEASURING ANGLES; MEASURING AREAS; MEASURING IRREGULARITIES OF SURFACES OR CONTOURS
- G01B2210/00—Aspects not specifically covered by any group under G01B, e.g. of wheel alignment, caliper-like sensors
- G01B2210/58—Wireless transmission of information between a sensor or probe and a control or evaluation unit
Definitions
- the disclosure relates generally to the field of vascular system imaging and data collection systems and methods.
- the disclosure relates to methods of improving the resolution of images obtained in optical coherence tomography systems.
- OCT Optical Coherence Tomography
- the axial resolution of OCT images can be degraded with broadening sidelobe artifacts by chromatic dispersion and non-linear wavenumber sampling.
- Many OCT systems sample the interference pattern with a non-uniform wavenumber (k) interval. This can introduce a “chirp” or noise into the signal which can depend on the path length difference the OCT signal takes.
- Chromatic dispersion is inherent in optical systems and can be managed through carefully controlling the optical fibers and other components in the system.
- Wavenumber linearization poses a more difficult technical challenge and has been performed by applying numerical methods, such as numerical rescaling methods based on a fringe signal from a mirror in an OCT system, or through the use of an external sampling clock (k-clock) used in the current OPTIS integrated system commercially available through Abbott vascular.
- k-clock external sampling clock
- Nonlinear sampling from k-delay errors leads to degradation of axial resolution and imaging artifacts such as broadening sidelobes. Even with the precise adjustment of k-delay, small amounts of system dispersion can directly degrade the resolution. In a dispersion-free system, the k-clock delay can be precisely adjusted by placing a mirror in the sample arm and minimizing the linewidth. However, in a dispersive system, the combination of k-linearization and chromatic dispersion leads to the k-delay adjustment which are only able to achieve optimal resolution at a specific depth. Further, even when a swept source OCT engine is optically optimized, electronics such as band-pass filters and cables can introduce unexpected wavenumber delays in an external sampling clock.
- the disclosure relates to a system and method of to simultaneously correct the issue of nonlinear sampling and chromatic dispersion without the need for additional hardware modification, a priori knowledge of dispersive order, precise mirror alignment, and computational cost associated with other systems and methods which have been proposed to date.
- the disclosure relates to systems and methods to obtain calibration data for an OCT system at a variety of calibration depth as well as a calibration process which optimizes the spectra using wavenumber linearization or k-linearization (KL), dispersion correction (DC), and spectral flattening (SF).
- KL wavenumber linearization or k-linearization
- DC dispersion correction
- SF spectral flattening
- aspects of the disclosed technology an algorithm to compensate the k-delay bias and system dispersion without additional hardware and a priori knowledge of the system dispersion. Further, aspects of the disclosed technology do not require the mirror positions to be precisely aligned at the same position by using their proposed phase shifting process.
- aspects of the disclosed technology allow for an increase in the useful imaging depth of a spectral domain OCT system and swept-source OCT system as compared to the limits of 14% and 20% in currently published methods.
- aspects of the disclosed technology involves polynomial optimization processes by using 3 or more mirror sampling positions at different depths, with at least two depths in the positive imaging plane, to optimize the k-linearization spectrum and preserve the improved resolution and SNR across depths of 80% or more of the Nyquist depth.
- an imaging depth of more than 6 mm can be enabled by the disclosed technology at higher precision, improving OCT image resolution and SNR in applications such as detecting calcium plaque surrounding the coronary vessel (which requires depths of up to 6 mm).
- aspects of the disclosed technology do not require oversampling or any upscaling and can be implemented on the order of a few seconds enabling use of the product in real time. Further, the computational efficiency enables the proposed algorithms to be implemented on a live sample being imaged using OCT techniques.
- the proposed method improves the system signal-to-noise (SNR) ratio by 3-5 decibels (dB) by using the 1 GHz internal sampling rate of the analog-to-digital (A/D) card which is faster than the k-clock frequency.
- SNR system signal-to-noise
- A/D analog-to-digital
- the faster internal sampling rate of the analog-to-digital card increases the sampling points which can enhance the image contrast after the Fourier Transform as the system noise is averaged incoherently but the signal adds coherently.
- aspects of the disclosed technology enable use within existing commercial intravascular OCT products through software or method changes to provide enhanced axial resolution by compensating the k-delay bias, system dispersion and spectral flattening, extended higher resolution depths by using the optimized KLDCSF spectrum and low computational cost.
- aspects of the disclosed technology enable the elimination of the k-clock and enable the use of the internal sampling provided by an analog-to-digital (A/D) card improving system SNR and imaging depth. This is especially ideal for future high-speed OCT systems as they require faster sampling rates to reach signals from deeper depths.
- A/D analog-to-digital
- aspects of the disclosed technology include a method of processing an optical signal to improve resolution of an optically acquired image.
- the method can comprise calibrating an optical system, the calibration comprising (i) acquiring, by one or more processors, at least a first mirror measurement and a second mirror measurement, the first and second mirror measurement being collected from either side of a zero-delay line, each mirror measurement being an interferogram or a signal or a system impulse response, (ii) obtaining, by the one or more processors, an amplitude and phase for the first mirror measurement and the second mirror measurement, (iii) resampling, at least one of the first mirror measurement and the second mirror measurement to be at least one of: (a) in linear wavenumber (k) space or (b) linear wavelength, to generate a resampled mirror measurement, and (iv) calculating, using a function, an optimized fit for the resampled mirror measurement. While two mirror measurements are used in some examples, in other examples additional mirror measurements may be used. For example, the calibration may be
- the method can comprise calibrating an optical system, the calibration comprising (i) acquiring, by one or more processors, at least a first mirror measurement and a second mirror measurement, the first and second mirror measurement being collected from either side of a zero-delay line, each mirror measurement being an interferogram or a signal or a system impulse response, (ii) obtaining, by the one or more processors, an amplitude and phase for the first mirror measurement and the second mirror measurement, (iii) resampling, at least one of the first mirror measurement and the second mirror measurement to be at least one of: (a) in linear wavenumber (k) space or (b) linear wavelength, to generate a resampled mirror measurement, and (iv) calculating, using a function, an optimized fit for the resampled mirror measurement.
- the function used to resample the data can be one of a polynomial function, cubic or other spline fitting function, radial basis function, or a piece-wise function.
- K-linearization can be performed on the raw interferogram of mirror measurements with and without k-clocks, and generate the resampled interferogram, wherein the resampled mirror measurement is in k-space.
- Optimization of the K-linearization function can be based on a polynomial fitting order of order 1 to n, where n is a fixed integer.
- the polynomial fitting order minimizing the sum of: (i) the area of point-spread function and/or (ii) full-width half max (FWHM) resolution for each of the mirror measurements can be found as part of the method.
- the optimized polynomial can be determined based on two or more mirror measurements.
- a dispersion spectrum or criteria can be calculated for at least one mirror measurement and a compensation can be calculated.
- a dispersion compensation, dispersion factor, or dispersion criteria can be calculated using two mirror positions with one position on either side of the “zero-delay line”.
- Spectral flattening can be performed on at least one mirror measurement by using an envelope calculated from a specific mirror measurement. A spectral envelope calculated during spectral flattening can be saved.
- Each mirror measurement of the plurality of mirror measurements can be a system impulse response.
- Calibration criteria related to (i) k-linearization (KL), (ii) dispersion correction (DC), and (iii) spectral flattening (SF) can be saved.
- An OCT signal or interference signal from a specimen can be received.
- a new fringe can be generated or an interferogram can be resampled after linear k-interpolation to k-linearize the received OCT signal or interference signal by using the KL calibration criteria can be generated.
- Dispersion correction can be performed on the k-linearized OCT signal or interference signal using the DC calibration criteria.
- the envelope of the k-linearized and dispersion corrected OCT signal or interference signal can be removed.
- the OCT signal or interference signal can be converted to an OCT image for display on a display.
- the method can comprise generating an OCT image from an OCT signal, the method comprising obtaining an OCT signal corresponding to a specimen, wavelength (k) linearizing the OCT signal to generate a k-linearized (KL) OCT signal, dispersion correcting (DC) the KL OCT signal to generate an KL DC OCT signal, spectral flattening (sf) the KLDC OCT signal to generate a final KLDCsf OCT signal, and performing post-processing on the final OCT signal to generate an OCT image.
- KL OCT signal, KL DC OCT signal, and final KLDCsf OCT signal are based on calibration criteria generated at a calibration stage.
- the OCT signal can be an interferogram.
- the calibration criteria can be generated at the calibration stage using at least a first mirror measurement and a second mirror measurement, the first and second mirror measurement being collected from either side of a zero-delay line, each mirror measurement being an interferogram or a signal or a system impulse response.
- the disclosed technology include a system for displaying sets of images.
- the system can comprise a memory for storing image data and time varying data that corresponds to a subject, one or more processors in communication with the memory.
- the one or more processors can be operable to acquire a first mirror measurement and a second mirror measurement, the first and second mirror measurement being collected from either side of a zero-delay line, each mirror measurement being an interferogram or a signal or a system impulse response; compute, by the one or more processors, an amplitude and phase for the first mirror measurement and the second mirror measurement, resample, at least one of the first mirror measurement and the second mirror measurement to be at least one of: (i) in linear wavenumber(k) space, and (ii) linear wavelength, to generate a resampled mirror measurement, and calculate, using a function, an optimized fit for the resampled mirror measurement.
- the system can be configured to perform the steps of any of the preceding methods.
- aspects of the disclosed technology include a system for performing optical coherence tomography on a sample.
- the system can comprise a light source, a reference mirror with variable position, a display, a memory for storing image data that corresponds to a sample, one or more processors in communication with the memory.
- the one or more processors can be operable to obtain at least one calibration parameter each time the system is initiated, obtain a signal from the sample, apply the at least one calibration parameter to the obtained signal, the calibration parameter being at least one of a wavelength linearization, a dispersion correction, or a spectral flattening parameter, and generate an image from the corrected obtained signal.
- the system can further comprise an optical switch and a calibration mirror configured to cause a calibration signal to be generated.
- the system can be configured to perform the steps of any of the preceding methods.
- FIG. 1 A shows a schematic diagram of an imaging and data collection system in accordance with aspects of the disclosure.
- FIG. 1 B shows exemplary positioning of a reference mirror of an example in accordance with aspects of the disclosure.
- FIG. 1 C shows a schematic diagram of an imaging and data collection system in accordance with aspects of the disclosure.
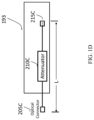
- FIG. 1 D is a block diagram of an example calibration mirror, according to aspects of the disclosure.
- FIG. 2 shows an example computing device to conduct imaging and data collection in accordance with aspects of the disclosure.
- FIG. 3 shows a flow diagram of a method in accordance with aspects of the disclosure.
- FIG. 4 A illustrates aspects of obtained interferogram in accordance with aspects of the disclosure.
- FIG. 4 B illustrates aspects of the nonlinear effects due to system dispersion based on the curves of calibrated k-spectrum by KL process and ideal linearized k spectrum.
- FIG. 4 B also shows effective correction on uncalibrated k spectrum by applying KL process.
- the dash line is the optical phase calculated after k-linearization process.
- FIG. 4 C illustrates aspects of intensity at various imaging depths with and without k-spectrum optimization in accordance with aspects of the disclosure.
- FIG. 4 D illustrates aspects of a raw dispersion phase and a polynomial fit of the dispersion phase in accordance with aspects of the disclosure.
- FIG. 4 E illustrates a KLDC corrected fringe and an envelope calculated for the corrected fringe in accordance with aspects of the disclosure.
- FIG. 5 shows a flow diagram of a method in accordance with aspects of the disclosure.
- FIG. 6 A shows a raw and a k-linearized optical signal in accordance with aspects of the disclosure.
- FIG. 6 B illustrates a magnified view of the interferogram and the corresponding intensity resulting from a mirror reflection in the sample arm in accordance with aspects of the disclosure.
- FIG. 6 C shows the raw fringe and before and after spectral flattening in accordance with aspects of the disclosure.
- FIG. 6 D illustrates various aspects of full-width half maximum (FWHM) plotted against various depths for k-clock data, KL data, KLDC data, and KLDCsf data in accordance with aspects of the disclosure.
- FWHM full-width half maximum
- FIG. 7 shows a method to obtain an intensity image in accordance with aspects of the disclosure.
- FIG. 8 shows an example of improvement in the width of the point spread function (PSF) and resolution chart according to aspects of this disclosure.
- FIG. 9 illustrates aspects of a PSF with strong dispersion at various imaging depths with and without KLDCsf techniques in accordance with aspects of the disclosure.
- FIG. 10 illustrates aspects of FWHM and signal to noise ratio without k delay adjustment and strong dispersion with k-clock data, KLDCsf data, and KLDCsf data with optimized k-spectrum in accordance with aspects of the disclosure.
- FIG. 11 illustrates aspects of an intensity a-line using KLDCsf with and without an optimized k-spectrum in accordance with aspects of the disclosure.
- An “A-line” or “axial line” corresponds to one wavelength sweep of a laser which in turn corresponds to a one-dimensional line scan.
- FIG. 12 illustrates aspects of data sampled linearly in time (wavelength) without k-clocks and data processed using KLDCsf methods in accordance with aspects of the disclosure.
- FIG. 13 illustrates aspects of FWHM using data resampled using a k-clock and using A/D card internal sampling with KLDCsf techniques at various imaging depths in accordance with aspects of the disclosure.
- the disclosure relates to a calibration process which can calculate the spectra of k-linearization (KL), dispersion, and spectral flattening.
- the calibration process can provide a set of calibration spectra.
- OCT signals, including raw fringe data, with a mirror in the sample arm can be acquired from the positive and negative planes separately by adjusting the reference arm path distance.
- Calibration spectra can be calculated based on the phase retrieved by using a Hilbert transform process.
- the disclosure relates to utilizing an obtained calibration spectra to modify or correct an interferogram prior to Fast Fourier Transform (FFT) processing.
- the calibration spectra can be used to linearize future fringe data acquired by the system in wavenumber domain for an improved interferogram.
- wavenumber sampling can be linearized by interpolation using the calibration spectrum (k-linearization).
- Dispersion can be corrected by applying a Hilbert transform and multiplication with the dispersion spectrum of the k-linearized interferogram.
- the disclosure can further relate to suppression of sidelobe artifacts caused from non-uniform laser intensity during a spectral sweep through the flattening of the spectral envelope of the laser source to optimize the laser bandwidth.
- aspects of the disclosure provide systems and method that correct not only k-spectrum nonlinearity, but also the dispersion and asymmetric laser sweep intensity separately by using the calibrated spectra with signal processing steps.
- the disclosure allows for an optimized optical resolution to be maintained across the entire imaging depth.
- the algorithms, methods, and systems discussed in this disclosure can also work with without a k-clock providing an option to improve system SNR by using the internal sampling rate of the digitizer which is typically faster than the maximum frequency of the k-clock.
- an OCT imaging engine includes an internal reference reflector, or calibration mirror, for automatically receiving information corresponding to the quality of the OCT imaging engine.
- the reference reflector may be internal to a sample arm of the OCT imaging engine can be used to receive optical signals for performing various diagnostic processes for quantifying the performance of the OCT imaging engine.
- the OCT imaging engine can self-assess its performance by computing system performance data, which can include one or more of a point-spread function (PSF), a Full-Width Half Maximum (FWHM), a noise level, signal-to-noise ratio, and the dynamic range of the system.
- PSF point-spread function
- FWHM Full-Width Half Maximum
- noise level signal-to-noise ratio
- dynamic range of the system the dynamic range of the system.
- the reference reflector may be coupled to the rest of the OCT imaging engine through an optical switch, allowing the OCT imaging engine to switch between an imaging mode and a self-inspection mode.
- the OCT imaging engine can sample optical signals for generating a calibration spectra, using a reference reflector internal to the system. Because the reference reflector is internal, the OCT imaging engine can perform the self-inspection and calibration automatically, without requiring user input or an external device to be connected to the system first.
- a system impulse response or an impulse response is the response to a brief input signal, which is the impulse.
- a system impulse response can be the response obtained from an impulse of light on a sample.
- the system impulse response can be the reflection obtained from a single mirror in a sample arm (as explained below).
- the system impulse response is obtained from a wavelength swept laser.
- an interferogram or an interference pattern can be a pattern formed by wave interference, such as for example, by interference of waves of light from a reference arm and a sample arm of an OCT system.
- An interferogram can also be thought of as a time varying signal which can be converted using an analog to digital converter.
- OCT is a catheter-based imaging modality that uses light to peer into coronary artery walls and generate images thereof for study. Utilizing coherent light, interferometry, and micro-optics, OCT can provide video-rate in-vivo tomography within a diseased vessel with micrometer level resolution. Viewing subsurface structures with high resolution using fiber-optic probes makes OCT especially useful for minimally invasive imaging of internal tissues and organs. This level of detail made possible with OCT allows a user to diagnose as well as monitor the progression of coronary artery disease.
- OCT imaging of portions of a patient's body provides a useful diagnostic tool for doctors and others. For example, imaging of coronary arteries by intravascular OCT may reveal the location of a narrowing or stenosis. This information helps cardiologists to choose between an invasive coronary bypass surgery and a less invasive catheter-based procedure such as angioplasty or stent delivery. Although a popular option, stent delivery has its own associated risks.
- FIG. 1 A illustrates an example OCT system 100 according to aspects of this disclosure.
- OCT system 100 is or incorporates an optical interferometer.
- FIG. 1 A person of skill in the art will appreciate that although one configuration of an OCT system is illustrated in FIG. 1 , variations of the system, and different implementations, such as in-vivo OCT systems are within the scope of the disclosure.
- Direction of light or electrical signals is indicated by arrows within FIG. 1 .
- Light source 110 can be a source of low-coherence light able to capture micro-meter or lower levels of resolutions.
- the light source can generate light which is in the visible wavelength range as well as light beyond that wavelength range.
- ultra-broad output of the wavelength of light is desirable.
- a laser can be used as a light source.
- a light emitting diode can be used as a light source.
- light generated at light source 110 can be sent through a collimation lens.
- Light from light source 110 can be sent to beam splitter 120 .
- Beam splitter 120 can be an optical device which splits a beam of light from light source 110 into two or more beams. Light split by beam splitter can move to reference mirror 130 and to sample 140 . Aspects of reference mirror 130 are explained further with respect to FIG. 1 B .
- Sample 140 can be an organic sample or other sample upon which OCT can performed. In some examples, sample 140 can be studied internally as is the case with in-vivo OCT scans.
- Light can be reflected from both reference mirror 130 and sample 140 through an optical path which crosses the beam splitter and directs the light to photodiode 150 .
- Photodiode 150 can be a semiconductor or other device which converts light into an electrical current and enables the detection of light.
- Photodiode 150 may contain multiple optical filters, lens, or other components to focus light and increase a signal to noise ratio. Signals generated at photodiode 150 may be converted from an analog to a digital signal and processed by a digital signal processor 160 .
- a digital signal processor can be a specialized microprocessor or integrated chip with architecture and/or software optimized for the operational needs of digital signal processing.
- digital processor 160 can enable the information generated at photodiode 150 to be processed and sampled by the k-clock signal at 191 and converted into an image for display on display 170 .
- Display 170 can display an image related to sample 140 .
- display 170 may be a monitor, OLED screen, LCD screen, television, electroluminescent display, or quantum dot display.
- Other specialized screens or displays for specialized contrast ratios or ease of displaying OCT information can also be used as display 170 .
- K-clock 190 in also illustrated in FIG. 1 A .
- the arrival time of the signal from the k-clock output to the A/D card is not synced with the signal from the main interferometer to the A/D card the interferogram cannot be sampled correctly.
- Syncing problems can be introduced by mismatched optical fiber lengths and electronic connections after the photodiode 191 and 150 , such as for example, bandpass filters or electrical cable lengths. In some examples, only a few percent, such as 2-3% of the light can be transmitted to the k-clock.
- K-clock 190 can consist of a 90° phase shifter, zero-crossing detection units, XOR gate or an OR gate, or any combination of similar elements.
- Beam splitter 180 can also split light to a k-clock 190 and beam splitter 120 .
- a small amount of light can be transmitted through the beam splitter to the k-clock
- Photodiode 191 can be similar to photodiode 150 and be connected to the k-clock and analyze light incident on photodiode 191 .
- Photodiode 191 can be connected to digital signal processor 160 . As a portion of the light is transmitted through the k-clock, that light can be analyzed separately from the light incident or obtained from the sample 140 .
- optical couplers can be used to achieve the same or an equivalent setup as described with respect to FIG. 1 A .
- Light can take a pathway as determined by the fiber optic wire.
- beam splitter 180 and beam splitter 120 can consist of fiber optic couplers which split one input fiber into two output fibers, and split input light into two paths.
- various components can be linked, controlled, communicated with through suitable a computing system, such as computing system 200 further described below with reference to FIG. 2 .
- FIG. 1 B illustrates aspects of reference mirror 130 .
- Reference mirror 130 can be a mirror or other reflective surface with high reflectivity and optical properties to enable reflection of photons.
- Reference mirror 130 can be included in a reference arm of OCT system 100 . By scanning the mirror in the reference arm along with light from sample 140 , an interference pattern can be generated from which an OCT image can be reconstructed.
- reference mirror 130 can be moved at various positions on either side of a “zero-delay line.”
- Various positions, such as positions P1, P2, and P3 can move the image of the mirror to different depth pixels.
- Position ⁇ P1 and P1 can be either equidistant to the zero-delay line or not.
- the pixel depth can range from +1024 pixels to ⁇ 1024 pixels.
- the pixel depth can depend on the half of the total amount of the pixels numbers used before FFT, according to k-clock total samples or internal sampling rate of A/D cards, and zero-padded data length before FFT.
- the imaging depth from pixel depth 0 to pixel depth 1024 is determined by the formula: ⁇ (central wavelength) 2 /(2*laser bandwidth) ⁇ *(0.5*total number of the sample point from an OCT fringe).
- the position of reference mirror 130 can change the interference pattern generated from light returning from sample 140 .
- the position of the reference mirror 130 can be used to generate information related to the performance of the optical system and be used in the methods described herein.
- information generated from positions P1 and P2 can be used to calculate the spectra wavelength linearization and the spectral flattening spectra, as further explained with reference to FIG. 6 C .
- FIG. 1 C can illustrates an OCT system with an integrated mirror in the sample arm, system 199 .
- FIG. 1 C shows that system 199 can be similar to system 100 , but can further contain an additional calibration mirror 193 and an optical switch 192 .
- Optical switch 192 can be optically coupled between the beam splitter 120 on one end and between sample 140 and calibration mirror 193 on the other end.
- the signal from the calibration mirror 193 in conjunction with the variable position reference mirror 130 will allow the system to perform the KLDCsf method in an automated or semi-automated process.
- the “self-diagnose” procedure can be run every time the system is started or a new optical joint is included or changed at any part of the system.
- FIG. 1 D is a block diagram of the calibration mirror 193 of FIG. 1 C , according to some examples.
- the calibration mirror 193 can include an optical connector 205 C, connecting the calibration mirror 193 to the switch 192 .
- the calibration mirror 193 can be fusion spliced to connect to the switch 192 .
- the calibration mirror 193 can include an attenuator 210 C.
- the attenuator 210 C can have a predetermined attenuation, for example attenuating the reflected signal so the magnitude of the reflection is similar to a reflection from the sample 140 .
- the calibration mirror 193 can include a flat surface 215 C for providing a single point reflection.
- the length of the optical fiber can have the same optical path length as the sample 140 so the light reflected from 215 C will interfere with the reference arm.
- the single-point reflection may be referred to as the Point Spread Function (PSF) and may be processed by the DSP 160 or other component of the OCT imaging engine for obtaining information quantifying the OCT imaging engine.
- PSF Point Spread Function
- the OCT imaging engine receives mirror measurements using the reference mirror and the calibration mirror.
- a mirror measurement can include a time-varying amplitude of an interferogram.
- the system can use the received measurements to retrieve the phase of the optical signal as a function of the sampling index.
- FIG. 2 illustrates an example computing system 200 .
- Computing system 200 can include hardware, software, and other modules as further described herein.
- the following description is intended to provide an overview of device hardware and other operating components suitable for performing the methods of the disclosure described herein which can be part of computing system 200 . This description is not intended to limit the applicable environments or the scope of the disclosure.
- the hardware and other operating components may be suitable as part of the apparatuses described above.
- the disclosure can be practiced with other system configurations, including personal computers, multiprocessor systems, microprocessor-based or programmable electronic device, network PCs, minicomputers, mainframe computers, and the like.
- the disclosure can also be practiced in distributed computing environments where tasks are performed by remote processing devices that are linked through a communications network such as in different rooms of an OCT laboratory or catheter laboratory.
- the present disclosure also relates to apparatus for performing the operations herein.
- This apparatus may be specially constructed for the required purposes, or it may comprise a general-purpose computer selectively activated or reconfigured by a computer program stored in the computer.
- Example systems of the disclosure may be embodied in many different forms, including, but in no way limited to, computer program logic for use with a processor (e.g., a microprocessor, microcontroller, digital signal processor, or general purpose computer), programmable logic for use with a programmable logic device, (e.g., a Field Programmable Gate Array (FPGA) or other programmable logic device), discrete components, integrated circuitry (e.g., an Application Specific Integrated Circuit (ASIC)), or any other means including any combination thereof.
- a processor e.g., a microprocessor, microcontroller, digital signal processor, or general purpose computer
- programmable logic for use with a programmable logic device, (e.g., a Field Programmable Gate Array (FPGA) or other programmable logic device), discrete components, integrated circuitry (e.g., an Application Specific Integrated Circuit (ASIC)), or any other means including any combination thereof.
- FPGA Field Programmable Gate Array
- ASIC Application Specific
- some or all of the processing of the data collected using an OCT probe and the processor-based system is implemented as a set of computer program instructions that is converted into a computer executable form, stored as such in a computer readable medium, and executed by a microprocessor under the control of an operating system.
- query response and input data are transformed into processor understandable instructions suitable for generating imaging data, detecting lumen borders, detecting stent struts, comparing measured perpendicular distances relative to set thresholds, and otherwise performing image comparison, signal processing, lumen detection, stent detection, and comparison of detected stents, and other features and examples described above.
- Source code may include a series of computer program instructions implemented in any of various programming languages (e.g., an object code, an assembly language, or a high-level language such as Fortran, C, C++, JAVA, or HTML) for use with various operating systems or operating environments.
- the source code may define and use various data structures and communication messages.
- the source code may be in a computer executable form (e.g., via an interpreter), or the source code may be converted (e.g., via a translator, assembler, or compiler) into a computer executable form.
- the computer program may be fixed in any form (e.g., source code form, computer executable form, or an intermediate form) either permanently or transitorily in a tangible storage medium, such as a semiconductor memory device (e.g., a RAM, ROM, PROM, EEPROM, or Flash-Programmable RAM), a magnetic memory device (e.g., a diskette or fixed disk), an optical memory device (e.g., a CD-ROM), a PC card (e.g., PCMCIA card), or other memory device.
- a semiconductor memory device e.g., a RAM, ROM, PROM, EEPROM, or Flash-Programmable RAM
- a magnetic memory device e.g., a diskette or fixed disk
- an optical memory device e.g., a CD-ROM
- PC card e.g., PCMCIA card
- the computer program may be fixed in any form in a signal that is transmittable to a computer using any of various communication technologies, including, but in no way limited to, analog technologies, digital technologies, optical technologies, wireless technologies (e.g., Bluetooth), networking technologies, and internetworking technologies.
- the computer program may be distributed in any form as a removable storage medium with accompanying printed or electronic documentation (e.g., shrink-wrapped software), preloaded with a computer system (e.g., on system ROM or fixed disk), or distributed from a server or electronic bulletin board over the communication system (e.g., the Internet or World Wide Web).
- Hardware logic including programmable logic for use with a programmable logic device
- implementing all or part of the functionality previously described herein may be designed using traditional manual methods, or may be designed, captured, simulated, or documented electronically using various tools, such as Computer Aided Design (CAD), a hardware description language (e.g., VHDL or AHDL), or a PLD programming language (e.g., PALASM, ABEL, or CUPL).
- CAD Computer Aided Design
- a hardware description language e.g., VHDL or AHDL
- PLD programming language e.g., PALASM, ABEL, or CUPL
- Programmable logic may be fixed either permanently or transitorily in a tangible storage medium, such as a semiconductor memory device (e.g., a RAM, ROM, PROM, EEPROM, or Flash-Programmable RAM), a magnetic memory device (e.g., a diskette or fixed disk), an optical memory device (e.g., a CD-ROM), or other memory device.
- a semiconductor memory device e.g., a RAM, ROM, PROM, EEPROM, or Flash-Programmable RAM
- a magnetic memory device e.g., a diskette or fixed disk
- an optical memory device e.g., a CD-ROM
- the programmable logic may be fixed in a signal that is transmittable to a computer using any of various communication technologies, including, but in no way limited to, analog technologies, digital technologies, optical technologies, wireless technologies (e.g., Bluetooth), networking technologies, and internetworking technologies.
- the programmable logic may be distributed as a removable storage medium with accompanying printed or electronic documentation (e.g., shrink-wrapped software), preloaded with a computer system (e.g., on system ROM or fixed disk), or distributed from a server or electronic bulletin board over the communication system (e.g., the Internet or World Wide Web).
- printed or electronic documentation e.g., shrink-wrapped software
- a computer system e.g., on system ROM or fixed disk
- server or electronic bulletin board e.g., the Internet or World Wide Web
- a module refers to software, hardware, or firmware suitable for performing a specific data processing or data transmission task.
- a module refers to a software routine, program, or other memory resident application suitable for receiving, transforming, routing and processing instructions, or various types of data such as OCT scan data and other information of interest.
- Computers and computer systems described herein may include operatively associated computer-readable media such as memory for storing software applications used in obtaining, processing, storing and/or communicating data. It can be appreciated that such memory can be internal, external, remote or local with respect to its operatively associated computer or computer system.
- Memory may also include any means for storing software or other instructions including, for example and without limitation, a hard disk, an optical disk, floppy disk, DVD (digital versatile disc), CD (compact disc), memory stick, flash memory, ROM (read only memory), RAM (random access memory), DRAM (dynamic random access memory), PROM (programmable ROM), EEPROM (extended erasable PROM), and/or other like computer-readable media.
- a hard disk an optical disk, floppy disk, DVD (digital versatile disc), CD (compact disc), memory stick, flash memory, ROM (read only memory), RAM (random access memory), DRAM (dynamic random access memory), PROM (programmable ROM), EEPROM (extended erasable PROM), and/or other like computer-readable media.
- computer-readable memory media applied in association with examples of the disclosure described herein may include any memory medium capable of storing instructions executed by a programmable apparatus. Where applicable, method steps described herein may be embodied or executed as instructions stored on a computer-readable memory medium or memory media. These instructions may be software embodied in various programming languages such as C++, C, Java, and/or a variety of other kinds of software programming languages that may be applied to create instructions in accordance with examples of the disclosure.
- a storage medium may be non-transitory or include a non-transitory device. Accordingly, a non-transitory storage medium or non-transitory device may include a device that is tangible, meaning that the device has a concrete physical form, although the device may change its physical state. Thus, for example, non-transitory refers to a device remaining tangible despite this change in state.
- FIG. 3 illustrates method 300 for obtaining one or more calibration spectra.
- the calibration spectra can be used for calibration of OCT signals derived from a sample, such as sample 140 , to improve resolution, signal to noise ratio and suppress image sidelobe artifacts.
- a mirror measurement is a signal which is generated from OCT system 100 when a mirror is placed at the sample 140 .
- the resulting measurement is a time varying amplitude from the interferogram acquired by the A/D card.
- OCT signals which can include raw fringe data, can be obtained from a mirror or reference reflector in the sample arm of the OCT system from both a negative imaging plane and a positive imaging plane separately.
- the background spectrum can also be obtained by removing the sample.
- the raw fringes on either side of the mirror arm can be obtained at a pixel depth of 250-300 pixels, equivalent to 25%-30% of Nyquist depth in a 1024 pixel system. In other examples, any two arbitrary positions can be chosen for the pixel depths.
- measurements can be taken as positions P1 to P3 as illustrated in FIG. 1 B .
- the information derived from these measurements can be used to retrieve the phase as the function of the sampling index n, ⁇ P1 (n) and ⁇ ⁇ P1 (n), accordingly, and used to calculate the spectra KL, and dispersion spectra.
- the fringe taken at P1 is used to estimate the spectral flattening spectra.
- measurements taken at P1 to P3 are used to optimize the k-spectrum based on the best polynomial fitting order detected from the algorithm.
- the location of P1, P2, and P3 can be chosen based on the desired or estimated depth of a sample to optimize the polynomial fit over the depth range.
- a complex signal and phase of that signal can be calculated by a Hilbert transform from the acquired measurements at positions P1 to P3.
- a k-linear phase can also be calculated by averaging the fringe to obtain the clean optical phase ⁇ P1 (n) and ⁇ ⁇ P1 (n) from the P1 and P2 positions.
- Interferograms of P1 to P3 are used to perform to optimize the interpolation performance of KL spectrum and reduce or avoid noise effects from deeper depths of the OCT signal.
- the background can be removed from the signals obtained at block 305 .
- ⁇ KL (n) 0.5* ⁇ P1 (n)+ ⁇ ⁇ P1 (n) ⁇ .
- FIG. 4 B ( 1 ) where the solid line represents the dispersion-free k-spectrum and the dash line shows the ideal linearized k-spectrum.
- the difference between the curves represents the nonlinearity of the k-clocks that needs to be corrected in the next section. Both curves are used to interpolate the raw fringe on the wavenumber phase domain directly to obtain KL corrected fringe s 0 (n).
- FIG. 4 B shows effective calibration that corrects the nonlinear k-spectrum to a linearized k-spectrum after KL process.
- the calibrated results are accordingly shown in FIG. 12 .
- aspects of this method can be selected to run k-spectrum interpolation directly in the wavenumber domain.
- any or all of the following steps can be used as part of the polynomial optimization process to find the best polynomial order for the KL spectrum:
- the dispersion spectrum can be calculated.
- the raw fringe is interpolated using the k-spectrum from block 310 .
- the term X d is used to compensate the phase difference of the calibration mirrors due to their unequal positions relative to the zero-delay line.
- the noise ⁇ disp (n) can be removed by fitting a polynomial function or simply filtered by a low pass filter, as illustrated in FIG. 4 D .
- the ⁇ disp (k) function obtained can be saved for use as a counter-dispersive phase to subtract with the analytical form of the KL corrected fringe s 0 (n). Example results of the fringe data and the OCT intensity shape after applying the dispersion correction is referenced to FIG. 6 B .
- SF(n) can be calculated by the envelope value of the KLDC corrected fringe, s 1 (n).
- spectral flattening can further increase the performance of the axial resolution by increasing the available bandwidth as shown in FIG. 6 C .
- a SF window can be calculated as a calibration step and applied to future data using a window function (i.e. Kaiser-Bessel window) to form a demodulation window, e.g.
- the envelope used can be derived from the signal obtained from the any of reference mirror positions from block 305 .
- the first step of the spectral flattening process is to calculate the envelope of the fringe by taking the absolute value of the KLDC-corrected fringe after a Hilbert transform has been applied to it. This step can occur when a mirror is placed in the sample arm.
- the spectral envelope can be fit by a polynomial function, see FIG. 4 E for an example.
- the various spectra calculated in steps 310 - 325 can be saved.
- the various spectra can be stored or moved to various parts of computing device 200 .
- FIG. 4 A illustrates various aspects of an obtained input signal.
- Graph 410 illustrates an input signal obtained from a positive imaging plane.
- Graph 420 illustrates an input signal obtained from a negative imaging plane.
- Graph 410 and graph 420 can also be described as an example of a k-clock sampled interferogram (raw fringe) from an OCT system.
- graph 410 and graph 420 represent empirically obtained data, the intensity of the fringe signal in the graphs can be described by the wavenumber ‘k’ and dispersion with the following relationship: I P1 (n) ⁇ cos ⁇ k(n)z P1 + ⁇ disp (n) ⁇ and I ⁇ P1 (n) ⁇ cos ⁇ k(n)z ⁇ P1 ⁇ disp (n) ⁇ .
- Dispersion can be measured in radians or any other angular measure and represents an optical phase that determines the amplitude modulation of the sinusoidal signal.
- FIG. 4 B graphs 430 ( FIG. 4 B ( 1 )) and graph 440 ( FIG. 4 B ( 2 )) are illustrated.
- FIG. 4 B ( 1 ) illustrates, graph 430 , the dispersion free k-spectrum compared to an ideal linearized k-spectrum.
- FIG. 4 B ( 2 ) illustrates graph 440 shows effective correction on uncalibrated k-spectrum after KL process.
- a dashed line can be the optical phase calculated after k-linearization process.
- FIG. 4 C illustrates graphs 450 and 460 .
- Graph 450 illustrates intensity without k-spectrum optimization.
- Graph 455 highlights one peak showing the uneven sidelobes.
- Graph 460 illustrates the same signal with k-spectrum optimization.
- Graph 465 highlights the same peak as 455 showing the sidelobes are suppressed and the graph is symmetrical after k-spectrum optimization.
- FIG. 4 D illustrates graph 470 , illustrating a graph of raw dispersion data with a polynomial fit ⁇ disp (n) saved therein.
- FIG. 4 E illustrates graph 480 .
- Graph 480 illustrates example data of KLDC corrected fringe and its calculated envelope with polynomial fit. The calculated envelope can be saved for later use.
- FIG. 5 illustrates a method 500 for performing real-time OCT imaging performed by graphic processing unit (GPU) or a field programmable gate array (FPGA) according to aspects of this disclosure.
- Method 500 can also be performed in part or entirely by other computing devices, such as for example, device 200 .
- Method 500 can be performed in real-time during the operation of an OCT system using the data obtained in earlier parts.
- one or more spectrum can be loaded or obtained.
- one or more of the spectra calculated with reference to method 300 can be loaded from memory, such as a k-spectrum, a dispersion spectrum, and a spectral flattening spectrum.
- background data of each fringe need to be removed either by a high-pass filter or taken the data by blocking the sample arm.
- a k-linearization (KL) correction can be performed on collected raw fringe data.
- the fringe data can be interpolated by the saved k-spectrum with the optimized polynomial fitting order.
- block 510 can use the k-spectrum data, such as that saved with reference to method 300 and illustrated with reference to FIG. 4 B .
- the loaded k-spectrum can be used to correct the raw fringe data obtained by performing a cubic spline interpolation in wavenumber space (k-space) on the collected raw fringe data. Performing a cubic spline interpolation in the wavenumber space allows for scaling the raw fringe from a nonlinear into a linear wavenumber domain prior to performing a FFT process.
- Spline interpolation is a form of piecewise polynomial interpolation to avoid overfitting problem causing spike errors.
- FPGAs or GPU can be used to efficiently perform the cubic spline interpolation in the wavenumber domain, allowing the KL correction to be performed in real-time, such as during the operation of an OCT system.
- the raw fringe data and the KLDC corrected fringe data are illustrated with respect to FIG. 6 B .
- the spectra can be also loaded into nonuniform FFT without involving numerical interpolation process.
- dispersion correction can be performed on the KL corrected fringe data produced at block 510 through the use of the ⁇ disp (n) function calculated with reference to method 300 , and more specifically, with reference to block 320 .
- dispersion compensation is performed to cancel out the dispersion phase, and thus correct the OCT signal being obtained.
- the polynomial fitted function or low pass filter is being used, a more robust correction can be performed as compared to the raw dispersion data.
- the fringe data can be Hilbert transformed to be an analytical form, and the dispersion phase can be compensated using an exponential function of ⁇ j ⁇ disp (n), where j is an imaginary unit.
- the real function referred to above takes the “real” portion of the fringe which has been k-linearized and transformed to the complex-valued analytical form.
- spectral flattening can be performed on the results obtained at block 515 .
- the spectral envelope can be removed.
- the ramping envelope of the fringe shown in FIG. 4 E
- the real-valued envelope calculated at block 320 can be used.
- the spectral envelope from the calibration is incorporated with a window function (e.g. Kaiser window) and is used as a demodulation window to flatten the KLDC corrected fringe.
- s 2 ⁇ ( n ) s 1 ⁇ ( n ) ⁇ kaiser ⁇ ⁇ window ( n ) SF ⁇ ( n )
- the spectral envelope SF(n) above is defined as the envelope of s 1 (n).
- FIG. 4 B illustrates graph 430 , which show a generated k-spectrum and an ideal k-spectrum.
- Graph 620 is an enlarged portion of the original fringe versus KL corrected fringe according to aspects of method 300 .
- the fitted spectrum can be saved and used for real-time imaging as discussed in method 500 .
- Graph 620 illustrates the original data and the corrected data after the step of k-linearization correction is performed.
- FIG. 6 A illustrates graph 620 , an interferogram as a function of the sampling index. Illustrated on graph 620 is the original fringe signal and the KL corrected fringe signal.
- FIG. 6 B illustrates graph 630 with the difference of the KL corrected fringe signal before and after applying the dispersion correction.
- the simplified form to accelerate real-time imaging process can be written as:
- the absolute function, abs, referred to above takes the “magnitude or modulus” portion of the fringe which has been k-linearized multiplied with dispersion phase.
- the graph 640 shows narrower PSF after KLDC processing versus the k-clock linearization.
- FIG. 6 C illustrates an example of the difference in bandwidth before and after application of spectral flattening within graph 650 . Note the bottom plot has wider FWHM bandwidth and more symmetric structure after spectral flattening.
- FIG. 6 D illustrates an example graph 660 illustrating FWHM at different imaging depths using different methods.
- the data was acquired from an OPTIS OCT system without an k-delay that has not been optimized and strong system dispersion.
- Graph 660 illustrates that the improvement in the FWHM across all imaging depths between (i) a signal only using k-clock data, (ii) using only KL techniques, (iii) using KL and DC techniques, and (iv) using KL, DC, and SF techniques.
- the smaller FWHM indicates an improvement in the axial resolution in an OCT image.
- FIG. 7 illustrates method 700 to generate OCT real-time imaging incorporating aspects of KLDC according to aspects of this disclosure.
- fringe data can be obtained from a sensor of the OCT system.
- the system described with reference to FIG. 1 can be used.
- an OPTIS system by Abbott can be used.
- KL, DC, and spectral flattening can be performed.
- steps with reference to method 500 can be performed.
- zero padding and windowing can occur.
- Windowing is keeping a part of the signal within a chosen interval.
- windowing is equivalent to applying a window function with a value of zero outside of a chosen interval.
- Zero padding is a process in which zeros can be added to the end of a signal to extend the length of the signal. This process can also allow the signal obtained to be more efficiently processed by a Fast Fourier Transform. Zero padding can increase the sample points allowing the reconstructed signal to approach the theoretical limit of the optical resolution.
- FFTs Fast Fourier Transforms
- FFT can be an algorithm which calculates a discrete Fourier transform or its inverse.
- the data is converted to a logarithmic (log) scale.
- the FFT data can be normalized prior to conversion to the log scale.
- an intensity image can be produced.
- the produced intensity image can be displayed on a monitor.
- Image data can be based on the log scale values obtained in block 725 .
- FIG. 8 represents an example OPTIS system with k-delay adjustment set by the standard manufacturing procedure.
- the plots show the KLDCsf (KLDC and spectral flattening) process corrects imaging sidelobes and improves system resolution in a commercial system that meets specification.
- FIG. 9 illustrates the KLDCsf performance on an OPTIS system with k-delay adjustment within specification.
- the PSF profiles shows sharper beam waist and the system FWHM shows superior system resolution across the imaging depth.
- FIG. 9 illustrates intensity plots 910 , 920 , and 930 , at various imaging depths, and the intensity of a signal obtained using KLDCsf techniques and the intensity of the same signal without the use of KLDCsf techniques.
- FIG. 9 also illustrates plot 940 .
- Plot 940 illustrates an imaging depth on the x-axis and the FWMH in micrometers on the y-axis. As illustrated in plot 940 , the FWMH is consistently narrower across the imaging depth when using the KLDCsf techniques as compared to a system using a k-clock.
- FIG. 10 illustrates plots 1010 and 1020 related to the performance of KLDCsf on an OPTIS system without k-delay adjustment and strong dispersion (not within specification). Plots 1010 and 1020 also demonstrate the best resolution and SNR by running KLDCsf with optimized k-spectrum. Plot 1010 illustrates an imaging depth on the x-axis and the FWHM in micrometers on the y-axis. Plot 1010 illustrates a smaller FWHM with KLDCsf process and a minor FWHM improvement when the KLDCsf process is applied to data that has been resampled using a k-clock.
- Plot 1020 illustrates a signal to noise ratio (SNR) on the y-axis and imaging depth on the x-axis showing a higher signal to noise ratio with KLDCsf techniques as compared to a signal obtained from using a k-clock.
- SNR signal to noise ratio
- FIG. 11 illustrates graph 1110 of a single line scan (A-line) imaged from a Kapton tape roll by an OPTIS system operating within specification.
- the KLDCsf was applied on raw data and data that has been linearized in k-space using a k-clock.
- Graph 1110 illustrates pixel depth on the x-axis and intensity in decibels on the y-axis.
- the intensity peaks obtained using KLDCsf with an optimized k-spectrum are higher than the intensity peaks by only using KLDCsf at greater depths ( ⁇ 80% of Nyquist imaging depth) resulting in better SNR and system resolution at depth. There was no obvious difference before 80% of Nyquist depth.
- FIG. 12 illustrates the performance of KLDCsf applied on the mirror signal of OPTIS system without using k-clocks.
- KLDCsf processing of a signal leads to sharper and symmetric peaks at sample depths while the mirror signal cannot be reconstructed with the data that has not been linearized in k-space.
- FIG. 13 illustrates plot 1310 showing the resolution of a standard OPTIS system using its internal k-clock and the same system without connecting k-clocks where the KLDCsf process is used. As can be seen from 1310 , KLDCsf without using the k-clock improves the resolution of the original k-clock configuration.
- compositions are described as having, including, or comprising specific components, or where processes are described as having, including or comprising specific process steps, it is contemplated that compositions of the present teachings also consist essentially of, or consist of, the recited components, and that the processes of the present teachings also consist essentially of, or consist of, the recited process steps.
- each value and the end points of a given range and the values there between may be increased or decreased by 20%, while still staying within the teachings of the disclosure, unless some different range is specifically mentioned.
- each intervening value between the upper and lower limits of that range or list of values is individually contemplated and is encompassed within the disclosure as if each value were specifically enumerated herein.
- smaller ranges between and including the upper and lower limits of a given range are contemplated and encompassed within the disclosure.
- the listing of exemplary values or ranges is not a disclaimer of other values or ranges between and including the upper and lower limits of a given range.
- a single component may be replaced by multiple components, and multiple components may be replaced by a single component, to provide an element or structure or to perform a given function or functions. Except where such substitution would not be operative to practice certain embodiments of the disclosure, such substitution is considered within the scope of the disclosure.
- a method of processing an optical signal to improve resolution of an optically acquired image comprises: calibrating an optical system, the calibration comprising: acquiring, by one or more processors, at least a first mirror measurement and a second mirror measurement, the first and second mirror measurement being collected from either side of a zero-delay line, each mirror measurement being an interferogram or a signal or a system impulse response; obtaining, by the one or more processors, an amplitude and phase for the first mirror measurement and the second mirror measurement; resampling, at least one of the first mirror measurement and the second mirror measurement to be at least one of: (i) in linear wavenumber (k) space or (ii) linear wavelength or (iii) linear time, to generate a resampled mirror measurement; and calculating, using a function, an optimized fit for the resampled mirror measurement.
- Any number of mirror measurements can be used for the calibration. For example, several, tens, hundreds, or more mirror measurements may be obtained and used for calibration.
- the function used to fit may be one of a polynomial function, cubic spline fitting function, radial basis function, or a piece-wise function.
- the method may further comprise performing k-linearization on the raw interferogram of mirror measurements, the mirror measurements obtained with or without use of a k-clock, and generating a resampled interferogram, wherein the resampled mirror measurement is in k-space.
- the k-linearization may be performed using an interpolation function, the interpolation function being one of cubic spline interpolation, cubic interpolation or linear interpolation in k-space.
- the method may further comprise performing spectral flattening on at least one mirror measurement by using an envelope calculated from a specific mirror measurement.
- Each mirror measurement may be a system impulse response.
- the method may further comprise calculating a dispersion compensation for at least two mirror measurements and optionally compensating for the dispersion. It may further comprise saving a spectral envelope calculated during spectral flattening.
- an optimized polynomial is determined based on at least two mirror measurements. In some examples more than two mirror measurements may be used. Optimization of the optimized polynomial may be based on a polynomial fitting order 1 to n, where n is a fixed integer. The method may further comprise finding the polynomial fitting order minimizing: (i) the area of the point-spread function, (ii) full-width half max (FWHM) resolution, or a combination of (i) and (ii) for each of the mirror measurements.
- the method may further comprise saving calibration criteria related to (i) k-linearization (KL), (ii) dispersion correction (DC), and (iii) spectral flattening (SF).
- KL k-linearization
- DC dispersion correction
- SF spectral flattening
- the method may further comprise receiving an OCT signal or interference signal from a specimen.
- the method may further comprise generating a new fringe or resampling an interferogram after linear k-interpolation to k-linearize the received OCT signal or interference signal by using the KL calibration criteria.
- the method may further comprise performing dispersion correction on the k-linearized OCT signal or interference signal using the DC calibration criteria.
- the method may further comprise removing the envelope of the k-linearized and dispersion corrected OCT signal or interference signal.
- the method may further comprise converting the OCT signal or interference signal to an OCT image for display on a display.
- a method of generating an OCT image from an OCT signal may comprise: obtaining an OCT signal corresponding to a specimen and loading the calibration spectra; wavenumber linearizing (KL) the OCT signal to generate a KL OCT signal; dispersion correcting (DC) the KL OCT signal to generate an KL DC OCT signal; spectral flattening (sf) the KLDC OCT signal to generate a final KLDCsf OCT signal; and performing post-processing on the final OCT signal to generate an OCT image; wherein the calibration spectra used to generate KL OCT signal, KL DC OCT signal, and final KLDCsf OCT signal are based on calibration criteria generated at a calibration stage.
- the OCT signal may be, for example, an interferogram.
- the calibration criteria may be generated at the calibration stage using at least a first mirror measurement and a second mirror measurement, the first and second mirror measurement being collected from either side of a zero-delay line, each mirror measurement being an interferogram or a signal or a system impulse response. According to some examples, additional mirror measurements may be used.
- a system for displaying sets of images of a subject comprises: a memory for storing image data and time-varying data that corresponds to a subject; and one or more processors in communication with the memory, the one or more processors being operable to: acquire, by one or more processors, at least a first mirror measurement and a second mirror measurement, the first and second mirror measurement being collected from either side of a zero-delay line, each mirror measurement being an interferogram or a signal or a system impulse response; compute, by the one or more processors, an amplitude and phase for the first mirror measurement and the second mirror measurement; resample, at least one of the first mirror measurement and the second mirror measurement to be at least one of: (i) in linear wavenumber(k) space, (ii) linear wavelength, and (iii) linear time to generate a resampled mirror measurement; and calculate, using a function, an optimized fit for the resampled mirror measurement.
- a system or computer readable medium may be configured to perform any combination of the above features.
- a system for performing optical coherence tomography on a sample may comprise: a light source; a reference mirror with variable position; a display; a memory for storing image data that corresponds to a sample; one or more processors in communication with the memory, the one or more processors being operable to: obtain at least one calibration parameter from mirror measurements each time the system is initiated; obtain a signal from the sample; apply the at least one calibration parameter to the obtained signal, the calibration parameter being at least one of a wavenumber linearization, a dispersion correction, or a spectral flattening parameter; and generate an image from the corrected obtained signal.
- the system may further comprise an optical switch and a calibration mirror configured to cause a calibration signal to be generated.
- a computer readable medium may contain instructions executable by one or more processors to perform a method comprising: acquiring a first mirror measurement and a second mirror measurement, the first and second mirror measurement being collected from either side of a zero-delay line, each mirror measurement being an interferogram or a signal or a system impulse response; computing an amplitude and phase for the first mirror measurement and the second mirror measurement; resampling at least one of the first mirror measurement and the second mirror measurement to be at least one of: (i) in linear wavenumber(k) space, (ii) linear wavelength, or (iii) linear time to generate a resampled mirror measurement; and calculating, using a function, an optimized fit for the resampled mirror measurement.
- a computer readable medium may store instructions executable by one or more processors to perform a method comprising: obtaining at least one calibration parameter each time the system is initiated; obtaining a signal from the sample; applying the at least one calibration parameter to the obtained signal, the calibration parameter being at least one of a wavenumber linearization, a dispersion correction, or a spectral flattening parameter; and generating an image from the corrected obtained signal.
- a method of processing an optical signal to improve resolution of an optically acquired image may comprise: calibrating an optical system, the calibration comprising: acquiring, by one or more processors, a first mirror measurement and a second mirror measurement, the first and second mirror measurement being collected from either side of a zero-delay line, each mirror measurement being an interferogram or a signal or a system impulse response; obtaining, by the one or more processors, an amplitude and phase for the first mirror measurement and the second mirror measurement; calculating a dispersion compensation for at least one mirror measurement and optionally compensating for the dispersion; and calculating, using a function, an optimized fit for the mirror measurement.
Landscapes
- Physics & Mathematics (AREA)
- General Physics & Mathematics (AREA)
- Engineering & Computer Science (AREA)
- Signal Processing (AREA)
- Health & Medical Sciences (AREA)
- General Health & Medical Sciences (AREA)
- Nuclear Medicine, Radiotherapy & Molecular Imaging (AREA)
- Radiology & Medical Imaging (AREA)
- Mathematical Physics (AREA)
- Investigating Or Analysing Materials By Optical Means (AREA)
- Endoscopes (AREA)
Abstract
Description
-
- k: wavenumber.
- j: imaginary unit in complex domain.
- KL: k-linearization.
- DC: dispersion correction.
- SF: spectral flattening.
- n: sampling index by the used A/D card.
- I: intensity
- IP1(n): Intensity at position P1 with n being a variable of sampling index by A/D card.
- zx: depth position x with respect to the zero delay plane.
- Px: The imaged position x on the positive plane, where x=1, 2, 3 . . . etc.
- −Px: The imaged position x on the negative plane.
- Φx(n): optical phase acquired at x position on the positive plane.
- Φ−x(n): optical phase acquired at x position on the negative plane.
- Φdisp: optical dispersion phase.
- ΦKL(n): dispersion-free k spectrum after k-linearization process.
- Xd (n): phase compensation term used to compensate for asymmetry about the zero delay line. e.
- zd: PSF peak position alter FFT, where d is Px and −Px.
- s0: corrected fringe after k-linearization.
- s1: corrected fringe after KL and DC processes.
- s2: corrected fringe after KL, DC and spectral flattening process.
- s3: corrected fringe after KL, DC and spectral flattening process without using analytical form to reduce computational cost.
-
- The KL spectrum, ΦKL(n), can be acquired with polynomial fitting at P1 or any of the other mirror(P2, P3, etc.) positions,
- A KL resampling with varying polynomial fitting orders can be applied for the signal acquired at other positions such as P2, and P3. In some examples, a polynomial from an order of 0 to 50 can be used, where 0 represent the raw k-spectrum without applying fitting.
- The full width at half maximum (FWHM) (referred to as a1 in this block) and the point spread function (PSF) area total (referred to as a2 in this block) are calculated based on the PSF profiles after the k-spectrum interpolation by each fitting order.
- The a1 and a2 parameters can be calculated for each depth position P1, P2, and P3 in every polynomial order. Afterward, the parameter a1 and a2 are averaged along depths and then normalized to 0-1 separately.
- The polynomial order with a minimum (a1+a2) can be found.
- The polynomial order causing the sharpest intensity peak in the preceding step can be saved as the optimized fitting order for the saved k-spectrum and used across the entire KL process at all other depths and for all other OCT signals in real-time imaging stage. Exemplary improvement of imaging artifacts is referenced to the bottom row in
FIG. 4C andFIG. 11 .
Φdisp(n)=0.5*{(ΦP1(n)+n*X p1)−(Φ−P1(n)+n*X (−P1)}, and X d =z d+0.5*{z (P1) +z (−P1)}.
In one example, the envelope used can be derived from the signal obtained from the any of reference mirror positions from
s 1(n)=Real{analytical form of s 0(n)×exp[−jΦ disp(n)]}
Claims (18)
Priority Applications (1)
| Application Number | Priority Date | Filing Date | Title |
|---|---|---|---|
| US17/666,726 US11892291B2 (en) | 2021-02-08 | 2022-02-08 | Systems and methods improving optical coherence tomography (OCT) image resolution using k-linearization (KL) and dispersion correction (DC) |
Applications Claiming Priority (2)
| Application Number | Priority Date | Filing Date | Title |
|---|---|---|---|
| US202163146904P | 2021-02-08 | 2021-02-08 | |
| US17/666,726 US11892291B2 (en) | 2021-02-08 | 2022-02-08 | Systems and methods improving optical coherence tomography (OCT) image resolution using k-linearization (KL) and dispersion correction (DC) |
Publications (2)
| Publication Number | Publication Date |
|---|---|
| US20220260360A1 US20220260360A1 (en) | 2022-08-18 |
| US11892291B2 true US11892291B2 (en) | 2024-02-06 |
Family
ID=80447756
Family Applications (1)
| Application Number | Title | Priority Date | Filing Date |
|---|---|---|---|
| US17/666,726 Active 2042-03-05 US11892291B2 (en) | 2021-02-08 | 2022-02-08 | Systems and methods improving optical coherence tomography (OCT) image resolution using k-linearization (KL) and dispersion correction (DC) |
Country Status (5)
| Country | Link |
|---|---|
| US (1) | US11892291B2 (en) |
| EP (1) | EP4288746A1 (en) |
| JP (1) | JP2024508681A (en) |
| CN (1) | CN116802456A (en) |
| WO (1) | WO2022170256A1 (en) |
Families Citing this family (5)
| Publication number | Priority date | Publication date | Assignee | Title |
|---|---|---|---|---|
| CN116091368B (en) * | 2023-04-10 | 2023-08-22 | 佛山光微科技有限公司 | Dispersion compensation method, device, electronic equipment and storage medium |
| CN116818717B (en) * | 2023-08-28 | 2023-11-07 | 泉州装备制造研究所 | Compensation method and system for wavelength calibration error in spectral domain optical coherence tomography |
| CN117492208B (en) * | 2023-12-29 | 2024-03-08 | 山东大学 | A design method for K-domain spectrometer prism |
| CN118975781B (en) * | 2024-08-12 | 2025-10-17 | 东莞市迪凯医疗科技有限公司 | Multi-mode imaging system and coronary angiography catheter |
| CN119879720B (en) * | 2025-03-28 | 2025-07-04 | 吉林大学 | K domain homogenizing and dispersion compensating method based on SD-OCT technology |
Citations (5)
| Publication number | Priority date | Publication date | Assignee | Title |
|---|---|---|---|---|
| US20120188555A1 (en) * | 2011-01-21 | 2012-07-26 | Duke University | Systems and methods for complex conjugate artifact resolved optical coherence tomography |
| US20140268038A1 (en) * | 2013-03-12 | 2014-09-18 | Carl Zeiss Meditec, Inc. | Systems and methods for variable depth optical coherence tomography imaging |
| US20160025478A1 (en) * | 2014-07-25 | 2016-01-28 | Axsun Technologies Llc | Real Time FPGA Resampling for Swept Source Optical Coherence Tomography |
| US20170307353A1 (en) * | 2016-04-25 | 2017-10-26 | Kabushiki Kaisha Topcon | Swept-source optical coherence tomography (ss-oct) phase stabilization with reference signal calibration |
| US20200096311A1 (en) | 2018-09-24 | 2020-03-26 | Axsun Technologies, Inc. | OCT system calibration method for improved image resolution and reduced image artifacts |
Family Cites Families (5)
| Publication number | Priority date | Publication date | Assignee | Title |
|---|---|---|---|---|
| CA2390072C (en) * | 2002-06-28 | 2018-02-27 | Adrian Gh Podoleanu | Optical mapping apparatus with adjustable depth resolution and multiple functionality |
| WO2007127395A2 (en) * | 2006-04-28 | 2007-11-08 | Bioptigen, Inc. | Methods, systems and computer program products for optical coherence tomography (oct) using automatic dispersion compensation |
| WO2011068862A2 (en) * | 2009-12-01 | 2011-06-09 | Brigham And Women's Hospital, Inc. | System and method for calibrated spectral domain optical coherence tomography and low coherence interferometry |
| CN102645172B (en) * | 2012-05-07 | 2014-06-04 | 浙江大学 | Common-channel OCT (optical coherence tomography) ultra-large range space measurement system and method |
| CN110196021A (en) * | 2019-01-16 | 2019-09-03 | 苏州大学 | Coating layer thickness and its application are measured based on Optical coherence tomography technology |
-
2022
- 2022-02-08 WO PCT/US2022/015644 patent/WO2022170256A1/en not_active Ceased
- 2022-02-08 US US17/666,726 patent/US11892291B2/en active Active
- 2022-02-08 CN CN202280013822.6A patent/CN116802456A/en active Pending
- 2022-02-08 JP JP2023547696A patent/JP2024508681A/en active Pending
- 2022-02-08 EP EP22705975.5A patent/EP4288746A1/en not_active Withdrawn
Patent Citations (5)
| Publication number | Priority date | Publication date | Assignee | Title |
|---|---|---|---|---|
| US20120188555A1 (en) * | 2011-01-21 | 2012-07-26 | Duke University | Systems and methods for complex conjugate artifact resolved optical coherence tomography |
| US20140268038A1 (en) * | 2013-03-12 | 2014-09-18 | Carl Zeiss Meditec, Inc. | Systems and methods for variable depth optical coherence tomography imaging |
| US20160025478A1 (en) * | 2014-07-25 | 2016-01-28 | Axsun Technologies Llc | Real Time FPGA Resampling for Swept Source Optical Coherence Tomography |
| US20170307353A1 (en) * | 2016-04-25 | 2017-10-26 | Kabushiki Kaisha Topcon | Swept-source optical coherence tomography (ss-oct) phase stabilization with reference signal calibration |
| US20200096311A1 (en) | 2018-09-24 | 2020-03-26 | Axsun Technologies, Inc. | OCT system calibration method for improved image resolution and reduced image artifacts |
Non-Patent Citations (3)
| Title |
|---|
| Attendu Xavier et al.: "Simple and robust calibration procedure for k-linearization and dispersion compensation in optical coherence tomography", Journal of Biomedical Optics, SPIE, 1000 20TH St. Bellingham WA 98225-6705 USA, vol. 24, No. 5, May 1, 2019 (May 1, 2019), p. 56001, XP060138478. 12 pgs. |
| International Search Report including Written Opinion for PCT/US2022/015644 dated May 19, 2022. 16 pgs. |
| Maciej Szkulmowski et al.: "Flow velocity estimation by complex ambiguity free joint Spectral and Time domain Optical Coherence Tomography", Science Opt. Commun. J. Biomed. Opt. Opt. Express Opt. Express Opt. Express Opt. Lett. Opt. Lett. Opt. Express Opt. Express Optics Express, Aug. 3, 2009 (Aug. 3, 2009), pp. 1178-1181, XP055682082.17 pgs. |
Also Published As
| Publication number | Publication date |
|---|---|
| WO2022170256A1 (en) | 2022-08-11 |
| EP4288746A1 (en) | 2023-12-13 |
| CN116802456A (en) | 2023-09-22 |
| JP2024508681A (en) | 2024-02-28 |
| US20220260360A1 (en) | 2022-08-18 |
Similar Documents
| Publication | Publication Date | Title |
|---|---|---|
| US11892291B2 (en) | Systems and methods improving optical coherence tomography (OCT) image resolution using k-linearization (KL) and dispersion correction (DC) | |
| US7835010B2 (en) | Optical coherence tomography system and optical coherence tomography method | |
| US8457440B1 (en) | Method and system for background subtraction in medical optical coherence tomography system | |
| US8049900B2 (en) | Apparatus and methods for uniform frequency sample clocking | |
| US9709379B2 (en) | Optical coherence tomography system that is reconfigurable between different imaging modes | |
| US8139226B2 (en) | Soft clock delay for OCT system and method therefor | |
| US7148970B2 (en) | Systems and methods for imaging a sample | |
| US7602501B2 (en) | Interferometric synthetic aperture microscopy | |
| JP2009530614A (en) | Method, system and computer program product for performing real-time quadrature projection based on Fourier domain optical coherence tomography | |
| CN112839568B (en) | Active quadrature demodulation for subsampling/circular ranging optical coherence tomography imaging | |
| CN109157187A (en) | Increase the method for frequency sweep optical coherence tomography system imaging depth range | |
| US20250283712A1 (en) | Optical Coherence Tomography With Self-Inspecting Imaging Device | |
| Kim et al. | High-speed spectral calibration by complex FIR filter in phase-sensitive optical coherence tomography | |
| JP5054457B2 (en) | Wide dynamic range optical coherence tomography system | |
| Attendu et al. | Calibration procedure for enhanced mirror artifact removal in full-range optical coherence tomography using passive quadrature demultiplexing | |
| Chen et al. | Investigating the impact of different time delays between OCT signal and k-clock signal on the structural and vascular imaging in SS-OCT | |
| Cao et al. | Non-harmonic analysis applied to optical coherence tomography imaging | |
| Fan et al. | Phase and amplitude correction in polygon tunable laser-based optical coherence tomography | |
| US20250031969A1 (en) | Devices, methods, and systems of functional optical coherence tomography | |
| CN119879720B (en) | K domain homogenizing and dispersion compensating method based on SD-OCT technology | |
| Zhao et al. | Spectral calibration for spectral domain optical coherence tomography based on B-scan Doppler shift with tissue images | |
| Lopera | COMPUTATIONAL ABERRATION CORRECTION IN OPTICAL COHERENCE TOMOGRAPHY WITH PHASE-UNSTABLE SYSTEMS |
Legal Events
| Date | Code | Title | Description |
|---|---|---|---|
| FEPP | Fee payment procedure |
Free format text: ENTITY STATUS SET TO UNDISCOUNTED (ORIGINAL EVENT CODE: BIG.); ENTITY STATUS OF PATENT OWNER: LARGE ENTITY |
|
| AS | Assignment |
Owner name: LIGHTLAB IMAGING, INC., MASSACHUSETTS Free format text: ASSIGNMENT OF ASSIGNORS INTEREST;ASSIGNORS:LIU, CHIH-HAO;STROMSKI, STEVEN M.;REEL/FRAME:058939/0908 Effective date: 20210513 |
|
| STPP | Information on status: patent application and granting procedure in general |
Free format text: DOCKETED NEW CASE - READY FOR EXAMINATION |
|
| STPP | Information on status: patent application and granting procedure in general |
Free format text: NON FINAL ACTION MAILED |
|
| STPP | Information on status: patent application and granting procedure in general |
Free format text: RESPONSE TO NON-FINAL OFFICE ACTION ENTERED AND FORWARDED TO EXAMINER |
|
| STPP | Information on status: patent application and granting procedure in general |
Free format text: NOTICE OF ALLOWANCE MAILED -- APPLICATION RECEIVED IN OFFICE OF PUBLICATIONS |
|
| STPP | Information on status: patent application and granting procedure in general |
Free format text: PUBLICATIONS -- ISSUE FEE PAYMENT VERIFIED |
|
| STCF | Information on status: patent grant |
Free format text: PATENTED CASE |