US11806146B2 - Systems and methods for identifying a neurophysiological biotype of depression in the brain of a patient - Google Patents
Systems and methods for identifying a neurophysiological biotype of depression in the brain of a patient Download PDFInfo
- Publication number
- US11806146B2 US11806146B2 US16/464,191 US201716464191A US11806146B2 US 11806146 B2 US11806146 B2 US 11806146B2 US 201716464191 A US201716464191 A US 201716464191A US 11806146 B2 US11806146 B2 US 11806146B2
- Authority
- US
- United States
- Prior art keywords
- cortex
- depression
- biotype
- patient
- functional connectivity
- Prior art date
- Legal status (The legal status is an assumption and is not a legal conclusion. Google has not performed a legal analysis and makes no representation as to the accuracy of the status listed.)
- Active, expires
Links
Images


Classifications
-
- A—HUMAN NECESSITIES
- A61—MEDICAL OR VETERINARY SCIENCE; HYGIENE
- A61B—DIAGNOSIS; SURGERY; IDENTIFICATION
- A61B5/00—Measuring for diagnostic purposes; Identification of persons
- A61B5/16—Devices for psychotechnics; Testing reaction times ; Devices for evaluating the psychological state
- A61B5/165—Evaluating the state of mind, e.g. depression, anxiety
-
- A—HUMAN NECESSITIES
- A61—MEDICAL OR VETERINARY SCIENCE; HYGIENE
- A61B—DIAGNOSIS; SURGERY; IDENTIFICATION
- A61B5/00—Measuring for diagnostic purposes; Identification of persons
- A61B5/0033—Features or image-related aspects of imaging apparatus, e.g. for MRI, optical tomography or impedance tomography apparatus; Arrangements of imaging apparatus in a room
- A61B5/004—Features or image-related aspects of imaging apparatus, e.g. for MRI, optical tomography or impedance tomography apparatus; Arrangements of imaging apparatus in a room adapted for image acquisition of a particular organ or body part
- A61B5/0042—Features or image-related aspects of imaging apparatus, e.g. for MRI, optical tomography or impedance tomography apparatus; Arrangements of imaging apparatus in a room adapted for image acquisition of a particular organ or body part for the brain
-
- A—HUMAN NECESSITIES
- A61—MEDICAL OR VETERINARY SCIENCE; HYGIENE
- A61B—DIAGNOSIS; SURGERY; IDENTIFICATION
- A61B5/00—Measuring for diagnostic purposes; Identification of persons
- A61B5/05—Detecting, measuring or recording for diagnosis by means of electric currents or magnetic fields; Measuring using microwaves or radio waves
- A61B5/055—Detecting, measuring or recording for diagnosis by means of electric currents or magnetic fields; Measuring using microwaves or radio waves involving electronic [EMR] or nuclear [NMR] magnetic resonance, e.g. magnetic resonance imaging
-
- A—HUMAN NECESSITIES
- A61—MEDICAL OR VETERINARY SCIENCE; HYGIENE
- A61B—DIAGNOSIS; SURGERY; IDENTIFICATION
- A61B5/00—Measuring for diagnostic purposes; Identification of persons
- A61B5/48—Other medical applications
- A61B5/4848—Monitoring or testing the effects of treatment, e.g. of medication
-
- A—HUMAN NECESSITIES
- A61—MEDICAL OR VETERINARY SCIENCE; HYGIENE
- A61B—DIAGNOSIS; SURGERY; IDENTIFICATION
- A61B5/00—Measuring for diagnostic purposes; Identification of persons
- A61B5/72—Signal processing specially adapted for physiological signals or for diagnostic purposes
- A61B5/7235—Details of waveform analysis
- A61B5/7264—Classification of physiological signals or data, e.g. using neural networks, statistical classifiers, expert systems or fuzzy systems
-
- A—HUMAN NECESSITIES
- A61—MEDICAL OR VETERINARY SCIENCE; HYGIENE
- A61B—DIAGNOSIS; SURGERY; IDENTIFICATION
- A61B5/00—Measuring for diagnostic purposes; Identification of persons
- A61B5/72—Signal processing specially adapted for physiological signals or for diagnostic purposes
- A61B5/7271—Specific aspects of physiological measurement analysis
- A61B5/7275—Determining trends in physiological measurement data; Predicting development of a medical condition based on physiological measurements, e.g. determining a risk factor
-
- G—PHYSICS
- G01—MEASURING; TESTING
- G01R—MEASURING ELECTRIC VARIABLES; MEASURING MAGNETIC VARIABLES
- G01R33/00—Arrangements or instruments for measuring magnetic variables
- G01R33/20—Arrangements or instruments for measuring magnetic variables involving magnetic resonance
- G01R33/44—Arrangements or instruments for measuring magnetic variables involving magnetic resonance using nuclear magnetic resonance [NMR]
- G01R33/48—NMR imaging systems
- G01R33/4806—Functional imaging of brain activation
-
- G—PHYSICS
- G01—MEASURING; TESTING
- G01R—MEASURING ELECTRIC VARIABLES; MEASURING MAGNETIC VARIABLES
- G01R33/00—Arrangements or instruments for measuring magnetic variables
- G01R33/20—Arrangements or instruments for measuring magnetic variables involving magnetic resonance
- G01R33/44—Arrangements or instruments for measuring magnetic variables involving magnetic resonance using nuclear magnetic resonance [NMR]
- G01R33/48—NMR imaging systems
- G01R33/54—Signal processing systems, e.g. using pulse sequences ; Generation or control of pulse sequences; Operator console
- G01R33/56—Image enhancement or correction, e.g. subtraction or averaging techniques, e.g. improvement of signal-to-noise ratio and resolution
- G01R33/5608—Data processing and visualization specially adapted for MR, e.g. for feature analysis and pattern recognition on the basis of measured MR data, segmentation of measured MR data, edge contour detection on the basis of measured MR data, for enhancing measured MR data in terms of signal-to-noise ratio by means of noise filtering or apodization, for enhancing measured MR data in terms of resolution by means for deblurring, windowing, zero filling, or generation of gray-scaled images, colour-coded images or images displaying vectors instead of pixels
-
- G—PHYSICS
- G16—INFORMATION AND COMMUNICATION TECHNOLOGY [ICT] SPECIALLY ADAPTED FOR SPECIFIC APPLICATION FIELDS
- G16H—HEALTHCARE INFORMATICS, i.e. INFORMATION AND COMMUNICATION TECHNOLOGY [ICT] SPECIALLY ADAPTED FOR THE HANDLING OR PROCESSING OF MEDICAL OR HEALTHCARE DATA
- G16H20/00—ICT specially adapted for therapies or health-improving plans, e.g. for handling prescriptions, for steering therapy or for monitoring patient compliance
- G16H20/70—ICT specially adapted for therapies or health-improving plans, e.g. for handling prescriptions, for steering therapy or for monitoring patient compliance relating to mental therapies, e.g. psychological therapy or autogenous training
-
- G—PHYSICS
- G16—INFORMATION AND COMMUNICATION TECHNOLOGY [ICT] SPECIALLY ADAPTED FOR SPECIFIC APPLICATION FIELDS
- G16H—HEALTHCARE INFORMATICS, i.e. INFORMATION AND COMMUNICATION TECHNOLOGY [ICT] SPECIALLY ADAPTED FOR THE HANDLING OR PROCESSING OF MEDICAL OR HEALTHCARE DATA
- G16H50/00—ICT specially adapted for medical diagnosis, medical simulation or medical data mining; ICT specially adapted for detecting, monitoring or modelling epidemics or pandemics
- G16H50/20—ICT specially adapted for medical diagnosis, medical simulation or medical data mining; ICT specially adapted for detecting, monitoring or modelling epidemics or pandemics for computer-aided diagnosis, e.g. based on medical expert systems
-
- G—PHYSICS
- G16—INFORMATION AND COMMUNICATION TECHNOLOGY [ICT] SPECIALLY ADAPTED FOR SPECIFIC APPLICATION FIELDS
- G16H—HEALTHCARE INFORMATICS, i.e. INFORMATION AND COMMUNICATION TECHNOLOGY [ICT] SPECIALLY ADAPTED FOR THE HANDLING OR PROCESSING OF MEDICAL OR HEALTHCARE DATA
- G16H50/00—ICT specially adapted for medical diagnosis, medical simulation or medical data mining; ICT specially adapted for detecting, monitoring or modelling epidemics or pandemics
- G16H50/70—ICT specially adapted for medical diagnosis, medical simulation or medical data mining; ICT specially adapted for detecting, monitoring or modelling epidemics or pandemics for mining of medical data, e.g. analysing previous cases of other patients
-
- A—HUMAN NECESSITIES
- A61—MEDICAL OR VETERINARY SCIENCE; HYGIENE
- A61N—ELECTROTHERAPY; MAGNETOTHERAPY; RADIATION THERAPY; ULTRASOUND THERAPY
- A61N2/00—Magnetotherapy
- A61N2/004—Magnetotherapy specially adapted for a specific therapy
- A61N2/006—Magnetotherapy specially adapted for a specific therapy for magnetic stimulation of nerve tissue
Definitions
- Depression diagnosis continues to be a challenge for physicians and psychiatrists. Experts have concerns over the traditional subjective clinical symptom approach to depression diagnosis, especially for diagnosing depression biotypes. More objective measures are needed to detect a subject's depression and predict their treatment response.
- the disclosure relates to a method for a classifying neurophysiological biotype of depression in the brain of a patient.
- the method includes receiving, by a processor, fMRI data indicative of brain activity of a patient and extracting, by the processor, brain region functional connectivity information from the fMRI signal.
- the method also includes identifying a depression biotype for the patient by applying a biotype classifier executing on the processor to the brain region functional connectivity information extracted from the fMRI signal and outputting, by the processor, the identified depression biotype.
- the biotype classifier may include a plurality of classifiers.
- the plurality of classifiers may include a first set of classifiers, where each classifier is configured to generate a biotype depression likelihood score for a different corresponding depression biotype.
- the depression biotype is identified by selecting the depression biotype associated with the classifier that generates the highest biotype depression likelihood score based on the extracted brain region functional connectivity information.
- the extracted brain region functional connectivity information includes functional connectivity levels between a plurality of the following patient brain regions: the dorsomedial prefrontal cortex, middle temporal gyrus, parahippocampal cortex, dorsolateral prefrontal cortex, anterior prefrontal cortex, posterior parietal cortex, anterior cingulate cortex, insular cortex, ventrolateral prefrontal cortex, precuneus, orbitofrontal cortex, ventral striatum thalamus, raphe nucleus (midbrain), primary cortex, somatosensory cortex, and visual cortex.
- the method may include processing the extracted brain functional connectivity information by an additional classifier included in a second set of classifiers configured for determining if the patient suffers from depression, wherein the additional classifier is associated with the depression biotype identified for the patient.
- determining if the patient suffers from a first biotype of depression or if the patient has no known depression diagnosis includes processing the extracted brain region functional connectivity information between a plurality of the following patient brain regions: the posterior parietal cortex, precuneus, middle temporal gyrus, parahippocampal cortex, dorsolateral prefrontal cortex, ventrolateral prefrontal cortex, insular cortex, temporal pol, superior temporal gyms, ventromedial prefrontal cortex, ventral hippocampus, amygdala, ventral caudate nucleus, ventral striatum, thalamus, primary somatosensory cortex, primary motor cortex, visual cortex.
- determining if the patient suffers from a second biotype or if the patient has no known depression diagnosis includes processing the extracted brain region functional connectivity information between a plurality of the following patient brain regions: the dorsomedial prefrontal cortex, ventromedial prefrontal cortex, orbitofrontal cortex, posterior cingulate cortex, fusiform gyms, middle temporal gyrus, parahippocampal cortex, anterior cingulate cortex, ventrolateral prefrontal cortex, dorsolateral prefrontal cortex, insular cortex, posterior parietal cortex, thalamus, primary somatosensory cortex, primary motor cortex, and visual cortex.
- determining if the patient suffers from a third biotype of depression or if the patient has no known depression diagnosis includes processing the extracted brain region functional connectivity information between a plurality of the following patient brain regions: the ventromedial prefrontal cortex, posterior parietal cortex, middle temporal gyms, parahippocampal cortex, ventrolateral prefrontal cortex, anterior prefrontal cortex, dorsolateral prefrontal cortex, posterior parietal cortex, temporal pole, superior temporal gyrus, orbitofrontal cortex, ventral hippocampus, amygdala, subgenual anterior cingulate cortex, ventral caudate nucleus, ventral striatum, thalamus, premotor cortex, supplementary motor area, insular cortex, anterior cingulate cortex, and fusiform gyrus.
- determining if the patient suffers from a fourth biotype of depression or if the patient has no known depression diagnosis processing the extracted brain region functional connectivity information between a plurality of the following patient brain regions: the fusiform gyrus, parahippocampal cortex, ventrolateral prefrontal cortex, posterior parietal cortex, anterior cingulate cortex, middle cingulate cortex, insular cortex, temporal pole, superior temporal gyms, middle temporal gyrus, orbitofrontal cortex, ventral hippocampus, subgenual anterior cingulate cortex, ventral striatum, thalamus, primary somatosensory cortex, supplementary motor area, insular cortex, postcentral gyms, and lingual gyrus.
- the biotype classifier may include a linear support vector machine classifier configured to output the likelihood of an associated depression biotype.
- the method for identifying the depression biotype may include a principal component analysis of the brain region functional connectivity extracted from the fMRI signal.
- the method may also include classifying a depression treatment prognosis for the patient by applying a prognosis classifier to the extracted brain region functional connectivity information, wherein the prognosis classifier outputs a likelihood of success of an identified depression treatment for the patient.
- likelihood of success of an identified depression treatment for the patient includes processing the extracted brain region functional connectivity information between a plurality of the following patient brain regions: the dorsomedial prefrontal cortex, anterior cingulate cortex, posterior cingulate cortex, ventromedial prefrontal cortex, ventrolateral prefrontal cortex, dorsolateral prefrontal cortex, posterior parietal cortex, orbitofrontal cortex, amygdala, ventral striatum, nucleus accumbens, globus pallidus, thalamus, primary motor cortex, primary somatosensory cortex, and visual cortex.
- the identified depression biotype comprises a principal component analysis of the brain region functional connectivity extracted from the fMRI signal.
- the depression treatment is a repetitive transcranial magnetic stimulation.
- the method may also predict a depression severity of the patient by processing the extracted brain region functional connectivity information with a multiple linear regression model.
- predicting the depression severity for a patient comprises processing the extracted brain region functional connectivity information between a plurality of the following patient brain regions: the dorsomedial prefrontal cortex, posterior cingulate cortex, precuneus, posterior parietal cortex, middle temporal gyrus, parahippocampal cortex, anterior prefrontal cortex, anterior cingulate cortex, ventrolateral prefrontal cortex, insular cortex, orbitofrontal cortex, ventral hippocampus, ventral striatum, thalamus, primary motor cortex, premotor cortex, and visual cortex.
- the disclosure relates to a system for classifying neurophysiological biotypes of depression in the brain of a patient.
- the system may include an input module configured to receive fMRI data from an fMRI scan.
- an fMRI machine may be coupled to the input module.
- the system may also include a connectivity evaluation module configured to process the received fMRI data to extract brain region functional connectivity information associated with a brain of the patient.
- the system may also include a classification module configured to classify the patient into one of a plurality of depression biotypes and an output module for outputting the depression biotype into which the patient was classified.
- the system may also include a biotype classification module.
- the biotype classification module may include a plurality of classifiers, including a first set of classifiers, where each classifier configured to generate a biotype depression likelihood score for a different depression biotype.
- the depression biotype is identified by selecting the depression biotype associated with the classifier that generates the highest biotype depression likelihood score based on the extracted brain region functional connectivity information.
- the extracted brain region functional connectivity information comprises functional connectivity levels between a plurality of the following patient brain regions: the dorsomedial prefrontal cortex, middle temporal gyrus, parahippocampal cortex, dorsolateral prefrontal cortex, anterior prefrontal cortex, posterior parietal cortex, anterior cingulate cortex, insular cortex, ventrolateral prefrontal cortex, precuneus, orbitofrontal cortex, ventral striatum thalamus, raphe nucleus (midbrain), primary cortex, somatosensory cortex, and visual cortex.
- the biotype classification module may be configured to process the extracted brain functional connectivity information by an additional classifier included in a second set of classifiers.
- the second set of classifiers may be configured to determine if the patient suffers from depression, and associated with the depression biotype identified for the patient.
- the biotype classification module may be configured to determine if the patient suffers from a first biotype of depression or if the patient has no known depression diagnosis, by processing the extracted brain region functional connectivity information between a plurality of the following patient brain regions: the posterior parietal cortex, precuneus, middle temporal gyms, parahippocampal cortex, dorsolateral prefrontal cortex, ventrolateral prefrontal cortex, insular cortex, temporal pol, superior temporal gyms, ventromedial prefrontal cortex, ventral hippocampus, amygdala, ventral caudate nucleus, ventral striatum, thalamus, primary somatosensory cortex, primary motor cortex, visual cortex.
- the biotype classification module may be configured to determine if the patient suffers from a second biotype of depression or if the patient has no known depression diagnosis, by processing the extracted brain region functional connectivity information between a plurality of the following patient brain regions: the dorsomedial prefrontal cortex, ventromedial prefrontal cortex, orbitofrontal cortex, posterior cingulate cortex, fusiform gyms, middle temporal gyms, parahippocampal cortex, anterior cingulate cortex, ventrolateral prefrontal cortex, dorsolateral prefrontal cortex, insular cortex, posterior parietal cortex, thalamus, primary somatosensory cortex, primary motor cortex, and visual cortex.
- the biotype classification module may be configured to determine if the patient suffers from a third biotype of depression or if the patient has no known depression diagnosis, by processing the extracted brain region functional connectivity information between a plurality of the following patient brain regions: the ventromedial prefrontal cortex, posterior parietal cortex, middle temporal gyms, parahippocampal cortex, ventrolateral prefrontal cortex, anterior prefrontal cortex, dorsolateral prefrontal cortex, posterior parietal cortex, temporal pole, superior temporal gyrus, orbitofrontal cortex, parahippocampal cortex, ventral hippocampus, amygdala, subgenual anterior cingulate cortex, ventral caudate nucleus, ventral striatum, thalamus, premotor cortex, supplementary motor area, insular cortex, anterior cingulate cortex, and fusiform gyrus.
- the biotype classification module may be configured to determine if the patient suffers from a fourth biotype of depression or if the patient has no known depression diagnosis, by processing the extracted brain region functional connectivity information between a plurality of the following patient brain regions: the fusiform gyrus, parahippocampal cortex, ventrolateral prefrontal cortex, posterior parietal cortex, anterior cingulate cortex, middle cingulate cortex, insular cortex, temporal pole, superior temporal gyms, middle temporal gyms, orbitofrontal cortex, ventral hippocampus, subgenual anterior cingulate cortex, ventral striatum, thalamus, primary somatosensory cortex, supplementary motor area, insular cortex, postcentral gyrus, and lingual gyms.
- the biotype classification module may be configured to identify the identified depression biotype with a principal component analysis of the brain region functional connectivity extracted from the fMRI signal.
- the biotype classification module may include a linear support vector machine classifier configured to output the likelihood of an associated depression biotype.
- the system may also include a depression treatment prognosis classifier for the patient configured to apply a prognosis classifier to the extracted brain region functional connectivity information.
- the prognosis classifier is configured to output a likelihood of success of an identified depression treatment for the patient.
- the depression treatment prognosis classifier may be configured to identify the likelihood of success of an identified depression treatment for the patient by processing the extracted brain region functional connectivity information between a plurality of the following patient brain regions: the dorsomedial prefrontal cortex, anterior cingulate cortex, posterior cingulate cortex, ventromedial prefrontal cortex, ventrolateral prefrontal cortex, dorsolateral prefrontal cortex, posterior parietal cortex, orbitofrontal cortex, amygdala, ventral striatum, nucleus accumbens, globus pallidus, thalamus, primary motor cortex, primary somatosensory cortex, and visual cortex.
- the depression treatment prognosis classifier may be configured to identify the likelihood of success of an identified depression treatment for the patient based on a principal component analysis of the brain region functional connectivity extracted from the fMRI signal.
- the identified depression treatment is a repetitive transcranial magnetic stimulation.
- the system may also include a depression severity predictor configured to predict a depression severity of the patient by processing the extracted brain region functional connectivity information with a multiple linear regression model.
- the depression severity predictor may be configured to predict the depression severity for a patient by processing the extracted brain region functional connectivity information between a plurality of the following patient brain regions: the dorsomedial prefrontal cortex, posterior cingulate cortex, precuneus, posterior parietal cortex, middle temporal gyrus, parahippocampal cortex, anterior prefrontal cortex, anterior cingulate cortex, ventrolateral prefrontal cortex, insular cortex, orbitofrontal cortex, ventral hippocampus, ventral striatum, thalamus, primary motor cortex, premotor cortex, and visual cortex.
- the disclosure relates to a non-transitory computer readable medium storing a computer readable instructions, which when executed by a processor cause the processor to carry out a method for classifying biotypes of depression.
- the method includes receiving, by the processor, fMRI data indicative of brain activity of a patient and extracting, by the processor, brain region functional connectivity information from the fMRI signal.
- the method also includes identifying a depression biotype for the patient by applying a biotype classifier executing on the processor to the brain region functional connectivity information extracted from the fMRI signal and outputting, by the processor, the identified depression biotype.
- FIG. 1 illustrates a first schematic diagram of an example diagnostic system for classifying a subject into a depression biotype and predicting a treatment prognosis.
- FIG. 2 illustrates a second schematic diagram of an example diagnostic system for classifying a subject into a depression biotype and predicting a treatment prognosis.
- FIG. 3 illustrates a flow chart of an example method for identifying depression biotypes in a subject.
- FIG. 4 illustrates a flow chart of an example method for identifying a depression biotype and predicting a treatment prognosis.
- FIG. 5 illustrates a flow chart of an example method for identifying a subject's response to a depression treatment option.
- FIG. 6 illustrates a flow chart of an example method for predicting a subject's depression severity and tracking it over time.
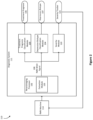
- FIG. 7 illustrates a block diagram of an example computing system.
- Depression is a heterogeneous clinical syndrome linked to dysfunction and abnormal connectivity in frontostiatal and limbic networks of the brain. Depression is typically diagnosed when a patient suffers from at least five of nine symptoms—allowing for several hundred unique combinations of changes in mood, appetite, sleep, energy, cognition, and motor activity. Diagnostic heterogeneity has emerged as a major obstacle to understanding the pathophysiology of major mental illnesses and depression. Although major depressive disorders, especially highly recurrent depression, is up to 45% heritable, identifying genetic risk factors has proven challenging, even in extremely large genome-wide association studies. Likewise, efforts to develop new treatments have slowed, due in part to a lack of physiological targets for assessing treatment efficacy and selecting individual patients who are most likely to benefit. All of these challenges have been attributed in part to the fact that our current diagnostic system assigns a single label to a syndrome that is not unitary and may be caused by distinct pathological processes requiring different treatments.
- the present system and methods described herein diagnose and predict treatment responses for patients suffering with depression by classifying the patient into a depression biotype based on unique patterns of abnormal connectivity in brain networks, including resting state brain networks.
- Functional connectivity may reflect the relationship between neuronal activation patterns in two or more regions of the brain over time evaluated by a functional magnetic resonance imaging or functional MRI (fMRI).
- FIG. 1 illustrates an example block diagram of the system 100 for diagnosing depression biotypes in the brain and predicting treatment responses.
- the system 100 includes a diagnostic system 101 , which includes a neuroimaging processor 102 , depression biotype classification module 104 , a treatment prognosis classification module 105 , and a severity module 120 .
- the diagnostic system 101 receives fMRI data from a subject undergoing an fMRI in an fMRI machine 114 .
- the system 100 includes a diagnostic system 101 .
- the diagnostic system 101 collects fMRI data from an fMRI machine 114 .
- the fMRI machine 114 uses magnetic resonance imaging to map neural networks of a subject's brain and records in vivo a whole brain scan of an individual.
- the neuroimaging processor 102 processes fMRI data. In some implementations, the neuroimaging processor will process the fMRI data to control for motion, age, and scanner related effects, or any combination thereof.
- the neuroimaging processor 102 includes an extraction module 103 .
- the extraction module 103 extracts the fMRI BOLD signal 108 from the fMRI data.
- the fMRI BOLD signal includes brain region functional connectivity information. Details of a method for extracting the fMRI BOLD signal are described further in relation to FIG. 3 .
- the diagnostic system 101 also includes a depression biotype classification module 104 .
- the extraction module 103 extracts the fMRI BOLD signal 108 from the fMRI data.
- the depression biotype classification module 104 receives the fMRI BOLD signal 108 from the neuroimaging processor 102 and extraction module 103 .
- the depression biotype classification module 104 then identifies a depression biotype 107 of the subject.
- the identified depression biotype includes one of at least four depression biotypes, Biotype 1, Biotype 2, Biotype 3, and Biotype 4.
- a depression biotype is identified based on patterns of abnormal connectivity in resting state brain networks. Details of a method for identifying depression biotypes and details on the alterations in functional connectivity between different brain regions for identifying depression biotypes are described further in relation to FIG. 4 .
- the diagnostic system 110 also includes a severity module 120 .
- the severity module 120 receives the fMRI BOLD signal from the neuroimaging processor 102 and the extraction module 103 .
- the severity module 120 predicts depression severity based on the pairwise fMRI functional connectivity measures.
- the severity module 120 outputs a predicted severity score to the severity tracker 121 .
- the severity tracker 121 monitors the subject's predicted depression severity over time based on multiple fMRI scans. Details of a method for predicting a subject's depression severity are described further in relation to FIG. 6 .
- the diagnostic system 101 also includes a treatment prognosis classification module 105 .
- the treatment prognosis classification module 105 receives the identified depression biotype from the depression biotype classification module 104 and predicts a treatment response based on the subject's depression biotype.
- the treatment prognosis classification module 105 outputs a treatment prognosis 106 .
- the treatment prognosis 106 informs the subject or their clinician of the likelihood of success of an identified depressive treatment based on their diagnosed depression biotype.
- Subjects may be differentially responsive to anti-depressant treatment based on their depression biotypes. Some depression biotypes may exhibit very little treatment response to a particular treatment, while other biotypes may exhibit significant treatment response.
- the treatment may be repetitive transcranial magnetic stimulation (rTMS) targeting the dorsomedial prefrontal cortex for depression.
- rTMS is a non-invasive neurostimulation treatment for medication resistant depression. Details of a method for identifying treatment response are described further in relation to FIG. 5 .
- the analysis of the subject's fMRI data may be provided by a computer and outputted by the computer. Details describing the methods of the computer system are described further in FIG. 7 below.
- FIG. 2 illustrates an example block diagram of a system 110 for identifying depression biotypes in the brain and predicting treatment responses.
- the system 110 includes a diagnostic system 111 .
- the diagnostic system 111 includes a neuroimaging processor 102 , a depression biotype classification module 104 , a severity module 120 , and a treatment prognosis classification module 109 .
- the diagnostic system receives fMRI data from a subject undergoing an fMRI from an fMRI machine 114 .
- the system 110 includes a diagnostic system 111 .
- the diagnostic system 111 includes the neuroimaging processor 102 .
- the diagnostic system 111 collects fMRI data from an fMRI machine 114 .
- the neuroimaging processor 102 processes the fMRI data. As mentioned above, in some implementations, the neuroimaging processor will process the data to control for age, motion, and scanner related effects in order to control for artifacts.
- the neuroimaging processor 102 includes an extraction module 103 .
- the extraction module 103 extracts the fMRI BOLD signal 108 from the fMRI data. Details of a method for extracting the fMRI BOLD signal are described further in relation to FIG. 3 .
- the diagnostic system 111 also includes a treatment prognosis classification module 109 and a depression biotype classification module 104 .
- the neuroimaging processor 102 outputs the fMRI BOLD signal 108 to the depression biotype classification module 104 .
- the depression biotype classification module 104 outputs the identified depression biotype 107 .
- the depression biotype 107 represents an identified depression biotype determined based on the abnormal functional connectivity in the subject's brain.
- the depression biotype can be one of a plurality of depression biotypes. Details of a method for identifying depression biotypes and details on the alterations in functional connectivity between different brain regions for identifying depression biotypes are described further in relation to FIG. 4 .
- the neuroimaging processor 102 also outputs the fMRI BOLD signal 108 to the treatment prognosis classification module 109 .
- the treatment prognosis classifier processes the fMRI BOLD signal 108 and outputs a treatment prognosis 106 .
- the treatment prognosis predicts the anti-depressant treatment response, of the subject, based on their unique fMRI BOLD data.
- the treatment may be a non-invasive neurostimulation treatment for medication resistant depression, such as rTMS.
- the diagnostic system 110 also includes a severity module 120 .
- the severity module 120 receives the fMRI BOLD signal 108 from the neuroimaging processor 102 and the extraction module 103 .
- the severity module 120 outputs a predicted depression severity score, based on the pairwise fMRI functional connectivity measures between different brain regions, to the severity tracker 121 .
- the severity tracker 121 monitors the subject's predicted depression severity over time based on multiple fMRI scans. Details of a method for classifying a subject's depression severity are described further in relation to FIG. 6 .
- the analysis of the subject's fMRI data may be provided by a computer and outputted by the computer. Details describing the methods of the computer system are described further in FIG. 7 below.
- FIG. 7 illustrates a block diagram of an example computing system 1500 .
- the computing system 1500 may be utilized in implementing the diagnostic system methods in FIGS. 3 - 6 below.
- the computing system 1510 includes at least one processor 1550 for performing actions in accordance with instructions and one or more memory devices 1570 or 1575 for storing instructions and data.
- the illustrated example computing system 1510 includes one or more processors 1550 in communication, via a bus 1515 , with at least one network interface controller 1520 with network interface ports 1522 ( a - n ) connecting to other computing devices 1524 ( a - n ), memory 1570 , and any other devices 1580 , e.g., an I/O interface.
- a processor 1550 will execute instructions received from memory.
- the processor 1550 illustrated incorporates, or is directly connected to, cache memory 1575 .
- the processor 1550 may be any logic circuitry that processes instructions, e.g., instructions fetched from the memory 1570 or cache 1575 .
- the processor 1550 is a microprocessor unit or special purpose processor.
- the computing device 1500 may be based on any processor, or set of processors, capable of operating as described herein.
- the processor 1550 can be capable of executing the diagnostic system methods shown in FIGS. 4 - 6 .
- the processor 1550 may be a single core or multi-core processor.
- the processor 1550 may be multiple processors.
- the processor 1550 can be configured to run multi-threaded operations.
- the processor 1550 may host one or more virtual machines or containers, along with a hypervisor or container manager for managing the operation of the virtual machines or containers.
- a hypervisor or container manager for managing the operation of the virtual machines or containers.
- one or more of the methods 1300 and 1400 shown in FIGS. 4 - 6 can be implemented within the virtualized or containerized environments provided on the processor 1550 .
- the memory 1570 may be any device suitable for storing computer readable data.
- the memory 1570 may be a device with fixed storage or a device for reading removable storage media. Examples include all forms of non-volatile memory, media and memory devices, semiconductor memory devices (e.g., EPROM, EEPROM, SDRAM, and flash memory devices), magnetic disks, magneto optical disks, and optical discs (e.g., CD ROM, DVD-ROM, and BluRay® discs).
- a computing system 1500 may have any number of memory devices 1570 .
- the memory 1570 can include instructions corresponding to the Internet notification methods 1300 and 1400 shown in FIGS. 3 and 4 .
- the memory 1570 supports virtualized or containerized memory accessible by virtual machine or container execution environments provided by the computing system 1510 .
- the cache memory 1575 is generally a form of computer memory placed in close proximity to the processor 1550 for fast read times. In some implementations, the cache memory 1575 is part of, or on the same chip as, the processor 1550 . In some implementations, there are multiple levels of cache 1575 , e.g., L2 and L3 cache layers.
- the network interface controller 1520 manages data exchanges via the network interfaces 1522 ( a - n ) (also referred to as network interface ports).
- the network interface controller 1520 handles the physical and data link layers of the OSI model for network communication. In some implementations, some of the network interface controller's tasks are handled by the processor 1550 . In some implementations, the network interface controller 1520 is part of the processor 1550 .
- a computing system 1510 has multiple network interface controllers 1520 .
- the network interfaces 1522 ( a - n ) are connection points for physical network links. In some implementations, the network interface controller 1520 supports wireless network connections and an interface port 1522 is a wireless receiver/transmitter.
- a computing device 1510 exchanges data with other computing devices 1512 ( a - n ) via physical or wireless links to a network interfaces 1522 ( a - n ).
- the network interface controller 1520 implements a network protocol such as Ethernet.
- the other computing devices 1524 ( a - n ) are connected to the computing device 1510 via a network interface port 1522 .
- the other computing devices 1524 ( a - n ) may be peer computing devices, network devices, or any other computing device with network functionality.
- a first computing device 1524 ( a ) may be a network device such as a hub, a bridge, a switch, or a router, connecting the computing device 1510 to a data network such as the Internet.
- the other devices 1580 may include an I/O interface, external serial device ports, and any additional co-processors.
- a computing system 1510 may include an interface (e.g., a universal serial bus (USB) interface) for connecting input devices (e.g., a keyboard, microphone, mouse, or other pointing device), output devices (e.g., video display, speaker, or printer), or additional memory devices (e.g., portable flash drive or external media drive).
- a computing device 1500 includes an additional device 1580 such as a coprocessor, e.g., a math co-processor can assist the processor 1550 with high precision or complex calculations.
- FIG. 3 illustrates a flow chart of an example method for identifying depression biotypes in a subject and predicting a treatment prognosis.
- the method 1000 includes performing fMRI on a subject (step 1001 ).
- the diagnostic system 101 collects the fMRI signal (step 1002 ).
- the extraction module 103 within the neuroimaging processor 102 extracts the fMRI BOLD signal 108 (step 1003 ).
- the depression biotype classification module 104 receives the extracted fMRI BOLD signal 108 and classifies the subject into an identified depression biotype (step 1004 ).
- the treatment prognosis classification module 105 receives the identified depression biotype and outputs a treatment prognosis 106 based on the subject's depression biotype 107 (step 1005 ).
- the method 1000 includes performing a resting state fMRI on a subject with an fMRI machine 114 .
- the fMRI machine 114 uses magnetic resonance imaging to map neural networks of a subject's brain and records in vivo a whole brain scan of an individual 115 .
- the resting state fMRI is a method of functional brain imaging that evaluates the connectivity of a subject's brain while the subject is at rest.
- a resting state subject means that they are awake but not performing any specific task.
- the subject is laying down with his eyes closed.
- the subject is laying down with their eyes open.
- Resting state fMRI is especially useful because it can be easily utilized in diverse patient populations. Resting state fMRI can quantify functional connectivity in resting state brain networks in terms of correlated, spontaneous fluctuations in the MR signal, which are closely related to structural and synaptic measures of connectivity and which are unbiased by the subject performing a specific task.
- the neuroimaging processor 102 collects the fMRI signal from the subject.
- a subject's resting state fMRI includes, but it is not limited to metabolic measures of neural activity mediated by a hemodynamic response.
- the fMRI signal is preprocessed to control for artifacts caused by the subject's breathing or cardiac pulsations.
- the fMRI signal is additionally or alternatively preprocessed to control for motion, age, and other scanner related effects in the data.
- the neuroimaging processor 102 sends the fMRI signal to the extraction module 103 and the extraction module 103 extracts the fMRI BOLD signal 108 from the fMRI signal.
- the blood oxygen level dependent signal, or the BOLD signal measures the increase in blood oxygenation caused by neuronal activity.
- the fMRI BOLD signal 108 is an indirect measure of neuronal activity. It reflects a function of neural activity, blood flow, and changes in blood volume in the brain. As neurons are stimulated in the brain, oxygenated blood flow increases in the activated region, thereby increasing blood volume.
- the fMRI BOLD signal 108 measures neural activity through blood oxygen levels.
- the extracted fMRI BOLD signal 108 consists of a plurality of connectivity features.
- the connectivity features represent the large-scale spatial networks of the subject's brain.
- the extraction module 103 extracts the fMRI BOLD signal 108 after the functional volume of the fMRI data is resampled and co-registered to a common space.
- a parcellation system is applied to the fMRI data to delineate a plurality of functional networks nodes.
- the functional network nodes span most cortical, subcortical, and cerebellar areas of the brain.
- an fMRI BOLD signal residual time series is extracted for each functional node and correlation matrixes are calculated between these time series to obtain an unbiased estimate of the functional connectivity across the whole brain of each subject.
- the depression biotype classification module 104 receives the extracted fMRI BOLD signal 108 from step 1003 and classifies the subject into an identified depression biotype 107 .
- the classification results in an identified depression biotype.
- the depression biotype includes one of at least four depression biotypes, Biotype 1, Biotype 2, Biotype 3, and Biotype 4.
- An identified depression biotype is based on patterns of abnormal connectivity in a subject's resting state brain networks.
- alterations in fronto-amygdala functional connectivity are most severe in Biotypes 1 and 4.
- the alterations in thalamic and frontostriatal hyerconnectivity are most severe in Biotypes 3 and 4.
- alterations in anterior cingulate and orbitofrontal functional connectivity are most severe in Biotypes 1 and 2.
- a principal component representation is applied to the functional connectivity features in order to convert the functional connectivity features into linearly uncorrelated variables referred to as principal components.
- the principal component variables are used as an input for linear support vector machine classifiers to output the likelihood of an identified depression biotype. Details of a method for identifying depression biotypes and details on the alterations in functional connectivity between different brain regions for identifying depression biotypes are described further in relation to FIG. 4 .
- the treatment prognosis classification module 105 uses the depression biotype 107 from step 1004 as an input to classify a subject's likely response to an antidepressant treatment option.
- the likelihood that a subject will respond to antidepressant treatment is derived from the functional connectivity features extracted from the fMRI signal.
- a principal component analysis representation is applied to the functional connectivity features.
- a linear support vector machine classifier calculates a score corresponding to the likelihood of a subject responding to treatment.
- the antidepressant treatment option is rTMS.
- FIG. 4 illustrates a flow chart of an example method 2000 for classifying a depression biotype.
- the method 2000 includes the depression biotype classification module 104 receiving the extracted fMRI BOLD signal 108 from the neuroimaging processor 102 and extraction module 103 (step 2001 ).
- the depression biotype classification module measures the functional connectivity using the fMRI BOLD signal 108 from step 2001 (step 2002 ).
- Depression biotype classifiers are applied to the pairwise fMRI functional connectivity measures (step 2003 ). Based on the output of the depression biotype classifiers in step 2003 , the subject is identified with a depression biotype (step 2004 ).
- the method 2000 includes receiving the extracted fMRI BOLD signal 108 from the neuroimaging processor 102 and the extraction module 103 .
- the extracted fMRI BOLD signal 108 represents the neural activity in the brain by measuring neural activity through blood oxygen levels.
- the depression biotype classification module 104 measures the subject's functional connectivity (step 2002 ).
- the fMRI BOLD signal is extracted after the functional volume of the fMRI data is resampled and co-registered to a common space.
- a parcellation system may be used to delineate a plurality of functional network nodes spanning most cortical, subcortical, and cerebellar areas of the subject's brain.
- an fMRI BOLD signal residual time series is extracted from each of the plurality of network nodes and correlation matrixes are performed on these time series to obtain an unbiased estimate of the architecture of functional connectivity across the whole brain in a subject.
- a depression biotype classification module 104 collects the subject's depression-related functional connectivity features and classifies the subject into an identified depression biotype (step 2003 ).
- the depression biotype includes one of at least four depression biotypes, Biotype 1, Biotype 2, Biotype 3, and Biotype 4.
- Each depression biotype relates to distinct patterns of abnormal functional connectivity in the brain. For example, in some implementations, alterations in fronto-amygdala functional connectivity are most severe in Biotypes 1 and 4, which are associated with increased anxiety. In contrast, thalamic and frontostriatal hyperconnectivity are pronounced in Biotype 3 and 4, which are associated with increased anhedonia and psychomotor retardation.
- the depression biotype classifiers may be a linear support vector machine classifiers.
- the linear support vector machine classifiers are a previously trained machine learning algorithm.
- the depression biotype classifiers seeks to find a linear optimal hyperplane in order to maximize the separation between multiple classes or multiple biotypes and decipher patterns in the data.
- the depression biotype classifiers rely on the previously identified patterns to classify the subject into an identified depression biotype 107 .
- the depression biotype classification module 104 may be comprised of four depression biotype classifiers to identify the depression biotype.
- the depression biotype classification module 104 may be comprised of eight depression biotype classifiers to identify the depression biotype.
- the linear support vector machine classifiers identify the subject's depression biotype (step 2004 ).
- the linear support vector machine classifiers identify a depression biotype by outputting the likelihood of an identified depression biotype based on the pairwise fMRI functional connectivity measures between neuroanatomical brain regions, described in further detail below.
- An identified depression biotype is based on patterns of abnormal connectivity in resting state brain networks.
- individuals with a known DSM (Diagnostic and Statistical Manual of Mental Disorder) diagnosis may be classified into one of the four depression biotypes Biotype 1, Biotype 2, Biotype 3, and Biotype 4.
- the depression biotype classification module may be comprised of four depression biotype classifiers, one for each of the four depression biotypes.
- Each depression biotype classifier is a linear support vector machine classifier.
- Each of the four depression biotype classifiers calculates a score corresponding to the likelihood of a given individual fitting within its respective biotype.
- the depression biotype classification module 104 then assigns the individual to an identified depression biotype with the highest classifier score.
- the classifier scores derive from the pairwise fMRI functional connectivity measures between the following neuroanatomical brain regions including, dorsomedial prefrontal cortex, middle temporal gyrus, parahippocampal cortex, dorsolateral prefrontal cortex, anterior prefrontal cortex, posterior parietal cortex, anterior cingulate cortex, insular cortex, ventrolateral prefrontal cortex, precuneus, orbitofrontal cortex, ventral striatum thalamus, raphe nucleus (midbrain), primary cortex, somatosensory cortex, and visual cortex.
- individuals with no known DSM diagnosis may be classified into one of the four depression biotypes.
- the depression biotype classification module may be comprised of eight linear support vector machine classifiers. Four of the linear support vector machine classifiers correspond to each of the four depression biotypes and the remaining four linear support vector machine classifiers correspond to whether the individual is depressed or healthy.
- the depression biotype classification module 104 assigns the individual to an identified depression biotype based on their highest score from the four depression biotype classifiers.
- the score for each of the biotype classifiers may be derived from pairwise fMRI functional connectivity measures between the following neuroanatomical brain regions including, dorsomedial prefrontal cortex, middle temporal gyrus, parahippocampal cortex, dorsolateral prefrontal cortex, anterior prefrontal cortex, posterior parietal cortex, anterior cingulate cortex, insular cortex, ventrolateral prefrontal cortex, precuneus, orbitofrontal cortex, ventral striatum thalamus, raphe nucleus (midbrain), primary cortex, somatosensory cortex, and visual cortex.
- the depression biotype classification module 104 determines whether the individual belongs in that identified depression biotype or is not actively depressed, as described below.
- the classifier determining whether the individual belongs in Biotype 1 or is not actively depressed may be derived from pairwise fMRI functional connectivity measures between the following neuroanatomical brain regions including, posterior parietal cortex, precuneus, middle temporal gyms, parahippocampal cortex, dorsolateral prefrontal cortex, ventrolateral prefrontal cortex, insular cortex, temporal pol, superior temporal gyms, ventromedial prefrontal cortex, ventral hippocampus, amygdala, ventral caudate nucleus, ventral striatum, thalamus, primary somatosensory cortex, primary motor cortex, visual cortex.
- the classifier determining whether the individual belongs in Biotype 2 or is not actively depressed may be derived from pairwise fMRI functional connectivity measures between the following neuroanatomical brain regions including, dorsomedial prefrontal cortex, ventromedial prefrontal cortex, orbitofrontal cortex, posterior cingulate cortex, fusiform gyms, middle temporal gyms, parahippocampal cortex, anterior cingulate cortex, ventrolateral prefrontal cortex, dorsolateral prefrontal cortex, insular cortex, posterior parietal cortex, thalamus, primary somatosensory cortex, primary motor cortex, and visual cortex.
- the classifier determining whether the individual belongs in Biotype 3 or is not actively depressed may be derived from pairwise fMRI functional connectivity measures between the following neuroanatomical brain regions including, ventromedial prefrontal cortex, posterior parietal cortex, middle temporal gyms, ventrolateral prefrontal cortex, anterior prefrontal cortex, dorsolateral prefrontal cortex, posterior parietal cortex, temporal pole, superior temporal gyms, orbitofrontal cortex, parahippocampal cortex, ventral hippocampus, amygdala, subgenual anterior cingulate cortex, ventral caudate nucleus, ventral striatum, thalamus, premotor cortex, supplementary motor area, insular cortex, anterior cingulate cortex, fusiform gyrus.
- the classifier determining whether the individual belongs in Biotype 4 or is not actively depressed may be derived from pairwise fMRI functional connectivity measures between the following neuroanatomical brain regions including, fusiform gyms, parahippocampal cortex, ventrolateral prefrontal cortex, posterior parietal cortex, anterior cingulate cortex, middle cingulate cortex, insular cortex, temporal pole, superior temporal gyms, middle temporal gyrus, orbitofrontal cortex, ventral hippocampus, subgenual anterior cingulate cortex, ventral striatum, thalamus, primary somatosensory cortex, supplementary motor area, insular cortex, postcentral gyrus, and lingual gyms.
- the classifier score may be derived based on the pairwise fMRI functional connectivity measures of all of the above brain regions. In some implementations, the classifier score may be derived based on a subset of the pairwise fMRI functional connectivity measures of the above brain regions. In some implementations, the classifier may be based on pairwise fMRI functional connectivity measures between the above mentioned brain regions with additional brain regions or between pairs of other brain regions neither of which are mentioned above. In some implementations, the fMRI measures of functional connectivity are taken between the centroids of a pair of neuroanatomical brain regions. In some implementations, the fMRI measures of functional connectivity are taken between corresponding points within the vicinity of the respective neuroanatomical brain regions of a given pair of regions.
- the score for each classifier may be derived from a low-dimensional principal component representation of the functional connectivity between the neuroanatomical brain regions listed above, plus a patient's clinical symptoms.
- the principal component analysis representation is a decomposition method used to reduce the dimensionality of data.
- the principal component analysis representation of the subject's functional connectivity features reduces the number of features used to represent the data by applying an orthogonal transformation to convert the functional connectivity features into a set of linearly correlated variables called principal components.
- the number of principal components is less than the number of functional connectivity features.
- principal component analysis representation is frequently used for data compression and feature selection.
- the patient's clinical symptoms may be represented by either a self-reported clinical symptom rating such as the patient's item-level responses to the 21-item Beck Depression Inventory, or clinician rating of clinical symptom severity such as the patient's item-level responses to the 17-item Hamilton Depression Rating Scale (“Ham-D”).
- a self-reported clinical symptom rating such as the patient's item-level responses to the 21-item Beck Depression Inventory
- clinician rating of clinical symptom severity such as the patient's item-level responses to the 17-item Hamilton Depression Rating Scale (“Ham-D”).
- FIG. 5 illustrates a flow chart of an example method 3000 for classifying a subject's likely treatment response based on their identified depression biotype.
- the treatment prognosis classification module 109 identifies the treatment prognosis 106 based on the connectivity features and the clinical symptom profile to differentiate treatment responders from non-responders. It outputs the likelihood that the subject will respond to an antidepressant treatment.
- the method 3000 includes performing fMRI imaging on a subject by using an fMRI machine 114 (step 3001 ).
- the fMRI BOLD signal 108 is extracted from the fMRI data (step 3002 ) and the depression biotype is identified (step 3003 ).
- the treatment prognosis classification module 109 predicts the subject's antidepressant response to treatment based on the subject's pairwise fMRI functional connectivity measures (step 3004 ).
- the method 3000 includes performing a resting state fMRI on a subject through an fMRI machine 114 (step 3001 ).
- the step 3001 can be identical to step 1001 shown before.
- a neuroimaging processor 102 collects the fMRI data from the subject and the extraction module 103 extracts the fMRI BOLD signal 108 (step 3002 ).
- the fMRI BOLD signal is an indirect measurement of neural activity in the brain of the subject.
- the step 3002 can be identical to step 1003 shown before.
- the method 3000 includes identifying the individual's depression biotype (step 3003 ).
- the depression biotype includes one of at least four depression biotypes, Biotype 1, Biotype 2, Biotype 3, and Biotype 4.
- Each depression biotype relates to distinct patterns of abnormal functional connectivity in the brain.
- the treatment prognosis classification module 109 receives the fMRI BOLD signal 108 and identifies the individual's depression biotype. Similar to above, in some implementations, individuals with a known DSM (Diagnostic and Statistical Manual of Mental Disorder) diagnosis may be classified into one of the four depression biotypes.
- DSM Diagnostic and Statistical Manual of Mental Disorder
- the treatment prognosis classification module 109 may be comprised of four linear support vector machine classifiers, one for each of the four depression biotypes. Each of the four depression biotype classifiers calculates a score corresponding to the likelihood of a given individual fitting within each of the four biotypes. The treatment prognosis classification module 109 then assigns the individual to an identified depression biotype with the highest classifier score.
- each classifier score may be derived from pairwise fMRI functional connectivity measures between the following neuroanatomical brain regions including, dorsomedial prefrontal cortex, middle temporal gyms, parahippocampal cortex, dorsolateral prefrontal cortex, anterior prefrontal cortex, posterior parietal cortex, anterior cingulate cortex, insular cortex, ventrolateral prefrontal cortex, precuneus, orbitofrontal cortex, ventral striatum thalamus, raphe nucleus (midbrain), primary cortex, somatosensory cortex, and visual cortex.
- the treatment prognosis classification module 109 may classify individuals with no known DSM diagnosis into one of the four depression biotypes. For example, when an individual has no known DSM diagnosis, the treatment prognosis classification module 109 may be comprised of eight linear support vector machine classifiers. Four of the linear support vector machine classifiers correspond to each of the four depression biotypes and the remaining four linear support vector machine classifiers correspond to each of the four depression biotypes and whether the individual is actively depressed. First, the treatment prognosis classification module 109 assigns the individual to an identified depression biotype based on the highest score.
- the score for each of the biotype classifiers may be derived from pairwise fMRI functional connectivity measures between the following neuroanatomical brain regions including, dorsomedial prefrontal cortex, middle temporal gyrus, parahippocampal cortex, dorsolateral prefrontal cortex, anterior prefrontal cortex, posterior parietal cortex, anterior cingulate cortex, insular cortex, ventrolateral prefrontal cortex, precuneus, orbitofrontal cortex, ventral striatum thalamus, raphe nucleus (midbrain), primary cortex, somatosensory cortex, and visual cortex.
- the prognosis classification module 109 determines whether the individual belongs in that identified depression biotype or is not actively depressed, as described in the following four sections.
- the classifier determining whether the individual belongs in Biotype 1 or is not actively depressed may be derived from pairwise fMRI functional connectivity measures between the following neuroanatomical brain regions including, posterior parietal cortex, precuneus, middle temporal gyms, parahippocampal cortex, dorsolateral prefrontal cortex, ventrolateral prefrontal cortex, insular cortex, temporal pol, superior temporal gyms, ventromedial prefrontal cortex, ventral hippocampus, amygdala, ventral caudate nucleus, ventral striatum, thalamus, primary somatosensory cortex, primary motor cortex, visual cortex.
- the classifier determining whether the individual belongs in Biotype 2 or is not actively depressed may be derived from pairwise fMRI functional connectivity measures between the following neuroanatomical brain regions including, dorsomedial prefrontal cortex, ventromedial prefrontal cortex, orbitofrontal cortex, posterior cingulate cortex, fusiform gyms, middle temporal gyms, parahippocampal cortex, anterior cingulate cortex, ventrolateral prefrontal cortex, dorsolateral prefrontal cortex, insular cortex, posterior parietal cortex, thalamus, primary somatosensory cortex, primary motor cortex, and visual cortex.
- the classifier determining whether the individual belongs in Biotype 3 or is not actively depressed may be derived from pairwise fMRI functional connectivity measures between the following neuroanatomical brain regions including, ventromedial prefrontal cortex, posterior parietal cortex, middle temporal gyms, parahippocampal cortex, ventrolateral prefrontal cortex, anterior prefrontal cortex, dorsolateral prefrontal cortex, posterior parietal cortex, temporal pole, superior temporal gyrus, orbitofrontal cortex, ventral hippocampus, amygdala, subgenual anterior cingulate cortex, ventral caudate nucleus, ventral striatum, thalamus, premotor cortex, supplementary motor area, insular cortex, anterior cingulate cortex, fusiform gyrus.
- the classifier determining whether the individual belongs in Biotype 4 or is not depressed may be derived from pairwise fMRI functional connectivity measures between the following neuroanatomical brain regions including, fusiform gyms, parahippocampal cortex, ventrolateral prefrontal cortex, posterior parietal cortex, anterior cingulate cortex, middle cingulate cortex, insular cortex, temporal pole, superior temporal gyms, middle temporal gyms, orbitofrontal cortex, ventral hippocampus, subgenual anterior cingulate cortex, ventral striatum, thalamus, primary somatosensory cortex, supplementary motor area, insular cortex, postcentral gyrus, and lingual gyms.
- the treatment prognosis classifier outputs the likelihood that the subject will respond to an antidepressant treatment (step 3004 ).
- the treatment prognosis classifier may be a linear support vector machine classifier.
- the linear support vector machine classifier is a previously trained machine learning algorithm.
- the treatment prognosis classifier seeks to find an optimal hyperplane in order to maximize the separation between multiple classes or treatment outcomes and decipher patterns in the data.
- the treatment prognosis classifier relies on the previously identified patterns to classify the subject into an identified treatment prognosis.
- the treatment prognosis classifier calculates a score corresponding to the likelihood that the individual will respond to antidepressant treatment.
- the score for the treatment prognosis classifier may be derived from the identified depression biotype of step 3003 and the pairwise fMRI functional connectivity measures.
- pairwise fMRI functional connectivity measures may be derived from the following neuroanatomical brain regions including, dorsomedial prefrontal cortex, anterior cingulate cortex, posterior cingulate cortex, ventromedial prefrontal cortex, ventrolateral prefrontal cortex, dorsolateral prefrontal cortex, posterior parietal cortex, orbitofrontal cortex, amygdala, ventral striatum, nucleus accumbens, globus pallidus, thalamus, primary motor cortex, primary somatosensory cortex, and visual cortex.
- the classifier score may be derived based on the pairwise fMRI functional connectivity measures of all of the above brain regions. In some implementations, the classifier score may be derived based on a subset of the pairwise fMRI functional connectivity measures of the above brain regions. In some implementations, the classifier may be based on pairwise fMRI functional connectivity measures between the above mentioned brain regions with additional brain regions or between pairs of other brain regions neither of which are mentioned above. In some implementations, the fMRI measures of functional connectivity are taken between the centroids of a pair of neuroanatomical brain regions. In some implementations, the fMRI measures of functional connectivity are taken between corresponding points within the vicinity of the respective neuroanatomical brain regions of a given pair of regions.
- the score from treatment prognosis classifier may be derived from a principal component representation.
- the principal component analysis representation is a decomposition method used to reduce the dimensionality of data.
- the principal component analysis representation of the functional connectivity features reduces the number of features used to represent the data.
- the score for the treatment prognosis classifier may be derived from the identified depression biotype from step 3003 and the principal component representation of the same fMRI measure of functional connectivity derived from the neuroanatomical brain regions listed above.
- the principal component representation of the subject's functional connectivity features in the treatment prognosis module also applies the subject's clinical symptom profile of depression.
- the clinical symptom profiles include a 17 item Ham-D clinician-administered depression assessment scale.
- the clinical symptom profile includes a 21 item Beck Depression Inventory self-reported depression assessment scale.
- the antidepressant treatment is a non-invasive neurostimulation treatment of rTMS targeting the dorsomedial prefrontal cortex for depression.
- rTMS is a non-invasive neurostimulation treatment for medication-resistant depression that acts by enhancing synaptic plasticity at the prefrontal stimulation target and modulating functional connectivity in cortical networks.
- efficacy of rTMS varies with functional connectivity measures. For example, the left dorsolateral prefrontal cortex is the most common target for stimulation, but efficacy also exists for a dorsomedial prefrontal cortical target.
- the dorsomedial prefrontal cortical area may be among some of the important neuroanatomical areas differentiating the four biotypes. Individual differences in the antidepressant response to rTMS may be predicted on the basis of the differences in functional connectivity and symptom profiles. In some implementations, patients in Biotype 1 were more than three times more likely to benefit from transcranial magnetic stimulation of the dorsomedial prefrontal cortex than those in Biotypes 2 or 4.
- FIG. 6 illustrates a flow chart of an example method for predicting a subject's depression severity and tracking it over time.
- the severity module 120 quantifies the severity of a patient's depression based on the fMRI data instead of patient self-reports.
- the severity module 120 outputs the patient's depression severity to the severity tracker 121 , which tracks the patient's change in depression severity over time.
- the method 4000 includes performing resting state fMRI imaging on a subject using an fMRI machine 114 (step 4001 ).
- the fMRI BOLD signal is extracted from the fMRI data (step 4002 ).
- the severity module 120 receives the fMRI BOLD signal from the neuroimaging processor 102 and predicts the subject's depression severity (step 4003 ).
- the severity module 120 outputs the subject's depression severity to the severity tracker and the severity tracker follows the subject's severity over time through multiple fMRI scans (step 4004 ).
- the method 4000 includes performing a resting state fMRI on a subject through an fMRI machine 114 (step 4001 ).
- the fMRI machine uses magnetic resonance imaging to map neural networks of a subject's brain and records in vivo a whole brain scan of an individual.
- the resting state fMRI is a method of functional brain imaging that evaluates the connectivity of a subject's brain while the subject is at rest.
- the step 4001 can be identical to step 1001 shown above in FIG. 3 .
- a neuroimaging processor 102 collects the fMRI data from the subject and the extraction module 103 extracts the fMRI BOLD signal 108 (step 4002 ).
- the fMRI BOLD signal is an indirect measurement of neural activity.
- the step 4002 can be identical to step 1003 shown above in FIG. 3 .
- the severity module 120 utilizes a multiple linear regression model to predict a subject's depression severity (step 4003 ).
- Multiple linear regression is a statistical method that studies the relationship between a response variable and multiple continuous, quantitative predictor variables.
- the response variable may be depression severity and the multiple continuous, quantitative predictor variables may be pairwise fMRI functional connectivity measures.
- the response variable may represent the actual depression severity of the subject, and the predictor variables may represent the pairwise fMRI functional connectivity measures.
- the multiple linear regression model models the relationship between multiple predictor variables and a response variable by fitting a linear equation to the observed data.
- the multiple linear regression model predicts depression severity by assigning weights to pairwise fMRI functional connectivity measures and summing across these weighted measures to yield a predicted depression severity score.
- the multiple linear regression model utilizes pairwise fMRI functional connectivity measures between the following neuroanatomical brain regions including, dorsomedial prefrontal cortex, posterior cingulate cortex, precuneus, posterior parietal cortex, middle temporal gyrus, parahippocampal cortex, anterior prefrontal cortex, anterior cingulate cortex, ventrolateral prefrontal cortex, insular cortex, orbitofrontal cortex, ventral hippocampus, ventral striatum, thalamus, primary motor cortex, premotor cortex, and visual cortex.
- the severity module may include a low dimensional principal component representation of the pairwise fMRI functional connectivity measures.
- the classifier score may be derived based on the pairwise fMRI functional connectivity measures of all of the above brain regions. In some implementations, the classifier score may be derived based on a subset of the pairwise fMRI functional connectivity measures of the above brain regions. In some implementations, the classifier may be based on pairwise fMRI functional connectivity measures between the above mentioned brain regions with additional brain regions or between pairs of other brain regions neither of which are mentioned above. In some implementations, the fMRI measures of functional connectivity are taken between the centroids of a pair of neuroanatomical brain regions. In some implementations, the fMRI measures of functional connectivity are taken between corresponding points within the vicinity of the respective neuroanatomical brain regions of a given pair of regions.
- the method 4000 includes outputting the subject's predicted depression severity score to the severity tracker 121 .
- the severity tracker receives the subject's predicted depression severity score and stores the information. Over time and based on multiple resting state fMRI scans, the severity tracker compiles the subject's predicted severity depression scores. In comparison to evaluating depression severity based on answers to questionnaires, as is the typical practice currently, the fMRI-based severity depression scores are a more objective means to evaluate a subject's depression severity. For example, such scores are not susceptible to errors due to inconsistent interpretations of questionnaire questions or potential inaccurate or otherwise non-representative responses from subjects answering the questionnaires.
- the depression severity scores may be used for language or otherwise developmentally impaired or disabled subjects who may not be competent or capable of effectively responding to the questionnaires.
- the severity tracker 121 can determine if the subject's compilation of predicted severity scores increased or decreased, which determines whether the subject's depression severity has increased or decreased over time.
- the severity tracker 121 can determine the antidepressant treatment effectiveness based on changes over time in the subject's compilation of predicted severity scores.
- the severity tracker 121 can track the depression severity scores across multiple subjects having been identified as having the same depression biotype and receiving the same treatment, for example in the context of a clinical trial, to assess the effectiveness of the clinical trial.
- biotype cluster discovery data was collected from 220 patients. To ensure that the cluster discovery was not confounded by site-related differences in subject recruitment criteria or other undefined variables, the cluster discovery analysis was conducted on these 220 patients who were recruited from two sites, with identical inclusion and exclusion criteria and statistically equivalent depression symptom scores.
- a parcellation system was applied to the fMRI data to delineate 258 functional network nodes.
- the fMRI BOLD signal residual time series was extracted for each functional node and correlation matrixes were calculated between these time series to obtain an unbiased estimate of the architecture of functional connectivity across the whole brain.
- Each correlation matrix comprised about 33,000 unique connectivity features.
- the processor applied a canonical correlation analysis associated with weighted combinations of clinical symptoms, as quantified by the 17 item Ham-D scale, to the extracted fMRI BOLD signal data.
- the analysis revealed linear combinations of connectivity features (analogous to principal components) that predicted two distinct sets of depressive symptoms.
- the first connectivity feature defined a combination of predominantly frontostriatal and orbitofrontal connectivity features that were correlated with anhedonia and psychomotor retardation.
- the second connectivity feature defined a distinct set of predominantly limbic connectivity features involving the amygdala, ventral hippocampus, ventral striatum, subgenual cingulate, and later prefrontal control areas and correlated with anxiety and insomnia.
- Hierarchical clustering revealed four depression biotypes defined by distinct and relatively homogenous patterns of connectivity along these two connectivity components. Additional potential clustering solutions were also evident within these four groups. In some implementations, the hierarchical cluster analysis uses Ward's minimum variance method.
- the classification process was optimized in a training dataset comprising 333 patients and 378 healthy controls matched for age and sex.
- the classifiers were trained iteratively on a randomly selected subset of these subjects, and then tested on an independent subset left out of all aspects of the training process.
- Support vector machine classifiers yielded overall accuracy rates of up to 89.2% based on connectivity features with the neuroanatomical areas, listed above in FIG. 4 .
- the pairwise fMRI functional connectivity measures may include dorsomedial prefrontal cortex, middle temporal gyms, parahippocampal cortex, dorsolateral prefrontal cortex, anterior prefrontal cortex, posterior parietal cortex, anterior cingulate cortex, insular cortex, ventrolateral prefrontal cortex, precuneus, orbitofrontal cortex, ventral striatum thalamus, raphe nucleus (midbrain), primary cortex, somatosensory cortex, and visual cortex.
- the pairwise fMRI functional connectivity measures may include posterior parietal cortex, precuneus, middle temporal gyrus, parahippocampal cortex, dorsolateral prefrontal cortex, ventrolateral prefrontal cortex, insular cortex, temporal pol, superior temporal gyms, ventromedial prefrontal cortex, ventral hippocampus, amygdala, ventral caudate nucleus, ventral striatum, thalamus, primary somatosensory cortex, primary motor cortex, visual cortex.
- the pairwise fMRI functional connectivity features may include dorsomedial prefrontal cortex, ventromedial prefrontal cortex, orbitofrontal cortex, posterior cingulate cortex, fusiform gyrus, middle temporal gyrus, parahippocampal cortex, anterior cingulate cortex, ventrolateral prefrontal cortex, dorsolateral prefrontal cortex, insular cortex, posterior parietal cortex, thalamus, primary somatosensory cortex, primary motor cortex, and visual cortex.
- the pairwise fMRI functional connectivity measures may include ventromedial prefrontal cortex, posterior parietal cortex, middle temporal gyrus, ventrolateral prefrontal cortex, anterior prefrontal cortex, dorsolateral prefrontal cortex, posterior parietal cortex, temporal pole, superior temporal gyms, orbitofrontal cortex, parahippocampal cortex, ventral hippocampus, amygdala, subgenual anterior cingulate cortex, ventral caudate nucleus, ventral striatum, thalamus, premotor cortex, supplementary motor area, insular cortex, anterior cingulate cortex, fusiform gyrus.
- the pairwise fMRI functional connectivity measures may include fusiform gyrus, parahippocampal cortex, ventrolateral prefrontal cortex, posterior parietal cortex, anterior cingulate cortex, middle cingulate cortex, insular cortex, temporal pole, superior temporal gyms, middle temporal gyms, orbitofrontal cortex, ventral hippocampus, subgenual anterior cingulate cortex, ventral striatum, thalamus, primary somatosensory cortex, supplementary motor area, insular cortex, postcentral gyrus, and lingual gyms.
- Tests were also conducted to determine whether the clustering results were influenced by differences in other variables that have known or suspected effects on resting state fMRI measures of functional connectivity, including age, medication usage, and head motion during scanning Results showed no significant between group differences on any of these measures.
- the classifiers were trained to differentiate responders and non-responders using the same approach to feature selection, training, and leave-one-out cross-validation as described above. This tested whether connectivity based biotypes could be used to predict treatment response more effectively than clinical symptoms alone.
- the most discriminating functional connectivity features involved the dorsomedial prefrontal stimulation target and the left amygdala, left dorsolateral prefrontal cortex, bilateral orbitofrontal cortex, and posterior cingulate cortex. Connectivity between other neuroanatomical areas that were not directly stimulated by the rTMS protocol—including the ventromedial prefrontal cortex, thalamus, nucleus accumbens, and globus pallidus—was also highly associated with subsequent treatment response.
- Biotype diagnosis significantly improved classifier performance. Classification based on the same discriminating connectivity features plus biotype diagnosis increased overall accuracy rates to 89.6%, with a 93.6% correct prediction rate for non-responders, p ⁇ 0.001. Accuracy rates could be further improved from 89.6% to >94% by implementing stricter data quality controls and treating subjects with ambiguous classification outcomes as equivocal test results.
- a multiple linear regression model predicted a subject's depression severity by assigning weights to pairwise fMRI functional connectivity measures and summing across these weighted measures to yield a predicted depression severity.
- the multiple linear regression model utilized pairwise fMRI functional connectivity measures between the following neuroanatomical brain regions including, dorsomedial prefrontal cortex, posterior cingulate cortex, precuneus, posterior parietal cortex, middle temporal gyms, parahippocampal cortex, anterior prefrontal cortex, anterior cingulate cortex, ventrolateral prefrontal cortex, insular cortex, orbitofrontal cortex, ventral hippocampus, ventral striatum, thalamus, primary motor cortex, premotor cortex, and visual cortex.
- Implementations of the subject matter and the operations described in this specification can be implemented in digital electronic circuitry, or in computer software embodied on a tangible medium, firmware, or hardware, including the structures disclosed in this specification and their structural equivalents, or in combinations of one or more of them. Implementations of the subject matter described in this specification can be implemented as one or more computer programs embodied on a tangible medium, i.e., one or more modules of computer program instructions, encoded on one or more computer storage media for execution by, or to control the operation of, a data processing apparatus.
- a computer storage medium can be, or be included in, a computer-readable storage device, a computer-readable storage substrate, a random or serial access memory array or device, or a combination of one or more of them.
- the computer storage medium can also be, or be included in, one or more separate components or media (e.g., multiple CDs, disks, or other storage devices).
- the computer storage medium may be tangible and non-transitory.
- the operations described in this specification can be implemented as operations performed by a data processing apparatus on data stored on one or more computer-readable storage devices or received from other sources.
- the operations may be executed within the native environment of the data processing apparatus or within one or more virtual machines or containers hosted by the data processing apparatus.
- a computer program (also known as a program, software, software application, script, or code) can be written in any form of programming language, including compiled or interpreted languages, declarative or procedural languages, and it can be deployed in any form, including as a stand-alone program or as a module, component, subroutine, object, or other unit suitable for use in a computing environment.
- a computer program may, but need not, correspond to a file in a file system.
- a program can be stored in a portion of a file that holds other programs or data (e.g., one or more scripts stored in a markup language document), in a single file dedicated to the program in question, or in multiple coordinated files (e.g., files that store one or more modules, sub programs, or portions of code).
- a computer program can be deployed to be executed on one computer or on multiple computers or one or more virtual machines or containers that are located at one site or distributed across multiple sites and interconnected by a communication network.
- Examples of communication networks include a local area network (“LAN”) and a wide area network (“WAN”), an inter-network (e.g., the Internet), and peer-to-peer networks (e.g., ad hoc peer-to-peer networks).
- the processes and logic flows described in this specification can be performed by one or more programmable processors executing one or more computer programs to perform actions by operating on input data and generating output.
- the processes and logic flows can also be performed by, and apparatus can also be implemented as, special purpose logic circuitry, e.g., an FPGA (field programmable gate array) or an ASIC (application specific integrated circuit).
- references to “or” may be construed as inclusive so that any terms described using “or” may indicate any of a single, more than one, and all of the described terms.
- the labels “first,” “second,” “third,” and so forth are not necessarily meant to indicate an ordering and are generally used merely to distinguish between like or similar items or elements.
Landscapes
- Health & Medical Sciences (AREA)
- Engineering & Computer Science (AREA)
- Life Sciences & Earth Sciences (AREA)
- Physics & Mathematics (AREA)
- Public Health (AREA)
- Medical Informatics (AREA)
- General Health & Medical Sciences (AREA)
- Biomedical Technology (AREA)
- Pathology (AREA)
- Surgery (AREA)
- Heart & Thoracic Surgery (AREA)
- Molecular Biology (AREA)
- Biophysics (AREA)
- Animal Behavior & Ethology (AREA)
- Nuclear Medicine, Radiotherapy & Molecular Imaging (AREA)
- Veterinary Medicine (AREA)
- Radiology & Medical Imaging (AREA)
- Psychiatry (AREA)
- Artificial Intelligence (AREA)
- Data Mining & Analysis (AREA)
- Primary Health Care (AREA)
- Epidemiology (AREA)
- Signal Processing (AREA)
- Computer Vision & Pattern Recognition (AREA)
- High Energy & Nuclear Physics (AREA)
- Databases & Information Systems (AREA)
- Social Psychology (AREA)
- Condensed Matter Physics & Semiconductors (AREA)
- General Physics & Mathematics (AREA)
- Physiology (AREA)
- Child & Adolescent Psychology (AREA)
- Developmental Disabilities (AREA)
- Hospice & Palliative Care (AREA)
- Psychology (AREA)
- Neurology (AREA)
- Evolutionary Computation (AREA)
- Fuzzy Systems (AREA)
- Mathematical Physics (AREA)
- Neurosurgery (AREA)
- Educational Technology (AREA)
Abstract
Description
Claims (21)
Priority Applications (1)
| Application Number | Priority Date | Filing Date | Title |
|---|---|---|---|
| US16/464,191 US11806146B2 (en) | 2016-11-28 | 2017-11-28 | Systems and methods for identifying a neurophysiological biotype of depression in the brain of a patient |
Applications Claiming Priority (3)
| Application Number | Priority Date | Filing Date | Title |
|---|---|---|---|
| US201662426835P | 2016-11-28 | 2016-11-28 | |
| PCT/US2017/063425 WO2018098467A1 (en) | 2016-11-28 | 2017-11-28 | Systems and methods for identifying a neurophysiological biotype of depression in the brain of a patient |
| US16/464,191 US11806146B2 (en) | 2016-11-28 | 2017-11-28 | Systems and methods for identifying a neurophysiological biotype of depression in the brain of a patient |
Publications (2)
| Publication Number | Publication Date |
|---|---|
| US20200289044A1 US20200289044A1 (en) | 2020-09-17 |
| US11806146B2 true US11806146B2 (en) | 2023-11-07 |
Family
ID=60813972
Family Applications (1)
| Application Number | Title | Priority Date | Filing Date |
|---|---|---|---|
| US16/464,191 Active 2039-06-29 US11806146B2 (en) | 2016-11-28 | 2017-11-28 | Systems and methods for identifying a neurophysiological biotype of depression in the brain of a patient |
Country Status (3)
| Country | Link |
|---|---|
| US (1) | US11806146B2 (en) |
| EP (1) | EP3545528A1 (en) |
| WO (1) | WO2018098467A1 (en) |
Families Citing this family (12)
| Publication number | Priority date | Publication date | Assignee | Title |
|---|---|---|---|---|
| US20210170180A1 (en) * | 2019-12-09 | 2021-06-10 | Washington University | Systems and methods of precision functional mapping-guided personalized neuromodulation |
| CN111000560B (en) * | 2019-12-26 | 2023-03-10 | 中国科学院合肥物质科学研究院 | Real-time evaluation system for motor brain function and using method thereof |
| KR102439639B1 (en) * | 2020-03-24 | 2022-09-02 | 비웨이브 주식회사 | A method for providing information on major depression and a device for providing information on major depression using the same |
| US20230154628A1 (en) * | 2020-04-07 | 2023-05-18 | Nippon Telegraph And Telephone Corporation | Analysis apparatus, analysis method and program |
| CN112971781B (en) * | 2020-12-30 | 2022-10-28 | 杭州电子科技大学 | Network depression contrast device based on brain function |
| CN113367680B (en) * | 2021-07-05 | 2022-09-30 | 北京银河方圆科技有限公司 | Target point determination method, device, equipment and storage medium |
| CN113705680B (en) * | 2021-08-27 | 2024-08-02 | 兰州大学 | Cancer accompanying depression identification method based on multi-mode magnetic resonance data |
| CN115424067B (en) * | 2022-08-30 | 2026-02-13 | 上海市精神卫生中心(上海市心理咨询培训中心) | A system, method, processor, and storage medium for classifying depression subtypes based on multi-fusion brain network mapping technology. |
| CN116010901A (en) * | 2023-01-09 | 2023-04-25 | 中国人民武装警察部队特色医学中心 | A method and system for identifying depression based on a multimodal data fusion model |
| WO2025034595A2 (en) * | 2023-08-04 | 2025-02-13 | Cornell University | Mapping of brain networks for detection or characterization of psychological conditions |
| US20250107713A1 (en) * | 2023-09-29 | 2025-04-03 | The Board Of Trustees Of The Leland Stanford Junior University | Systems and Methods for Confirming Iboga Alkaloid Treatment |
| WO2026015852A1 (en) * | 2024-07-11 | 2026-01-15 | Baylor College Of Medicine | A method for using neural activity to assess clinical response after deep brain stimulation for psychiatric disorders |
Citations (2)
| Publication number | Priority date | Publication date | Assignee | Title |
|---|---|---|---|---|
| US20160019693A1 (en) * | 2014-07-15 | 2016-01-21 | The Brigham And Women's Hospital | Systems and methods for generating biomarkers based on multivariate classification of functional imaging and associated data |
| US20170343634A1 (en) * | 2014-12-01 | 2017-11-30 | The Feinstein Institute For Medical Research | Use of striatal connectivity patterns for evaluating antipsychotic agents |
-
2017
- 2017-11-28 US US16/464,191 patent/US11806146B2/en active Active
- 2017-11-28 EP EP17822091.9A patent/EP3545528A1/en active Pending
- 2017-11-28 WO PCT/US2017/063425 patent/WO2018098467A1/en not_active Ceased
Patent Citations (2)
| Publication number | Priority date | Publication date | Assignee | Title |
|---|---|---|---|---|
| US20160019693A1 (en) * | 2014-07-15 | 2016-01-21 | The Brigham And Women's Hospital | Systems and methods for generating biomarkers based on multivariate classification of functional imaging and associated data |
| US20170343634A1 (en) * | 2014-12-01 | 2017-11-30 | The Feinstein Institute For Medical Research | Use of striatal connectivity patterns for evaluating antipsychotic agents |
Non-Patent Citations (18)
| Title |
|---|
| Bakker, "Resting-state functional connectivity predicts individual treatment outcomes of repetitive transcranial magnetic stimulation for major depression disorder", Institute of Medical Science, University of Toronto, 2014. (Year: 2014). * |
| Bakker, Nathan. "Resting-State Functional Connectivity Predicts Individual Treatment Outcomes of Repetitive Transcranial Magnetic Stimulation for Major Depressive Disorder" Jan. 1, 2014. Retrieved from the Internet: URL: https://search.proquest.com/docview/1771278068?accountid=29404. |
| Cao et al., "Aberrant functional connectivity for diagnosis of major depressive disorder: A discriminant analysis", Psychiatry and Clinical Neurosciences 2014; 68: 110-119. (Year: 2014). * |
| Cao, Longlong, et al. "Aberrant functional connectivity for diagnosis of major depressive disorder: A discriminant analysis: Potential new biomarkers for MDD" Psychiatry and Clinical Neurosciences, vol. 68, No. 2, pp. 110-119, Oct. 31, 2013. |
| Grotegerd, Dominik, et al. "Discriminating unipolar and bipolar depression by means of fMRI and pattern classification: a pilot study", European Archives of Psychiatry and Clinical Neuroscience, vol. 263, No. 2, pp. 119-131, May 26, 2012. |
| Guo et al., "Distinct neurobiological signatures of brain connectivity in depression subtypes during natural viewing of emotionally salient films", Psychological Medicine, vol. 46, Issue 7, May 2016, pp. 1535-1545 (pp. 1-11). Cambridge University Press 2016. (Year: 2016). * |
| International Search Report and Written Opinion dated Mar. 9, 2018 in PCT Application No. PCT/US2017/063425. |
| Liberg, Benny, et al. "Functional and structural alterations in the cingulate motor area relate to decreased fronto-striatal coupling in major depressive disorder with psychomotor disturbances" Frontiers in Psychiatry, vol. 5, Dec. 4, 2014. |
| Liston, Conor, et al. "Default Mode Network Mechanisms of Transcranial Magnetic Stimulation in Depression", Biological Psychiatry, vol. 76, No. 7, pp. 517-526, Oct. 1, 2014. |
| Lord, Anton, et al. "Changes in Community Structure of Resting State Functional Connectivity in Unipolar Depression" PLOS ONE, vol. 7, No. 8, p. e41282, Aug. 20, 2012. |
| Oathes, Desmond J., et al. "Neurobiological signatures of anxiety and depression in resting-state fMRI" Biol. Psychiatry, vol. 77, No. 4, pp. 385-393, Feb. 15, 2015. |
| Office Action dated Jul. 1, 2022 in European Patent Application No. 17822091.9. A. |
| Rajamannar, Ramasubbu, et al. "Accuracy of automated classification of major depressive disorder as a function of symptom severity" Neuroimage: Clinical, vol. 12, pp. 320-331, Feb. 1, 2016. |
| Rashid, Barnaly, et al. "Classification of schizophrenia and bipolar patients using static and dynamic resting-state fMRI brain connectivity" Neuroimage, vol. 134, pp. 645-657, Jul. 1, 2016. |
| Veloso, Telma Alves. "Exploration and application of machine learning algorithms to functional connectivity data" Jan. 1, 2014 Retrieved from the Internet: URL: https://repositorium.sdum.uminho.pt/bitstream/1822/34155/1/Telma%20Alves%20Veloso.pdf. |
| Wei, Maobin et al. "Identifying major depressive disorder using Hurst exponent of resting-state brain networks" Psychiatry Research: Neuroimaging, vol. 214, No. 3, pp. 306-312, 2013. |
| Williams LM. Defining biotypes for depression and anxiety based on large-scale circuit dysfunction: a theoretical review of the evidence and future directions for clinical translation. Depress Anxiety. Jan. 2017;34(1):9-24. doi: 10.1002/da.22556. Epub Sep. 21, 2016. PMID: 27653321; PMCID: PMC5702265. |
| Williams, Leanne M. "Defining biotypes for depression and anxiety based on large-scale circuit dysfunction: a theoretical review of the evidence and future directions for clinical translation" Depress Anxiety, vol. 34, No. 1, pp. 9-24, Jan. 2017. |
Also Published As
| Publication number | Publication date |
|---|---|
| US20200289044A1 (en) | 2020-09-17 |
| EP3545528A1 (en) | 2019-10-02 |
| WO2018098467A1 (en) | 2018-05-31 |
Similar Documents
| Publication | Publication Date | Title |
|---|---|---|
| US11806146B2 (en) | Systems and methods for identifying a neurophysiological biotype of depression in the brain of a patient | |
| Lombardi et al. | A robust framework to investigate the reliability and stability of explainable artificial intelligence markers of mild cognitive impairment and Alzheimer’s disease | |
| Islam et al. | Brain MRI analysis for Alzheimer’s disease diagnosis using an ensemble system of deep convolutional neural networks | |
| Woo et al. | Building better biomarkers: brain models in translational neuroimaging | |
| Li et al. | Alzheimer's disease diagnosis based on multiple cluster dense convolutional networks | |
| Schmaal et al. | Predicting the naturalistic course of major depressive disorder using clinical and multimodal neuroimaging information: a multivariate pattern recognition study | |
| Drysdale et al. | Resting-state connectivity biomarkers define neurophysiological subtypes of depression | |
| Kohannim et al. | Boosting power for clinical trials using classifiers based on multiple biomarkers | |
| Maglanoc et al. | Multimodal fusion of structural and functional brain imaging in depression using linked independent component analysis | |
| Sun et al. | Elucidating a magnetic resonance imaging-based neuroanatomic biomarker for psychosis: classification analysis using probabilistic brain atlas and machine learning algorithms | |
| Nielsen et al. | Multisite functional connectivity MRI classification of autism: ABIDE results | |
| Zhou et al. | Prediction of Alzheimer’s disease progression based on magnetic resonance imaging | |
| Davenport et al. | Neurodegenerative disease of the brain: a survey of interdisciplinary approaches | |
| Osuch et al. | Complexity in mood disorder diagnosis: fMRI connectivity networks predicted medication‐class of response in complex patients | |
| Karrer et al. | Brain‐based ranking of cognitive domains to predict schizophrenia | |
| Mahler et al. | Pretraining is all you need: A multi-atlas enhanced transformer framework for autism spectrum disorder classification | |
| CN116133587A (en) | A clustering device for correlative values of brain functional connectivity, a clustering system for correlative values of brain functional connectivity, a clustering method for correlative values of brain functional connectivity, a classifier program for correlative values of brain functional connectivity, and a classification system for brain activity markers | |
| Ju et al. | Modulation of resting-state functional connectivity in default mode network is associated with the long-term treatment outcome in major depressive disorder | |
| Bush et al. | Action-value processing underlies the role of the dorsal anterior cingulate cortex in performance monitoring during self-regulation of affect | |
| Sharif et al. | A novel framework for automatic detection of autism: A study on corpus callosum and intracranial brain volume | |
| Wu et al. | Enhancing early diagnosis of bipolar disorder in adolescents through multimodal neuroimaging | |
| Karvelis et al. | Computational approaches to treatment response prediction in major depression using brain activity and behavioral data: A systematic review | |
| von Bachmann et al. | Evaluating regression and probabilistic methods for ECG-based electrolyte prediction | |
| Koc et al. | Autism spectrum disorder detection by hybrid convolutional recurrent neural networks from structural and resting state functional MRI images | |
| Li et al. | Predicting incident dementia in cerebral small vessel disease: comparison of machine learning and traditional statistical models |
Legal Events
| Date | Code | Title | Description |
|---|---|---|---|
| FEPP | Fee payment procedure |
Free format text: ENTITY STATUS SET TO UNDISCOUNTED (ORIGINAL EVENT CODE: BIG.); ENTITY STATUS OF PATENT OWNER: SMALL ENTITY |
|
| AS | Assignment |
Owner name: CORNELL UNIVERSITY, NEW YORK Free format text: ASSIGNMENT OF ASSIGNORS INTEREST;ASSIGNOR:LISTON, CONOR;REEL/FRAME:049728/0235 Effective date: 20190709 |
|
| FEPP | Fee payment procedure |
Free format text: ENTITY STATUS SET TO SMALL (ORIGINAL EVENT CODE: SMAL); ENTITY STATUS OF PATENT OWNER: SMALL ENTITY |
|
| STPP | Information on status: patent application and granting procedure in general |
Free format text: APPLICATION DISPATCHED FROM PREEXAM, NOT YET DOCKETED |
|
| STPP | Information on status: patent application and granting procedure in general |
Free format text: DOCKETED NEW CASE - READY FOR EXAMINATION |
|
| STPP | Information on status: patent application and granting procedure in general |
Free format text: NON FINAL ACTION MAILED |
|
| STPP | Information on status: patent application and granting procedure in general |
Free format text: NON FINAL ACTION MAILED |
|
| STPP | Information on status: patent application and granting procedure in general |
Free format text: RESPONSE TO NON-FINAL OFFICE ACTION ENTERED AND FORWARDED TO EXAMINER |
|
| STPP | Information on status: patent application and granting procedure in general |
Free format text: FINAL REJECTION MAILED |
|
| STPP | Information on status: patent application and granting procedure in general |
Free format text: DOCKETED NEW CASE - READY FOR EXAMINATION |
|
| STPP | Information on status: patent application and granting procedure in general |
Free format text: NON FINAL ACTION MAILED |
|
| STPP | Information on status: patent application and granting procedure in general |
Free format text: RESPONSE TO NON-FINAL OFFICE ACTION ENTERED AND FORWARDED TO EXAMINER |
|
| STPP | Information on status: patent application and granting procedure in general |
Free format text: NOTICE OF ALLOWANCE MAILED -- APPLICATION RECEIVED IN OFFICE OF PUBLICATIONS |
|
| STPP | Information on status: patent application and granting procedure in general |
Free format text: PUBLICATIONS -- ISSUE FEE PAYMENT VERIFIED |
|
| STCF | Information on status: patent grant |
Free format text: PATENTED CASE |