US11650577B2 - Plant operation data monitoring device and method - Google Patents
Plant operation data monitoring device and method Download PDFInfo
- Publication number
- US11650577B2 US11650577B2 US17/132,311 US202017132311A US11650577B2 US 11650577 B2 US11650577 B2 US 11650577B2 US 202017132311 A US202017132311 A US 202017132311A US 11650577 B2 US11650577 B2 US 11650577B2
- Authority
- US
- United States
- Prior art keywords
- gradients
- operation data
- gradient
- positive
- database
- Prior art date
- Legal status (The legal status is an assumption and is not a legal conclusion. Google has not performed a legal analysis and makes no representation as to the accuracy of the status listed.)
- Active
Links
Images


Classifications
-
- G—PHYSICS
- G05—CONTROLLING; REGULATING
- G05B—CONTROL OR REGULATING SYSTEMS IN GENERAL; FUNCTIONAL ELEMENTS OF SUCH SYSTEMS; MONITORING OR TESTING ARRANGEMENTS FOR SUCH SYSTEMS OR ELEMENTS
- G05B23/00—Testing or monitoring of control systems or parts thereof
- G05B23/02—Electric testing or monitoring
- G05B23/0205—Electric testing or monitoring by means of a monitoring system capable of detecting and responding to faults
- G05B23/0218—Electric testing or monitoring by means of a monitoring system capable of detecting and responding to faults characterised by the fault detection method dealing with either existing or incipient faults
- G05B23/0221—Preprocessing measurements, e.g. data collection rate adjustment; Standardization of measurements; Time series or signal analysis, e.g. frequency analysis or wavelets; Trustworthiness of measurements; Indexes therefor; Measurements using easily measured parameters to estimate parameters difficult to measure; Virtual sensor creation; De-noising; Sensor fusion; Unconventional preprocessing inherently present in specific fault detection methods like PCA-based methods
-
- G—PHYSICS
- G05—CONTROLLING; REGULATING
- G05B—CONTROL OR REGULATING SYSTEMS IN GENERAL; FUNCTIONAL ELEMENTS OF SUCH SYSTEMS; MONITORING OR TESTING ARRANGEMENTS FOR SUCH SYSTEMS OR ELEMENTS
- G05B19/00—Program-control systems
- G05B19/02—Program-control systems electric
- G05B19/418—Total factory control, i.e. centrally controlling a plurality of machines, e.g. direct or distributed numerical control [DNC], flexible manufacturing systems [FMS], integrated manufacturing systems [IMS] or computer integrated manufacturing [CIM]
- G05B19/4184—Total factory control, i.e. centrally controlling a plurality of machines, e.g. direct or distributed numerical control [DNC], flexible manufacturing systems [FMS], integrated manufacturing systems [IMS] or computer integrated manufacturing [CIM] characterised by fault tolerance, reliability of production system
-
- G—PHYSICS
- G05—CONTROLLING; REGULATING
- G05B—CONTROL OR REGULATING SYSTEMS IN GENERAL; FUNCTIONAL ELEMENTS OF SUCH SYSTEMS; MONITORING OR TESTING ARRANGEMENTS FOR SUCH SYSTEMS OR ELEMENTS
- G05B19/00—Program-control systems
- G05B19/02—Program-control systems electric
- G05B19/418—Total factory control, i.e. centrally controlling a plurality of machines, e.g. direct or distributed numerical control [DNC], flexible manufacturing systems [FMS], integrated manufacturing systems [IMS] or computer integrated manufacturing [CIM]
- G05B19/41875—Total factory control, i.e. centrally controlling a plurality of machines, e.g. direct or distributed numerical control [DNC], flexible manufacturing systems [FMS], integrated manufacturing systems [IMS] or computer integrated manufacturing [CIM] characterised by quality surveillance of production
-
- G—PHYSICS
- G05—CONTROLLING; REGULATING
- G05B—CONTROL OR REGULATING SYSTEMS IN GENERAL; FUNCTIONAL ELEMENTS OF SUCH SYSTEMS; MONITORING OR TESTING ARRANGEMENTS FOR SUCH SYSTEMS OR ELEMENTS
- G05B23/00—Testing or monitoring of control systems or parts thereof
- G05B23/02—Electric testing or monitoring
- G05B23/0205—Electric testing or monitoring by means of a monitoring system capable of detecting and responding to faults
- G05B23/0218—Electric testing or monitoring by means of a monitoring system capable of detecting and responding to faults characterised by the fault detection method dealing with either existing or incipient faults
- G05B23/0224—Process history based detection method, e.g. whereby history implies the availability of large amounts of data
- G05B23/0227—Qualitative history assessment, whereby the type of data acted upon, e.g. waveforms, images or patterns, is not relevant, e.g. rule based assessment; if-then decisions
- G05B23/0235—Qualitative history assessment, whereby the type of data acted upon, e.g. waveforms, images or patterns, is not relevant, e.g. rule based assessment; if-then decisions based on a comparison with predetermined threshold or range, e.g. "classical methods", carried out during normal operation; threshold adaptation or choice; when or how to compare with the threshold
-
- G—PHYSICS
- G05—CONTROLLING; REGULATING
- G05B—CONTROL OR REGULATING SYSTEMS IN GENERAL; FUNCTIONAL ELEMENTS OF SUCH SYSTEMS; MONITORING OR TESTING ARRANGEMENTS FOR SUCH SYSTEMS OR ELEMENTS
- G05B23/00—Testing or monitoring of control systems or parts thereof
- G05B23/02—Electric testing or monitoring
- G05B23/0205—Electric testing or monitoring by means of a monitoring system capable of detecting and responding to faults
- G05B23/0259—Electric testing or monitoring by means of a monitoring system capable of detecting and responding to faults characterized by the response to fault detection
-
- G—PHYSICS
- G05—CONTROLLING; REGULATING
- G05B—CONTROL OR REGULATING SYSTEMS IN GENERAL; FUNCTIONAL ELEMENTS OF SUCH SYSTEMS; MONITORING OR TESTING ARRANGEMENTS FOR SUCH SYSTEMS OR ELEMENTS
- G05B2219/00—Program-control systems
- G05B2219/30—Nc systems
- G05B2219/31—From computer integrated manufacturing till monitoring
- G05B2219/31088—Network communication between supervisor and cell, machine group
-
- G—PHYSICS
- G05—CONTROLLING; REGULATING
- G05B—CONTROL OR REGULATING SYSTEMS IN GENERAL; FUNCTIONAL ELEMENTS OF SUCH SYSTEMS; MONITORING OR TESTING ARRANGEMENTS FOR SUCH SYSTEMS OR ELEMENTS
- G05B2219/00—Program-control systems
- G05B2219/30—Nc systems
- G05B2219/34—Director, elements to supervisory
- G05B2219/34475—Detect abnormality of control system without inverted model, using input command
Definitions
- the present invention relates to a plant operation data monitoring device and method to monitor operation data from equipment included in a plant and to enable early detection of abnormalities.
- monitoring operation data sent from equipment included in a plant is widely performed to detect abnormality occurring in the equipment at an early stage.
- abnormality is determined by monitoring whether or not operation data and/or estimation data obtained from the operation data deviate from a predetermined threshold value or a predetermined threshold range. Alternatively, abnormality is determined when the physical correlation to be satisfied between operation data is not satisfied.
- a techniques “determination system and method of deterioration state for facilities” disclosed in Japanese Patent No. 06474564 is known as an example of concreate and practical techniques for early detection of abnormality.
- the technique using relation with other operation data as disclosed in Japanese Patent No. 06474564 is an effective technique when the physical correlation between operation data is high.
- operation data has a low physical correlation between operation data (a low degree of physical, engineering relation) and has high independency (low dependency), it is difficult to make determination on abnormality using relation with other operation data. Because of this, there is a need for a technique to determine abnormality or abnormality symptoms only from the operation data itself.
- a plant operation data monitoring device of the present invention comprises: an input section that receives operation data on a plant; and a calculator that includes databases storing the operation data received, and a computing section executing a program.
- the computing section stores the operation data received in a first database of the databases in time series.
- the computing section determines from peak values of the operation data stored whether gradients of the operation data are positive or negative, and then stores the gradients in a second database of the databases for positive gradients or in the second database of the databases for negative gradients in time series.
- the computing section determines threshold values for abnormality determination about each of the positive and negative gradients, divides each of the positive gradients and the negative gradients into normal values and abnormal values, and additionally stores the divided gradients in the second database for the positive gradients or the negative gradients.
- a plant operation data monitoring method of the present invention receives operation data on a plant and monitors abnormality in the plant by using the operation data received.
- the method comprises the steps of: storing the operation data received in time series; determining from peak values of the operation data stored whether gradients of the operation data are positive or negative, and then storing the gradients in time series; determining threshold values for abnormality determination about each of the positive and negative gradients; dividing each of the positive gradients and the negative gradients into normal values and abnormal values; and storing additionally the divided gradients for the positive gradients or the negative gradients.
- FIG. 1 is a block diagram illustrating an example configuration of equipment in a thermal power plant which is a specific example of application of the present invention
- FIG. 2 is a diagram illustrating an example configuration of a typical plant operation data monitoring device
- FIG. 3 is a diagram illustrating an example of changes over time in input operation data
- FIG. 4 is a table illustrating an instance (positive side) of manipulating and storing operation data stored in a database DB;
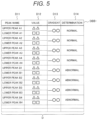
- FIG. 5 is a table illustrating an instance (negative side) of manipulating and storing operation data stored in the database DB;
- FIG. 6 is a diagram illustrating processing details on processing program Pg
- FIG. 7 is a diagram illustrating processing details on determination as to whether storing in a positive gradient database DBB+ or storing in a negative gradient database DBB ⁇ ;
- FIG. 8 is a diagram describing specific processing details of a processing step S 4 in the processing program Pg.
- FIG. 1 illustrates an example configuration of equipment in a thermal power plant which is a specific example of application of a plant operation data monitoring device according to an embodiment of the present invention.
- the thermal power plant illustrated in FIG. 1 includes components roughly grouped into a generator G, a turbine T, and a boiler B, which are called main machinery. Equipment or equipment groups installed for maintaining the functionality of the main machinery is called auxiliaries.
- auxiliaries includes a generator auxiliary GA, a turbine auxiliary TA, and a boiler auxiliary BA, and may include a condenser C and a generator excitation circuit G 1 .
- a typical plant includes a large number of such components.
- attention is directed to operation data on such plant components, and a calculator receives the operation data via a sensor, a communication section, an input section, and others.
- a configuration for this purpose is well-known.
- FIG. 2 is a diagram illustrating an example configuration of a typical plant operation data monitoring device.
- a plant operation data monitoring device 1 configured with a calculator receives plant operation data D from a sensor/sensors (not shown in FIG. 2 ) in plant equipment 2 into the calculator via a communication section or an input section.
- the operation data D in this embodiment may be operation data with a low physical correlation between operation data (a low degree of physical, engineering relation), and thus can be received at any regular intervals irrespective of an interval at which another operation data is received.
- Examples of the operation data with a low physical correlation between operation data (a low degree of physical, engineering relation) and high independency include electrical conductivity of stator cooling water in the generator, concentrations of hydrogen filled in the generator, hydrogen purity, and hydrogen pressure.
- the operation data D is stored in an internal database DB in time series.
- a storage format in an early stage is, as illustrated in a database DBA, to relate at least a data collection time, name of the operation data, and values of the operation data with each other and to store them in time series.
- the calculator 1 also has processing program Pg stored therein.
- the processing program Pg describes processing procedure to handle the received operation data D.
- the received operation data is processed and executed sequentially according to the processing program Pg.
- the operation data stored in time series is processed into operation data to be evaluated based on the gradient and newly stored in a changed storage format.
- FIG. 3 is a diagram illustrating an example of changes over time in the input operation data D.
- the vertical axis represents magnitude of the operation data D
- the horizontal axis represents time.
- FIG. 3 shows an instance where the operation data D starts to increase at times with even numbers t 0 , t 2 , t 4 , . . . , and to decrease at times with odd numbers t 1 , t 3 , t 5 , . . . .
- FIG. 3 shows an instance where the operation data D starts to increase at times with even numbers t 0 , t 2 , t 4 , . . . , and to decrease at times with odd numbers t 1 , t 3 , t 5 , . . . .
- upper and lower peak values at each time are indicated by A 1 to A 4 in the first half (from time t 0 to time t 8 ) and indicated by B 1 to B 4 in the second half (from time t 9 to time t 17 ). It is noted herein that each peak is named for the purpose of classifying all the peaks, such as upper peaks A 1 , A, A 3 and lower peaks A 1 , A, A 3 .
- the operation data D in regard to the operation data D stored in the database DBA in time series, attention is given to the fact that the operation data D alternatively repeats the increase and decrease on time series basis as illustrated in the upper portion of FIG. 3 .
- a change rate of increase/decrease in the operation data D (expressed as a gradient in FIG. 3 ) in each time period is illustrated.
- the period of the first half means a fluctuation period under normal states, in which it is assumed that each of an increase change rate dn 1 and a decrease change rate dn 2 during the normal state period take a predetermined value or a value within a predetermined range.
- the period of the second half means a fluctuation period under abnormal states, in which the increase change rate da 1 and the decrease change rate da 2 during the abnormal state period generally take any values not restricted by normal values.
- the increase change rate da 1 under abnormal states is significantly larger than the increase change rate dn 1 in the normal state period, and as illustrated in the example from t 10 to t 11 , the increase change rate da 1 under abnormal states is significantly smaller than the increase change rate dn 1 in the normal state period.
- FIG. 3 as illustrated in the example from t 8 to t 9 , the increase change rate da 1 under abnormal states is significantly larger than the increase change rate dn 1 in the normal state period, and as illustrated in the example from t 10 to t 11 , the increase change rate da 1 under abnormal states is significantly smaller than the increase change rate dn 1 in the normal state period.
- the decrease change rate da 2 under abnormal states is significantly larger than the decrease change rate dn 2 in the normal state period, and as illustrated in the example from t 9 to t 10 , the decrease change rate da 2 under abnormal states is significantly smaller than the decrease change rate dn 2 in the normal state period.
- the fluctuations of the change rate in each of the increase and decrease directions can be considered to indicate a predictable or analogizable trend of some abnormality in a plant component.
- the time-series operation data D accumulated in the database DBA is evaluated in terms of the gradient and processed and changed to the storage format of the database DBB.
- the processing program Pg is processed at a computing section in the calculator 1 .
- the operation data D is firstly stored, together with information on data collection times, in the database DBA of the database DB in the calculator 1 illustrated in FIG. 2 .
- the storage information after the process in a processing step S 1 includes information on the gradient of the operation data D. If necessary, after the gradient of the operation data D is evaluated, the operation data under normal states and the operation data under abnormal states are divided for classifications or storage areas. Then, the storage information is processed, organized, and stored.
- FIG. 4 and FIG. 5 illustrate instances where the operation data D stored in the database DBB is processed and stored.
- FIG. 4 and FIG. 5 depict that the operation data D of interest is divided into a data group with positive gradients (the increase change rates da 1 and dn 1 ) and a data group with negative gradients (the decrease change rates da 2 and dn 2 ), which are stored in separate areas of the database DB.
- the stored data includes a peak name D 11 , an operation data value D 12 , a gradient D 13 , and a determination result (distinction between abnormality and normality) D 14 .
- These data pieces may include time information.
- alternate repetition of consecutive local maximum and minimum values of the operation data D is detected by using the time series of one piece of the operation data which has been of interest in the processing step S 1 .
- times at which the upper and lower peaks (local maximum and minimum values) are reached values of the upper and lower peaks, and gradients in the increase and decrease directions between the upper and lower peaks are sequentially calculated and stored.
- each combination of consecutive upper and lower peak values are sequentially called one by one.
- a gradient is calculated from the time duration and a difference between the peak values for each combination.
- it is determined whether the gradient currently calculated is under normal states or under abnormal states by using a number of data about gradients previously calculated and threshold values derived from the gradient data, and then each gradient is labeled with the determination result.
- the gradient data labeled with the determination result is stored in a positive gradient database DBB+ illustrated in FIG. 4 if the gradient is positive.
- the gradient data labeled with the determination result is stored in a negative gradient database DBB ⁇ illustrated in FIG. 5 if the gradient is negative.
- the above processing is sequentially performed on each combination of all the consecutive local maximum and minimum values of the specific operation data and other operation data.
- the database DBB is successively expanded and created to store the gradient data after the processing as illustrated in FIG. 4 and FIG. 5 .
- FIG. 7 illustrates an example of a configuration of a processing portion in the processing program Pg to determine whether to store the gradient data in the positive gradient database DBB+ or in the negative gradient database DBB ⁇ .
- the processing determines whether the combination of consecutive upper and lower peak values is a combination in the order of the upper peak and then the lower peak or in the inverse order of the lower peak and then the upper peak.
- the combination in the order of the upper peak and then the lower peak is stored in the negative gradient database DBB ⁇ , and the other combination is stored in the positive gradient database DBB+.
- FIG. 8 describes specific processing details of the processing step S 4 in the processing program Pg.
- setting is performed of a threshold value to identify a normal value and an abnormal value. It is noted that there are other possible approaches to setting the threshold value. This embodiment describes one such example.
- processing step 21 data on peak names D 11 , operation data values D 12 , and gradients D 13 are created in a peak value table in FIG. 4 and FIG. 5 , but a determination result (distinction between abnormality and normality) D 14 on each individual peak value is not stored in the table.
- the positive gradient peak values in FIG. 4 are of interest. It is noted that after the completion of the series of these processing steps, the negative gradient peak values in FIG. 5 are of interest.
- a gradient indicating a value deviating from a mean value of the multiple gradients included in the positive gradient peak values in FIG. 4 attention is given, for example, to a gradient indicating a value deviating from a mean value of the multiple gradients included in the positive gradient peak values in FIG. 4 .
- a gradient indicating an about 20% or more larger value and a gradient indicating an about 20% smaller value are determined to indicate an undoubted abnormal value, so that ⁇ 20% with reference to the mean value is set as a threshold value for abnormality determination.
- a variety of probability theories and/or statistical approaches can be used for the threshold decision.
- a threshold value may be set relative to a standard deviation ⁇ , and four times the standard deviation ⁇ may be taken and ⁇ 4 ⁇ may be set to a threshold value for abnormality determination.
- a threshold value can be set for identifying a normal value from a data group including normality data without abnormality data.
- the threshold value may be derived from the undoubted abnormality data. It is noted that abnormality occurrence in plant data, which can momentarily vary to a large extent, often shows a symptom trend of progress in the level of abnormality with time in general. Considering that the symptom trend is shown, the threshold values may be preferably set in multiple stages rather than a single stage so that symptom stages up to abnormality are visible.
- the values dn 1 , dn 2 under normal states and the values da 1 , da 2 under abnormal states are denoted. It is also shown that the threshold values for identifying the values da 1 , da 2 under abnormal states are set as threshold values of three stages for each of the upper limit and the lower limit of the gradients for each of positive and negative gradients. Therefore, when a temporal trend is shown and confirmed that, after the gradient of the operation data exceeds a first stage threshold value, the gradient of the operation data exceeds a second stage threshold value larger than the first stage threshold value, abnormality is progressing in this situation and abnormality symptoms can be grasped.
- a processing step S 23 gradient data on which a normality/abnormality determination flag D 14 is not set is evaluated based on the set threshold values.
- a processing step S 24 in particular, the data determined to be abnormal is labeled with abnormality or abnormality prediction stage, and the database illustrated in FIG. 4 and FIG. 5 is constructed. Subsequently, similar processing is performed on the negative gradient peak values in FIG. 5 .
- a database is created for each of positive gradient and negative gradient.
- individually different threshold values are determined for each of the positive gradient and the negative gradient and thus abnormalities and/or abnormality symptom levels are determined to perform data classification. It is noted that accuracy of setting the threshold values for abnormality/normality is higher as the number of samples is increasing. Because of this reason, it is preferred that the processing in FIG. 8 is repeatedly performed at appropriate intervals.
- the operation data is the electric conductivity of stator cooling water of the generator
- the case where the positive gradient goes beyond a lower limit and the case where the negative gradient goes beyond an upper limit can be independently monitored.
- the gradient of the electric conductivity goes beyond the lower limit are considered as deterioration of ion exchanger resin, clogging of a line passing through ion exchanger resin, ionization of a flashing component of a stator cooling line, and so on.
- the operation data is the degree of purity of hydrogen gas filled in the generator
- the positive gradient goes beyond the lower limit
- two (upper and lower limits) threshold values are set for each of the positive gradient and the negative gradient
- the positive gradient goes beyond the lower limit
- the positive gradient goes beyond the upper limit, there is a possibility of abnormal states in which heat of a heater in the hydrogen gas dryer and/or wind from a blower are excessively produced as compared to a normal state.
- this technology will contribute to determining the cause of occurrence of abnormality symptoms.
- upper and lower limit peak values are detected from the operation data on a plant component, a (positive/negative) gradient of the upper and lower limit peak values is calculated, and the gradient is monitored over time, thereby enabling performance of highly reliable detection of equipment deterioration and/or abnormality symptoms and/or abnormalities. As a result, it can be expected to be useful in increasing the reliability of plant components and preventive maintenance of plant components.
- performing the abnormality determination separately for each of the positive gradient and the negative gradient enables setting of an appropriate threshold values for each of the positive gradient and the negative gradient.
- an upper limit and a lower limit for the positive gradient and an upper limit and a lower limit for the negative gradient can be set.
- multiple stages may be provided for each of the upper and lower limits.
- the upper limits and the lower limits can be used to detect different abnormality symptoms and/or abnormalities from each other. For example, when a gradient is positive, the lower limits can be used to detect an event different from abnormality symptoms and/or abnormalities which can be detected based on the upper limits.
Landscapes
- Engineering & Computer Science (AREA)
- Physics & Mathematics (AREA)
- General Physics & Mathematics (AREA)
- Automation & Control Theory (AREA)
- General Engineering & Computer Science (AREA)
- Manufacturing & Machinery (AREA)
- Quality & Reliability (AREA)
- Testing And Monitoring For Control Systems (AREA)
Abstract
Description
-
- 1 . . . Plant operation data monitoring device (calculator)
- 2 . . . Plant equipment
- G . . . Generator
- T . . . Turbine
- B . . . Boiler
- GA . . . Generator auxiliary
- TA . . . Turbine auxiliary
- BA . . . Boiler auxiliary
- C . . . Condenser
- G1 . . . Generator excitation circuit
Claims (9)
Applications Claiming Priority (3)
| Application Number | Priority Date | Filing Date | Title |
|---|---|---|---|
| JP2020-053787 | 2020-03-25 | ||
| JPJP2020-053787 | 2020-03-25 | ||
| JP2020053787A JP7454419B2 (en) | 2020-03-25 | 2020-03-25 | Plant operation data monitoring device and method |
Publications (2)
| Publication Number | Publication Date |
|---|---|
| US20210302948A1 US20210302948A1 (en) | 2021-09-30 |
| US11650577B2 true US11650577B2 (en) | 2023-05-16 |
Family
ID=73855936
Family Applications (1)
| Application Number | Title | Priority Date | Filing Date |
|---|---|---|---|
| US17/132,311 Active US11650577B2 (en) | 2020-03-25 | 2020-12-23 | Plant operation data monitoring device and method |
Country Status (5)
| Country | Link |
|---|---|
| US (1) | US11650577B2 (en) |
| EP (1) | EP3885863B1 (en) |
| JP (1) | JP7454419B2 (en) |
| CN (1) | CN113515094B (en) |
| PL (1) | PL3885863T3 (en) |
Citations (14)
| Publication number | Priority date | Publication date | Assignee | Title |
|---|---|---|---|---|
| JPH0620173A (en) | 1991-08-23 | 1994-01-28 | Hitachi Ltd | Process information display system |
| US20030095709A1 (en) * | 2001-11-09 | 2003-05-22 | Lingxiang Zhou | Multiple image area detection in a digital image |
| JP2009180722A (en) | 2008-01-30 | 2009-08-13 | Takayoshi Yamamoto | Support method for optimal maintenance time determination of object facility, computer program, and support device for optimal maintenance time determination of object facility |
| US20140137024A1 (en) * | 2012-11-13 | 2014-05-15 | Peter M. Curtis | Facility operations management and mobile systems |
| US20140136293A1 (en) * | 2012-11-09 | 2014-05-15 | Raghuraman Ramakrishnan | Relative trend analysis of scenarios |
| US20180004193A1 (en) * | 2015-01-24 | 2018-01-04 | Abb Schweiz Ag | A method for controlling a process plant using transition data |
| US9933338B2 (en) * | 2013-11-01 | 2018-04-03 | Hitachi Power Solutions Co., Ltd. | Health management system, fault diagnosis system, health management method, and fault diagnosis method |
| US20180196639A1 (en) * | 2017-01-11 | 2018-07-12 | Yokogawa Electric Corporation | Data processing device, data processing method, and storage medium |
| US20190026351A1 (en) * | 2016-01-08 | 2019-01-24 | Entit Sofware Llc | Time series trends |
| JP6474564B2 (en) | 2014-08-25 | 2019-02-27 | 東日本旅客鉄道株式会社 | Equipment degradation state judgment system and equipment degradation state judgment method |
| US20190197917A1 (en) | 2016-10-14 | 2019-06-27 | Mitsubishi Hitachi Power Systems, Ltd. | Guidance information presentation system, guidance information presentation method, program, and guidance information presentation device |
| WO2019177234A1 (en) | 2018-03-14 | 2019-09-19 | 주식회사 아이티공간 | Precise predictive maintenance method for driving unit |
| US20190384275A1 (en) | 2016-12-28 | 2019-12-19 | Mitsubishi Hitachi Power Systems, Ltd. | Diagnostic device, diagnostic method, and program |
| US20200019150A1 (en) | 2016-12-28 | 2020-01-16 | Mitsubishi Hitachi Power Systems, Ltd. | Collection device, collection method, program, and collection system |
Family Cites Families (15)
| Publication number | Priority date | Publication date | Assignee | Title |
|---|---|---|---|---|
| JPS6474564A (en) | 1987-09-16 | 1989-03-20 | Toshiba Corp | Image forming device |
| JPH08220278A (en) * | 1995-02-10 | 1996-08-30 | Toshiba Eng Co Ltd | Plant monitoring device and monitoring method |
| JP4483111B2 (en) * | 2001-03-21 | 2010-06-16 | 株式会社Ihi | Plant operation monitoring apparatus and method |
| JP2007286904A (en) * | 2006-04-17 | 2007-11-01 | Fanuc Ltd | Controller and control method for motor |
| JP4824518B2 (en) * | 2006-10-05 | 2011-11-30 | 株式会社日立製作所 | Gas turbine performance diagnostic system, diagnostic method and display screen |
| JP5485939B2 (en) * | 2011-05-18 | 2014-05-07 | 日立Geニュークリア・エナジー株式会社 | Apparatus abnormality determination device and apparatus abnormality determination method |
| JP5861425B2 (en) * | 2011-12-07 | 2016-02-16 | 富士ゼロックス株式会社 | Fault detection system, fault detection apparatus and program |
| JP6135192B2 (en) * | 2013-03-01 | 2017-05-31 | 株式会社明電舎 | Time series data abnormality monitoring apparatus, abnormality monitoring method and program |
| CN103646167B (en) * | 2013-11-22 | 2017-03-15 | 北京空间飞行器总体设计部 | A kind of satellite abnormal state detection system based on telemetry |
| CN104574848B (en) * | 2015-01-14 | 2017-09-12 | 深圳市欧瑞博电子有限公司 | A kind of alarm method of gas alarm device |
| JP6995493B2 (en) | 2017-04-28 | 2022-01-14 | 横河電機株式会社 | Data processing equipment, data processing systems, data processing methods and programs |
| JP6794919B2 (en) * | 2017-04-28 | 2020-12-02 | 横河電機株式会社 | Process control system and data processing method |
| JP7010641B2 (en) * | 2017-09-27 | 2022-01-26 | パナソニック インテレクチュアル プロパティ コーポレーション オブ アメリカ | Abnormality diagnosis method and abnormality diagnosis device |
| CN108376299A (en) * | 2018-02-27 | 2018-08-07 | 深圳市智物联网络有限公司 | A kind of prediction technique and device of running trend of the equipment |
| CN109634801B (en) * | 2018-10-31 | 2022-04-12 | 深圳壹账通智能科技有限公司 | Data trend analysis method, system, computer device and readable storage medium |
-
2020
- 2020-03-25 JP JP2020053787A patent/JP7454419B2/en active Active
- 2020-12-18 PL PL20215712.9T patent/PL3885863T3/en unknown
- 2020-12-18 EP EP20215712.9A patent/EP3885863B1/en active Active
- 2020-12-23 US US17/132,311 patent/US11650577B2/en active Active
-
2021
- 2021-01-29 CN CN202110129549.0A patent/CN113515094B/en active Active
Patent Citations (15)
| Publication number | Priority date | Publication date | Assignee | Title |
|---|---|---|---|---|
| JPH0620173A (en) | 1991-08-23 | 1994-01-28 | Hitachi Ltd | Process information display system |
| US20030095709A1 (en) * | 2001-11-09 | 2003-05-22 | Lingxiang Zhou | Multiple image area detection in a digital image |
| JP2009180722A (en) | 2008-01-30 | 2009-08-13 | Takayoshi Yamamoto | Support method for optimal maintenance time determination of object facility, computer program, and support device for optimal maintenance time determination of object facility |
| US20140136293A1 (en) * | 2012-11-09 | 2014-05-15 | Raghuraman Ramakrishnan | Relative trend analysis of scenarios |
| US20140137024A1 (en) * | 2012-11-13 | 2014-05-15 | Peter M. Curtis | Facility operations management and mobile systems |
| US9933338B2 (en) * | 2013-11-01 | 2018-04-03 | Hitachi Power Solutions Co., Ltd. | Health management system, fault diagnosis system, health management method, and fault diagnosis method |
| JP6474564B2 (en) | 2014-08-25 | 2019-02-27 | 東日本旅客鉄道株式会社 | Equipment degradation state judgment system and equipment degradation state judgment method |
| US20180004193A1 (en) * | 2015-01-24 | 2018-01-04 | Abb Schweiz Ag | A method for controlling a process plant using transition data |
| US20190026351A1 (en) * | 2016-01-08 | 2019-01-24 | Entit Sofware Llc | Time series trends |
| US20190197917A1 (en) | 2016-10-14 | 2019-06-27 | Mitsubishi Hitachi Power Systems, Ltd. | Guidance information presentation system, guidance information presentation method, program, and guidance information presentation device |
| US20190384275A1 (en) | 2016-12-28 | 2019-12-19 | Mitsubishi Hitachi Power Systems, Ltd. | Diagnostic device, diagnostic method, and program |
| US20200019150A1 (en) | 2016-12-28 | 2020-01-16 | Mitsubishi Hitachi Power Systems, Ltd. | Collection device, collection method, program, and collection system |
| US20180196639A1 (en) * | 2017-01-11 | 2018-07-12 | Yokogawa Electric Corporation | Data processing device, data processing method, and storage medium |
| WO2019177234A1 (en) | 2018-03-14 | 2019-09-19 | 주식회사 아이티공간 | Precise predictive maintenance method for driving unit |
| US20200410846A1 (en) * | 2018-03-14 | 2020-12-31 | Its Co., Ltd. | Precise predictive maintenance method for driving unit |
Non-Patent Citations (2)
| Title |
|---|
| Extended European Search Report dated May 27, 2021 for European Patent Application No. 20215712.9. |
| Japanese Office Action dated Dec. 27, 2022 for the Japanese Patent Application No. 2020-053787. |
Also Published As
| Publication number | Publication date |
|---|---|
| JP7454419B2 (en) | 2024-03-22 |
| EP3885863A1 (en) | 2021-09-29 |
| PL3885863T3 (en) | 2025-01-13 |
| EP3885863B1 (en) | 2024-09-11 |
| CN113515094B (en) | 2025-01-17 |
| US20210302948A1 (en) | 2021-09-30 |
| JP2021157211A (en) | 2021-10-07 |
| CN113515094A (en) | 2021-10-19 |
Similar Documents
| Publication | Publication Date | Title |
|---|---|---|
| US10115298B2 (en) | Method of trend analysis and automatic tuning of alarm parameters | |
| EP3399376B1 (en) | Plant-abnormality-monitoring method and computer program for plant abnormality monitoring | |
| JP2011090382A (en) | Monitoring system | |
| RU2724455C1 (en) | Diagnostic equipment of deterioration characteristics due to aging and diagnostics method of deterioration due to aging | |
| CN112017409A (en) | Trend early warning method for short-time increase amplitude of mechanical equipment vibration | |
| CN117394337A (en) | A power grid load early warning method and its system | |
| JP2012018623A (en) | Abnormal data analysis system | |
| US11709486B2 (en) | Fault signal recovery system and method | |
| JP5336947B2 (en) | Batch type manufacturing process monitoring method and monitoring apparatus | |
| CN118889700A (en) | An operation status supervision system based on power monitoring | |
| WO2023184237A1 (en) | Method and apparatus for calculating remaining useful life of electronic system, and computer medium | |
| US11650577B2 (en) | Plant operation data monitoring device and method | |
| CN109829245B (en) | Bearing fault early warning method and device | |
| CN110163451B (en) | Health degree prediction method and system for heating and ventilation system and computer readable storage medium | |
| CN115985072A (en) | Wind turbine cabin temperature monitoring and early warning method and system based on machine learning | |
| CN109581125B (en) | Method and device for detecting service life of power module of wind power converter and storage medium | |
| CN117150211A (en) | A method for condition assessment of wind turbine box-type transformers based on heat map distribution | |
| CN115982578A (en) | Fault location method, device, electronic equipment and storage medium | |
| CN113624025A (en) | A method for capturing the symptoms of condenser vacuum low tripping based on the correlation of operating parameters | |
| CN117849692B (en) | A method and system for monitoring abnormal phase sequence of a secondary circuit of a transformer in a substation | |
| CN105353233A (en) | Method and device of on-line operation capability detection of transformer | |
| TWI863352B (en) | Method of abnormal signal processing and machine learning prediction based on abnormal sign accumulation threshold | |
| CN119596101B (en) | Integrated circuit chip test system, method, device and medium | |
| CN119593962A (en) | Main transformer cooling system fault alarm threshold value calculation and alarm method and system | |
| CN120145262A (en) | A complex electromechanical system fault intelligent prediction system and method |
Legal Events
| Date | Code | Title | Description |
|---|---|---|---|
| AS | Assignment |
Owner name: MITSUBISHI POWER, LTD., JAPAN Free format text: ASSIGNMENT OF ASSIGNORS INTEREST;ASSIGNORS:KURIHARA, TAMAMI;IWASHIGE, KENGO;KAKIMOTO, TADAAKI;AND OTHERS;REEL/FRAME:054739/0280 Effective date: 20201204 |
|
| FEPP | Fee payment procedure |
Free format text: ENTITY STATUS SET TO UNDISCOUNTED (ORIGINAL EVENT CODE: BIG.); ENTITY STATUS OF PATENT OWNER: LARGE ENTITY |
|
| STPP | Information on status: patent application and granting procedure in general |
Free format text: DOCKETED NEW CASE - READY FOR EXAMINATION |
|
| STPP | Information on status: patent application and granting procedure in general |
Free format text: NON FINAL ACTION MAILED |
|
| STPP | Information on status: patent application and granting procedure in general |
Free format text: RESPONSE TO NON-FINAL OFFICE ACTION ENTERED AND FORWARDED TO EXAMINER |
|
| AS | Assignment |
Owner name: MITSUBISHI HEAVY INDUSTRIES, LTD., JAPAN Free format text: ASSIGNMENT OF ASSIGNORS INTEREST;ASSIGNOR:MITSUBISHI POWER, LTD.;REEL/FRAME:059254/0646 Effective date: 20220301 |
|
| STPP | Information on status: patent application and granting procedure in general |
Free format text: FINAL REJECTION MAILED |
|
| STPP | Information on status: patent application and granting procedure in general |
Free format text: DOCKETED NEW CASE - READY FOR EXAMINATION |
|
| STCF | Information on status: patent grant |
Free format text: PATENTED CASE |
|
| AS | Assignment |
Owner name: MITSUBISHI GENERATOR CO., LTD., JAPAN Free format text: NUNC PRO TUNC ASSIGNMENT;ASSIGNOR:MITSUBISHI HEAVY INDUSTRIES, LTD.;REEL/FRAME:069438/0941 Effective date: 20241009 |