US11598792B2 - Voltage indicators - Google Patents
Voltage indicators Download PDFInfo
- Publication number
- US11598792B2 US11598792B2 US16/872,188 US202016872188A US11598792B2 US 11598792 B2 US11598792 B2 US 11598792B2 US 202016872188 A US202016872188 A US 202016872188A US 11598792 B2 US11598792 B2 US 11598792B2
- Authority
- US
- United States
- Prior art keywords
- voltage
- fluorescence
- voltron
- neurons
- imaging
- Prior art date
- Legal status (The legal status is an assumption and is not a legal conclusion. Google has not performed a legal analysis and makes no representation as to the accuracy of the status listed.)
- Active, expires
Links
Images


Classifications
-
- C—CHEMISTRY; METALLURGY
- C12—BIOCHEMISTRY; BEER; SPIRITS; WINE; VINEGAR; MICROBIOLOGY; ENZYMOLOGY; MUTATION OR GENETIC ENGINEERING
- C12Y—ENZYMES
- C12Y308/00—Hydrolases acting on halide bonds (3.8)
- C12Y308/01—Hydrolases acting on halide bonds (3.8) in C-halide substances (3.8.1)
- C12Y308/01005—Haloalkane dehalogenase (3.8.1.5)
-
- G—PHYSICS
- G01—MEASURING; TESTING
- G01R—MEASURING ELECTRIC VARIABLES; MEASURING MAGNETIC VARIABLES
- G01R15/00—Details of measuring arrangements of the types provided for in groups G01R17/00 - G01R29/00, G01R33/00 - G01R33/26 or G01R35/00
- G01R15/14—Adaptations providing voltage or current isolation, e.g. for high-voltage or high-current networks
- G01R15/22—Adaptations providing voltage or current isolation, e.g. for high-voltage or high-current networks using light-emitting devices, e.g. LED, optocouplers
-
- G—PHYSICS
- G01—MEASURING; TESTING
- G01R—MEASURING ELECTRIC VARIABLES; MEASURING MAGNETIC VARIABLES
- G01R19/00—Arrangements for measuring currents or voltages or for indicating presence or sign thereof
- G01R19/0084—Measuring voltage only
-
- C—CHEMISTRY; METALLURGY
- C07—ORGANIC CHEMISTRY
- C07K—PEPTIDES
- C07K14/00—Peptides having more than 20 amino acids; Gastrins; Somatostatins; Melanotropins; Derivatives thereof
- C07K14/195—Peptides having more than 20 amino acids; Gastrins; Somatostatins; Melanotropins; Derivatives thereof from bacteria
-
- C—CHEMISTRY; METALLURGY
- C07—ORGANIC CHEMISTRY
- C07K—PEPTIDES
- C07K14/00—Peptides having more than 20 amino acids; Gastrins; Somatostatins; Melanotropins; Derivatives thereof
- C07K14/435—Peptides having more than 20 amino acids; Gastrins; Somatostatins; Melanotropins; Derivatives thereof from animals; from humans
- C07K14/43504—Peptides having more than 20 amino acids; Gastrins; Somatostatins; Melanotropins; Derivatives thereof from animals; from humans from invertebrates
-
- C—CHEMISTRY; METALLURGY
- C07—ORGANIC CHEMISTRY
- C07K—PEPTIDES
- C07K2319/00—Fusion polypeptide
- C07K2319/01—Fusion polypeptide containing a localisation/targetting motif
- C07K2319/03—Fusion polypeptide containing a localisation/targetting motif containing a transmembrane segment
-
- C—CHEMISTRY; METALLURGY
- C07—ORGANIC CHEMISTRY
- C07K—PEPTIDES
- C07K2319/00—Fusion polypeptide
- C07K2319/33—Fusion polypeptide fusions for targeting to specific cell types, e.g. tissue specific targeting, targeting of a bacterial subspecies
-
- C—CHEMISTRY; METALLURGY
- C07—ORGANIC CHEMISTRY
- C07K—PEPTIDES
- C07K2319/00—Fusion polypeptide
- C07K2319/60—Fusion polypeptide containing spectroscopic/fluorescent detection, e.g. green fluorescent protein [GFP]
-
- C—CHEMISTRY; METALLURGY
- C07—ORGANIC CHEMISTRY
- C07K—PEPTIDES
- C07K2319/00—Fusion polypeptide
- C07K2319/61—Fusion polypeptide containing an enzyme fusion for detection (lacZ, luciferase)
-
- G—PHYSICS
- G01—MEASURING; TESTING
- G01N—INVESTIGATING OR ANALYSING MATERIALS BY DETERMINING THEIR CHEMICAL OR PHYSICAL PROPERTIES
- G01N21/00—Investigating or analysing materials by the use of optical means, i.e. using sub-millimetre waves, infrared, visible or ultraviolet light
- G01N21/62—Systems in which the material investigated is excited whereby it emits light or causes a change in wavelength of the incident light
- G01N21/63—Systems in which the material investigated is excited whereby it emits light or causes a change in wavelength of the incident light optically excited
- G01N21/64—Fluorescence; Phosphorescence
- G01N21/6486—Measuring fluorescence of biological material, e.g. DNA, RNA, cells
Definitions
- the presently-disclosed subject matter generally relates to voltage indicators and methods of use thereof. More specifically, the presently-disclosed subject matter relates to chemigenetic voltage indicators and methods of measuring voltage using chemigenetic voltage.
- GEVIs genetically encoded fluorescent voltage indicators
- Voltage imaging using genetically encoded voltage indicators can overcome these challenges, enabling imaging of fast spikes and subthreshold dynamics in genetically defined neurons (4, 5).
- Extant GEVIs rely on fluorescence from either microbial rhodopsins (6-8, 19) or fluorescent proteins (FPs) (9-13). These fluorophores lack the brightness and photostability to allow in vivo voltage imaging from large fields of view over timescales of many behavioral events, precluding the millisecond-timescale interrogation of neural circuits. Although the intrinsic fluorescence from rhodopsin domains is low, making them difficult to image, it has been possible to attach bright fluorophores, such as fluorescent proteins or rhodamine dyes, to rhodopsin domains to facilitate imaging (10, 11, 18).
- eFRET electrochromic fluorescence resonance energy transfer
- Upward-going fluorescence signals can be advantageous in microscopic imaging because, for example, background fluorescence from non-responsive regions is low and signals stand out above the background, increasing signal-to-noise, and, for another example, the fluorophore spends more time in the low-fluorescence state, which can decrease photobleaching.
- GEVIs electrochromic fluorescence resonance energy transfer (eFRET) genetically encoded voltage indicator
- JF Janelia Fluor®
- Voltron chemigenetic GEVI scaffold, referred to herein as “Voltron,” which incorporates such synthetic fluorophore dyes. Voltron provides an increased photon yield that enables in vivo imaging of neuronal spiking and sub-threshold voltage signals in model organisms with order-of-magnitude improvement in the number of neurons imaged simultaneously over substantially longer durations.
- the presently-disclosed subject matter includes a voltage indicator including a polypeptide sequence comprising a voltage-sensitive opsin domain including one, two, three, or four amino acid mutations relative to a wild type polypeptide sequence, and a capture protein domain arranged and disposed to capture a fluorescent dye ligand.
- a voltage indicator including a polypeptide sequence comprising a voltage-sensitive opsin domain including one, two, three, or four amino acid mutations relative to a wild type polypeptide sequence, and a capture protein domain arranged and disposed to capture a fluorescent dye ligand.
- the voltage-sensitive opsin domain is a microbial opsin domain. In some embodiments, the voltage-sensitive opsin domain is a microbial rhodopsin domain. In some embodiments, the microbial rhodopsin domain is selected from the group consisting of QuarsAr1, QuarsAr2, Ace2N, and combinations thereof.
- the voltage-sensitive opsin domain is Ace2N including an amino acid mutation at one or more of residue 81, 92, and 199.
- the voltage-sensitive opsin domain comprises the polypeptide of SEQ ID NO: 9, 15, 16, or 17, having one, two, three, or four amino acid mutations.
- the voltage-sensitive opsin domain comprises the amino acid sequence of SEQ ID NO: 9 having an amino acid mutation at one or more of residue 81, 92, and 199.
- the voltage indicator comprises an amino acid sequence selected from the group of amino acid sequences of SEQ ID NOS: 2, 4, 6, 8, 20, 22, 24, and 26.
- the voltage indicator comprises an amino acid sequence encoded by a nucleotide sequence selected from the group of nucleotide sequences of SEQ ID NOS: 1, 3, 5, 7, 19, 21, 23, and 25.
- the capture protein is a non-covalent capture protein.
- the non-covalent capture protein is selected from the group consisting of TMP-tag®, biotin-avidin, and a combination thereof.
- the capture protein domain is a self-labeling protein tag.
- the capture protein domain is selected from a HaloTag® and a SNAP-Tag®.
- the capture protein is a covalent capture protein selected from the group consisting of HaloTag®, SNAP-tag®, TMP-tag®, ⁇ Lac-tag, CLIP-tag®, or a combination thereof.
- the capture protein domain comprises an amino acid sequence selected from the amino acid sequence of SEQ ID NOS: 10 and 11. In some embodiments, 1, 2, 3, 4, 5, 6, 7, 8, 9, or 10 amino acids are removed from the junction between the opsin domain and the capture protein.
- the voltage indicator also includes a targeting sequence.
- the targeting sequence is a soma targeting sequence.
- the targeting sequence comprises the amino acid sequence of SEQ ID NO: 12.
- the voltage-sensitive domain and the capture protein are provided as a fusion protein.
- the capture protein is positioned at the c-terminal end of the voltage-sensitive domain.
- the fluorescent dye ligand is an azetidine-containing dye.
- the fluorescent dye ligand can be a Janelia FluorTM dye, such as, for example, Janelia FluorTM 505 , Janelia FluorTM 525 , Janelia FluorTM 549 , Janelia FluorTM 585 , Janelia FluorTM 646 , and combinations thereof.
- the fluorescent dye ligand is a fluorescent protein.
- the fluorescent dye ligand can be a florescent protein such as sfGFP or mNeonGreen.
- the presently-disclosed subject matter includes a method of measuring voltage, which involves administering or contacting the voltage indicator as described herein and determining changes in fluorescence of the fluorescent dye ligand.
- the indicator can be contacted with a cell, such as, for example, a neuron.
- a cell such as, for example, a neuron.
- the increase in voltage is a spike in voltage or a subthreshold voltage signal.
- the response time between the increase in voltage and the increase in fluorescent emission is less than about a millisecond. In some embodiments, the response time between the increase in voltage and the increase in fluorescent emission is less than about a millisecond.
- the changes in fluorescence are observed with a microscope.
- the voltage indicator further comprises a linker between the voltage-sensitive domain and the capture protein domain, and the method further involves modifying a length of the linker.
- modifying the length of the linker includes removing at least one amino acid residue. In some embodiments, between 1 and 22 amino acid residues are removed.
- modifying the length of the linker modifies the size of a fluorescence response.
- the method also includes determining changes in voltage based upon changes in fluorescence. In some embodiments, an increase in membrane potential leads to an increase in fluorescence.
- SEQ ID NO: 1 is the nucleotide sequence encoding an exemplary voltage indicator according to the presently-disclosed subject matter.
- SEQ ID NO: 2 is the polypeptide sequence an exemplary voltage indicator according to the presently-disclosed subject matter.
- SEQ ID NO: 5 is the nucleotide sequence encoding an exemplary voltage indicator according to the presently-disclosed subject matter.
- SEQ ID NO: 6 is the polypeptide sequence of an exemplary voltage indicator according to the presently-disclosed subject matter.
- SEQ ID NO: 8 is the polypeptide sequence of an exemplary voltage indicator according to the presently-disclosed subject matter.
- SEQ ID NO: 11 is the polypeptide sequence of an exemplary capture protein domain according to the presently-disclosed subject matter.
- SEQ ID NO: 13 is the polypeptide sequence of an exemplary targeting sequence according to the presently-disclosed subject matter.
- SEQ ID NO: 14 is the polypeptide sequence of an exemplary targeting sequence according to the presently-disclosed subject matter.
- SEQ ID NO: 15 is the polypeptide sequence of an exemplary voltage-sensitive domain according to the presently-disclosed subject matter.
- SEQ ID NO: 16 is the polypeptide sequence of an exemplary voltage-sensitive domain according to the presently-disclosed subject matter.
- SEQ ID NO: 17 is the polypeptide sequence of an exemplary voltage-sensitive domain according to the presently-disclosed subject matter.
- SEQ ID NO: 18 is the polypeptide sequence of an exemplary capture protein domain according to the presently-disclosed subject matter.
- SEQ ID NO: 19 is the nucleotide sequence as set forth in FIG. 4 .
- SEQ ID NO: 20 is the polypeptide sequence as set forth in FIG. 4 .
- SEQ ID NO: 25 is the first nucleotide sequence as set forth in FIG. 12 .
- SEQ ID NO: 26 is the first polypeptide sequence as set forth in FIG. 12 .
- SEQ ID NO: 27 is the second nucleotide sequence as set forth in FIG. 12 .
- SEQ ID NO: 29 is the third nucleotide sequence as set forth in FIG. 12 .
- SEQ ID NO: 30 is the third polypeptide sequence as set forth in FIG. 12 .
- SEQ ID NO: 31 is the fourth nucleotide sequence as set forth in FIG. 12 .
- SEQ ID NO: 36 is the sixth polypeptide sequence as set forth in FIG. 12 .
- SEQ ID NO: 37 is the seventh nucleotide sequence as set forth in FIG. 12 .
- SEQ ID NO: 39 is the eighth nucleotide sequence as set forth in FIG. 12 .
- SEQ ID NO: 40 is the eighth polypeptide sequence as set forth in FIG. 12
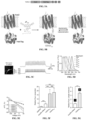
- FIGS. 1 A- 1 D includes fluorescence response (top) and membrane potential changes in neutrons (bottom) for GEVIs including Voltron ( FIG. 1 A ), Voltron D92N ( FIG. 1 B ), Voltron N81D D92N ( FIG. 1 C ), and Voltron N81D D92N E199V ( FIG. 1 D ).
- FIG. 2 includes fluorescence versus voltage in neurons for Voltron and Voltron N81D D92N E199V.
- FIG. 4 includes a nucleotide sequence (SEQ ID NO: 19) and amino acid sequence (SEQ ID NO: 20) of “Voltron,” an exemplary rhodopsin electrochromic fluorescence resonance energy transfer (eFRET) genetically encoded voltage indicators (GEVIs), with sequence features annotated.
- eFRET electrochromic fluorescence resonance energy transfer
- GEVIs genetically encoded voltage indicators
- FIGS. 5 A- 5 K are related to development of the chemigenetic voltage indicator Voltron.
- FIG. 5 A Schematic of Voltron sequence: A rhodopsin (Ace2) is fused to a self-labeling tag domain (HaloTag) with additional sequences added to improve or localize membrane targeting: endoplasmic reticulum export sequence (ER), Golgi export trafficking sequence (TS), and somatic targeting sequence (ST).
- FIG. 5 B Model of Voltron mechanism.
- the HaloTag domain of the transmembrane Voltron protein grey cylinders
- FIG. 5 C Left panel: cultured rat hippocampal neuron expressing Voltron and labeled with JF525. Scale bar: 20 ⁇ m. Right panel: single-trial recording of action potentials and subthreshold voltage signals from current injections in primary neuron culture using imaging (top, fluorescence) or electrophysiology (bottom, membrane potential).
- FIG. 5 D Fluorescence emission spectra of different JF dyes overlaid with the absorbance spectrum of Ace2N.
- FIG. 5 E Fluorescence change as a function of membrane voltage with different JF dye-Voltron conjugates.
- FIG. 5 H Bleaching curves for ASAP2f, Ace2N-mNeon, Voltron 525 , and Voltron 549 in primary neuron culture. Illumination intensity ⁇ 23 mW/mm 2 at imaging plane. Bleaching curves were normalized to mean cellular fluorescence from FIG. 5 F or normalized to the zero-time value (inset).
- FIG. 5 I Mean time to bleach of Ace2N-mNeon and Voltron 549 during single-molecule imaging, 100 ms frames. ***P ⁇ 0.001, two-tailed Student's t-test.
- FIGS. 5 J and 5 K Simultaneous in vivo Voltron imaging and electrophysiology in larval zebrafish (extracellular) and adult Drosophila (whole cell), respectively.
- FIGS. 6 A- 6 L are related to membrane voltage dynamics in hippocampal parvalbumin (PV) neurons ( FIGS. 6 A- 6 G ) and visual cortex pyramidal neurons ( FIGS. 6 A- 6 L ) of mice using Voltron.
- FIGS. 6 C- 6 E Voltron 525 raw ⁇ F/F 0 traces showing spontaneous spikes of a PV neuron ( FIG. 6 B ) located at a depth of 60 ⁇ m in hippocampal CA1 region imaged at 3858 frames per second. Boxes indicate intervals shown at expanded time scales. Scalebar: 20 ⁇ m.
- FIG. 6 F Overlay of 177 spikes detected during a 15 s period (gray) and their average (black).
- FIGS. 8 A- 8 G illustrate millisecond-timescale neural dynamics during swimming behavior in zebrafish.
- FIG. 8 A Schematic illustration of the setup. An immobilized zebrafish is placed under the light-sheet microscope and the motor signals (inset) from its tail are recorded during the imaging session using a pair of electrodes. Visual stimuli (forward drifting gratings) for triggering swimming responses are presented below the fish.
- FIG. 8 B Left panel: anatomical location of the imaged brain region (midbrain nucleus; see FIG. 42 A ). Center, a representative field of view of the imaged region expressing Voltron. Scale bar, 20 ⁇ m. Right, the position of neurons analyzed in FIG. 8 C .
- FIG. 8 A Schematic illustration of the setup. An immobilized zebrafish is placed under the light-sheet microscope and the motor signals (inset) from its tail are recorded during the imaging session using a pair of electrodes. Visual stimuli (forward drifting gratings) for triggering swimming responses are presented below the
- FIG. 8 D Mean subthreshold signal (top), mean spiking frequency (middle) and spike raster plots (bottom) near the initiation of swim bouts from three representative neurons: “Off” (green), “Onset” (red) and “Late” (blue) neuron. Shadows in the top and middle panels represent s.e.m. across swim events.
- FIG. 8 E Classification of recorded neurons by their mean subthreshold signals near the initiation of swim bouts. 179 neurons recorded from 43 fish were classified using non-negative matrix factorization and colored according to the weights for three factors: “onset” (red), “off” (green) and “late” (blue). The details of this classification are described in the Methods. ( FIG.
- FIG. 8 F Spatial organization of the same population of neurons as in FIG. 8 E . Neurons from multiple fish are superimposed to a single map based on the distance from the center of this midbrain nucleus.
- FIG. 8 G Hypothetical model of neural activity modulation in this midbrain nucleus. “Onset” neurons send motor commands to downstream motor circuits to trigger swim bouts, while activity of “off” neurons is inhibited. “Late” neurons receive internal copy signals of ongoing swim bouts from the motor circuit.
- FIG. 10 includes the nucleotide sequence (SEQ ID NO: 21) and amino acid sequence (SEQ ID NO: 22) of QuasAr2-HaloTag, with sequence features annotated.
- FIG. 11 includes the nucleotide sequence (SEQ ID NO: 23) and amino acid sequence (SEQ ID NO: 24) of QuasAr2-SNAP-Tag, with sequence features annotated.
- FIG. 13 A- 13 C include (from top to bottom: JF505, JF549, JF585, JF635)
- FIG. 13 A images of neurons expressing Voltron and labeled with different JF-HaloTag dye conjugates, Scale bar: 20 ⁇ m
- FIG. 13 B Single-trial recording of action potentials and subthreshold voltage signals from current injections. Raw fluorescence traces, colored by dye emission, are shown on the top of each panel. Membrane potential, recorded with a patch pipette, is shown at the bottom of each panel in black; and
- FIG. 13 C Voltron fluorescence change as a function of membrane voltage with different JF dye conjugates.
- FIG. 14 A includes Left: Chemical structure of JF505-HaloTag ligand, Middle: fluorescence image of hippocampal neurons in culture expressing QuasAr2-HaloTag-16 labeled with JF503. Right: Fluorescence trace over time showing voltage-dependent fluorescence changes resulting from spontaneous action potentials of the neurons.
- FIG. 14 B includes (B) Left: Chemical structure of JF525-HaloTag ligand, Middle: fluorescence image of hippocampal neurons in culture expressing QuasAr2-HaloTag-16 labeled with JF525. Right: Fluorescence trace over time showing voltage-dependent fluorescence changes resulting from spontaneous action potentials of the neurons.
- FIG. 14 C includes, Left: Chemical structure of JF585-HaloTag ligand, Middle: fluorescence image of hippocampal neurons in culture expressing QuasAr2-HaloTag-16 labeled with JF585. Right: Fluorescence trace over time showing voltage-dependent fluorescence changes resulting from spontaneous action potentials of the neurons.
- FIG. 14 D includes, Left: Chemical structure of JF635-HaloTag ligand, Middle: fluorescence image of hippocampal neurons in culture expressing QuasAr2-HaloTag-16 labeled with JF635. Right: Fluorescence trace over time showing voltage-dependent fluorescence changes resulting from spontaneous action potentials of the neurons. Scale bar: 20 ⁇ m.
- FIG. 15 A includes, Left: Chemical structure of JF549-SNAP-tag ligand, Middle: fluorescence image of hippocampal neurons in culture expressing QuasAr2-SNAP-tag labeled with JF549 . Right: Fluorescence trace over time showing voltage-dependent fluorescence changes resulting from spontaneous action potentials of the neurons.
- FIG. 15 B includes, Left: Chemical structure of JF585-SNAP-tag ligand, Middle: fluorescence image of hippocampal neurons in culture expressing QuasAr2-SNAP-tag labeled with JF585. Right: Fluorescence trace over time showing voltage-dependent fluorescence changes resulting from spontaneous action potentials of the neurons. Scale bar: 20 ⁇ m
- FIG. 20 includes images showing Voltron expression in zebrafish.
- the left panel includes a confocal image of Tg[elavl3:Voltron], and the right panel includes a confocal image of Tg[elavl3:Voltron-ST] (right) zebrafish (4 dpf) labeled with JF525 dye.
- Scale bar 50 ⁇ m.
- FIG. 21 A- 21 E relate to simultaneous whole-cell recording and Voltron imaging in zebrafish.
- FIG. 21 A A schematic drawing showing the configuration of the experiment and the location of the images in the subsequent panels.
- FIG. 21 B A single plane of two-photon image of the patched cell expressing Voltron (yellow) in the background of scanned Dodt gradient contrast (grey).
- FIG. 21 C A widefield image showing the location of the region of interest used to extract Voltron signal in the following panels.
- FIG. 21 D Traces of Voltron fluorescence (above) and whole-cell recording (below). Spikes are indicated by asterisks.
- FIG. 21 E Traces of denoised Voltron fluorescence (above) and whole-cell recording (below). A small subthreshold event is indicated by an arrow.
- FIGS. 22 A- 22 F relate to recording spontaneous dopamine neuron activity in living adult flies using Voltron imaging and whole-cell patch clamp.
- FIG. 22 A Infrared image of fly brain overlaid with Voltron549 florescence in a dopamine neuron. Voltron expression was driven by a split-Gal4 driver (MB058B-Gal4) that labels a pair of PPL1- ⁇ ′2/ ⁇ 2 dopamine neurons, one on each brain hemisphere.
- FIG. 22 A Infrared image of fly brain overlaid with Voltron549 florescence in a dopamine neuron. Voltron expression was driven by a split-Gal4 driver (MB058B-Gal4) that labels a pair of PPL1- ⁇ ′2/ ⁇ 2 dopamine neurons, one on each brain hemisphere.
- FIG. 22 B PPL1- ⁇ ′2/ ⁇ 2 neurons receive dendritic input from the ipsilateral hemisphere, and send axonal output bilaterally to form patch-like innervations in both the ipsilateral (ipsi.) and contralateral (contra.) mushroom body lobes. Consequently, each projection zone in the mushroom body contains axonal terminals of both cells, although each cell body contributes more extensive arbor to the projection zone in the same hemisphere.
- FIG. 22 C- 22 E Voltron imaging in different neuronal compartments. Left, single-trial recordings of fluorescence traces and cell membrane potential from concurrent whole-cell recording. Circles mark action potential spikes detected in the Voltron traces.
- FIG. 22 F Signal-to-noise ratios (SNRs) in different neuronal compartments, calculated as Voltron spike peak amplitude over standard deviation of the spike-free zones of the trace.
- FIG. 23 includes maximum intensity projections of confocal stacks of neurons in culture (bottom panels) expressing Voltron (left) or soma-targeted Voltron (right) and labeled with JF525 . Zoom in on neuron soma showing cell membrane labeling and intracellular labelling, presumably endoplasmic reticulum (top panels).
- the soma localization tag limits labeling of processes and improves trafficking of Voltron to the cell membrane.
- FIG. 24 include an analysis of membrane voltage dynamics in hippocampal parvalbumin (PV) neurons of awake mouse. The half rise time, half decay time, and full width half maximum of the spike waveforms shown in FIG. 6 G .
- PV hippocampal parvalbumin
- FIG. 25 includes results of orientation tuning of 11 pyramidal cells at depths of 100-250 ⁇ m in visual cortex of two C57B6 mice expressing Voltron525 under the control of CamKII-Cre.
- Each of the 11 cell panels includes fluorescence image of cell (top left, scalebar: 20 ⁇ m), average of all spikes in session (top right, scalebars: ⁇ 5% AF/F, 5 ms) and orientation tuning to full-frame drifting gratings of neurons (bottom), displayed from number of spikes during trials (solid black line), number of spikes during preceding inter-trial intervals (dashed black line), and subthreshold ⁇ F/F0 (right y-axis, solid gray line) after low-pass filtering traces using a 10-point median filter.
- FIG. 26 A includes a histogram of orientation selectivity index calculated from number of spikes in trial.
- FIG. 26 B includes a histogram of orientation selectivity index calculated from subthreshold membrane potential.
- FIG. 27 A includes an image showing Layer 1 interneurons expressing Voltron525 (same field of view as in FIG. 3 F ). Scalebar: 100 ⁇ m.
- FIG. 27 B includes fluorescence traces from neurons labeled in FIG. 27 A , in decreasing order of signal to noise ratio. Signals processed as in FIG. 7 G but without the last step of global background subtraction.
- FIG. 27 C includes image zooms of fluorescence traces from color coded regions of FIG. 27 A with detected action potentials represented as black dots above, illustrating representative traces with high (top), medium (middle), and low (bottom) SNR.
- FIG. 28 A- 28 D include spike triggered averages of neuron ensemble.
- FIG. 28 A Spike triggered averages calculated from traces shown in FIG. 27 B . For each pair of neurons, estimated spike times of the first neuron (cell-pre, rows) were used to calculate the average membrane potential of the second neuron (cell-post, columns) in a window of 400 ms around the spike times. Diagonal line shown in red is the average spike shape of each neuron.
- FIG. 28 B Schematic to illustrate calculation of spike triggered average.
- FIG. 28 C Zoom-in of spike triggered average for cell 15 (pre) to cell 19 (post). Gray bar: standard deviation of shuffled spike triggered average.
- FIG. 28 D Estimated optical cross talk between a pair of neurons.
- FIG. 29 includes a series of spatial filters for context regions of 50 ⁇ 50 pixels centered on the ROI of each cell shown in FIGS. 7 F- 7 G and FIGS. 27 A- 27 C .
- Spatial filters were estimated by Spike Pursuit. Cells near the boundary of the field of view have different sizes of context region.
- FIG. 30 A includes a fluorescence image of a cranial window over primary visual cortex (V1) in an NDNF-Cre mouse showing Cre-dependent expression of soma targeted Voltron525. Scalebar, 1 mm.
- FIG. 30 B includes a fluorescence image of area indicated by the white rectangle in FIG. 30 A , with neuron labels corresponding to fluorescence traces in FIG. 30 C .
- Scalebar 100 ⁇ m.
- FIG. 30 C Fluorescence traces during 10-15 minutes recordings from neurons indicated in FIG. 30 B , in decreasing order of signal to noise ratio.
- FIG. 30 D includes zoom-in of fluorescence traces from area indicated by red rectangle in FIG. 30 C .
- FIG. 31 A includes a fluorescence image of a cranial window over primary visual cortex (V1) in an NDNF-Cre mouse showing Cre-dependent expression of soma targeted Voltron525. Scalebar, 1 mm.
- FIG. 31 B includes a fluorescence image of area indicated by the white rectangle in FIG. 31 A , with neuron labels corresponding to fluorescence traces in FIG. 31 C .
- Scalebar 100 ⁇ m.
- FIG. 31 C includes fluorescence traces during 10-15 minutes recordings from neurons indicated in FIG. 31 B , in decreasing order of signal to noise ratio.
- FIG. 31 D includes zoom-in of fluorescence traces from area indicated by red rectangle in FIG. 31 C .
- FIG. 32 A includes fluorescence image of a cranial window over primary visual cortex (V1) in an NDNF-Cre mouse showing Cre-dependent expression of soma targeted Voltron525. Scalebar, 1 mm.
- FIG. 32 B includes fluorescence image of area indicated by the white rectangle in FIG. 32 A , with neuron labels corresponding to fluorescence traces in FIG. 32 C .
- Scalebar 100 ⁇ m.
- FIG. 32 C Fluorescence traces during 10-15 minutes recordings from neurons indicated in FIG. 32 B , in decreasing order of signal to noise ratio.
- FIG. 32 D includes zoom-in of fluorescence traces from area indicated by red rectangle in FIG. 32 C .
- FIG. 33 A includes fluorescence image of a cranial window over primary visual cortex (V1) in an NDNF-Cre mouse showing Cre-dependent expression of soma targeted Voltron525. Scalebar, 1 mm.
- FIG. 33 B includes fluorescence image of area indicated by the white rectangle in FIG. 33 A , with neuron labels corresponding to fluorescence traces in FIG. 33 C .
- Scalebar 100 ⁇ m.
- FIG. 33 C includes fluorescence traces during 10-15 minutes recordings from neurons indicated in FIG. 33 B , in decreasing order of signal to noise ratio.
- FIG. 33 D includes zoom-in of fluorescence traces from area indicated by red rectangle in FIG. 33 C .
- FIG. 34 A includes fluorescence image of a cranial window over primary visual cortex (V1) in an NDNF-Cre mouse showing Cre-dependent expression of soma targeted Voltron525. Scalebar, 1 mm.
- FIG. 34 B includes fluorescence image of area indicated by the white rectangle in FIG. 34 A , with neuron labels corresponding to fluorescence traces in FIG. 34 C .
- Scalebar 100 ⁇ m.
- FIG. 34 C includes fluorescence traces during 10-15 minutes recordings from neurons indicated in FIG. 34 B , in decreasing order of signal to noise ratio.
- FIG. 34 D includes zoom-in of fluorescence traces from area indicated by red rectangle in FIG. 34 C .
- FIG. 35 A includes fluorescence image of a cranial window over primary visual cortex (V1) in an NDNF-Cre mouse showing Cre-dependent expression of soma targeted Voltron525. Scalebar, 1 mm.
- FIG. 35 B includes fluorescence image of area indicated by the white rectangle in FIG. 35 A , with neuron labels corresponding to fluorescence traces in FIG. 35 C .
- Scalebar 100 ⁇ m.
- FIG. 35 D includes zoom-in of fluorescence traces from area indicated by red rectangle in FIG. 35 C .
- FIG. 36 A includes a fluorescence image of a cranial window over primary visual cortex (V1) in an NDNF-Cre mouse showing Cre-dependent expression of soma targeted Voltron525. Scalebar, 1 mm.
- FIG. 36 B includes fluorescence image of area indicated by the white rectangle in FIG. 36 A , with neuron labels corresponding to fluorescence traces in FIG. 36 C .
- Scalebar 100 ⁇ m.
- FIG. 36 C includes fluorescence traces during 10-15 minutes recordings from neurons indicated in FIG. 36 B , in decreasing order of signal to noise ratio.
- FIG. 36 D Zoom-in of fluorescence traces from area indicated by red rectangle in FIG. 36 C .
- FIG. 37 A includes a fluorescence image of a cranial window over primary visual cortex (V1) in an NDNF-Cre mouse showing Cre-dependent expression of soma targeted Voltron525. Scalebar, 1 mm.
- FIG. 37 B includes fluorescence image of area indicated by the white rectangle in FIG. 37 A , with neuron labels corresponding to fluorescence traces in FIG. 37 C .
- Scalebar 100 ⁇ m.
- FIG. 37 C includes fluorescence traces during 10-15 minutes recordings from neurons indicated in FIG. 37 B , in decreasing order of signal to noise ratio.
- FIG. 37 D includes zoom-in of fluorescence traces from area indicated by red rectangle in FIG. 37 C .
- FIG. 38 A includes a fluorescence image of a cranial window over primary visual cortex (V1) in an NDNF-Cre mouse showing Cre-dependent expression of soma targeted Voltron525. Scalebar, 1 mm.
- FIG. 38 B includes a fluorescence image of area indicated by the white rectangle in FIG. 38 A , with neuron labels corresponding to fluorescence traces in FIG. 38 C .
- Scalebar 100 ⁇ m.
- FIG. 38 C includes fluorescence traces during 10-15 minutes recordings from neurons indicated in FIG. 38 B , in decreasing order of signal to noise ratio.
- FIG. 38 D includes zoom-in of fluorescence traces from area indicated by red rectangle in FIG. 38 C .
- FIG. 39 A includes a fluorescence image of a cranial window over primary visual cortex (V1) in an NDNF-Cre mouse showing Cre-dependent expression of soma targeted Voltron525. Scalebar, 1 mm.
- FIG. 39 B includes a fluorescence image of area indicated by the white rectangle in FIG. 39 A , with neuron labels corresponding to fluorescence traces in FIG. 39 C .
- Scalebar 100 ⁇ m.
- FIG. 39 C includes fluorescence traces during 10-15 minutes recordings from neurons indicated in FIG. 39 B , in decreasing order of signal to noise ratio.
- FIG. 39 D includes zoom-in of fluorescence traces from area indicated by red rectangle in FIG. 39 C .
- FIG. 40 A includes a fluorescence image of a cranial window over primary visual cortex (V1) in an NDNF-Cre mouse showing Cre-dependent expression of soma targeted Voltron525. Scalebar, 1 mm.
- FIG. 40 B includes a fluorescence image of area indicated by the white rectangle in FIG. 40 A , with neuron labels corresponding to fluorescence traces in FIG. 40 C .
- Scalebar 100 ⁇ m.
- FIG. 40 C includes fluorescence traces during 10-15 minutes recordings from neurons indicated in FIG. 40 B , in decreasing order of signal to noise ratio.
- FIG. 40 D includes zoom-in of fluorescence traces from area indicated by red rectangle in FIG. 40 C .
- FIG. 41 A includes pictures of forebrain neurons expressing Voltron-ST labeled with Janelia Fluor 525 (JF525) with an inset schematic drawing showing the location of the image (Panel A1), and fluorescence signal from a neuron labeled with Voltron-ST+JF525 showing spontaneous spiking activity (Panel A2).
- FIG. 41 B includes pictures of forebrain neurons expressing Voltron-ST labeled with Janelia Fluor 549 (JF549) with an inset schematic drawing showing the location of the image (Panel B1), and fluorescence signal from a neuron labeled with Voltron-ST+JF549 showing spontaneous spiking activity (Panel B2).
- FIG. 41 C includes pictures of forebrain neurons expressing Voltron-ST labeled with Janelia Fluor 585 (JF585) with an inset schematic drawing showing the location of the image (Panel C1), and fluorescence signal from a neuron labeled with Voltron-ST+JF584 showing spontaneous spiking activity (Panel C2).
- FIG. 41 D includes pictures of forebrain neurons expressing Voltron-ST labeled with Janelia Fluor 635 (JF635) with an inset schematic drawing showing the location of the image (Panel D1), and fluorescence signal from a neuron labeled with Voltron-ST+JF635 showing spontaneous spiking activity (Panel D2).
- FIGS. 42 A- 42 E relates to recording and analyzing Voltron data in behaving zebrafish.
- FIG. 42 A Left, anatomical location of the midbrain nucleus imaged in this study. The image was taken from plane 81 of image stacks from Tg(eval3:H2B-RFP) (gray) and Tg(vglut2:GFP) (green) transgenic zebrafish in the Z-brain atlas (33). Right, a representative image of the same nucleus in a Tg(vglut2:Gal4); Tg(UAS:GFP) transgenic zebrafish.
- FIG. 42 B Flow chart of the data processing pipeline for the acquired data.
- FIG. 42 A Left, anatomical location of the midbrain nucleus imaged in this study. The image was taken from plane 81 of image stacks from Tg(eval3:H2B-RFP) (gray) and Tg(vglut2:GFP) (green) transgenic
- FIG. 42 C An example of pixel weight optimization for a representative neuron. Traces from the initial pixel weights (middle) and the final pixel weights (bottom) of the same neurons are plotted on the right.
- FIG. 42 D Schematic of averaging procedure of neural activity at the onset of first bout of the swimming for each trial for the analysis in FIG. 42 E .
- FIG. 42 E Average firing rates (top) and raster plots across trials (bottom) at the onset of the first bout for each trial plotted for 3 representative neurons on a long timescale ( ⁇ 3 seconds to 3 seconds).
- the example ‘Off’ neuron shows suppression of firing at the onset of swimming (following a brief increase in firing rate just before swimming).
- the ‘Ramp’ neuron shows a gradual increase in activity starting about 1.5 seconds before the onset of swimming, and a decay in activity after swim onset.
- ‘Motor’-type neurons (subdivided into ‘Onset’ and ‘Late’ neurons in FIG. 8 ) show increased firing at the onset of swimming. Shadows represent standard error of the mean (s.e.m.) across multiple trials.
- the presently-disclosed subject matter includes a genetically encoded voltage indicators (GEVI) with a direction of fluorescence change such that an increase in membrane potential leads to an increase in fluorescence.
- GEVI genetically encoded voltage indicators
- the presently-disclosed subject matter includes voltage indicators and methods of measuring voltage.
- the voltage indicators include membrane-localized voltage-sensitive protein and a capture protein engineered to capture a fluorescent dye ligand. These voltage indicators combine the brightness and photostability of robust fluorescent dyes with the targetability of proteins.
- the voltage indicators of the presently-disclosed subject matter include amino acid sequences to improve/localize membrane targeting, such that membrane potential/membrane voltage can be assessed. When the voltage indicator is targeted to a cell membrane, an increase in voltage across the cell membrane causes an increase in fluorescent emission from a fluorescent dye ligand associated with the voltage indicator.
- the voltage indicators of the presently-disclosed subject matter are uniquely designed to provide a number of benefits that allow for a rapid increase in a robust fluorescent signal in response to spikes in voltage across the membrane. It is also notable that, for example in the case of a neuron, the voltage indicators provide for a rapid increase in a robust fluorescent signal in response to spikes, as well as in response to subthreshold voltage signals. Embodiments of the indicators have sub-millisecond response times between an increase in voltage and an increase in florescent emission. As will be appreciated by those of ordinary skill in the art, the ability to rapidly assess voltage increases with an increase in fluorescence is of particular utility, for example, to reduce noise and enhance sensitivity.
- the presently-disclosed subject matter includes a voltage indicator, which comprises a voltage-sensitive protein including amino acid mutations, and a capture protein domain arranged and disposed to capture a fluorescent dye ligand.
- a voltage indicator which comprises a voltage-sensitive protein including amino acid mutations
- a capture protein domain arranged and disposed to capture a fluorescent dye ligand.
- an increase in voltage across the membrane causes an increase in fluorescent emission from the fluorescent dye ligand.
- the membrane is a membrane of a neuron.
- the increase in voltage whether a spike in voltage or a subthreshold voltage signal, results in an increase in fluorescent emission correlating to the voltage.
- the response time between the increase in voltage and the increase in fluorescent emission is less than about a millisecond.
- Suitable voltage sensitive proteins include, but are not limited to, one or more opsins, one or more other molecules including a voltage-sensing domain, or a combination thereof, and including amino acid mutations.
- the voltage-sensitive protein is a voltage-sensitive opsin domain.
- the voltage-sensitive opsin domain is a microbial opsin domain.
- the voltage-sensitive opsin domain is a microbial rhodopsin domain.
- Microbial rhodopsins are a large class of proteins characterized by seven transmembrane domains and a retinilydene chromophore bound in the protein core to a lysine via a Schiff base. Over 5,000 microbial rhodopsins are known, and these proteins are found in all kingdoms of life.
- Microbial rhodopsins serve a variety of functions for their hosts: some are light-driven proton pumps (bacteriorhodopsin, proteorhodopsins), others are light-driven ion channels (channelrhodopsins), chloride pumps (halorhodopsins), or serve in a purely photosensory capacity (sensory rhodopsins).
- the retinilydene chromophore imbues microbial rhodopsins with unusual optical properties.
- the linear and nonlinear responses of the retinal are highly sensitive to interactions with the protein host: small changes in the electrostatic environment can lead to large changes in absorption spectrum.
- the microbial rhodopsin domain is selected from the group consisting of QuarsAr1, QuarsAr2, Ace2N, and combinations thereof.
- the voltage sensitive protein includes a Ciona intestinalis voltage-sensing domain (CiVSD), Danio rerio voltage-sensing domain (DrVSD), Gallus gallus voltage-sensing domain (GgVSD), or a combination thereof.
- the microbial rhodopsin domain comprises an amino acid sequence having at least 90, 95, 98, or 99% sequence identity to SEQ ID NO: 9, SEQ ID NO: 15, SEQ ID NO: 16, or SEQ ID NO: 17.
- the voltage-sensitive opsin domain is Ace2N including an amino acid mutation at one or more of residue 81, 92, and 199. In some embodiments, the voltage-sensitive opsin domain comprises the polypeptide of SEQ ID NO: 9 having one, two, three, or four amino acid mutations. In some embodiments, the voltage-sensitive opsin domain comprises the amino acid sequence of SEQ ID NO: 9 having an amino acid mutation at one or more of residue 81, 92, and 199.
- the voltage indicator includes an amino acid sequence selected from SEQ ID NOS: 2, 4, 6, 8, 20, 22, 24, and 26. In some embodiments, the voltage indicator includes an amino acid sequence encoded by a nucleotide sequence selected from the group of nucleotide sequences of SEQ ID NOS: 1, 3, 5, 7, 19, 21, 23, and 25.
- Suitable capture proteins include any protein configured to bind a desired ligand.
- the capture protein includes a covalent capture protein.
- the capture protein of the voltage indicator is a non-covalent capture protein.
- the non-covalent capture protein is selected from the group consisting of TMP-tag, biotin-avidin, and a combination thereof.
- the capture protein domain is selected from a HaloTag and a SNAP-Tag.
- the capture protein is a covalent capture protein.
- the covalent capture protein is selected from the group consisting of HaloTag, SNAP-tag, TMP-tag, ⁇ Lac-tag, CLIP-tag, or a combination thereof.
- the capture protein domain comprises an amino acid sequence selected from the amino acid sequence of SEQ ID NOS: 10 and 11.
- 1, 2, 3, 4, 5, 6, 7, 8, 9, or 10 amino acids are removed from the junction between the opsin domain and the capture protein.
- the voltage indicator in addition to the voltage-sensitive protein domain and the capture protein domain, also includes a targeting sequence.
- the targeting sequence is a soma targeting sequence for directing the indicator to a neuron.
- the targeting sequence comprises the amino acid sequence of SEQ ID NO: 12.
- the mutated voltage-sensitive microbial opsin domain and the capture protein are provided as a fusion protein.
- the capture protein is positioned at the c-terminal end of the voltage-sensitive microbial opsin domain.
- the indicator also includes a targeting sequence that is positioned at the c-terminal end of the capture protein.
- the voltage indicator includes a capture protein domain arranged and disposed to capture a fluorescent dye ligand.
- Suitable fluorescent dye ligands include, but are not limited to, one or more fluorophore dyes.
- the fluorophore dye includes a fluorophore containing one or more cyclic amine substituents.
- the fluorescent dye ligand is an azetidine-containing Janelia FluorTM dyes.
- the fluorescent dye ligand can be Janelia FluorTM 505 , Janelia FluorTM 525 , Janelia FluorTM 549 , Janelia FluorTM 585 , Janelia FluorTM 646 , or combinations thereof.
- the fluorescent dye ligand is a fluorescent protein.
- the fluorescent dye ligand can be sfGFP or mNeonGreen.
- the presently-disclosed subject matter also includes methods of measuring voltage, and in particular, methods of measuring voltage across a membrane.
- the voltage indicators as described herein are used to perform the method.
- the method involves administering the voltage indicator and determining changes in fluorescence of the fluorescent dye ligand.
- the fluorescent dye ligand is captured by the capture protein domain, and when the voltage indicator is bound to a cell membrane, an increase in voltage across the cell membrane causes an increase in fluorescent emission from the fluorescent dye ligand.
- the method can involve determining changes in voltage based on changes in fluorescence.
- an increase in membrane potential leads to an increase in fluorescence.
- the method can be used to measure voltage across the membrane of a cell, such as a neuron. Florescent emission will increase with an increase in voltage, which can be a spike in voltage or a subthreshold voltage signal. In some embodiments, the response time between the increase in voltage and the increase in fluorescent emission is less than about a millisecond.
- the changes in fluorescence may be measured through any suitable method such as, but not limited to, observation with a microscope, image capture, video recording, or a combination thereof.
- the voltage indicator includes a linker between the voltage-sensitive domain and the capture protein domain.
- Embodiments of the indicator and method can include modifying a length of the linker.
- modifying the length of the linker can include removing at least one amino acid residue. In some embodiments, about 1, 2, 3, 4, 5, 6, 7, 8, 9, 10, 11, 12, 13, 14, 15, 16, 17, 18, 19, 20, 21, or 22 amino acid residues can be removed.
- the modification of the length of the linker can modify the size of a fluorescence response.
- nucleotides and polypeptides disclosed herein are included in publicly-available databases, such as GENBANK® and SWISSPROT. Information including sequences and other information related to such nucleotides and polypeptides included in such publicly-available databases are expressly incorporated by reference. Unless otherwise indicated or apparent the references to such publicly-available databases are references to the most recent version of the database as of the filing date of this Application.
- the term “about,” when referring to a value or to an amount of mass, weight, time, volume, concentration or percentage is meant to encompass variations of in some embodiments ⁇ 20%, in some embodiments ⁇ 10%, in some embodiments ⁇ 5%, in some embodiments ⁇ 1%, in some embodiments ⁇ 0.5%, in some embodiments ⁇ 0.1%, in some embodiments ⁇ 0.01%, and in some embodiments ⁇ 0.001% from the specified amount, as such variations are appropriate to perform the disclosed method.
- ranges can be expressed as from “about” one particular value, and/or to “about” another particular value. It is also understood that there are a number of values disclosed herein, and that each value is also herein disclosed as “about” that particular value in addition to the value itself. For example, if the value “10” is disclosed, then “about 10” is also disclosed. It is also understood that each unit between two particular units are also disclosed. For example, if 10 and 15 are disclosed, then 11, 12, 13, and 14 are also disclosed.
- an optionally variant portion means that the portion is variant or non-variant.
- the presently-disclosed subject matter is further illustrated by the following specific but non-limiting examples.
- the following examples may include compilations of data that are representative of data gathered at various times during the course of development and experimentation related to the present invention.
- the present inventors inverted the direction of fluorescence change in exemplary rhodopsin electrochromic fluorescence resonance energy transfer (eFRET) genetically encoded voltage indicators (GEVIs) such that an increase in membrane potential lead to an increase in fluorescence.
- eFRET electrochromic fluorescence resonance energy transfer
- GEVIs genetically encoded voltage indicators
- FIG. 1 A illustrates fluorescence change of an exemplary eFRET GEVI having the sequence as set forth in FIG. 4 , where there is a decrease in fluorescence with increasing membrane potential, and voltage signals such as action potentials in neurons take on a downward-going shape.
- FIGS. 1 B-D illustrate fluorescent change in exemplary eFRET GEVIs having one or more amino acid substitutions relative to the sequence of FIG. 4 , in which the fluorescence change is inverted.
- D92N (SEQ ID NO: 2), a single amino acid substitution inverted the florescence change ( FIG. 1 B ), but it was desired to see if the indicator could be further modified such that fluorescence changes occur more-rapidly to follow fast voltage changes such as action potentials in neurons.
- N81D An additional amino acid substitution, N81D, increased the speed of fluorescence change such that the fluorescence could follow action potentials in neurons ( FIG. 1 C ).
- Voltron was used for in vivo voltage imaging in mice, zebrafish, and fruit flies.
- mouse cortex Voltron allowed single-trial recording of spikes and subthreshold voltage signals from dozens of neurons simultaneously, over 15 minutes of continuous imaging.
- larval zebrafish Voltron enabled the precise correlation of spike timing with behavior.
- FIG. 5 A An exemplary design for a chemigenetic voltage indicator combined a voltage-sensitive microbial rhodopsin domain (6, 7, 11) with a self-labeling protein tag domain ( FIG. 5 A ) that covalently binds a synthetic fluorophore dye ligand (14, 15) ( FIG. 5 B ), analogous to previously reported voltage indicators using fluorescent proteins (10, 11, 18).
- Transmembrane-voltage-dependent changes in the absorption spectrum of the rhodopsin (6, 19) reversibly modulate the degree of fluorescence quenching of the nearby bound dye through Förster resonance energy transfer (FRET).
- FRET Förster resonance energy transfer
- the chemigenetic Voltron indicator was next deployed in vivo, observing that the protein could be reliably expressed and labeled with dye in mice, larval zebrafish, and adult fruit flies ( FIGS. 5 - 8 , FIG. 20 - 41 ). Simultaneous in vivo electrophysiology and imaging in both zebrafish and flies confirmed the detection of individual action potentials in single-trial imaging ( FIGS. 5 J, 5 K and FIGS. 21 - 22 ). For imaging in the mouse brain, a variant of Voltron was used with a soma-targeting sequence from Kv2.1 (22, 23) (Voltron-ST, FIG. 23 ).
- Voltron was then used to image behaving zebrafish larvae, which reliably respond to visual input with fast, directed swim bouts that are tailored to the details of the stimulus (26). Studies were conducted to determine how this sensory-to-motor transformation unfolds in neuronal populations at fine timescales that are inaccessible with calcium imaging. It was first verified that Voltron could detect action potentials and subthreshold voltage signals in live zebrafish using several different colors of dye ligands ( FIGS. 21 and 41 ). Voltron 525 as then used to monitor neural spiking patterns during visual-motion-induced swims ( FIG. 8 A ). Activity patterns from 179 neurons were recorded across 43 fish in a motor-sensory nucleus in the tegmental area of the midbrain ( FIGS.
- FIGS. 8 C, 42 B -C yielding data on subthreshold membrane voltage modulation as well as automatically-detected spike times.
- FIGS. 8 C, 42 B -C Neuron populations were found with different temporal activity patterns, including neurons whose firing rate increased ⁇ 1 second before the fish started swimming ( FIG. 42 D-E , ‘Ramp’), neurons whose firing rate was suppressed each time the fish swam ( FIG. 8 D , ‘Off’), and neurons that fired each time the fish swam ( FIG. 8 D , ‘Onset’ and ‘Late’). Of the latter types, some fired just before swimming ( ⁇ 20 ms before swim onset, ‘Onset’) and others fired just after swimming ( ⁇ 10 ms after swim onset, ‘Late’).
- Voltron was tested in adult Drosophila in vivo by expressing the protein in a pair of dopaminergic neurons, one in each brain hemisphere, which innervate a single compartment in the mushroom body. Strong spiking signals were detected from axons and dendrites of these neurons using Voltron549 ( FIGS. 5 K, 22 ), which matched spikes detected using electrophysiology. In some neuronal cell types in Drosophila , calcium indicators located in the cell body have failed to exhibit fluorescence changes even under conditions where high spike rates are expected (27). However, spikes were clearly detectable when imaging from the soma of dopamine neurons with Voltron ( FIG. 22 E ).
- spikes could be clearly distinguish from the two neurons based on the amplitude of the spiking signals even when imaging from neuropil where their axons overlap extensively, likely because each bilaterally-projecting cell contributes a denser innervation of the mushroom body in the ipsilateral hemisphere ( FIG. 22 D ).
- AAV-hsyn-flex-Voltron-ST virus is available from Addgene (addgene.org).
- Transgenic Drosophila stocks for UAS-Voltron and LexAop-Voltron in multiple landing sites are available from the Bloomington Drosophila Stock Center (flystocks.bio.indiana.edu).
- UAS Voltron transgenic zebrafish are available from the Ahrens Lab at Janelia Research Campus, and from ZIRC (zebrafish.org).
- Cloning was done by restriction enzyme digest or PCR amplification of plasmid backbones, PCR amplification of inserted genes, and isothermal assembly to combine them, followed by Sanger sequencing to verify DNA sequences.
- the genes for QuasAr1 and QuasAr2 (7) were amplified from Addgene plasmids 51629 and 51692.
- the gene for Ace2N was synthesized (Integrated DNA Technologies) with mammalian codon optimization (11).
- the soma localization tag was synthesized (Integrated DNA technologies) through adding a 66 amino acid domain from the Kv2.1 potassium channel (residues 536 to 600) (22).
- Linker length variants were generated by Quikchange site-directed mutagenesis (Agilent).
- sensors were cloned into a pcDNA3.1-CAG plasmid (Invitrogen) at the NheI and HindIII sites.
- Voltron and Voltron-ST were cloned into the pTol2-HuC vector (for pan-neuronal expression) at the Agel restriction sites and into the pT2-Tbait-UAS vector (for Gal4-dependent expression) at the EcoRI and PspXI restriction sites.
- Voltron For expression in Drosophila melanogaster , Voltron was cloned into p10XUAS-IVS-Syn21-p10 at the XhoI and XbaI sites.
- Voltron and Voltron-ST were cloned into a pAAV-hsyn-flex plasmid at the BamHI restriction sites. The DNA and amino acid sequences of Voltron and Voltron-ST are given in FIG. 8 . Plasmids and maps are available from Addgene.
- JFdye-HaloTag conjugates 5 ⁇ M JFdye HaloTag ligand and 10 ⁇ M HaloTag protein were incubated in 10 mM HEPES with 0.1 mg/ml CHAPS at pH 7.3 at 4° C. overnight. Completeness of dye-binding was determined by titrating HaloTag protein (2.5 ⁇ M to 12.5 ⁇ M) with fluorogenic JF635 HaloTag ligand (5 ⁇ M) in overnight reactions and then measuring absorbance at 640 nm. Additionally, thin-layer chromatography was performed on a reaction of 5 ⁇ M JF549 with 7.5 ⁇ M HaloTag, which showed >95% of the dye was bound to HaloTag.
- Fluorescent proteins sfGFP parent fluorophore of ASAP2f
- mNeonGreen parent fluorophore of Ace2N-mNeon
- All photophysical measurements used either 1 ⁇ M solutions of JFdye-HaloTag conjugate in 10 mM HEPES buffer at pH 7.3, or 1-3 ⁇ M purified fluorescent proteins in 100 mM MOPS buffer at pH 7.2.
- Absorbance measurements were performed on a UV-VIS spectrometer (Lambda 35, Perkin Elmer). Fluorescence excitation and emission spectra were measured using a fluorimeter (LS55, Perkin Elmer).
- aqueous droplets of JFdye-HaloTag conjugates or fluorescent proteins were made by aliquoting 5 ⁇ l of a fluorophore solution into 45 ⁇ l of 1-Octanol and agitating by tapping or brief vortexing. 5 ⁇ l of the emulsion mixture was sandwiched between a pre-silanized glass slide and a glass coverslip to disperse isolated microdroplets of dye-conjugates or proteins for fluorescence microscopy.
- Power at the imaging plane for each filter set was set to 12 mW determined with a microscope slide power sensor (S170C, Thorlabs). From measurement of the sample area illuminated, the irradiance was determined to be 40 mW/mm 2 .
- the LED excitation spectrum was measured after the objective for each filter set using a fiber spectrometer (QE65000, Ocean Optics). Fluorescence images were collected using a scientific CMOS camera (ORCA-Flash 4.0, Hamamatsu) and image acquisition was performed using HCImage Live (Hamamtsu). Each sample was bleached continuously for 10 min. and images were acquired at 1 Hz. Fluorescence intensity from each droplet was obtained after background subtraction using ImageJ software.
- Data fitting was performed in MATLAB (MathWorks) and Origin (OriginLab), and goodness of fit assessed by minimal residual sum of errors or minimal x 2 .
- To quantify photobleaching across fluorophores requires knowledge of the excitation rate W and the fluorescence quantum yield ⁇ f .
- the excitation rate W was computed (30) from integration over the wavelength dependence of the product of measured extinction coefficient and irradiance spectral profile.
- the fluorescence quantum yield for the GEVIs is not directly measured, and assumed to be the same as that measured for the parent fluorophores.
- the photobleaching probability is most rigorous as it is independent of the fluorescence quantum yield.
- Hippocampal neurons extracted from PO to 1 Sprague-Dawley rat pups were transfected with Ace2N-mNeon and Voltron plasmids by electroporation (Lonza, P3 Primary Cell 4D-Nucleofector X kit) according to the manufacturer's instruction. After transfection, hippocampal neurons were plated onto 25 mm ultra-clean cover glasses coated with poly-D-lysine (Sigma) and cultured for 9 days in NbActiv4 medium (BrainBits).
- Excitation light was passed through a 405/488/561/647 nm laser quad band filter set filter that allows 488 nm or 561 nm light through to the sample (Chroma set number 89902).
- Emission from sample was collected through the same filter set then passed through a splitter (dichroic mirror: T560Ipxr (Chroma), with perpendicular emission filters: ET525/50m (Chroma) and ET605/52m (Chroma)) to split green and red fluorescence.
- the light was then collected onto two EMCCD cameras (iXon Ultra 897, Andor).
- Samples were first pre-bleached to achieve sparse single molecule detections.
- the laser power output was calibrated for 488 nm (to image Ace2N-mNeon) and 561 nm (to image Voltron549) to 17.5 mW with a Si Sensor power meter (Thorlabs, PM202). Images were acquired under TIRF imaging mode with 10 Hz frame rate. 1000 frames were recorded for each imaging area and 10 imaging areas were collected for each indicator. For image analysis, single molecules lasting for at least 3 frames were manually selected. The brightness and mean time to photobleach of these molecules were determined with ImageJ (1.51n) quantification tools to assess the single-molecule photo-stability of Ace2N-mNeon and Voltron549.
- Imaging buffer containing the following (in mM): 145 NaCl, 2.5 KCl, 10 glucose, 10 HEPES, pH 7.4, 2 CaCl2, 1 MgCl2.
- a FITC filter set (475/50 nm (excitation), 540/50 nm (emission), and a 506LP dichroic mirror (FITC-5050A-000; Semrock) was used to image mNeonGreen, ASAP1, and ASAP2f.
- a Cy3 filter set (531/40 nm (excitation), 593/40 nm (emission), and a 562LP dichroic mirror (Cy3-4040C-000; Semrock)) was used to image Volton549.
- a custom filter set (510/25 nm (excitation), 545/40 nm (emission), and a 525LP dichroic mirror (Semrock)) was used to image Voltron525.
- a quad bandpass filter (set number: 89000, Chroma) was used along with the appropriate color band from the SPECTRA X light source to image Voltron505, Voltron585 and Voltron635.
- neurons were imaged at 200-3200 Hz depending on the experiment.
- the LED light power output at the imaging plane was measured with a Si Sensor power meter (Thorlabs, PM202) for each imaging experiment.
- the excitation spectrum was measured after the objective for each excitation filter used using a spectrometer (QE65000, Ocean Optics). The spectrum was then integrated to get the excitation rate ! as described above (see section: Photobleaching analysis). As with the photobleaching experiments, when the data sets for the light spectrum and extinction coefficient are taken at incommensurate wavelengths, interpolation was used to re-cast the wavelengths of one of the data sets using MATLAB (MathWorks). The fraction of collected fluorescence using the emission filter compared to the total emission spectrum of the fluorophore was calculated. Illumination intensity of 20 mW/mm 2 at imaging plane was used for all indicators.
- Fluorescence images were acquired from five independent transfections for each construct for brightness measurements. Using MATLAB (MathWorks), fluorescence intensity was then corrected using the calculated excitation rates (!), fraction of emission collected, and quantum efficiency of the Hamamatsu ORCA-Flash 4.0 camera over the emitted wavelengths for ASAP2f, Ace2N-mNeon, Voltron525 and Voltron549. Values were calculated relative to ASAP2f.
- a stimulus isolator (A385, World Precision Instruments) with platinum wires was used to deliver field stimuli (50V, 83 Hz, 1 ms) to elicit action potentials in cultured neurons as described previously (35).
- the stimulation was controlled using an Engineering Board and timing was synchronized with fluorescence acquisition using the Nikon Elements software and a national instruments PXI-6723 board.
- Imaging and electrophysiology measurements were performed in imaging buffer (see “Fluorescence imaging in primary neuron culture” section) adjusted to 310 mOsm with sucrose. For voltage clamp measurements, 500 nM TTX was added to the imaging buffer to block sodium channels. Synaptic blockers (10 ⁇ M CNQX, 10 ⁇ M CPP, 10 ⁇ M GABAZINE, and 1 mM MCPG) were added to block ionotropic glutamate, GABA, and metabotropic glutamate receptors (35).
- Filamented glass micropipettes (Sutter Instruments) were pulled to a tip resistance of 4-6 M ⁇ . Internal solution for current clamp recordings contained the following (in mM): 130 potassium methanesulfonate, 10 HEPES, 5 NaCl, 1 MgCl2, 1 Mg-ATP, 0.4 Na-GTP, 14 Tris-phosphocreatine, adjusted to pH 7.3 with KOH, and adjusted to 300 mOsm with sucrose.
- Hippocampal PV neuron imaging was performed using adult PV-Cre mice (JAX 008069). Imaging window was implanted using procedures similar to those described in Dombeck et. al. (36). In short, a circular craniotomy (3 mm diameter) was made centered at 2.0 mm caudal and 2.0 mm lateral to bregma. The surface of CA1 was exposed by gently removing the overlying cortex with aspiration. AAV2/1-syn-Flex-Voltron-ST virus was diluted to 1.9 ⁇ 10 12 GC/ml and injected at three locations (separated by 800 ⁇ m, 30 nl per location) 200 ⁇ m from CA1 surface.
- the imaging window (constructed by gluing a 3 mm diameter cover glass to a stainless steel cannula of 3 mm diameter and 1.5 mm height) was placed onto the hippocampus and glued to the skull using super-bond C&B (Sun Medical). A titanium head bar was glued to the skull for head fixation during imaging.
- JF525-HaloTag ligand 100 ⁇ l, 1 mM was delivered using retro-orbital injection (37) 1 day before imaging.
- Labeled PV neurons 25-195 ⁇ m deep) were illuminated using a green LED (M530L3, Thorlabs) through an excitation filter (FF02-520-28, Semrock).
- a field aperture (diameter ⁇ 1 mm) was used to limit illumination to a circular area ( ⁇ 160 ⁇ m diameter at sample) around the cell of interest.
- the excitation intensity was ⁇ 25 mW/mm 2 at the sample plane.
- JF525 fluorescence was collected using a 16 ⁇ 0.8 NA objective (Nikon), separated from excitation light using a dichroic mirror (540lpxr, Chroma) and an emission filter (FF01-575-59, Semrock), and imaged onto a sCMOS camera (Zyla 4.2 plus, Andor). Images were collected at 3858 Hz.
- Image analysis was performed in MATLAB. Brain movement was corrected using ImageJ plugin TurboReg (38). A constant camera offset (measured by taking images without illumination) was subtracted from each frame. The fluorescence of each cell was measured by averaging pixels within a region of interest covering the cell body. To detect action potentials (AP), slow baseline fluctuation (measured by moving average with 20 ms window) was first subtracted from the raw fluorescence trace. The timings of AP events were detected as local minima of the baseline subtracted trace with amplitudes larger than four times the standard deviation and peaks separated by at least 5 ms from each other. To quantify AP waveform, 5 ms segments of fluorescence signal around the detected peaks were taken from the raw fluorescence trace, peak aligned and then averaged.
- AP action potentials
- the AP amplitude was measured as percent change (F-F0)/F0 with F0 being the fluorescence baseline averaged over a time window 2.5 ms to 1.5 ms before the peak of an individual AP.
- F0 being the fluorescence baseline averaged over a time window 2.5 ms to 1.5 ms before the peak of an individual AP.
- the rise time, decay time, and the width of the AP waveform was measured using the averaged trace for each cell.
- the rise time was the time from half the amplitude to the peak.
- the decay time was the time from the peak to half the amplitude in the decay phase.
- the width full width at half maxima, FWHM was the sum of rise and decay time. This is shown in FIG. 24 .
- NDNF-Cre mice (JAX 28536) were used for imaging Layer 1 neurons (2 females, 1 male; 100-120 days old at the time of the window surgery). C57BI/6NCrl (Charles River Laboratories) mice were used for imaging Layer 2/3 neurons (2 females; 100-120 days old). NDNF-Cre mice were injected with 30 nl of AAV2/1-syn-FLEX-Voltron-ST (titer, 2*10 12 GC/ml) at 8-12 injection sites 200 ⁇ m deep (injection rate, 1 nl/s).
- mice C57BI/6NCrl mice were injected with 30 nl mixture of AAV2/1-syn-FLEX-Voltron-ST (titer, 2*10 12 GC/ml) and AAV9-CamKIIa-Cre (titer, 10 8 GC/ml) 250 ⁇ m deep.
- AAV2/1-syn-FLEX-Voltron without soma targeting signal was injected in additional NDNF-Cre mice (titer, 2*1012 GC/ml)) and C57BI/6NCrl mice (AAV2/1-syn-FLEX-Voltron (titer, 2*10 12 gc/ml)+AAV9-CamKIIa-Cre (titer, 10 8 gc/ml)). This resulted in diffuse fluorescence and was not used for imaging experiments shown in this manuscript.
- JF525 dye was injected into the retro-orbital sinus. Imaging was done 2 to 6 days after dye injection, with subsequent dye injections and imaging 1 to 6 weeks after the first imaging session.
- 100 nanomoles of lyophilized JF525 were dissolved in 20 ⁇ l of DMSO, 20 ⁇ l Pluronic F-127 (20% w/v in DMSO), and 60-80 ⁇ l of PBS (final dye concentration 1 ⁇ M). Mice were anesthetized with 2-3% isoflurane and 100 ⁇ l of the dye solution was injected into the retro-orbital sinus of the right eye using a 27-30 gauge needle (37).
- a wide-field fluorescence microscope equipped with a water immersion objective (20 ⁇ , NA 1.0, Olympus XLUMPLFLN) was used for imaging. Illumination was delivered using a 525 nm LED (Mightex, LCS-0525-60-22); intensity at the sample, ⁇ 20 mW/mm 2 .
- An mKO/mOrange filter set (530/30 nm (excitation), 575/40 nm (emission), and a 550LP dichroic mirror (Chroma, 49014)) was used for fluorescence imaging of Voltron525. Images were collected using a sCMOS camera (Hamamatsu Orca Flash 4.0 v3) at frame rates of 400-1000 Hz.
- a 0.55 ⁇ magnification camera tube was placed between the objective and the camera for imaging large fields of view of 1064 ⁇ m ⁇ 266 ⁇ m ( FIGS. 7 F- 7 G and FIGS. 27 - 40 ).
- the pixel resolution was 2.08 ⁇ m/pixel.
- a 1 ⁇ camera tube was used for smaller fields of view ( FIGS. 7 B- 7 E and FIG. 25 ).
- the pixel size was 1.04 ⁇ m. Mice were awake and imaged in darkness.
- mice were presented with drifting grating visual stimuli during imaging sessions (spatial frequency: 0.03 cycles/degree, temporal frequency: 1 Hz, trial period: 1 s, and inter-trial interval: 1 s).
- Gratings were shown in blue with a black background. During the inter-trial interval, the screen was black. Eight orientations separated by 45° were presented. Mice were anesthetized during all sessions. To induce anesthesia, chlorprothixene (0.2 mg/ml, 5 ul/g weight mouse) was injected into the hind paw followed by keeping the mouse in a chamber with 2-3% isoflurane for 1-2 minutes. Anesthesia was maintained at 0.4-0.8% isoflurane for the duration of the imaging session. Mice were kept on a heating blanket at a temperature of 37°.
- Spike times were manually selected as large amplitude local minima in the ⁇ F/F trace occurring in periods of depolarization and separated from other local minima by at least 2 ms.
- FIGS. 6 H- 6 L and FIG. 25 Visual responses were calculated as the average number of spikes during the trial for each orientation, averaged over repetitions.
- the ⁇ F/F trace was low-pass filtered at 50 Hz using a median filter.
- the response for each orientation was calculated as the average of the low-pass filtered trace from 100 ms to 400 ms after the trial start.
- the baseline was calculated as the average of the low-pass filtered trace from 80 ms before trial start to 20 ms after the trial start. The baseline was subtracted from the response for each trial and averaged over 20 repetitions.
- the orientation selectivity index ( FIG. 26 ) was calculated as: ( R pref ⁇ R orth )/(
- Spike Pursuit begins with a poorly estimated voltage trace for a neuron, and uses detected spikes to iteratively estimate improved temporal and spatial filters that increase the signal to noise ratio of the spikes while controlling for overfitting.
- Spike pursuit relies on linear methods (the whitened matched filter for temporal filtering, and regularized linear regression for spatial filtering) (39).
- a region of 50 ⁇ 50 pixels centered on the neuron (the ‘context region’, C) was selected for further processing ( FIG. 29 ).
- the data was high-pass filtered (MATLAB filtfilt) in the context region at 0.33 Hz using a 3 rd order Butterworth filter to correct for photobleaching.
- the raw data was also high-pass filtered at 60 Hz using a 3 rd order Butterworth filter; this high-pass filtered movie as was denoted as D N ⁇ T h .
- the initial temporal trace X 0 (t) was the mean of the 0.33 Hz high-pass filtered video over the pixels in the ROI (R):
- X 0 ⁇ ( t ) 1 n ⁇ ( R ) ⁇ ⁇ p ⁇ R ⁇ D p , t ; t ⁇ ⁇ 1 , 2 , ... ⁇ ⁇ T ⁇
- H denotes the set of pixels in the ROI
- n(R) is the number of pixels in the ROI.
- X 0 and the high-pass filtered videos D N ⁇ T and D N ⁇ T h were provided as input to the Spike Pursuit algorithm, which consisted of a two-step loop for each iteration (i):
- Step 1 Spike Time Estimation
- the threshold was chosen as follows: the distribution of local minima P min,i (x) was calculated by kernel density estimation and its median ⁇ was computed. The distribution of the noise P noise,i (x) was estimated by symmetrizing about the median; i.e. setting.
- the threshold was selected as:
- an action potential template Z i (r) was generated as:
- Z i ⁇ ( ⁇ ) 1 n ⁇ ( S i ) ⁇ ⁇ t ⁇ S i ⁇ X i 1 ⁇ ( t + ⁇ ) ; ⁇ ⁇ [ - 20 ⁇ ⁇ ms , 20 ⁇ ⁇ ms ]
- the template Z i ( ⁇ ) was used to perform a whitened matched filter (39) on X i 1 (t), producing the temporally filtered trace X i f (t).
- X i f (t) was again adaptively thresholded to obtain the estimated spike times S i f for iteration i, and regenerate the action potential template, Z i f ( ⁇ ).
- a target trace ⁇ circumflex over (X) ⁇ t (t) was produced by convolving the action potential template with the spike time indicator function:
- w i ( D h* D h + ⁇ ( ⁇ D h ⁇ F 2 ) I ) ⁇ 1 D h* ⁇ circumflex over (X) ⁇ t
- ⁇ D h ⁇ F is the Frobenius norm of the high pass filtered data.
- the regularization parameter ⁇ was selected by cross-validation on one dataset, and fixed for the remaining datasets.
- the Spike Pursuit loop was performed for five iterations.
- each spike time was shifted by a random amount ranging from 2 s to 4 s (minimum of 2 s chosen based on the typical autocorrelation function of the fluorescence traces).
- the spike triggered average of each pair was normalized by the standard deviation of the distribution of shuffled spike triggered averages (gray bar in FIG. 28 C ).
- the ‘modulation’ of one neuron was estimated by another as the L2 norm of the spike triggered average. To z-score this norm, a log-normal distribution was fit to its shuffle distribution. The background color in FIG. 28 A and FIG. 28 C represents this z-score.
- Transgenic zebrafish which expresses Voltron under UAS promoter were generated as follows. A sequence of Voltron (Ace2-HaloTag) was cloned downstream of a 10 ⁇ UAS sequence and the E1B minimal promoter (40). This plasmid was injected into 2-cell stage embryos of Casper mutant zebrafish (41) with mRNA of Tol2 transposase (42) to generate founder (F0) transgenic zebrafish.
- Transgenic zebrafish which expresses Voltron under elavl3 promoter for FIG. 15 were generated as follows. A sequence of Voltron (Ace2-HaloTag) and its soma-localized variant (Ace2-HaloTag-SOM2) was cloned downstream of an elavl3 promoter sequence. This plasmid was injected into 2-cell stage embryos of Casper mutant zebrafish (41) with mRNA of Tol2 transposase (42) to generate founder (F0) transgenic zebrafish. Images of the brains of their embryos (F1) were used for FIG. 20 .
- Imaging experiments were performed using 5- or 6-day larval zebrafish.
- the zebrafish was immobilized and mounted to an imaging chamber as described previously (44) with minor modifications. Briefly, the zebrafish were habituated in an artificial cerebrospinal fluid (ACSF) [in mM: 120 NaCl, 2.9 KCl, 2.1 CaCl2, 1.2 MgCl2, 20 NaHCO 3 , 1.25 NaHPO4, 10 Glucose] bubbled with carbogen gas (95% oxygen, 5% carbon dioxide) for 30 minutes.
- the muscle of the zebrafish was paralyzed by a short (up to 30 seconds) bath incubation with alpha-bungarotoxin (1 mg/ml, Thermo Fischer Scientific, B1601) dissolved in external solution.
- the zebrafish showed robust optomotor behavior in ACSF (bubbled with carbogen gas for 30 minutes before the experiment) for several hours after this treatment.
- the zebrafish was further mounted to a custom-made chamber using 2% agarose (Sigma-Aldrich, A9414) and placed under a light-sheet microscope (45) with a 20 ⁇ objective lens (Olympus, XLUMPLFLN).
- Electrophysiology and imaging of neurons expressing Voltron in Tg(vglut2:Gal4); Tg(UAS: Voltron) transgenic zebrafish were simultaneously performed as described previously (44) with a minor modification.
- Fire-polished borosilicate glass pipettes (Sutter, BF150-75-7.5) were pulled using a heat puller (Sutter, P1000).
- the tip of the pipette was further coated by quantum dots (Ocean Nanotech, QSR-600) using a previously reported method (47).
- the pipette resistance after the quantum dot coating was 10-12 M ⁇ .
- the fish was bathed in an external solution and a small incision on the top of the head was made using a sharp glass needle.
- the pipette was filled with an external solution and inserted into the cerebellum of the brain using a micromanipulator (Sutter, MPC-200), and extracellular spiking signals were recorded from vGlut2-positive neurons in the dorsal part of the cerebellum using cell-attached extracellular recordings.
- These neurons are assumed to be eurydendroid neurons in the cerebellum, homologues of neurons in the deep cerebellar nuclei in mammalian brains (48), based on their previously described anatomical locations (49) and their expression of the vglut2 gene (49).
- Behavioral experiments in zebrafish Recording of fictive swim signals and presentation of visual stimuli were performed as described previously (44, 45). To record swim signals from the axonal bundles of spinal motoneurons in the tail, a pair of large barrel electrodes was attached to the dorsal left and right side of the tail. Signals were amplified by an amplifier (Molecular Devices, AxoClamp 700B) and recorded at 6 KHz using custom software written in C # (Microsoft). For synchronization between the swimming signals and neural activity imaging, camera trigger signals that initiate the acquisition of individual frames in the light-sheet microscope were recorded simultaneously with the swim signals. During the experiments, red visual stimuli (red/black gratings with bars 2 mm thick) was projected to the bottom of the fish chamber.
- red visual stimuli red/black gratings with bars 2 mm thick
- the speed of the moving the visual stimulus alternated between 0 mm/s (stopped) and 2 mm/s (moving forward) every 10 seconds. Every trial (20 seconds) contained a stop period and a forward-motion period. In a subset of tested fish, the forward moving speed was changed from 2 mm/s to 0.5 mm/s every other trial. swimming behavior was continuously recorded for a duration ranging from 6 minutes to 12 minutes (18 to 36 trials).
- Sequences of recorded images were corrected for horizontal drift during the imaging session at the subpixel level with a phase correlation algorithm (51) using a custom Python script and a GPU computing board.
- Weights on the pixels of the above masks were optimized to maximize the signal-to-noise ratio of the voltage signals in individual neurons ( FIG. 42 C ). This is necessary because the light scattering through the tissue during the imaging experiment mixes to a small extent the optical signals across pixels surrounding the cell. This process optimizes the weights on the pixels over the cell to maximize the objective function J:
- Spiking events used for this optimization are detected using the fluorescence time series of the 1 st pixel weights using the same algorithm as described below.
- the final fluorescence time series is obtained by (1) calculating the weighted average of fluorescence values across pixels using the optimized W, (2) subtracting the camera background (i.e., the pixel value when the camera records dark images), and (3) normalizing the resulting time-series by dividing by its baseline time-series, which is a rolling percentile (80% [since Voltron becomes dimmer with increasing voltage, an upper percentile was used instead of a lower percentile used for calcium imaging data], 500-ms time window) of the time-series.
- spiking events were detected for individual neurons using an iterative method that first estimates the subthreshold potential and subtracts it from the raw voltage trace, and secondly estimates spiking events on the resulting trace. These three steps were iterated three times:
- the subthreshold potential was obtained by subtracting the current estimate of the voltage trace attributable to spikes (i.e. the convolution of the estimated spike train s with spike shape k, s*k) from the raw trace followed by low pass filtering to remove the noise. Using a simple Butterworth filter of order 5 with a cutoff at 10 Hz was effective. Subtracting the subthreshold potential yielded the high-frequency component y that consists of voltage transients due to spikes corrupted by noise. 2.
- Spiking events were detected using a method based on adaptive template matching. First, large spiking events were detected using a high threshold (3.5*rolling standard deviation+rolling median, window size of 3 seconds) to avoid false positives.
- the neuron's spike shape was constrained to have non-zero values only in a small window around the time of a spike and was calculated using linear regression of y on s. 3.
- the less clear spike events were detected using this mean spike shape k as a template instead of merely relying on a threshold.
- Potential spike candidates were detected using a low threshold (2.5*rolling standard deviation+rolling median) to avoid false negatives.
- Template matching by regressing y on k yielded the sizes of these candidate events.
- the candidates that were not actual spikes but were merely due to noise had a small size and were iteratively removed with the regression being repeated. After the three outer iterations a reasonable estimate of the spike shape k and the spike times were obtained at frame-rate resolution.
- Step 5 Validation of the Authenticity of the Detected Spikes
- the authenticity of the spike shapes were measured throughout the time-series by measuring the gradient of the voltage trace just before the estimated spiking events. This is based on an assumption that spiking events are always preceded with an increase of subthreshold membrane voltage and that non-spike high-frequency noise does not have this preceding component.
- the gradient of voltage signals from 10 milliseconds to 3.3 milliseconds (3 time points) before the spiking events were quantified for individual spikes.
- Detected spiking events were binned into contiguous blocks of 50 spiking events.
- the gradient values for each block of spiking events were tested for its deviation from zero using a Wilcoxon signed rank test. Spiking events in blocks that had significantly positive gradients (p ⁇ 0.05) are used for subsequent analysis.
- Neurons that were used for analysis in FIG. 8 and FIG. 42 were statistically selected based on their modulation of spiking activity by visual stimuli and behavior. Two criteria were used for this. First, the difference of numbers of spikes in the two task periods (stop, forward visual motion) across multiple trials was tested using Wilcoxon's ranked sum test. Second, the modulation of subthreshold signals at the initiation of swim bouts ( ⁇ 100 ms to 100 ms) was tested across all swim bouts using two-way analysis of variance. Neurons which showed significant differences (p ⁇ 0.05) for both criteria were used for subsequent analyses. A total of 468 neurons from 81 fish were tested, and 179 neurons from 43 fish were used for subsequent analyses.
- FIGS. 8 E and 42 E Mean subthreshold signals and firing rates on FIGS. 8 E and 42 E were smoothed by gamma density causal filters (t*exp( ⁇ t/ ⁇ ) for t>0) with a hyperparameter ⁇ set differently for each panel (3.3 ms for FIG. 8 E and 200 ms for FIG. 42 E ).
- Mitfa w2/w2 roy a9/a9 (Casper) zebrafish were maintained under standard conditions at 28° C. and a 14:10 hr light:dark cycle.
- Embryos (1-2 cell stage) of Tg(elavl3:Gal4-VP16) were injected with 25 ng/ ⁇ l DNA plasmid encoding the Voltron-ST indicator under the control of the 10 ⁇ UAS promoter, and 25 ng/ ⁇ l Tol2 transposase mRNA diluted in E3 medium.
- the injected embryos at three day post-fertilization were incubated in system water containing JF dye-HaloTag ligands (JF 525 , JF 549 , JF 585 or JF 635 ) at 3 ⁇ M for 2 hours and then washed in dye-free system water.
- Larvae at 5 or 6 dpf were screened for the expression of the Voltron-ST based on the fluorescence from JF dye-HaloTag ligands. They were paralyzed by 5-min bath application of 1 mg/ml a-bungarotoxin (Sigma, 203980) and mounted dorsal-side up with 1.5% low-melting point agarose.
- Spontaneously active forebrain and olfactory neurons were imaged using a custom widefield microscope.
- the objective was a 60 ⁇ 1.0 NA water immersion lens (Nikon, MRD07620).
- Fluorophores were excited with a LED light source (Luminus, CBT-90-W for JF 525 , JF 549 and JF 585 , Luminus, CBT-90-RX for JF 635 ) with a proper filter set (Semrock, FITC-A-Basic-000 for JF 525 ; Semrock, Cy3-4040C-000 for JF549 ; Semrock, LED-mCherry-A-000 for JF 585 ; Semrock, LF635-C-000 for JF 635 ).
- a LED light source Luminus, CBT-90-W for JF 525 , JF 549 and JF 585 , Luminus, CBT-90-RX for JF 635
- Voltron signal was acquired as described above but with 40 ⁇ objective lens. After extracting Voltron signal from the patched cell using the procedure described above, the signal was further denoised using wden function in Wavelet Toolbox in MATLAB (Mathworks) to reveal Voltron signal corresponding to small subthreshold voltage changes.
Landscapes
- Chemical & Material Sciences (AREA)
- General Physics & Mathematics (AREA)
- Physics & Mathematics (AREA)
- Organic Chemistry (AREA)
- Health & Medical Sciences (AREA)
- Life Sciences & Earth Sciences (AREA)
- Biochemistry (AREA)
- General Health & Medical Sciences (AREA)
- Genetics & Genomics (AREA)
- Proteomics, Peptides & Aminoacids (AREA)
- Molecular Biology (AREA)
- Medicinal Chemistry (AREA)
- Engineering & Computer Science (AREA)
- Bioinformatics & Cheminformatics (AREA)
- General Engineering & Computer Science (AREA)
- Wood Science & Technology (AREA)
- Zoology (AREA)
- Biophysics (AREA)
- Gastroenterology & Hepatology (AREA)
- Investigating Or Analysing Biological Materials (AREA)
- Investigating, Analyzing Materials By Fluorescence Or Luminescence (AREA)
Abstract
Description
| TABLE 1 |
| Voltron525 and Ace2N-mNeon kinetics in primary neuron culture cells |
| Activation | Deactivation | |
| (−70 mV to 30 mV) | (30 mV to −70 mV) |
| τfast (ms) | τslow (ms) | % fast | τfast (ms) | τslow (ms) | % fast | |
| Ace2N- | 0.59 ± 0.10 | 6.9 ± 0.5 | 62 ± 3 | 0.63 ± 0.09 | 6.0 ± 1.1 | 55 ± 4 |
| mNeon | ||||||
| Voltron- | 0.64 ± 0.09 | 4.1 ± 0.6 | 61 ± 4 | 0.78 ± 0.12 | 3.9 ± 0.2 | 55 ± 7 |
| JF525 | ||||||
| Neurons expressing Ace2N-mNeon and Voltron525 were imaged at 3.2 kHz during whole cell voltage clamp as detailed in the methods section. Fluorescence traces were then fit using a double exponential model (FIG. 11). Errors are s.e.m. n = 7 cells for Ace-mNeon and n = 8 cells for Voltron525. | ||||||
| TABLE 2 |
| Photophysical properties of parent fluorophore HaloTag-bound JFdyes and green |
| fluorescent proteins (mean values, n = 9) |
| Fluoro- | λabs | λem | εmax | W (a) | τ1 (A1) (b) | τ2 (A2) | <τb > (c) | τ1/2 (f) | |||
| phore | (nm) | (nm) | (mM−1cm−1) | Φfl | (sec−1) | (sec) | (sec) | (sec) | Pb/10−6 (d) | Nph/105 (e) | (sec) |
| JF505 | 509 | 531 | 56.8 | 0.83 | 941 | 59 (0.59) | 264 (0.41) | 144 | 7.36 | 1.13 | 51 |
| JF525 | 532 | 553 | 83.6 | 0.87 | 1,549 | 329 (1.0) | 330 | 1.96 | 4.43 | 336 | |
| JF549 | 555 | 578 | 91.3 | 0.86 | 3,158 | 907 (0.65) | 124 (0.35) | 633 | 0.50 | 17.2 | 804 |
| JF585 | 593 | 611 | 109 | 0.83 | 4,443 | 931 (1.0) | 950 | 0.24 | 35.1 | 3,320 | |
| JF635 | 641 | 656.5 | 64.0 | 0.7 | 2,486 | 1976 (1.0) | 1,980 | 0.20 | 34.4 | 3,130 | |
| sfGFP | 488 | 511 | 51.5 | 0.66 | 1,597 | 90 (0.66) | 167 (0.34) | 117 | 5.32 | 1.24 | 71 |
| mNeon | 506 | 517.5 | 120 | 0.85 | 1,773 | 102 (0.72) | 144 (0.28) | 114 | 4.83 | 1.80 | 118 |
| (a) Excitation rate (absorbed photons/sec) equal to the integral over wavelength of the product of extinction coefficient and spectral irradiance. | |||||||||||
| (b) Decay constant (normalized amplitude) of multi-exponential fit to the photobleaching decay curve. | |||||||||||
| (c) Amplitude-weighted lifetime equal to A1 τ1 + A2τ2. | |||||||||||
| (d) Calculated probability of photobleaching per absorbed photon. | |||||||||||
| (e) Calculated number of photons emitted per molecule before photobleaching. | |||||||||||
| (f) Calculated time to bleach from a rate of 1000 to 500 photons per sec per molecule. | |||||||||||
| TABLE 3 |
| Photobleaching properties of GEVI sensors in neuronal cell culture (mean values, n = 5) |
| W (a) | T1 (A1) (b) | T2 (A2) | <τb> (c) | T1/2 (f) | |||
| sensor | (sec−1) | (sec) | (sec) | (sec) | Pb/10−6 (d) | Nph/105 (e) | (sec) |
| Voltron525 | 1,549 | 171 (0.84) | 1497 (0.15) | 373 | 1.74 | 5.03 | 206 |
| Voltron549 | 3,158 | 675 (0.67) | 61.5 (0.31) | 471 | 0.672 | 12.8 | 538 |
| ASAP-2f | 1,597 | 400 (0.68) | 24.9 (0.30) | 281 | 2.23 | 2.96 | 132 |
| Ace2N-mNeon | 1,773 | 118 (0.88) | 147 (0.11) | 120 | 4.70 | 1.81 | 119 |
| (a) Excitation rate (absorbed photons/sec) equal to the integral over wavelength of the product of extinction coefficient and spectral irradiance. | |||||||
| (b) Decay constant (normalized amplitude) of multi-exponential fit to the photobleaching decay curve. | |||||||
| (c) Amplitude-weighted lifetime equal to A1 τ1 + A2τ2. | |||||||
| (d) Calculated probability of photobleaching per absorbed photon. | |||||||
| (e) Calculated number of photons emitted per molecule before photobleaching. | |||||||
| (f) Calculated time to bleach from a rate of 1000 to 500 photons per sec per molecule. | |||||||
where ϕf is the fluorescence quantum yield and W is the excitation rate. To determine Np, the fit function F(t) was integrated over time, where initially F0≡ϕfW,
N p=ϕf W(A 1τ1 +A 2τ2)=ϕf W
where <τb> is the amplitude-weighted lifetime (31, 32)
P b=1/W
Of the three photobleaching quantities above, the photobleaching probability is most rigorous as it is independent of the fluorescence quantum yield.
Spike times were manually selected as large amplitude local minima in the ΔF/F trace occurring in periods of depolarization and separated from other local minima by at least 2 ms.
(R pref −R orth)/(|R pref |+|R orth|)
where Rpref is the response (mean spikes in trial or mean subthreshold membrane potential) to the preferred orientation, and Rorth is the response to the orientation 90° away from the preferred orientation.
where H denotes the set of pixels in the ROI, n(R) is the number of pixels in the ROI. X0 and the high-pass filtered videos DN×T and DN×T h were provided as input to the Spike Pursuit algorithm, which consisted of a two-step loop for each iteration (i):
D M×T b =U M×MΣM×T V T×T *
b i=(V 8 *V 8)−1 V 8 *X i-1
where V8 is the first eight columns of V; bi are the regression coefficients. The trace Xi-1(t) was denoised by subtracting the contribution of background pixels:
X i 1 =X i-1 −V 8 b i
Xi 1(t) was high-pass filtered at 60 Hz using a third order Butterworth filter. Local minima in the filtered trace below a threshold si were selected as an initial estimate of spike times. The threshold was chosen as follows: the distribution of local minima Pmin,i(x) was calculated by kernel density estimation and its median μ was computed. The distribution of the noise Pnoise,i(x) was estimated by symmetrizing about the median; i.e. setting.
Thus, the initial estimate of spike times was
S i ={t|X i 1(t)<s i ,X i 1(t)>X i 1(t+1),
X i 1(t)<X i 1(t−1)}.
The template Zi(τ) was used to perform a whitened matched filter (39) on Xi 1(t), producing the temporally filtered trace Xi f(t). Xi f(t) was again adaptively thresholded to obtain the estimated spike times Si f for iteration i, and regenerate the action potential template, Zi f(τ).
A spatial filter wiN×(was estimated by ridge regression of the target trace {circumflex over (X)}t against DN×T h (
w i=(D h* D h+λ(∥D h∥F 2)I)−1 D h* {circumflex over (X)} t
Where ∥Dh∥F is the Frobenius norm of the high pass filtered data. The regularization parameter λ was selected by cross-validation on one dataset, and fixed for the remaining datasets. The activity trace corresponding to the spatial filter was calculated:
X i =Dw i
The Spike Pursuit loop was performed for five iterations. As a final step, the contribution of pixels was removed from a ‘global background’ (G), defined as the entire field of view excluding all pixels less than 12 pixels away from any ROI, with L=n(G) pixels. The SVD of the global background movie was high pass filtered at 0.3 Hz, DL×T g:
D L×T g =U L×L gΣL×T g V T×T g*
b g=(V 8 g* V 8 g)−1 V 8 g* X 5
X final =X 5 −V 8 g b g
Global background subtraction removes fluorescence fluctuations that are shared across most pixels of the movie. It remains unclear to what degree these fluctuations reflect shared membrane potential transients versus other sources of shared variability. Traces without global background subtraction (X5) are shown in
To calculate the shuffled distribution of spike triggered averages, each spike time was shifted by a random amount ranging from 2 s to 4 s (minimum of 2 s chosen based on the typical autocorrelation function of the fluorescence traces). The spike triggered average of each pair was normalized by the standard deviation of the distribution of shuffled spike triggered averages (gray bar in
where W is a matrix of weights over pixels, Var(F) is a variance of a weighted mean fluorescence time-series of candidate pixels using W, E(Fs) is the average of the weighted mean fluorescent values at the time of detected spikes, and ∥W∥∥2 is the L2 norm of the pixel weights for regularization. This objective function measures the ratio between the mean heights of the spikes and the noise level of the estimated fluorescence time-series of a cell. Pixel weights W are optimized so that they maximize the objective function J using a gradient ascent method. Spiking events used for this optimization are detected using the fluorescence time series of the 1st pixel weights using the same algorithm as described below. The final fluorescence time series is obtained by (1) calculating the weighted average of fluorescence values across pixels using the optimized W, (2) subtracting the camera background (i.e., the pixel value when the camera records dark images), and (3) normalizing the resulting time-series by dividing by its baseline time-series, which is a rolling percentile (80% [since Voltron becomes dimmer with increasing voltage, an upper percentile was used instead of a lower percentile used for calcium imaging data], 500-ms time window) of the time-series.
2. Spiking events were detected using a method based on adaptive template matching. First, large spiking events were detected using a high threshold (3.5*rolling standard deviation+rolling median, window size of 3 seconds) to avoid false positives. The neuron's spike shape was constrained to have non-zero values only in a small window around the time of a spike and was calculated using linear regression of y on s.
3. The less clear spike events were detected using this mean spike shape k as a template instead of merely relying on a threshold. Potential spike candidates were detected using a low threshold (2.5*rolling standard deviation+rolling median) to avoid false negatives. Template matching by regressing y on k yielded the sizes of these candidate events. The candidates that were not actual spikes but were merely due to noise had a small size and were iteratively removed with the regression being repeated. After the three outer iterations a reasonable estimate of the spike shape k and the spike times were obtained at frame-rate resolution.
- 1. T. W. Chen et al., Ultrasensitive fluorescent proteins for imaging neuronal activity. Nature. 499, 295-300 (2013).
- 2. K. Svoboda, W. Denk, D. Kleinfeld, D. W. Tank, In vivo dendritic calcium dynamics in neocortical pyramidal neurons. Nature. 385, 161-165 (1997).
- 3. V. Emiliani, A. E. Cohen, K. Deisseroth, M. Hausser, All-optical interrogation of neural circuits. J. Neurosci. 35, 13917-13926 (2015).
- 4. Y. Xu, P. Zou, A. E. Cohen, Voltage imaging with genetically encoded indicators. Curr. Opin. Chem. Biol. 39, 1-10 (2017).
- 5. M. Z. Lin, M. J. Schnitzer, Genetically encoded indicators of neuronal activity. Nat. Neurosci. 19 (2016), pp. 1142-1153.
- 6. J. M. Kralj, A. D. Douglass, D. R. Hochbaum, D. Maclaurin, A. E. Cohen, Optical recording of action potentials in mammalian neurons using a microbial rhodopsin. Nat. Methods. 9, 90-95 (2011).
- 7. D. R. Hochbaum et al., All-optical electrophysiology in mammalian neurons using engineered microbial rhodopsins. Nat. Methods. 11, 825-833 (2014).
- 8. Y. Adam et al., All-optical electrophysiology reveals brain-state dependent changes in hippocampal subthreshold dynamics and excitability. bioRxiv (2018), doi:10.1101/281618.
- 9. L. Jin et al., Single action potentials and subthreshold electrical events imaged in neurons with a fluorescent protein voltage probe. Neuron. 75, 779-785 (2012).
- 10. P. Zou et al., Bright and fast multicoloured voltage reporters via electrochromic FRET. Nat. Commun. 5, 4625 (2014).
- 11. 4. Y. Gong et al., High-speed recording of neural spikes in awake mice and flies with a fluorescent voltage sensor. Science. 350, 1361-1366 (2015).
- 12. A. S. Abdelfattah et al., A bright and fast red fluorescent protein voltage indicator that reports neuronal activity in organotypic brain slices. J. Neurosci. 36, 2458-2472 (2016).
- 13. H. H. H. Yang et al., Subcellular Imaging of Voltage and Calcium Signals Reveals Neural Processing In Vivo. Cell. 166, 245-257 (2016).
- 14. J. B. Grimm et al., A general method to improve fluorophores for live-cell and single-molecule microscopy. Nat. Methods. 12, 244-250 (2015).
- 15. G. V. Los et al., HaloTag: A novel protein labeling technology for cell imaging and protein analysis. ACS Chem. Biol. 3, 373-382 (2008).
- 16. L. P. Encell et al., Development of a dehalogenase-based protein fusion tag capable of rapid, selective and covalent attachment to customizable ligands. Curr. Chem. Genomics. 6, 55-71 (2012).
- 17. J. B. Grimm et al., A general method to fine-tune fluorophores for live-cell and in vivo imaging. Nat. Methods. 14, 987 (2017).
- 18. Y. Gong, M. J. Wagner, J. Zhong Li, M. J. Schnitzer, Imaging neural spiking in brain tissue using FRET-opsin protein voltage sensors. Nat. Commun. 5, 3674 (2014).
- 19. J. M. Kralj, D. R. Hochbaum, A. D. Douglass, A. E. Cohen, Electrical spiking in Escherichia coli probed with a fluorescent voltage-indicating protein. Science (80,). 333, 345-348 (2011).
- 20. T. Wada et al., Crystal structure of the eukaryotic light-driven proton-pumping rhodopsin, Acetabularia rhodopsin II, from marine alga. J. Mol. Biol. 411, 986-998 (2011).
- 21. A. Keppler et al., A general method for the covalent labeling of fusion proteins with small molecules in vivo. Nat. Biotechnol. 21, 86-89 (2003).
- 22. C. A. Baker, Y. M. Elyada, A. Parra, M. M. L. Bolton, Cellular resolution circuit mapping with temporal-focused excitation of soma-targeted channel rhodopsin. Elife. 5, 1-15 (2016).
- 23. S. T. Lim, D. E. Antonucci, R. H. Scannevin, J. S. Trimmer, A novel targeting signal for proximal clustering of the Kv2.1 K+channel in hippocampal neurons. Neuron. 25, 385-397 (2000).
- 24. S. L. Smith, I. T. Smith, T. Branco, M. Häusser, Dendritic spikes enhance stimulus selectivity in cortical neurons in vivo. Nature. 503, 115-120 (2013).
- 25. B. Tasic et al., Adult mouse cortical cell taxonomy revealed by single cell transcriptomics. Nat. Neurosci. 19, 335-346 (2016).
- 26. M. B. Ahrens et al., Brain-wide neuronal dynamics during motor adaptation in zebrafish. Nature. 485, 471-7 (2012).
- 27. T. Hige, Y. Aso, G. M. Rubin, G. C. Turner, Plasticity-driven individualization of olfactory coding in mushroom body output neurons. Nature. 526, 258-262 (2015).
- 28. A. Wang, J. Feng, Y. Li, P. Zou, Beyond fluorescent proteins: hybrid and bioluminescent indicators for imaging neural activities. ACS Chem. Neurosci. 9, 639-650 (2018).
- 29. L. A. Gross, G. S. Baird, R. C. Hoffman, K. K. Baldridge, R. Y. Tsien, The structure of the chromophore within DsRed, a red fluorescent protein from coral. Proc. Natl. Acad. Sci. 97, 11990-11995 (2000).
- 30. N. C. Shaner, P. A. Steinbach, R. Y. Tsien, A guide to choosing fluorescent proteins. Nat. Methods. 2, 905-909 (2005).
- 31. D. Wüstner, T. Christensen, L. M. Solanko, D. Sage, Photobleaching kinetics and time-integrated emission of fluorescent probes in cellular membranes. Molecules. 19, 11096-11130 (2014).
- 32. J. R. Lakowicz, Principles of Fluorescence Spectroscopy (Springer New York, N.Y., 2006).
- 33. S. J. Lord et al., DCDHF fluorophores for single-molecule imaging in cells. ChemPhysChem. 10, 55-65 (2009).
- 34. C. Eggeling, A. Volkmer, C. A. M. Seidel, Molecular photobleaching kinetics of Rhodamine 6G by one- and two-photon induced confocal fluorescence microscopy. ChemPhysChem. 6, 791-804 (2005).
- 35. T. J. Wardill et al., A Neuron-Based Screening Platform for Optimizing Genetically-Encoded Calcium Indicators. PLoS One. 8, 1-12 (2013).
- 36. D. A. Dombeck, C. D. Harvey, L. Tian, L. L. Looger, D. W. Tank, Functional imaging of hippocampal place cells at cellular resolution during virtual navigation. Nat. Neurosci. 13, 1433-1440 (2010).
- 37. T. Yardeni, M. Eckhaus, H. D. Morris, M. Huizing, S. Hoogstraten-Miller, Retro-orbital injections in mice. Lab Anim. (NY). 40, 155-160 (2011).
- 38. P. Thévenaz, U. E. Ruttimann, M. Unser, A pyramid approach to subpixel registration based on intensity. IEEE Trans. Image Process. 7, 27-41 (1998).
- 39. F. Franke, R. Quian Quiroga, A. Hierlemann, K. Obermayer, Bayes optimal template matching for spike sorting-combining fisher discriminant analysis with optimal filtering. J. Comput. Neurosci. 38, 439-459 (2015).
- 40. R. W. Koster, S. E. Fraser, Tracing Transgene Expression in Living Zebrafish Embryos. Dev. Biol. 233, 329-346 (2001).
- 41. R. M. White et al., Transparent Adult Zebrafish as a Tool for In Vivo Transplantation Analysis. Cell Stem Cell. 2, 183-189 (2008).
- 42. K. Kawakami et al., A transposon-mediated gene trap approach identifies developmentally regulated genes in zebrafish. Dev. Cell. 7, 133-44 (2004).
- 43. C. Satou et al., Transgenic tools to characterize neuronal properties of discrete populations of zebrafish neurons. Development. 140, 3927-31 (2013).
- 44. T. Kawashima et al., The Serotonergic System Tracks the Outcomes of Actions to Mediate Short-Term Motor Learning. Cell. 167, 933-946.e20 (2016).
- 45. N. Vladimirov et al., Light-sheet functional imaging in fictively behaving zebrafish. Nat. Methods. 11, 883-884 (2014).
- 46. N. Vladimirov et al., Light-sheet functional imaging in fictively behaving zebrafish. Nat.
Methods 11, 883-884 (2014). - 47. B. K. Andrásfalvy et al., Quantum dot-based multiphoton fluorescent pipettes for targeted neuronal electrophysiology. Nat. Methods. 11, 1237-1241 (2014).
- 48. Y.-K. Bae et al., Anatomy of zebrafish cerebellum and screen for mutations affecting its development. Dev. Biol. 330, 406-26 (2009).
- 49. M. Takeuchi et al., Establishment of Gal4 transgenic zebrafish lines for analysis of development of cerebellar neural circuitry. Dev. Biol. 397, 1-17 (2015).
- 50. M. B. Ahrens et al., Brain-wide neuronal dynamics during motor adaptation in zebrafish. Nature. 485, 471-7 (2012).
- 51. M. Guizar-Sicairos, S. T. Thurman, J. R. Fienup, Efficient subpixel image registration algorithms. Opt. Lett. 33, 156 (2008).
- 52. Y. Aso et al., The neuronal architecture of the mushroom body provides a logic for associative learning. Elife. 3, e04577 (2014).
- 53. M. Murthy, G. Turner, Dissection of the head cuticle and sheath of living flies for whole-cell patch-clamp recordings in the brain. Cold Spring Harb. Protoc. 8, 134-139 (2013).
- 54. R. I. Wilson, G. C. Turner, G. Laurent, Transformation of Olfactory Drosophila Antennal Lobe. Science (80-.). 303, 366-370 (2004).
- 55. F. St-Pierre et al., High-fidelity optical reporting of neuronal electrical activity with an ultrafast fluorescent voltage sensor. Nat. Neurosci. 17, 884-889 (2014).
- 56. O. Randlett et al., Whole-brain activity mapping onto a zebrafish brain atlas. Nat. Methods. 12, 1039-1046 (2015).
- 57. S. Chamberland et al., Fast two-photon imaging of subcellular voltage dynamics in neuronal tissue with genetically encoded indicators. Elife. 6, e25690 (2017).
- 58. Govorunova, E. G., et al., Microbial Rhodopsins: Diversity, Mechanisms, and Optogenetic Applications. Annu Rev Biochm. 86, 845-872 (2017).
- 59. Beja, O., et al. Proteorhodopsin phototrophy in the ocean. Nature 411, 786-789 (2001)
- 60. U.S. Patent Application Publication NO. 2020/0123218 for “OPTOGENETIC PROBES FOR MEASURING MEMBRANE POTENTIAL.”
- 61. U.S. Pat. Nos. 9,933,417, 10,018,624, 10,161,932, and 10,495,632.
| SEQUENCE LISTING | |
| SEQ ID NO: 1 - DNA sequence of Voltron D92N | |
| ATGGCTGACGTGGAAACCGAGACCGGCATGATTGCACAGTGGATTGTCTTTGCTATT | |
| ATGGCTGCTGCTGCTATTGCTTTTGGAGTGGCTGTGCACTTTCGGCCTTCAGAGCTG | |
| AAGAGCGCATACTATATCAACATTGCCATCTGCACTATCGCCGCTACCGCTTACTAT | |
| GCAATGGCCGTGAACTACCAGGACCTGACAATGAATGGTGAAAGGCAGGTGGTCTAC | |
| GCAAGATATATTAACTGGGTGCTGACCACACCACTGCTCCTGCTCAACCTCATCGTC | |
| ATGACCAAGATGGGCGGAGTGATGATTTCTTGGGTCATCGGCGCAGACATTTTCATG | |
| ATCGTGTTTGGTATTCTGGGCGCCTTCGAGGATGAACACAAGTTCAAATGGGTGTAC | |
| TTTATCGCTGGATGTGTGATGCAGGCAGTCCTGACATACGGGATGTATAACGCCACT | |
| TGGAAAGACGATCTGAAGAAAAGCCCCGAGTACCATAGCTCCTATGTCAGTCTGCTC | |
| GTCTTCCTGTCAATCCTCTGGGTGTTTTATCCTGTCGTGTGGGCTTTCGGGTCTGGT | |
| AGTGGCGTGCTGTCCGTCGACAATGAGGCCATTCTCATGGGAATCCTGGATGTGCTC | |
| GCTAAGCCACTGTTTGGAATGGGGTGCCTCATTGCCCATGAGACTATCTTCAAGATC | |
| GGTACTGGCTTTCCATTCGACCCCCATTATGTGGAAGTCCTGGGCGAGCGCATGCAC | |
| TACGTCGATGTTGGTCCGCGCGATGGCACCCCTGTGCTGTTCCTGCACGGTAACCCG | |
| ACCTCCTCCTACGTGTGGCGCAACATCATCCCGCATGTTGCACCGACCCATCGCTGC | |
| ATTGCTCCAGACCTGATCGGTATGGGCAAATCCGACAAACCAGACCTGGGTTATTTC | |
| TTCGACGACCACGTCCGCTTCATGGATGCCTTCATCGAAGCCCTGGGTCTGGAAGAG | |
| GTCGTCCTGGTCATTCACGACTGGGGCTCCGCTCTGGGTTTCCACTGGGCCAAGCGC | |
| AATCCAGAGCGCGTCAAAGGTATTGCATTTATGGAGTTCATCCGCCCTATCCCGACC | |
| TGGGACGAATGGCCAGAATTTGCCCGCGAGACCTTCCAGGCCTTCCGCACCACCGAC | |
| GTCGGCCGCAAGCTGATCATCGATCAGAACGTTTTTATCGAGGGTACGCTGCCGATG | |
| GGTGTCGTCCGCCCGCTGACTGAAGTCGAGATGGACCATTACCGCGAGCCGTTCCTG | |
| AATCCTGTTGACCGCGAGCCACTGTGGCGCTTCCCAAACGAGCTGCCAATCGCCGGT | |
| GAGCCAGCGAACATCGTCGCGCTGGTCGAAGAATACATGGACTGGCTGCACCAGTCC | |
| CCTGTCCCGAAGCTGCTGTTCTGGGGCACCCCAGGCGTTCTGATCCCACCGGCCGAA | |
| GCCGCTCGCCTGGCCAAAAGCCTGCCTAACTGCAAGGCTGTGGACATCGGCCCGGGT | |
| CTGAATCTGCTGCAAGAAGACAACCCGGACCTGATCGGCAGCGAGATCGCGCGCTGG | |
| CTGTCGACGCTCGAGATTTCCGGCGAGCCAACCACTAAGAGCAGGATCACCAGCGAG | |
| GGCGAGTACATCCCCCTGGACCAGATCGACATCAACGTGTTCTGCTACGAGAACGAG | |
| GTGTAA | |
| SEQ ID NO: 2 - Protein sequence of Voltron D92N | |
| MADVETETGMIAQWIVFAIMAAAAIAFGVAVHFRPSELKSAYYINIAICTIAATAYY | |
| AMAVNYQDLTMNGERQVVYARYINWVLTTPLLLLNLIVMTKMGGVMISWVIGADIFM | |
| IVFGILGAFEDEHKFKWVYFIAGCVMQAVLTYGMYNATWKDDLKKSPEYHSSYVSLL | |
| VFLSILWVEYPVVWAFGSGSGVLSVDNEAILMGILDVLAKPLEGMGCLIAHETIFKI | |
| GTGFPFDPHYVEVLGERMHYVDVGPRDGTPVLFLHGNPTSSYVWRNIIPHVAPTHRC | |
| IAPDLIGMGKSDKPDLGYFFDDHVREMDAFIEALGLEEVVLVIHDWGSALGFHWAKR | |
| NPERVKGIAFMEFIRPIPTWDEWPEFARETFQAFRTTDVGRKLIIDQNVFIEGTLPM | |
| GVVRPLTEVEMDHYREPFLNPVDREPLWRFPNELPIAGEPANIVALVEEYMDWLHQS | |
| PVPKLLFWGTPGVLIPPAEAARLAKSLPNCKAVDIGPGLNLLQEDNPDLIGSEIARW | |
| LSTLEISGEPTTKSRITSEGEYIPLDQIDINVFCYENEV* | |
| SEQ ID NO: 3 - DNA sequence of Voltron N81D D92N | |
| ATGGCTGACGTGGAAACCGAGACCGGCATGATTGCACAGTGGATTGTCTTTGCTATT | |
| ATGGCTGCTGCTGCTATTGCTTTTGGAGTGGCTGTGCACTTTCGGCCTTCAGAGCTG | |
| AAGAGCGCATACTATATCAACATTGCCATCTGCACTATCGCCGCTACCGCTTACTAT | |
| GCAATGGCCGTGAACTACCAGGACCTGACAATGAATGGTGAAAGGCAGGTGGTCTAC | |
| GCAAGATATATTGACTGGGTGCTGACCACACCACTGCTCCTGCTCAACCTCATCGTC | |
| ATGACCAAGATGGGCGGAGTGATGATTTCTTGGGTCATCGGCGCAGACATTTTCATG | |
| ATCGTGTTTGGTATTCTGGGCGCCTTCGAGGATGAACACAAGTTCAAATGGGTGTAC | |
| TTTATCGCTGGATGTGTGATGCAGGCAGTCCTGACATACGGGATGTATAACGCCACT | |
| TGGAAAGACGATCTGAAGAAAAGCCCCGAGTACCATAGCTCCTATGTCAGTCTGCTC | |
| GTCTTCCTGTCAATCCTCTGGGTGTTTTATCCTGTCGTGTGGGCTTTCGGGTCTGGT | |
| AGTGGCGTGCTGTCCGTCGACAATGAGGCCATTCTCATGGGAATCCTGGATGTGCTC | |
| GCTAAGCCACTGTTTGGAATGGGGTGCCTCATTGCCCATGAGACTATCTTCAAGATC | |
| GGTACTGGCTTTCCATTCGACCCCCATTATGTGGAAGTCCTGGGCGAGCGCATGCAC | |
| TACGTCGATGTTGGTCCGCGCGATGGCACCCCTGTGCTGTTCCTGCACGGTAACCCG | |
| ACCTCCTCCTACGTGTGGCGCAACATCATCCCGCATGTTGCACCGACCCATCGCTGC | |
| ATTGCTCCAGACCTGATCGGTATGGGCAAATCCGACAAACCAGACCTGGGTTATTTC | |
| TTCGACGACCACGTCCGCTTCATGGATGCCTTCATCGAAGCCCTGGGTCTGGAAGAG | |
| GTCGTCCTGGTCATTCACGACTGGGGCTCCGCTCTGGGTTTCCACTGGGCCAAGCGC | |
| AATCCAGAGCGCGTCAAAGGTATTGCATTTATGGAGTTCATCCGCCCTATCCCGACC | |
| TGGGACGAATGGCCAGAATTTGCCCGCGAGACCTTCCAGGCCTTCCGCACCACCGAC | |
| GTCGGCCGCAAGCTGATCATCGATCAGAACGTTTTTATCGAGGGTACGCTGCCGATG | |
| GGTGTCGTCCGCCCGCTGACTGAAGTCGAGATGGACCATTACCGCGAGCCGTTCCTG | |
| AATCCTGTTGACCGCGAGCCACTGTGGCGCTTCCCAAACGAGCTGCCAATCGCCGGT | |
| GAGCCAGCGAACATCGTCGCGCTGGTCGAAGAATACATGGACTGGCTGCACCAGTCC | |
| CCTGTCCCGAAGCTGCTGTTCTGGGGCACCCCAGGCGTTCTGATCCCACCGGCCGAA | |
| GCCGCTCGCCTGGCCAAAAGCCTGCCTAACTGCAAGGCTGTGGACATCGGCCCGGGT | |
| CTGAATCTGCTGCAAGAAGACAACCCGGACCTGATCGGCAGCGAGATCGCGCGCTGG | |
| CTGTCGACGCTCGAGATTTCCGGCGAGCCAACCACTAAGAGCAGGATCACCAGCGAG | |
| GGCGAGTACATCCCCCTGGACCAGATCGACATCAACGTGTTCTGCTACGAGAACGAG | |
| GTGTAA | |
| SEQ ID NO: 4 - Protein sequence of N81D D92N | |
| MADVETETGMIAQWIVFAIMAAAAIAFGVAVHFRPSELKSAYYINIAICTIAATAYY | |
| AMAVNYQDLTMNGERQVVYARYIDWVLTTPLLLLNLIVMTKMGGVMISWVIGADIFM | |
| IVFGILGAFEDEHKFKWVYFIAGCVMQAVLTYGMYNATWKDDLKKSPEYHSSYVSLL | |
| VFLSILWVFYPVVWAFGSGSGVLSVDNEAILMGILDVLAKPLFGMGCLIAHETIFKI | |
| GTGFPFDPHYVEVLGERMHYVDVGPRDGTPVLFLHGNPTSSYVWRNIIPHVAPTHRC | |
| IAPDLIGMGKSDKPDLGYFFDDHVRFMDAFIEALGLEEVVLVIHDWGSALGFHWAKR | |
| NPERVKGIAFMEFIRPIPTWDEWPEFARETFQAFRTTDVGRKLIIDQNVFIEGTLPM | |
| GVVRPLTEVEMDHYREPFLNPVDREPLWRFPNELPIAGEPANIVALVEEYMDWLHQS | |
| PVPKLLFWGTPGVLIPPAEAARLAKSLPNCKAVDIGPGLNLLQEDNPDLIGSEIARW | |
| LSTLEISGEPTTKSRITSEGEYIPLDQIDINVFCYENEV* | |
| SEQ ID NO: 5 - DNA sequence of Voltron N81D D92N E199V | |
| ATGGCTGACGTGGAAACCGAGACCGGCATGATTGCACAGTGGATTGTCTTTGCTATT | |
| ATGGCTGCTGCTGCTATTGCTTTTGGAGTGGCTGTGCACTTTCGGCCTTCAGAGCTG | |
| AAGAGCGCATACTATATCAACATTGCCATCTGCACTATCGCCGCTACCGCTTACTAT | |
| GCAATGGCCGTGAACTACCAGGACCTGACAATGAATGGTGAAAGGCAGGTGGTCTAC | |
| GCAAGATATATTGACTGGGTGCTGACCACACCACTGCTCCTGCTCAACCTCATCGTC | |
| ATGACCAAGATGGGCGGAGTGATGATTTCTTGGGTCATCGGCGCAGACATTTTCATG | |
| ATCGTGTTTGGTATTCTGGGCGCCTTCGAGGATGAACACAAGTTCAAATGGGTGTAC | |
| TTTATCGCTGGATGTGTGATGCAGGCAGTCCTGACATACGGGATGTATAACGCCACT | |
| TGGAAAGACGATCTGAAGAAAAGCCCCGAGTACCATAGCTCCTATGTCAGTCTGCTC | |
| GTCTTCCTGTCAATCCTCTGGGTGTTTTATCCTGTCGTGTGGGCTTTCGGGTCTGGT | |
| AGTGGCGTGCTGTCCGTCGACAATGTGGCCATTCTCATGGGAATCCTGGATGTGCTC | |
| GCTAAGCCACTGTTTGGAATGGGGTGCCTCATTGCCCATGAGACTATCTTCAAGATC | |
| GGTACTGGCTTTCCATTCGACCCCCATTATGTGGAAGTCCTGGGCGAGCGCATGCAC | |
| TACGTCGATGTTGGTCCGCGCGATGGCACCCCTGTGCTGTTCCTGCACGGTAACCCG | |
| ACCTCCTCCTACGTGTGGCGCAACATCATCCCGCATGTTGCACCGACCCATCGCTGC | |
| ATTGCTCCAGACCTGATCGGTATGGGCAAATCCGACAAACCAGACCTGGGTTATTTC | |
| TTCGACGACCACGTCCGCTTCATGGATGCCTTCATCGAAGCCCTGGGTCTGGAAGAG | |
| GTCGTCCTGGTCATTCACGACTGGGGCTCCGCTCTGGGTTTCCACTGGGCCAAGCGC | |
| AATCCAGAGCGCGTCAAAGGTATTGCATTTATGGAGTTCATCCGCCCTATCCCGACC | |
| TGGGACGAATGGCCAGAATTTGCCCGCGAGACCTTCCAGGCCTTCCGCACCACCGAC | |
| GTCGGCCGCAAGCTGATCATCGATCAGAACGTTTTTATCGAGGGTACGCTGCCGATG | |
| GGTGTCGTCCGCCCGCTGACTGAAGTCGAGATGGACCATTACCGCGAGCCGTTCCTG | |
| AATCCTGTTGACCGCGAGCCACTGTGGCGCTTCCCAAACGAGCTGCCAATCGCCGGT | |
| GAGCCAGCGAACATCGTCGCGCTGGTCGAAGAATACATGGACTGGCTGCACCAGTCC | |
| CCTGTCCCGAAGCTGCTGTTCTGGGGCACCCCAGGCGTTCTGATCCCACCGGCCGAA | |
| GCCGCTCGCCTGGCCAAAAGCCTGCCTAACTGCAAGGCTGTGGACATCGGCCCGGGT | |
| CTGAATCTGCTGCAAGAAGACAACCCGGACCTGATCGGCAGCGAGATCGCGCGCTGG | |
| CTGTCGACGCTCGAGATTTCCGGCGAGCCAACCACTAAGAGCAGGATCACCAGCGAG | |
| GGCGAGTACATCCCCCTGGACCAGATCGACATCAACGTGTTCTGCTACGAGAACGAG | |
| GTGTAA | |
| SEQ ID NO: 6 -Protein sequence of Voltron N81D D92N | |
| E199V | |
| MADVETETGMIAQWIVFAIMAAAAIAFGVAVHFRPSELKSAYYINIAICTIAATAYY | |
| AMAVNYQDLTMNGERQVVYARYIDWVLTTPLLLLNLIVMTKMGGVMISWVIGADIFM | |
| IVFGILGAFEDEHKFKWVYFIAGCVMQAVLTYGMYNATWKDDLKKSPEYHSSYVSLL | |
| VFLSILWVFYPVVWAFGSGSGVLSVDNVAILMGILDVLAKPLFGMGCLIAHETIFKI | |
| GTGFPFDPHYVEVLGERMHYVDVGPRDGTPVLFLHGNPTSSYVWRNIIPHVAPTHRC | |
| IAPDLIGMGKSDKPDLGYFFDDHVRFMDAFIEALGLEEVVLVIHDWGSALGFHWAKR | |
| NPERVKGIAFMEFIRPIPTWDEWPEFARETFQAFRTTDVGRKLIIDQNVFIEGTLPM | |
| GVVRPLTEVEMDHYREPFLNPVDREPLWRFPNELPIAGEPANIVALVEEYMDWLHQS | |
| PVPKLLFWGTPGVLIPPAEAARLAKSLPNCKAVDIGPGLNLLQEDNPDLIGSEIARW | |
| LSTLEISGEPTTKSRITSEGEYIPLDQIDINVFCYENEV* | |
| SEQ ID NO: 7 - DNA sequence of Ace2-mNeonGreen N81D | |
| D92N | |
| ATGGCTGACGTGGAAACCGAGACCGGCATGATTGCACAGTGGATTGTCTTTGCTATT | |
| ATGGCTGCTGCTGCTATTGCTTTTGGAGTGGCTGTGCACTTTCGGCCTTCAGAGCTG | |
| AAGAGCGCATACTATATCAACATTGCCATCTGCACTATCGCCGCTACCGCTTACTAT | |
| GCAATGGCCGTGAACTACCAGGACCTGACAATGAATGGTGAAAGGCAGGTGGTCTAC | |
| GCAAGATATATTGACTGGGTGCTGACCACACCACTGCTCCTGCTCAACCTCATCGTC | |
| ATGACCAAGATGGGCGGAGTGATGATTTCTTGGGTCATCGGCGCAGACATTTTCATG | |
| ATCGTGTTTGGTATTCTGGGCGCCTTCGAGGATGAACACAAGTTCAAATGGGTGTAC | |
| TTTATCGCTGGATGTGTGATGCAGGCAGTCCTGACATACGGGATGTATAACGCCACT | |
| TGGAAAGACGATCTGAAGAAAAGCCCCGAGTACCATAGCTCCTATGTCAGTCTGCTC | |
| GTCTTCCTGTCAATCCTCTGGGTGTTTTATCCTGTCGTGTGGGCTTTCGGGTCTGGT | |
| AGTGGCGTGCTGTCCGTCGACAATGAGGCCATTCTCATGGGAATCCTGGATGTGCTC | |
| GCTAAGCCACTGTTTGGAATGGGGTGCCTCATTGCCCATGAGACTATCTTCAAGAAG | |
| ATGCTGAGGTCTCTCCCAGCGACACATGAGTTACACATCTTTGGCTCCATCAACGGT | |
| GTGGACTTTGACATGGTGGGTCAGGGCACCGGCAATCCAAATGATGGTTATGAGGAG | |
| TTAAACCTGAAGTCCACCAAGGGTGACCTCCAGTTCTCCCCCTGGATTCTGGTCCCT | |
| CATATCGGGTATGGCTTCCATCAGTACCTGCCCTACCCTGACGGGATGTCGCCTTTC | |
| CAGGCCGCCATGGTAGATGGCTCCGGATACCAAGTCCATCGCACAATGCAGTTTGAA | |
| GATGGTGCCTCCCTTACTGTTAACTACCGCTACACCTACGAGGGAAGCCACATCAAA | |
| GGAGAGGCCCAGGTGAAGGGGACTGGTTTCCCTGCTGACGGTCCTGTGATGACCAAC | |
| TCGCTGACCGCTGCGGACTGGTGCAGGTCGAAGAAGACTTACCCCAACGACAAAACC | |
| ATCATCAGTACCTTTAAGTGGAGTTACACCACTGGAAATGGCAAGCGCTACAGGAGC | |
| ACTGCGCGGACCACCTACACCTTTGCCAAGCCAATGGCGGCTAACTATCTGAAGAAC | |
| CAGCCGATGTACGTGTTCCGTAAGACGGAGCTCAAGCACTCCAAGACCGAGCTCAAC | |
| TTCAAGGAGTGGCAAAAGGCCTTTACCGATGTGATGGGCATGGACGAGCTGTACAAG | |
| AAGAGCAGGATCACCAGCGAGGGCGAGTACATCCCCCTGGACCAGATCGACATCAAC | |
| GTGTTCTGCTACGAGAACGAGGTGTAA | |
| SEQ ID NO: 8 - Protein sequence of Ace2-mNeonGreen N81D | |
| D92N | |
| MADVETETGMIAQWIVFAIMAAAAIAFGVAVHFRPSELKSAYYINIAICTIAATAYY | |
| AMAVNYQDLTMNGERQVVYARYIDWVLTTPLLLLNLIVMTKMGGVMISWVIGADIFM | |
| IVFGILGAFEDEHKFKWVYFIAGCVMQAVLTYGMYNATWKDDLKKSPEYHSSYVSLL | |
| VFLSILWVFYPVVWAFGSGSGVLSVDNEAILMGILDVLAKPLFGMGCLIAHETIFKK | |
| MLRSLPATHELHIFGSINGVDFDMVGQGTGNPNDGYEELNLKSTKGDLQFSPWILVP | |
| HIGYGFHQYLPYPDGMSPFQAAMVDGSGYQVHRTMQFEDGASLTVNYRYTYEGSHIK | |
| GEAQVKGTGFPADGPVMTNSLTAADWCRSKKTYPNDKTIISTFKWSYTTGNGKRYRS | |
| TARTTYTFAKPMAANYLKNQPMYVFRKTELKHSKTELNFKEWQKAFTDVMGMDELYK | |
| KSRITSEGEYIPLDQIDINVFCYENEV* | |
| SEQ ID NO: 9 - Protein sequence of Ace2N | |
| MADVETETGMIAQWIVFAIMAAAAIAFGVAVHFRPSELKSAYYINIAICTIAATAYY | |
| AMAVNYQDLTMNGERQVVYARYINWVLTTPLLLLDLIVMTKMGGVMISWVIGADIFM | |
| IVFGILGAFEDEHKFKWVYFIAGCVMQAVLTYGMYNATWKDDLKKSPEYHSSYVSLL | |
| VFLSILWVFYPVVWAFGSGSGVLSVDNEAILMGILDVLAKPLFGMGCLIAHETIFK | |
| SEQ ID NO: 10 - Protein sequence of HaloTag | |
| IGTGFPFDPHYVEVLGERMHYVDVGPRDGTPVLFLHGNPTSSYVWRNIIPHVAPTHR | |
| CIAPDLIGMGKSDKPDLGYFFDDHVRFMDAFIEALGLEEVVLVIHDWGSALGFHWAK | |
| RNPERVKGIAFMEFIRPIPTWDEWPEFARETFQAFRTTDVGRKLIIDQNVFIEGTLP | |
| MGVVRPLTEVEMDHYREPFLNPVDREPLWRFPNELPIAGEPANIVALVEEYMDWLHQ | |
| SPVPKLLFWGTPGVLIPPAEAARLAKSLPNCKAVDIGPGLNLLQEDNPDLIGSEIAR | |
| WLSTLEISGEPTT | |
| SEQ ID NO: 11 - Protein sequence of exemplary a capture | |
| protein domain | |
| KMLRSLPATHELHIFGSINGVDFDMVGQGTGNPNDGYEELNLKSTKGDLQFSPWILV | |
| PHIGYGFHQYLPYPDGMSPFQAAMVDGSGYQVHRTMQFEDGASLTVNYRYTYEGSHI | |
| KGEAQVKGTGFPADGPVMTNSLTAADWCRSKKTYPNDKTIISTFKWSYTTGNGKRYR | |
| STARTTYTFAKPMAANYLKNQPMYVFRKTELKHSKTELNFKEWQKAFTDVMGMDELY | |
| K | |
| SEQ ID NO: 12 - Protein sequence of Kv2.1 membrane | |
| trafficking signal | |
| KSRITSEGEYIPLDQIDINV | |
| SEQ ID NO: 13 - Protein sequence of Kv2.1 ER export | |
| signal | |
| FCYENEV | |
| SEQ ID NO: 14: Protein sequence of Kv2.1 Proximal | |
| restriction/clustering | |
| QSQPILNTKEMAPQSKPPEELEMSSMPSPVAPLPARTEGVIDMRSMSSIDSFISCAT | |
| DFPEATRF | |
| SEQ ID NO: 15: - Protein sequence of QuarAr1. | |
| IALQAGYDLLGDGRPETLWLGIGTLLMLIGTFYFLVRGWGVTDKDAREYYAVTILVS | |
| GIASAAYLSMFFGIGLTEVSVGGEMLDIYYARYAHWLFTTLLLLHLALLAKVDRVTI | |
| GTLVGVDALMIVTGLIGALSHTAIARYSWWLFSTICMIVVLYVLATSLRSAAKERGP | |
| EVASTFNTLTALVLVLWTAYPILWIIGTEGAGVVGLGIETLLFMVLDVTAKVGFGFI | |
| LLRSRAILGDTEAPEPSAGADVSAAD | |
| SEQ ID NO: 16 - Protein sequence of QuasAr2, as in | |
| FIG. 10. | |
| IALQAGYDLLGDGRPETLWLGIGTLLMLIGTFYFLVRGWGVTDKDAREYYAVTILVS | |
| GIASAAYLSMFFGIGLTEVSVGGEMLDIYYARYAQWLFTTPLLLLHLALLAKVDRVT | |
| IGTLVGVDALMIVTGLIGALSHTAIARYSWWLFSTICMIVVLYVLATSLRSAAKERG | |
| PEVASTFNTLTALVLVLWTAYPILWIIGTEGAGVVGLGIETLLFMVLDVTAKVGFGF | |
| ILLRSRAILGDTEAPEPSAGADVSAAD | |
| SEQ ID NO: 17 - Protein Sequences of QuasAr2, as in | |
| FIG. 11. | |
| IALQAGYDLLGDGRPETLWLGIGTLLMLIGTFYFLVRGWGVTDKDAREYYAVTILVS | |
| GIASAAYLSNIFFGIGLTEVSVGGEMLDIYYARYAQWLFTTPLLLLHLALLAKVDRV | |
| TIGTLVGVDALMIVTGLIGALSHTAIARYSWWLFSTICMIVVLYVLATSLRSAAKER | |
| GPEVASTFNTLTALVLVLWTAYPILWIIGTEGAGVVGLGIETLLFMVLDVTAKVGFG | |
| FILLRSRAILGDTE |
Claims (18)
Priority Applications (2)
| Application Number | Priority Date | Filing Date | Title |
|---|---|---|---|
| US16/872,188 US11598792B2 (en) | 2019-05-09 | 2020-05-11 | Voltage indicators |
| US18/160,764 US12105122B2 (en) | 2019-05-09 | 2023-01-27 | Voltage indicators |
Applications Claiming Priority (2)
| Application Number | Priority Date | Filing Date | Title |
|---|---|---|---|
| US201962845643P | 2019-05-09 | 2019-05-09 | |
| US16/872,188 US11598792B2 (en) | 2019-05-09 | 2020-05-11 | Voltage indicators |
Related Child Applications (1)
| Application Number | Title | Priority Date | Filing Date |
|---|---|---|---|
| US18/160,764 Continuation US12105122B2 (en) | 2019-05-09 | 2023-01-27 | Voltage indicators |
Publications (2)
| Publication Number | Publication Date |
|---|---|
| US20200363455A1 US20200363455A1 (en) | 2020-11-19 |
| US11598792B2 true US11598792B2 (en) | 2023-03-07 |
Family
ID=73228073
Family Applications (2)
| Application Number | Title | Priority Date | Filing Date |
|---|---|---|---|
| US16/872,188 Active 2041-03-17 US11598792B2 (en) | 2019-05-09 | 2020-05-11 | Voltage indicators |
| US18/160,764 Active 2040-10-05 US12105122B2 (en) | 2019-05-09 | 2023-01-27 | Voltage indicators |
Family Applications After (1)
| Application Number | Title | Priority Date | Filing Date |
|---|---|---|---|
| US18/160,764 Active 2040-10-05 US12105122B2 (en) | 2019-05-09 | 2023-01-27 | Voltage indicators |
Country Status (1)
| Country | Link |
|---|---|
| US (2) | US11598792B2 (en) |
Cited By (1)
| Publication number | Priority date | Publication date | Assignee | Title |
|---|---|---|---|---|
| US20220299518A1 (en) * | 2016-11-30 | 2022-09-22 | Howard Hughes Medical Institute | Chemigenetic voltage indicators |
Citations (4)
| Publication number | Priority date | Publication date | Assignee | Title |
|---|---|---|---|---|
| US20140324138A1 (en) * | 2007-05-09 | 2014-10-30 | Massachusetts Institute Of Technology | Wirelessly-powered illumination of biological tissue |
| US20150369740A1 (en) * | 2014-06-18 | 2015-12-24 | President And Fellows Of Harvard College | Optogenetic probes for measuring membrane potential |
| US9933417B2 (en) | 2014-04-01 | 2018-04-03 | Howard Hughes Medical Institute | Azetidine-substituted fluorescent compounds |
| US20200025769A1 (en) * | 2016-11-30 | 2020-01-23 | Howard Hughes Medical Institute | Chemigenetic voltage indicators |
Family Cites Families (3)
| Publication number | Priority date | Publication date | Assignee | Title |
|---|---|---|---|---|
| US9644007B2 (en) * | 2014-12-23 | 2017-05-09 | Howard Hughes Medical Institute | Red genetically encoded calcium indicators and methods of use |
| US10519205B2 (en) * | 2015-03-19 | 2019-12-31 | The Board Of Regents Of The University Of Texas System | Compositions and methods for use of anion channel rhodopsins |
| US20220056100A1 (en) * | 2020-08-20 | 2022-02-24 | Board Of Regents Of The University Of Texas System | Compositions and methods for use of red-shifted anion channel rhodopsins |
-
2020
- 2020-05-11 US US16/872,188 patent/US11598792B2/en active Active
-
2023
- 2023-01-27 US US18/160,764 patent/US12105122B2/en active Active
Patent Citations (8)
| Publication number | Priority date | Publication date | Assignee | Title |
|---|---|---|---|---|
| US20140324138A1 (en) * | 2007-05-09 | 2014-10-30 | Massachusetts Institute Of Technology | Wirelessly-powered illumination of biological tissue |
| US9933417B2 (en) | 2014-04-01 | 2018-04-03 | Howard Hughes Medical Institute | Azetidine-substituted fluorescent compounds |
| US10018624B1 (en) | 2014-04-01 | 2018-07-10 | Howard Hughes Medical Institute | Azetidine-substituted fluorescent compounds |
| US10161932B2 (en) | 2014-04-01 | 2018-12-25 | Howard Hughes Medical Institute | Azetidine-substituted fluorescent compounds |
| US10495632B2 (en) | 2014-04-01 | 2019-12-03 | Howard Hughes Medical Institute | Azetidine-substituted fluorescent compounds |
| US20150369740A1 (en) * | 2014-06-18 | 2015-12-24 | President And Fellows Of Harvard College | Optogenetic probes for measuring membrane potential |
| US20200123218A1 (en) | 2014-06-18 | 2020-04-23 | President And Fellows Of Harvard College | Optogenetic probes for measuring membrane potential |
| US20200025769A1 (en) * | 2016-11-30 | 2020-01-23 | Howard Hughes Medical Institute | Chemigenetic voltage indicators |
Non-Patent Citations (7)
| Title |
|---|
| Abdelfattah, A.S., et al. "A general approach to engineer positive-going eFRET voltage indicators," bioRxiv; doi: https://doi.org/10.1101/690925, printed Jul. 3, 2019. |
| Abdelfattah, A.S., et al. "A general approach to engineer positive-going eFRET voltage indicators," Nature Communications, (2020) 11:3444, https://doi.org/10.1038/S41467-020-17322-1. |
| Abdelfattah, A.S., et al. "Bright and photostable chemigenetic indicators for extended in vivo voltage imaging," bioRxiv 436840; doi: https://doi.org/10.1101/436840, printed Oct. 6, 2018. |
| Bedbrook et al. Chem. Biol. (2015) 22: 1108-1121 (Year: 2015). * |
| Grimm, J., et al. "A general method to fine-tune fluorophores for live-cell and in vivo imaging," Nat Methods 14, 987-994 (2017). https://doi.org/10.1038/nmeth.4403. |
| Grimm, J., et al. "A general method to improve fluorophores for live-cell and single-molecule microscopy," Nat. Methods 12, 244-250 (2015). https://doi.org/10.1038/nmeth.3256. |
| Xu, Y., et al. "Voltage imaging with genetically encoded indicators," Science Direct, Current Opinion in Chemical Biology, (2017) vol. 39, pp. 1-10, ISSN 1367-5931, https://doi.org/10.1016/j.cbpa.2017.04.005. |
Cited By (2)
| Publication number | Priority date | Publication date | Assignee | Title |
|---|---|---|---|---|
| US20220299518A1 (en) * | 2016-11-30 | 2022-09-22 | Howard Hughes Medical Institute | Chemigenetic voltage indicators |
| US12474345B2 (en) * | 2016-11-30 | 2025-11-18 | Howard Hughes Medical Institute | Chemigenetic voltage indicators |
Also Published As
| Publication number | Publication date |
|---|---|
| US20230296649A1 (en) | 2023-09-21 |
| US12105122B2 (en) | 2024-10-01 |
| US20200363455A1 (en) | 2020-11-19 |
Similar Documents
| Publication | Publication Date | Title |
|---|---|---|
| Abdelfattah et al. | Sensitivity optimization of a rhodopsin-based fluorescent voltage indicator | |
| Zhang et al. | Fast and sensitive GCaMP calcium indicators for imaging neural populations | |
| Adam et al. | Voltage imaging and optogenetics reveal behaviour-dependent changes in hippocampal dynamics | |
| Inoue et al. | Rational engineering of XCaMPs, a multicolor GECI suite for in vivo imaging of complex brain circuit dynamics | |
| Abdelfattah et al. | Bright and photostable chemigenetic indicators for extended in vivo voltage imaging | |
| Zhang et al. | Fast and sensitive GCaMP calcium indicators for imaging neural populations | |
| Marvin et al. | An optimized fluorescent probe for visualizing glutamate neurotransmission | |
| Borghuis et al. | Imaging light responses of targeted neuron populations in the rodent retina | |
| Inoue et al. | Rational design of a high-affinity, fast, red calcium indicator R-CaMP2 | |
| Perez-Alvarez et al. | Freeze-frame imaging of synaptic activity using SynTagMA | |
| Euler et al. | Studying a light sensor with light: multiphoton imaging in the retina | |
| Farrants et al. | A modular chemigenetic calcium indicator for multiplexed in vivo functional imaging | |
| US9664697B2 (en) | Green-to-red photo-convertible fluorescent calcium indicator | |
| Walker et al. | Functional imaging in the zebrafish retinotectal system using RGECO | |
| US10048275B2 (en) | Cardiotoxicity screening methods | |
| US12105122B2 (en) | Voltage indicators | |
| Sylvester et al. | Population-scale organization of cerebellar granule neuron signaling during a visuomotor behavior | |
| Kim et al. | EPSILON: a method for pulse-chase labeling to probe synaptic AMPAR exocytosis during memory formation | |
| Totsuka et al. | Optogenetic activation of primary sensory neurons induces metamorphosis in Ciona | |
| Wachowiak et al. | Optical imaging of brain activity in vivo using genetically encoded probes | |
| Liu | Multimodal High-Content Optimization of Neural Activity Biosensors | |
| Kist | Cerebellar and sensory contributions to the optomotor response in larval zebrafish | |
| JP2014176363A (en) | Method for analyzing photoresponse of photoreceptors | |
| Kirk | Genetic Targeting of Small-Molecules in Drosophila melanogaster | |
| Looger et al. | Fast and sensitive GCaMP calcium indicators for imaging neural populations |
Legal Events
| Date | Code | Title | Description |
|---|---|---|---|
| FEPP | Fee payment procedure |
Free format text: ENTITY STATUS SET TO UNDISCOUNTED (ORIGINAL EVENT CODE: BIG.); ENTITY STATUS OF PATENT OWNER: SMALL ENTITY |
|
| FEPP | Fee payment procedure |
Free format text: ENTITY STATUS SET TO SMALL (ORIGINAL EVENT CODE: SMAL); ENTITY STATUS OF PATENT OWNER: SMALL ENTITY |
|
| AS | Assignment |
Owner name: HOWARD HUGHES MEDICAL INSTITUTE, MARYLAND Free format text: ASSIGNMENT OF ASSIGNORS INTEREST;ASSIGNORS:SCHREITER, ERIC R.;ABDELFATTAH, AHMED;SIGNING DATES FROM 20200605 TO 20200610;REEL/FRAME:052910/0838 |
|
| STPP | Information on status: patent application and granting procedure in general |
Free format text: APPLICATION DISPATCHED FROM PREEXAM, NOT YET DOCKETED |
|
| STPP | Information on status: patent application and granting procedure in general |
Free format text: DOCKETED NEW CASE - READY FOR EXAMINATION |
|
| STPP | Information on status: patent application and granting procedure in general |
Free format text: NON FINAL ACTION MAILED |
|
| STPP | Information on status: patent application and granting procedure in general |
Free format text: RESPONSE TO NON-FINAL OFFICE ACTION ENTERED AND FORWARDED TO EXAMINER |
|
| STPP | Information on status: patent application and granting procedure in general |
Free format text: NOTICE OF ALLOWANCE MAILED -- APPLICATION RECEIVED IN OFFICE OF PUBLICATIONS |
|
| STCF | Information on status: patent grant |
Free format text: PATENTED CASE |