US11556800B2 - Decipherable deep belief network method of feature importance analysis for road safety status prediction - Google Patents
Decipherable deep belief network method of feature importance analysis for road safety status prediction Download PDFInfo
- Publication number
- US11556800B2 US11556800B2 US16/815,847 US202016815847A US11556800B2 US 11556800 B2 US11556800 B2 US 11556800B2 US 202016815847 A US202016815847 A US 202016815847A US 11556800 B2 US11556800 B2 US 11556800B2
- Authority
- US
- United States
- Prior art keywords
- training
- input
- learning
- unsupervised learning
- weights
- Prior art date
- Legal status (The legal status is an assumption and is not a legal conclusion. Google has not performed a legal analysis and makes no representation as to the accuracy of the status listed.)
- Active, expires
Links
Images


Classifications
-
- G—PHYSICS
- G06—COMPUTING OR CALCULATING; COUNTING
- G06N—COMPUTING ARRANGEMENTS BASED ON SPECIFIC COMPUTATIONAL MODELS
- G06N3/00—Computing arrangements based on biological models
- G06N3/02—Neural networks
- G06N3/08—Learning methods
- G06N3/088—Non-supervised learning, e.g. competitive learning
-
- G—PHYSICS
- G06—COMPUTING OR CALCULATING; COUNTING
- G06N—COMPUTING ARRANGEMENTS BASED ON SPECIFIC COMPUTATIONAL MODELS
- G06N3/00—Computing arrangements based on biological models
- G06N3/02—Neural networks
- G06N3/04—Architecture, e.g. interconnection topology
-
- G—PHYSICS
- G06—COMPUTING OR CALCULATING; COUNTING
- G06N—COMPUTING ARRANGEMENTS BASED ON SPECIFIC COMPUTATIONAL MODELS
- G06N3/00—Computing arrangements based on biological models
- G06N3/02—Neural networks
- G06N3/04—Architecture, e.g. interconnection topology
- G06N3/044—Recurrent networks, e.g. Hopfield networks
-
- G06N3/0445—
-
- G—PHYSICS
- G06—COMPUTING OR CALCULATING; COUNTING
- G06N—COMPUTING ARRANGEMENTS BASED ON SPECIFIC COMPUTATIONAL MODELS
- G06N3/00—Computing arrangements based on biological models
- G06N3/02—Neural networks
- G06N3/04—Architecture, e.g. interconnection topology
- G06N3/045—Combinations of networks
-
- G—PHYSICS
- G06—COMPUTING OR CALCULATING; COUNTING
- G06N—COMPUTING ARRANGEMENTS BASED ON SPECIFIC COMPUTATIONAL MODELS
- G06N3/00—Computing arrangements based on biological models
- G06N3/02—Neural networks
- G06N3/04—Architecture, e.g. interconnection topology
- G06N3/047—Probabilistic or stochastic networks
-
- G—PHYSICS
- G06—COMPUTING OR CALCULATING; COUNTING
- G06N—COMPUTING ARRANGEMENTS BASED ON SPECIFIC COMPUTATIONAL MODELS
- G06N3/00—Computing arrangements based on biological models
- G06N3/02—Neural networks
- G06N3/04—Architecture, e.g. interconnection topology
- G06N3/0495—Quantised networks; Sparse networks; Compressed networks
-
- G—PHYSICS
- G06—COMPUTING OR CALCULATING; COUNTING
- G06N—COMPUTING ARRANGEMENTS BASED ON SPECIFIC COMPUTATIONAL MODELS
- G06N3/00—Computing arrangements based on biological models
- G06N3/02—Neural networks
- G06N3/04—Architecture, e.g. interconnection topology
- G06N3/0499—Feedforward networks
-
- G—PHYSICS
- G06—COMPUTING OR CALCULATING; COUNTING
- G06N—COMPUTING ARRANGEMENTS BASED ON SPECIFIC COMPUTATIONAL MODELS
- G06N3/00—Computing arrangements based on biological models
- G06N3/02—Neural networks
- G06N3/08—Learning methods
-
- G—PHYSICS
- G06—COMPUTING OR CALCULATING; COUNTING
- G06N—COMPUTING ARRANGEMENTS BASED ON SPECIFIC COMPUTATIONAL MODELS
- G06N3/00—Computing arrangements based on biological models
- G06N3/02—Neural networks
- G06N3/08—Learning methods
- G06N3/084—Backpropagation, e.g. using gradient descent
-
- G—PHYSICS
- G06—COMPUTING OR CALCULATING; COUNTING
- G06N—COMPUTING ARRANGEMENTS BASED ON SPECIFIC COMPUTATIONAL MODELS
- G06N3/00—Computing arrangements based on biological models
- G06N3/02—Neural networks
- G06N3/08—Learning methods
- G06N3/09—Supervised learning
-
- G—PHYSICS
- G08—SIGNALLING
- G08G—TRAFFIC CONTROL SYSTEMS
- G08G1/00—Traffic control systems for road vehicles
- G08G1/01—Detecting movement of traffic to be counted or controlled
- G08G1/0104—Measuring and analyzing of parameters relative to traffic conditions
- G08G1/0125—Traffic data processing
- G08G1/0133—Traffic data processing for classifying traffic situation
-
- G—PHYSICS
- G06—COMPUTING OR CALCULATING; COUNTING
- G06F—ELECTRIC DIGITAL DATA PROCESSING
- G06F17/00—Digital computing or data processing equipment or methods, specially adapted for specific functions
- G06F17/10—Complex mathematical operations
- G06F17/18—Complex mathematical operations for evaluating statistical data, e.g. average values, frequency distributions, probability functions, regression analysis
Definitions
- safety performance functions are separately developed for different types of highways or entities and using data locally collected from the study area representing the specific highway types to be modelled. Although these traditional methods are easy to understand and apply, they suffer from the problem of low accuracy in the predicted results thanks to the random nature of collision occurrences and the strong distribution assumption.
- Embodiments of the subject invention pertain to a visual feature importance method based on deep belief network for visualizing and analyzing contributions of various input features.
- a method for visualizing and analyzing contributions of various input features for traffic safety status prediction can comprise steps of initializing a deep belief network (DBN) with input features; performing unsupervised learning/training process by observing changes of weights of the input features during unsupervised learning/training process; when the unsupervised learning/training process is complete, performing supervised (“fine-tuning”) learning/training process by generating a reconstructed input layer based on each hidden layer; and continually running the supervised (“fine-tuning”) learning/training process and generating a weights diagram based on both visualization and numerical analysis that calculates contributions of the input features.
- DNN deep belief network
- the initializing a deep belief network can comprise pre-setting the DBN with a V-H1-H2-O structure wherein V represents input neurons, H1 and H2 represent hidden neurons in two hidden layers, respectively, and O represents output for prediction, and wherein weights are randomly pre-set.
- the observing changes of weights during unsupervised learning/training process is performed with a focus on magnitude of each input feature.
- the performing unsupervised learning/training process comprises training a first restricted Boltzmann (RBM) machine comprising the input neurons V and the hidden neurons in the first hidden layer H1 based on greedy unsupervised learning/training process.
- the generating a reconstructed input layer based on each hidden layer is performed by differentiating the activation area and non-activation area.
- the supervised (“fine-tuning”) learning/training process comprises generating a diagram of the weights such that whether a secondary consideration of the method is determined to exist after it is taught by a teacher. If the secondary consideration is determined to exist, a resulting image that is different from a resulting image of the unsupervised learning/training process is generated.
- the numerical analysis that calculates contributions of input features determines whether the input feature is accepted or rejected.
- results of the learning/training process are evaluated based on a mean absolute error (MAE) and a root mean square error (RMSE).
- the input features can comprise one or more of annual average daily commercial traffic (AADCT), median width, left shoulder width, right shoulder width, curve deflection, and exposure for traffic safety status prediction.
- a non-transitory computer-readable medium can comprise program instructions stored thereon that, when executed, cause a processor to perform a method for visualizing and analyzing contributions of various input features for traffic safety status prediction.
- the method comprises steps of initializing a deep belief network (DBN) with input features; performing unsupervised learning/training process by observing changes of weights of the input features during unsupervised learning/training process; when the unsupervised learning/training process is complete, performing supervised (“fine-tuning”) learning/training process by generating a reconstructed input layer based on each hidden layer; and continually running the supervised (“fine-tuning”) learning/training process and generating a weights diagram based on both visualization and numerical analysis that calculates contributions of the input features.
- DBN deep belief network
- the initializing a deep belief network can comprise pre-setting the DBN with a V-H1-H2-O structure wherein V represents input neurons, H1 and H2 represent hidden neurons in two hidden layers, respectively, and O represents output for prediction, and wherein weights are randomly pre-set.
- the observing changes of weights during unsupervised learning/training process is performed with a focus on magnitude of each input feature.
- the performing unsupervised learning/training process comprises training a first restricted Boltzmann (RBM) machine comprising the input neurons V and the hidden neurons in the first hidden layer H1 based on greedy unsupervised learning/training process.
- the generating a reconstructed input layer based on each hidden layer is performed by differentiating the activation area and non-activation area.
- the supervised (“fine-tuning”) learning/training process comprises generating a diagram of the weights such that whether a secondary consideration of the method is determined to exist after it is taught by a teacher. If the secondary consideration is determined to exist, a resulting image that is different from a resulting image of the unsupervised learning/training process is generated.
- the numerical analysis that calculates contributions of input features determines whether the input feature is accepted or rejected.
- results of the learning/training process are evaluated based on a mean absolute error (MAE) and a root mean square error (RMSE).
- the input features can comprise one or more of annual average daily commercial traffic (AADCT), median width, left shoulder width, right shoulder width, curve deflection, and exposure for traffic safety status prediction.
- FIG. 1 A shows visualization of changes of weights of input features of a method for analyzing contributions of various input features for traffic safety status prediction, according to an embodiment of the subject invention.
- FIG. 1 B shows visualization of layer reconstruction, in which a decoding function is the same as a coding function, according to an embodiment of the subject invention.
- FIG. 2 A shows a structure of the method being used in an exemplary experiment, according to an embodiment of the subject invention.
- FIG. 2 B shows trained weights W 1 from input to hidden layer 1 during 60 epochs of the unsupervised learning/training process, with each row representing the weights in one epoch, according to an embodiment of the subject invention.
- FIG. 3 A shows the changes of weights between input and hidden layer 1 and weights that connect to each feature, according to an embodiment of the subject invention.
- FIG. 3 B shows that the first feature's weights slightly decrease at first and then increase, the second feature's weights keep decreasing, the third and fourth features increase at first then fall a little, weights of features five and six increase all the time, according to an embodiment of the subject invention.
- FIG. 4 shows the calculated feature importance in the two learning/training stages, according to an embodiment of the subject invention.
- FIGS. 5 A- 5 C show a comparison of performance between R-DBN without feature 2 and three other methods including negative binomial (NB), kernel regression (KR) and regularized deep belief network (R-DBN) with respect to data sizes, according to an embodiment of the subject invention.
- NB negative binomial
- KR kernel regression
- R-DBN regularized deep belief network
- the embodiments of the subject invention pertain to a visual feature importance (ViFI) method built on feature importance evaluation and visualization for performing sensitivity analysis and presenting diagrams based on the results of the analysis.
- ViFI visual feature importance
- the ViFI method can be based on decipherable deep belief network performing both a unsupervised learning/training process and a supervised (“fine-tuning”) learning/training process to assess importance of each input feature.
- the ViFI method can be divided into four steps as described below:
- DNN deep belief network
- the weights are randomly pre-set for a given deep belief network with a V-H1-H2-O structure, wherein V represents input neurons, H1 and H2 represent hidden neurons in two hidden layers, respectively, and O represents output for prediction.
- a first restricted Boltzmann machine including V and H1 is trained based on a greedy unsupervised learning/training process.
- the feature learning/training process and the weights updating process can be described by Equations (1)-(6) below.
- W t + 1 W t + ⁇ ⁇ ⁇ W ( 6 )
- Equation (1) represents the starting state of input data (values between 0 and 1), with weights W between the two layers randomly given (all zeros are preferred for easier calculation in the following steps).
- v i and h j are neurons in V and H1.
- Equations (2)-(4) are the feature learning/training equations of the RBM. Particularly, V 0 , H 0 , V 1 , and H 1 are the four states recorded during transformation.
- p( ) is the probability of a neuron being activated, w ij is the weight between i in V and j in H1, and b and c are the biases.
- the weights are updated by applying Equations (5)-(6). As the weights are all initialized to be zero at the beginning, in the unsupervised learning/training process if a feature is determined to be important, the weights between the specific feature neuron and hidden layer 1 will be strengthened, leading to a negative ⁇ AW in Equation (5) since more neurons will have a value of 1 in V 1 and H 1 . If a feature is determined to be unimportant by the learning/training process, the ⁇ W will be set to a positive value, and since the V 1 and the H 1 are mostly 0, values of the W t+1 will keep increase.
- FIG. 1 A the visualization of change of weights of input features of the ViFI method is illustrated for analyzing contributions of various input features.
- results of a first impression on each input feature are generated.
- the blue lines of FIG. 1 A indicate that the weights are strengthened if it is determined to be an important feature, otherwise it is determined to be an unimportant feature and the connections are weakened which are indicated by the orange lines of FIG. 1 A .
- FIG. 1 B the visualization of layer reconstruction in which a decoding function is the same as a coding function is shown.
- a reconstructed input using each layer is generated. It is noted that by performing the second step, the reconstructed data can highlight the truly important features, obtaining the knowledge that the hidden layers have learned.
- the supervised (“fine-tuning”) learning/training process is performed in which the same method of step 2 is then applied to produce a diagram for the weights. This process allows a determination of any secondary considerations the method uses after it is taught by a teacher. If these considerations exist, the resulting image would be different from the resulting image obtained from the unsupervised learning/training process.
- the supervised (“fine-tuning”) learning/training process is described by Equations (7)-(10) below,
- E W is the objective function used in a back-propagation network which calculates the error between the target output O target and observed output O observed ;
- T is the testing set;
- H k is the vector value of layer k.
- p ⁇ ( h 0 ) 1 1 + e - b j - ⁇ i ⁇ v 0 ⁇ w i ⁇ j , is applied to represent data flow from input to hidden layer 1 .
- This function is ascending and all values of input and hidden layer units are over 0.
- bigger weights would lead to bigger p( ).
- the ViFI method is not over-fitted, the bigger p( ) values are preferred as they suggest that the connections to the input feature are significant.
- the weights decrease, the feature that they are connected to may be unimportant.
- Equation (6) which is a weight updating equation is linear
- the contributions of the feature learning/training process are defined based on a linear function shown in Equations (11)-(13) below, in which Fl i is the importance of feature i, Fl i unsup indicates importance of i in the unsupervised learning/training and Fl i sup is the importance after fine-tuning.
- w i n represents the weights that connect to i in epoch n
- V represents a number of features
- H represents a number of hidden units.
- Fl i Fl i unsup +Fl i sup (11)
- Fl i unsup ⁇ w i 0 ⁇ w i n /H (12)
- Fl i sup 1/1 +e ⁇ ( ⁇ w i n ⁇ w i o /H ) (13)
- the supervised (“fine-tuning”) learning/training step is continually performed and the weights diagram is generated based on the visualization and the numerical analysis that calculates the contribution of input features, the input feature being determined to be either accepted or rejected.
- the ViFI method allows effective deciphering of the method's inner workings and allows the important/significant features to be identified and the unimportant/bad features to be eliminated. Subsequently, the revised dataset can be applied to the ViFI method in crash and vehicle collision prediction for improving road traffic safety.
- Highway 401 a multilane-access controlled highway in Ontario, Canada are used.
- the highway is one of the busiest highways in North America and connects Quebec in the east and the Windsor-Detroit international border in the west.
- Approximately 800 km of the total length of 817.9 km of the highway was selected for the experiment.
- the annual average daily traffic ranges from 14,500 to 442,900, indicating a relatively busy road corridor.
- the processed crash and traffic data of this experiment are integrated into a single dataset with homogenous sections and having a total of 3,762 records with the year being used as the mapping fields.
- the six input features of the dataset are annual average daily commercial traffic (AADCT), median width, left shoulder width, right shoulder width, curve deflection, and exposure.
- Table 1 The description of continuous input features is summarized in Table 1 which includes the sample sizes for learning/training and testing. After the learning/training process is complete, the performance of each method is estimated based on mean absolute error (MAE) and root mean square error (RMSE), as defined by Equations (14)-(15) below.
- MAE mean absolute error
- RMSE root mean square error
- F W ⁇ ⁇ E W + ⁇ ⁇ R W ( 19 )
- x i and y j are the continuous values of unit i and j in two layers; w ij is the weight between them; N(0,1) is a Gaussian random variable with mean 0 and variance 1; ⁇ is a constant; ⁇ (X) denotes a sigmoid-like function with asymptote of ⁇ H and ⁇ L ; ⁇ is a variable that controls noise; F W is the new optimization function in fine-tuning; R W is the Bayesian regularization item for inhibiting over-fitting by controlling the values of weights; and ⁇ and ⁇ are performance parameters that can be calculated during the iteration.
- ViFI method of the subject invention was first performed based on the unsupervised learning/training process.
- the method was initialized with six input neurons, one for each feature, namely, exposure, AADCT, left shoulder width, median width, right shoulder width, and curve deflection; two hidden layers with ten neurons in each layer, and one output layer that contains only one neuron for vehicle collision prediction.
- FIGS. 2 A and 2 B A visualization of the structure that highlights how the weights form the different connections between layers and how they are updated is illustrated in FIGS. 2 A and 2 B .
- FIG. 2 A shows a structure of the ViFI method being used in an exemplary experiment.
- FIG. 2 B illustrates trained weights W 1 (from input to hidden layer 1 in FIG. 2 B ) during 60 epochs of the unsupervised learning/training process, with each row representing the weights in an epoch. Moreover, in FIG. 2 B , the top row represents the first epoch and the bottom last row represents the sixtieth epoch. As the weights are set to be zero at the initialization, the color is all white at the initialization. The vertical direction shows the changes of the weights. During the unsupervised learning/training process, some weights become very dark in the vertical direction while others are not so much.
- Equation (14) was applied to the hidden layer to reconstruct the input data.
- the patterns of the reconstructed features from the two hidden layers are determined to be similar, suggesting similar or equal feature learning/training ability.
- FIG. 3 A shows the changes of weights between the input layer and the hidden layer 1 and the weights that connect to each feature (from left side to the right in FIG. 3 A ).
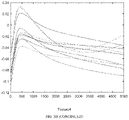
- FIG. 3 B the first feature's weights slightly decrease at first and then increase, the second feature's weights keep decreasing, the third and fourth features increase at first then fall slightly, and weights of features five and six increase all the time.
- the magnitude of feature 2 can be reduced and the importance of features 5 and 6 can be increased.
- FIG. 3 B demonstrates a sparse connection of the method, signifying that the learning/training process does not have over-fitting issues. It is also noted that the steps described above demonstrate how the black box uses the teacher's signal in the supervised (“fine-tuning”) learning/training process, acting as a validation to facilitate a self-learning/self-training process.
- the weights that join each feature and the black box are shown in FIG. 3 B .
- the X axis represents about 5,000 iterations, while the Y axis represents the value of the weights.
- There are ten lines in each sub-figure of FIG. 3 B each representing a specific weight between one feature and a neuron in the hidden layer 1 .
- the results of the above steps were determined to be [0.428, 0.117, 0.143, 0.084, 0.087, 0.393], for the six features, namely, exposure, AADCT, left shoulder width, median width, right shoulder width, curve deflection, respectively.
- the changes of the contributions can be defined based on a sigmoid function.
- the results are then determined to be [0.928, ⁇ 0.321, 0.688, 0.589, 0.635, 1.015] which are shown in FIG. 4 and table 2 for comparing the judgements of contributions of the features in the two learning/training stages.
- the features 1 - 6 are exposure, annual average daily commercial traffic (AADCT), left shoulder width, median width, right shoulder width, and curve deflection, respectively.
- AADCT annual average daily commercial traffic
- the features 1 and 6 are determined to be significant by the self-learning/self-training process as illustrated by the blue bars.
- AADCT annual average daily commercial traffic
- the results are updated and all the features become more important except the second feature, AADCT, which may be considered a distraction (negative) to the learning/training process.
- NB negative binomial
- KR kernel regression
- BPNN back propagation neural networks
- R-DBN regularized deep belief network
- the decoded R-DBN method of the subject invention demonstrates more excellent performance when compared to other conventional methods, and the decoded R-DBN of the subject invention outperforms the original version of R-DBN by achieving a minimal MAE value of 7.58 and a minimal RMSE value of 15.03.
- the feature importance using traditional numerical method and deep neural nets are compared in Table 2. Similar trends of the feature importance are observed to show that deep neural network not only correctly identifies the unimportant features but also makes better use of the important features.
- FIGS. 5 A- 5 C comparisons of performance between the decoded R-DBN (“R-DBN without feature 2 ”) of the subject invention and three conventional methods including the NB method, the KR method and the original R-DBN method with respect to data sizes are shown.
- the performance of the NB method does not substantially change as the learning/training data increases.
- the KR method the best results show some improvement, but eventually reach a limit.
- the decoded R-DBN method clearly shows an improvement, especially when the learning/training data increase.
- the decoded R-DBN method of the subject invention achieves performance much better than other conventional methods. Particularly, in FIG.
- the minimal testing mean absolute error (MAE) of the decoded R-DBN (“R-DBN without feature 2 ”) of the subject invention is lower than other conventional methods in all cases.
- the MAE of the decoded R-DBN (“R-DBN without feature 2 ”) of the subject invention is superior than the KR method with the learning/raining data by 40% and much faster than the original R-DBN method.
- the method of the subject invention is built on visualization, feature importance and sensitivity analysis, allowing the contributions of input variables on the “black box” features of the learning/training process and the output decision to be effectively evaluated. Moreover, the method can intuitively highlight the areas that respond positively or negatively to the inputs in deep neural networks. Accordingly, the method of the subject invention enables users to understand the black box feature of the learning/training process, provides potentials to analyze the contributions of the various input features, and intuitively highlights areas respond positively or negatively to the inputs.
- embodiments of the subject invention could be used in development of road safety management and alarm systems.
- the input dataset on which the road safety management and alarm systems are based are collected from different geographical regions, resulting in varying feature importance.
- the visualization, analysis, and evaluation provided by the embodiments of the subject invention help the users develop more accurate road safety status prediction.
- Potential exemplary applications include, but not limited to, SPF analysis, signal process filtering, and structure design filtering.
Landscapes
- Engineering & Computer Science (AREA)
- Physics & Mathematics (AREA)
- Theoretical Computer Science (AREA)
- General Physics & Mathematics (AREA)
- General Health & Medical Sciences (AREA)
- General Engineering & Computer Science (AREA)
- Biophysics (AREA)
- Computational Linguistics (AREA)
- Data Mining & Analysis (AREA)
- Evolutionary Computation (AREA)
- Artificial Intelligence (AREA)
- Molecular Biology (AREA)
- Computing Systems (AREA)
- Biomedical Technology (AREA)
- Life Sciences & Earth Sciences (AREA)
- Mathematical Physics (AREA)
- Software Systems (AREA)
- Health & Medical Sciences (AREA)
- Chemical & Material Sciences (AREA)
- Analytical Chemistry (AREA)
- Probability & Statistics with Applications (AREA)
- Image Analysis (AREA)
Abstract
Description
is applied to represent data flow from input to hidden
Fl i =Fl i unsup +Fl i sup (11)
Fl i unsup =Σw i 0 −Σw i n /H (12)
Fl i sup=1/1+e−(Σw i n −Σw i o /H) (13)
| TABLE 1 |
| Summary of the dataset (Highway 401, Ontario) |
| Variables | Mean | Max | Min | St. dev. | Sample size |
| Collisions (per year) | 23.81 | 468 | 0 | 50.02 | Total: 3762 |
| AADT (veh/day) | 76633 | 442900 | 12000 | 91476 | (year 2000-2008) |
| Segment Length (km) | 1.95 | 12.7 | 0.2 | 2.06 | Training: 2926 |
| AADCT (veh/day) | 13993 | 42076 | 0 | 6719 | (year 2000-2006) |
| Median width (m) | 11.11 | 30.5 | 0.6 | 6.14 | Testing: 836 |
| Shoulder width-right (m) | 3.14 | 4 | 2.6 | 0.28 | (year 2007-2008) |
| Curve deflection (per km) | 0.19 | 1.86 | 0 | 0.35 | |
| Shoulder width-left (m) | 1.6 | 5.19 | 0 | 1.19 | |
| TABLE 2 |
| Method Testing Comparison |
| Numerical | DNN | DNN | |||
| Min | Min | Calculated | Unsupervised | Final | |
| Methods | MAE | RMSE | FI | Learning FI | FI |
| NB | 11.80 | 26.60 | / | / | / |
| KR | 8.85 | 17.85 | / | / | / |
| BPNN | 8.60 | 16.51 | / | / | / |
| R-DBN | 8.00 | 15.24 | 0.000 | / | / |
| R-DBN without | 11.83 | 26.02 | 0.228 | 0.428 | 0.928 |
| Featurel | |||||
| R-DBN without | 7.58 | 15.03 | −0.053 | 0.117 | −0.321 |
| Feature2 | |||||
| R-DBN without | 9.02 | 19.03 | 0.128 | 0.143 | 0.688 |
| Feature3 | |||||
| R-DBN without | 8.82 | 19.20 | 0.101 | 0.084 | 0.589 |
| Feature4 | |||||
| R-DBN without | 8.34 | 15.95 | 0.043 | 0.087 | 0.635 |
| Feature5 | |||||
| R-DBN without | 9.24 | 17.86 | 0.155 | 0.393 | 1.015 |
| Feature6 | |||||
| R-DBN without | 9.54 | 17.21 | / | / | / |
| Hid-layer2 | |||||
Note: NB represents negative binomial, KR represents kernel regression, BPNN represents back propagation neural network, R-DBN represents regularized deep belief network, and FI represents feature importance.
- [1] A. Adadi, and M. Berrada, Peeking inside the black-box: a survey on explainable artificial intelligence (XAI). IEEE Access, vol. 1, pp. 1, 2018.
- [2] S. Wojciech, T. Wiegand, and K. Müller, Explainable artificial intelligence:
- [3] Y. LeCun, Y. Bengio, and G. Hinton, Deep learning. Nature, vol. 521, no. 7553, pp. 436-444, 2015.
- [4] N. Papernot, P. McDaniel, I. Goodfellow, S. Jha, Z. B. Celik, and A. Swami, Practical black-box attacks against deep learning systems using adversarial examples, arXiv preprint arXiv: 1602.02697, 2016.
- [5] N. Narodytska, and S. P. Kasiviswanathan, Simple black-box adversarial attacks on deep neural networks, In Proceedings of the IEEE Conference on Computer Vision and Pattern Recognition Workshops, pp. 6-14, 2017.
- [6] R. Guidotti, A. Monreale, S. Ruggieri, F. Turini, F. Giannotti, and D. Pedreschi, A survey of methods for explaining black box models, ACM Computing Surveys (CSUR), vol. 51, no. 5, article. 93, 2018.
- [7] D. V. Carvalho, E. M. Pereira, and J. S. Cardoso, Machine learning interpretability: a survey on methods and metrics. Electronics, vol. 8, no. 8, pp. 832, 2019.
- [8] M. Du, N. Liu, X. Hu, Techniques for interpretable machine learning. arXiv 2018, arXiv:1808.00033
- [9] A. Shrikumar, P. Greenside, and A. Kundaje, Learning important features through propagating activation differences, arXiv preprint arXiv:1704.02685, 2017.
- [10] M. Bojarski, A. Choromanska, K. Choromanski, B. Firner, L. Jackel, UrsMuller, and K. Zieba, VisualBackProp: Visualizing CNNs for autonomous driving, CoRR, vol. abs/1611.05418, 2016.
- [11] M. D. Zeiler, and R. Fergus, Visualizing and understanding convolutional networks, In European Conference on Computer Vision, pp. 818-833, 2014.
- [12] W. Samek, A. Binder, G. Montavon, S. Lapuschkin, and K. R. Müller, Evaluating the visualization of what a deep neural network has learned, IEEE Transactions on Neural Networks and Learning Systems, vol. 28, no. 11, pp. 2660-2673, 2017.
- [13] M. F. Hohman, M. Kahng, R. Pienta, and D. H. Chau. Visual analytics in deep learning: An interrogative survey for the next frontiers. IEEE transactions on visualization and computer graphics, pp. 1-20, 2018.
- [14] M. F. Hohman, H. Park, C. Robinson, and D. H. Chau. Summit: Scaling deep learning interpretability by visualizing activation and attribution summarizations. IEEE Transactions on Visualization and Computer Graphics (TVCG). Vancouver, Canada, 2020.
- [15] R. Garcia. A task-and-technique centered survey on visual analytics for deep learning model engineering. Computers and Graphics, vol. 77, pp. 30-49, 2018.
- [16] R. Shwartz-Ziv, and N. Tishby, Opening the black box of deep neural networks via information, arXiv preprint arXiv:1703.00810, 2017.
- [17] P. W. Koh, and P. Liang, Understanding black-box predictions via influence functions, In Proceedings of the 34th International Conference on Machine Learning, pp. 1885-1894, 2017.
- [18] J. Thiagarajan, B. Kailkhura, P. Sattigeri, and K. Ramamurthy, Tree-View: peeking into deep neural networks via feature-space partitioning, arXiv preprint arXiv:1611.07429, 2016.
- [19] Y. Lee, A. Scolari, B. Chun, M. D. Santambrogio, M. Weimer, and M. Interlandi, PRETZEL: opening the black box of machine learning prediction serving systems, In 13th USENIX Symposium on Operating Systems Design and Implementation, pp. 611-626, 2018.
- [20] M. Honegger, Shedding light on black box machine learning algorithms: development of an axiomatic framework to assess the quality of methods that explain individual predictions, arXiv preprint arXiv:1808.05054, 2018.
- [21] Guangyuan Pan a, Liping Fu a,b, , Lalita Thakali, Development of a global road safety performance function using deep neural networks, International Journal of Transportation Science and Technology 6 (2017) 159-173.

Claims (20)
Fl i =Fl i unsup +Fl i sup
Fl i =Fl i unsup +Fl i sup
Priority Applications (1)
| Application Number | Priority Date | Filing Date | Title |
|---|---|---|---|
| US16/815,847 US11556800B2 (en) | 2020-03-11 | 2020-03-11 | Decipherable deep belief network method of feature importance analysis for road safety status prediction |
Applications Claiming Priority (1)
| Application Number | Priority Date | Filing Date | Title |
|---|---|---|---|
| US16/815,847 US11556800B2 (en) | 2020-03-11 | 2020-03-11 | Decipherable deep belief network method of feature importance analysis for road safety status prediction |
Publications (2)
| Publication Number | Publication Date |
|---|---|
| US20210287100A1 US20210287100A1 (en) | 2021-09-16 |
| US11556800B2 true US11556800B2 (en) | 2023-01-17 |
Family
ID=77665542
Family Applications (1)
| Application Number | Title | Priority Date | Filing Date |
|---|---|---|---|
| US16/815,847 Active 2041-04-15 US11556800B2 (en) | 2020-03-11 | 2020-03-11 | Decipherable deep belief network method of feature importance analysis for road safety status prediction |
Country Status (1)
| Country | Link |
|---|---|
| US (1) | US11556800B2 (en) |
Families Citing this family (5)
| Publication number | Priority date | Publication date | Assignee | Title |
|---|---|---|---|---|
| CN113947904A (en) * | 2021-10-19 | 2022-01-18 | 北京中交国通智能交通系统技术有限公司 | Multi-scale short-term traffic flow prediction method based on S-G filtering and deep belief network |
| CN113920738B (en) * | 2021-10-26 | 2023-04-21 | 北京工业大学 | Urban trunk security analysis model migration method based on different country merging data |
| CN115913991B (en) * | 2022-11-15 | 2024-09-24 | 中国联合网络通信集团有限公司 | Business data prediction method, device, electronic device and storage medium |
| CN116862348B (en) * | 2023-07-28 | 2024-01-30 | 浪潮智慧科技有限公司 | Method, equipment and medium for predicting cargo transportation quantity |
| CN117522080B (en) * | 2024-01-02 | 2024-04-09 | 国网湖北省电力有限公司经济技术研究院 | Method, system and equipment for linkage optimization of progress safety and cost of power transmission project |
-
2020
- 2020-03-11 US US16/815,847 patent/US11556800B2/en active Active
Non-Patent Citations (23)
| Title |
|---|
| Adadi, A. et al., "Peeking Inside the Black-Box: A Survey on Explainable Artificial Intelligence (XAI)," IEEE Access, 2018, 6:52138-52160, IEEE. |
| Bojarski, M. et al., "VisualBackProp: visualizing CNNs for autonomous driving," arXiv, Nov. 16, 2016, pp. 1-12. |
| Carvalho, D. V. et al., "Machine Learning Interpretability: A Survey on Methods and Metrics," Electronics, 2019, 8(832):1-34. |
| Chen et al. (A Survey on an Emerging Area: Deep Learning for Smart City Data), Oct. 2019, IEEE https://ieeexplore.ieee.org/document/8704334?source=IQplus (Year: 2019). * |
| Du, M. et al., "Techniques for Interpretable Machine Learning," Communications of the ACM, May 19, 2019, pp. 1-9. |
| Guidotti, R. et al., "A Survey of Methods For Explaining Black Box Models," ACM Computing Surveys, Jun. 21, 2018, pp. 1-46. |
| Hohman, F. et al., "SUMMIT: Scaling Deep Learning Interpretability by Visualizing Activation and Attribution Summarizations," IEEE Transactions on Visualization and Computer Graphics, Aug. 2019, pp. 1-12. |
| Hohman, F. et al., "Visual Analytics in Deep Learning: An Interrogative Survey for the Next Frontiers," IEEE Transactions on Visualization and Computer Graphics, May 14, 2018, pp. 1-21. |
| Honegger, M. R. et al., "Shedding Light on Black Box Machine Learning Algorithms Development of an Axiomatic Framework to Assess the Quality of Methods that Explain individual Predictions," arXiv, Aug. 15, 2018, pp. 1-93. |
| Koh, P. W. et al., "Understanding Black-box Predictions via Influence Functions," Proceedings of the 34th International Conference on Machine Learning, 2017, pp. 1-10. |
| Lecun, Y. et al., "Deep learning," Nature, May 28, 2015, 521:436-444, Macmillan Publishers Limited. |
| Lee, Y. et al., "PRETZEL: Opening the Black Box of Machine Learning Prediction Serving Systems," 1313 USENIX Symposium on Operating Systems Design and Implementation, Oct. 14, 2018, pp. 1-17. |
| Narodytska, N. et al., "Simple Black-Box Adversarial Attacks on Deep Neural Networks," IEEE Conference on Computer Vision and Pattern Recognition Workshops (CVPRW), Aug. 24, 2017, pp. 1-9. |
| Pan et al. (Development of a Global Road Safety Performance Function Using Deep Neural Networks), Aug. 2017, Science Direct https://www.sciencedirect.com/science/article/pii/S2046043017300199#f0005 (Year: 2017). * |
| Pan, G. et al., "Development of a global road safety performance function using deep neural networks," International Journal of Transportation Science and Technology, 2017, 6:159-173, Tongji University and Tongji University Press. |
| Papernot, N. et al., "Practical Black-Box Attacks against Deep Learning Systems using Adversarial Examples," Proceedings of the 2017 ACM Asia Conference on Computer and Communications Security, Nov. 7, 2016, pp. 1-16. |
| Samek, W. et al., "Evaluating the visualization of what a Deep Neural Network has learned," IEEE Transactions on Neural Networks and Learning Systems, Sep. 21, 2015, pp. 1-13. |
| Samek, W. et al., "Explainable Artificial Intelligence: Understanding, Visualizing and Interpreting Deep Learning Models." ITU Journal: ICT Discoveries, Aug. 28, 2017, 1:1-8. |
| Shrikumar, A. et al., "Learning Important Features Through Propagating Activation Differences," arXiv preprint, Oct. 12, 2019, pp. 1-9. |
| Shwartz-Ziv, R. et al., "Opening the Black Box of Deep Neural Networks via Information," arXiv preprint, Mar. 2, 2017, pp. 1-10. |
| Thiagarajan, J. J. et al., "TreeView: Peeking into Deep Neural Networks Via Feature-Space Partitioning," 30th Conference on Neural Information Processing Systems (NIPS 2016), Nov. 22, 2016, pp. 1-5. |
| Tjoa, E. et al., "A Survey on Explainable Artificial Intelligence (XAI): towards Medical XAI," arXiv, 2019, pp. 1-16. |
| Zeiler, M. D. et al., "Visualizing and Understanding Convolutional Networks," ECCV, 2014, pp. 818-833, Springer International Publishing Switzerland. |
Also Published As
| Publication number | Publication date |
|---|---|
| US20210287100A1 (en) | 2021-09-16 |
Similar Documents
| Publication | Publication Date | Title |
|---|---|---|
| US11556800B2 (en) | Decipherable deep belief network method of feature importance analysis for road safety status prediction | |
| US12174907B2 (en) | Graph convolutional networks with motif-based attention | |
| Chattopadhyay et al. | Neural network attributions: a causal perspective | |
| CN111782840B (en) | Image question-answering method, device, computer equipment and medium | |
| US20250139457A1 (en) | Training a neural network to perform a machine learning task | |
| Akintayo et al. | Prognostics of combustion instabilities from hi-speed flame video using a deep convolutional selective autoencoder | |
| KR102011788B1 (en) | Visual Question Answering Apparatus Using Hierarchical Visual Feature and Method Thereof | |
| US20210089867A1 (en) | Dual recurrent neural network architecture for modeling long-term dependencies in sequential data | |
| EP3965021B1 (en) | A method of using clustering-based regularization in training a deep neural network to classify images | |
| JP7540632B2 (en) | Neural networks with layers for solving semidefinite programming problems | |
| US20250265472A1 (en) | Diffusion-reward adversarial imitation learning | |
| CN118587760A (en) | A method, device, equipment and storage medium for identifying abnormal behavior of pedestrians in escalator | |
| Zhang et al. | Intelligent Information Processing with Matlab | |
| She et al. | Safe-dnn: A deep neural network with spike assisted feature extraction for noise robust inference | |
| Farsang et al. | Liquid resistance liquid capacitance networks | |
| US20230376724A1 (en) | Methods, systems, and media for contextual discriminative explanation of convolutional neural networks | |
| Yu et al. | A Comparative Study of Bayesian Neural Networks and Machine Learning Based on COVID-19 Image Classification | |
| Vale et al. | A co-training-based algorithm using confidence values to select instances | |
| Chien et al. | Bayesian multi-temporal-difference learning | |
| Perrinet | Feature detection using spikes: the greedy approach | |
| Sultana et al. | Epistemic wrapping for uncertainty quantification | |
| Nyiri et al. | Relative Layer-Wise Relevance Propagation: a more Robust Neural Networks eXplaination | |
| Nuzzo | Sanity checks for explanations of deep neural networks predictions | |
| CN121032801B (en) | Alternating diffusion band selection and degradation adaptive hyperspectral image super-resolution method | |
| Paleja et al. | Learning Interpretable, High-Performing Policies for Continuous Control |
Legal Events
| Date | Code | Title | Description |
|---|---|---|---|
| FEPP | Fee payment procedure |
Free format text: ENTITY STATUS SET TO UNDISCOUNTED (ORIGINAL EVENT CODE: BIG.); ENTITY STATUS OF PATENT OWNER: SMALL ENTITY |
|
| FEPP | Fee payment procedure |
Free format text: ENTITY STATUS SET TO SMALL (ORIGINAL EVENT CODE: SMAL); ENTITY STATUS OF PATENT OWNER: SMALL ENTITY |
|
| AS | Assignment |
Owner name: THE CHINESE UNIVERSITY OF HONG KONG, CHINA Free format text: ASSIGNMENT OF ASSIGNORS INTEREST;ASSIGNORS:YU, MING;PAN, GUANGYUAN;ZHANG, YING;REEL/FRAME:052273/0160 Effective date: 20200326 |
|
| STPP | Information on status: patent application and granting procedure in general |
Free format text: DOCKETED NEW CASE - READY FOR EXAMINATION |
|
| STPP | Information on status: patent application and granting procedure in general |
Free format text: NON FINAL ACTION MAILED |
|
| STPP | Information on status: patent application and granting procedure in general |
Free format text: RESPONSE TO NON-FINAL OFFICE ACTION ENTERED AND FORWARDED TO EXAMINER |
|
| STPP | Information on status: patent application and granting procedure in general |
Free format text: NOTICE OF ALLOWANCE MAILED -- APPLICATION RECEIVED IN OFFICE OF PUBLICATIONS |
|
| STPP | Information on status: patent application and granting procedure in general |
Free format text: PUBLICATIONS -- ISSUE FEE PAYMENT VERIFIED |
|
| STCF | Information on status: patent grant |
Free format text: PATENTED CASE |