US11461344B2 - Data processing method and electronic device - Google Patents
Data processing method and electronic device Download PDFInfo
- Publication number
- US11461344B2 US11461344B2 US16/368,382 US201916368382A US11461344B2 US 11461344 B2 US11461344 B2 US 11461344B2 US 201916368382 A US201916368382 A US 201916368382A US 11461344 B2 US11461344 B2 US 11461344B2
- Authority
- US
- United States
- Prior art keywords
- variable
- variables
- determining
- computer
- independence
- Prior art date
- Legal status (The legal status is an assumption and is not a legal conclusion. Google has not performed a legal analysis and makes no representation as to the accuracy of the status listed.)
- Active, expires
Links
Images


Classifications
-
- G—PHYSICS
- G06—COMPUTING OR CALCULATING; COUNTING
- G06F—ELECTRIC DIGITAL DATA PROCESSING
- G06F16/00—Information retrieval; Database structures therefor; File system structures therefor
- G06F16/20—Information retrieval; Database structures therefor; File system structures therefor of structured data, e.g. relational data
- G06F16/24—Querying
- G06F16/245—Query processing
- G06F16/2458—Special types of queries, e.g. statistical queries, fuzzy queries or distributed queries
- G06F16/2465—Query processing support for facilitating data mining operations in structured databases
-
- G—PHYSICS
- G06—COMPUTING OR CALCULATING; COUNTING
- G06N—COMPUTING ARRANGEMENTS BASED ON SPECIFIC COMPUTATIONAL MODELS
- G06N20/00—Machine learning
-
- G—PHYSICS
- G06—COMPUTING OR CALCULATING; COUNTING
- G06N—COMPUTING ARRANGEMENTS BASED ON SPECIFIC COMPUTATIONAL MODELS
- G06N7/00—Computing arrangements based on specific mathematical models
- G06N7/01—Probabilistic graphical models, e.g. probabilistic networks
Definitions
- Embodiments of the present disclosure relate to the field of data mining and machine learning, and more specifically, to a data processing method, an electronic device and a computer-readable storage medium for determining causal relations among a plurality of variables.
- causal relation learning is aimed at restoring complex mechanism of actions behind the system automatically with a computer and reproducing a data generation process based on observation data of the system.
- causal relation learning has been applied to various fields, such as market analysis, pharmacy, manufacturing and so on to have an insight into nature of the system and further guide decision-making.
- causal relation learning technology is able to find the cause of sales decline by analyzing sales-related data, thereby helping merchants with improving sales.
- causal relation learning technology is able to help health care centers by analyzing root causes of their customers' churn and assist in the development of their customer retention scheme.
- causal relation learning technology can support timely prediction on whether project under developing has risks of delays and low quality etc., and locate the causes of the risks so as to support automated management of software development.
- a causal relation Bayesian network is a mainstream method for discovering a causal relation. It may be further divided into statistical independence-based method (for example, constraint-based method) and score-based method. However, accuracy of causal relation obtained with these two kinds of methods is generally not satisfactory.
- Embodiments of the present disclosure provide a method for data processing, an electronic device and a computer-readable storage medium, with which causal relations can be accurately obtained.
- a data processing method comprising obtaining a model representing causal relations among a plurality of variables based on a set of observation data of the plurality of variables.
- the method further comprises determining, based on the model, a first and second variables having direct causal relation in the plurality of variables.
- the method further comprises determining whether the first and second variables are independent from each other.
- the method further comprises in response to the first and second variables being independent from each other, deleting the direct causal relation between the first and second variables from the model.
- an electronic device comprising a processor and a memory having instructions stored thereon which, when executed by the processor, cause the electronic device to perform acts of: obtaining a model representing causal relations among the plurality of variables based on a set of observation data of the plurality of variables; determining, based on the model, a first and a second variables having direct causal relation in the plurality of variables; determining whether the first and second variables are independent from each other; and in response to the first and second variables being independent from each other, deleting the direct causal relation between the first and second variables from the model.
- a computer-readable storage medium having computer-executable instructions stored thereon which, when executed, cause a computer to perform the method according to the first aspect of the present disclosure.
- FIG. 1 is a schematic diagram illustrating an exemplary runtime environment in which embodiments of the present disclosure may be implemented
- FIG. 2 illustrates an initial causal relation model obtained with a model training system in FIG. 1 ;
- FIG. 3 illustrates an optimized causal relation model outputted by a model optimization system in FIG. 1 ;
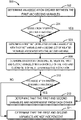
- FIG. 4 illustrates a flowchart of a data processing method in accordance with embodiments of the present disclosure
- FIG. 5 illustrates a flowchart of a method for determining whether two variables are independent in accordance with embodiments of the present disclosure
- FIG. 6 is a schematic block diagram of an exemplary device that may be used to implement embodiments of the present disclosure.
- model generally refers to a relational structure of a certain system that is generally or approximately expressed in a mathematical language with reference to features of the system.
- causal relation model generally refers to a model that describes a causal relation structure of a system.
- causal relations among a plurality of factors is determined based on analysis to the big data, so as to provide relevant decisions for specific fields.
- causal relations among a plurality of variables are normally discovered with statistical independence-based methods and score-based methods.
- the statistical independence-based methods employ independence test to determine whether there is causal relation between variables and the direction of the causal relations.
- Representative algorithms include PC (Perter-Clark) algorithm, stable PC, PCI (Fast Causal Inference) and the like.
- PC Perter-Clark
- PCI Fest Causal Inference
- Score-based method may measure the degree of fitness between the observation data and the causal relation network by designing decomposable scoring criteria, and guide a search for the optimal causal network, e.g., GES (Greedy Equivalence Search), with the scoring criteria.
- GES Genetic Equivalence Search
- causal relation with low accuracy cannot provide users with proper decisions, or even mislead the users, thereby causing negative influence.
- product retail field as an example, if two variables that have no causal relation originally are considered to have a causal relation, for example, wind is taken as a cause of sales rise of umbrellas by mistake, it would mislead umbrella retailers to increase supply of umbrellas when it is windy but does not rain, which actually will not bring any benefits.
- a data processing method, an electronic device and a computer-readable storage medium for enabling a computer to discover innate causal relations among a plurality of variables more accurately.
- preliminary causal relations are obtained based on a set of observation data of a plurality of variables using, for instance, score-based causal relation learning method. Then, the preliminary causal relations are optimized using independence check and/or conditional independence check to remove pseudo-causes in the preliminary causal relations thereby obtaining optimized causal relations.
- embodiments of the present disclosure may be applied to the product retail field, health care field, and software development field.
- embodiments of the present disclosure are not limited to the above-mentioned fields, but can be applied to any data processing and analyzing fields that enable a computer to understand causal relations contained in data.
- FIGS. 1 to 6 describe the solution of the present disclosure for determining the causal relations among a plurality of variables.
- this description is only for the purpose of illustration and the present disclosure is not limited to these embodiments and details in the drawings.
- FIG. 1 is a schematic diagram illustrating a runtime environment 100 in which embodiments of the present disclosure may be implemented. It is to be understood that the environment 100 shown in FIG. 1 is only an example in which embodiments of the present disclosure may be implemented, without limiting the application environment and scenario of the present disclosure. Embodiments of the present disclosure are also applicable to other environment or architecture.
- the environment 100 may include a data storage system 120 .
- the data storage system 120 is used for storing a set of observation data X (X ⁇ R N ⁇ D ) of a plurality of variables, which may be represented as an N*D matrix, where N is the number of observed samples and D is the number of dimensions of observed variables or number of the observed variables.
- N is the number of observed samples
- D is the number of dimensions of observed variables or number of the observed variables.
- the observed variables are season, temperature, humidity, weather (for example, whether it rains), sales volume of umbrella, sales volume of ice cream and sales volume of sunscreen cream, then the number D of the observed variables is 7.
- the number N of the observed samples is 30 and the observed samples of the i th day (1 ⁇ i ⁇ 30) are consist of the season of the day, the temperature of the day, whether it rains that day, the sales volume of umbrella that day, the sales volume of ice cream that day and the sales volume of sunscreen cream that day.
- Data in the set X of observation data may be data from a third party (e.g., sales website, weather forecast provider and so on) or the data may be collected in other ways.
- the data may be pre-processed in advance, for example, pre-processing like integration, specification, and noise reduction and so on to raw data. These pre-processing operations per se are already known in the art and will not be repeated herein.
- the environment 100 may further include a model training system 110 which receives a set X of observation data of a plurality of observed variables from the data storage system 120 .
- the model training system 110 may obtain a preliminary model (also referred to as a preliminary causal relation model below) representing causal relations among a plurality of variables based on the set of observation data using an existing technology e.g., score-based Bayesian causal relation network or other causal relation discovery technology.
- the preliminary causal relation model may be generated through training based on the set of observation data.
- FIG. 2 illustrates a preliminary causal relation model 200 obtained with the model training system 110 .
- the preliminary causal relation model 200 is represented as a directed acyclic graph in which the nodes represent a plurality of variables and a directed edge between two nodes denotes the existence of direct causal relation between the two nodes and the direction of the causal relation, for example, the source node is a direct cause of the target node.
- the directed acyclic graph is only an exemplary representation of causal relation and embodiments of the present disclosure are not limited in this regard. Those skilled in the art may represent the causal relation in other manners according to an actual application.
- the causal relation model 200 shown in FIG. 2 represents the causal relations among 37 variables.
- 37 is only an illustrative number of variables and the number of variables may be any integer greater than 1 based on an actual application.
- FIG. 2 there is a directed edge between node 5 and node 6, indicating that the variable represented by the node 5 is a direct cause of the variable represented by the node 6 and the variable represented by the node 6 is a direct result of the variable represented by the node 5, that is, there is a direct causal relation between the two variables.
- the environment 100 may further include a model optimization system 140 which receives the preliminary causal relation model 200 from the model training system 110 and determines variables having direct causal relations based on the causal relation model 200 , e.g., variables 5 and 6, variables 6 and 27, variables 13 and 9 and so on, as shown in FIG. 2 .
- a model optimization system 140 which receives the preliminary causal relation model 200 from the model training system 110 and determines variables having direct causal relations based on the causal relation model 200 , e.g., variables 5 and 6, variables 6 and 27, variables 13 and 9 and so on, as shown in FIG. 2 .
- the model optimization system 140 may determine whether two variables having direct causal relations are independent or conditionally independent based on a statistical method (in embodiments of the present disclosure, independence and conditional independence are collectively referred to as independence). For two variables being determined as independent, the model optimization system 140 may delete the direct causal relation between the two variables from the preliminary causal relation model.
- the model optimization system 140 may repeat the above process for each direct causal relation in the preliminary causal relation model, so as to obtain an optimized causal relation model and output it, for example, storing in a model storage system 130 for subsequent use.
- the optimized model may be obtained from the model storage system 130 and data analysis may be performed based on this model to provide a proper decision.
- the optimized casualty model may formulate strategies automatically for a user, or assist the user in formulating strategies for improving sales volume of umbrella or ice cream or sunscreen cream.
- model training system 110 the model optimization system 140 , the data storage system 120 and the model storage system 130 are shown as separated from each other in FIG. 1 , embodiments of the present disclosure are not limited in this regard. Based on an actual application, the model training system 110 and model optimization system 140 may be integrated, and the data storage system 120 and model storage system 130 may also be integrated.
- FIG. 3 illustrates an optimized causal relation model 300 outputted by the model optimization system 140 .
- the optimized causal relation model 300 shown in FIG. 3 since the variables 6 and 27 are independent, the edge between the variables 6 and 27 is deleted.
- random variables X and Y being independent means that the occurrence of the variable Y will not influence the variable X, that is, the variable Y will not be the cause of the variable X, or the variable X will not be the effect of the variable Y, and vise verse.
- the model optimization system 140 actually deletes pseudo-causes exactly based on this principle so that the causal relation represented by the optimized causal relation model 300 outputted by the model optimization system 140 is more accurate.
- model optimization system 140 performs independence check for variables having direct causal relation based on the preliminary causal relation model 200 outputted by the model training system 110 rather than performing independence check for any two among the plurality of variables, it can save computational resources and improve computing speed while improving accuracy.
- FIG. 4 is a flowchart illustrating a processing method 400 for determining causal relations among a plurality of variables in accordance with embodiments of the present disclosure.
- Method 400 may be performed by the model training system 110 and model optimization system 140 shown in FIG. 1 jointly.
- the model training system 110 obtains a model representing causal relations among a plurality of variables, namely, a preliminary causal relation model, based on a set of observation data of the plurality of variables.
- the set of observation data of the plurality of variables may be from a variety of sources.
- the set of observation data may be from a retail website, a weather forecast provider and so on, or may be obtained by other means.
- the model training system 110 may obtain a preliminary causal relation model using various technologies.
- a score-based Bayesian network will be used as an example to describe the specific process for the model training system 110 to obtain a preliminary causal relation model.
- the model training system 110 may also employ other existing or forthcoming causal relation discovering learning technologies to obtain the preliminary causal relation model.
- variable ⁇ ji in the matrix B represents a direct cause relation between the j th variable and the i th variable among p variables.
- the variable ⁇ ji in the matrix B represents whether variable i is a direct cause of variable j.
- variable i is a direct cause of variable j.
- ⁇ ji and ⁇ ij represent different causal relationships.
- the directions of edges in the directed graph represented by the matrix B are different.
- a diagonal part in the matrix B represents the causal relation between each element and itself. Since there is no causal relation between specific elements with themselves, the values of the elements at the diagonal part should be set to 0.
- the problem of determining causal relations among p variables based on a set of observation data may be converted into a solution process for the matrix B describing the causal relations among a plurality of elements.
- Scoring criteria associated with causal relation may be defined based on a set of observation data and the above matrix B. For example, fitting degree of the set of observation data to the causal relation network may be determined as the scoring criteria based on the following equation:
- ⁇ j represents the j th row of the matrix B
- x 3 denotes the observation data of the j th variable
- x j represents the observation data of variables apart from the j th variable
- L2-Norm operation
- ⁇ ⁇ 1 represents L1-Norm operation.
- the matrix B representing causal relations may be obtained by solving the problem equation.
- the matrix B may be solved with a search algorithm described in the article A* Lasso for learning a sparse Bayesian network structure for continuous variables (NIPS, 2013) by Jing Xiang, Seyoung Kim et al. so as to obtain the preliminary causal relation model.
- scoring criteria, problem equation and solution of the problem equation described herein are only exemplary, and embodiments of the present disclosure are not limited in this regard. Those skilled in the art may define other scoring criteria and problem equation and utilize other search algorithms to solve the problem equation based on actual needs.
- the model optimization system 140 determines a first and a second variables having direct causal relation among the plurality of variables based on the preliminary causal relation model obtained at block 402 .
- the model optimization system 140 may traverse the directed acyclic graph 200 with graph traversing algorithm to determine directed edges in the directed acyclic graph 200 so as to determine two variables associated with the directed edges, namely, the two variables having a direct causal relation. More specifically, when the causal relation model is represented as the matrix B mentioned above, the model optimization system 140 may determine two variables having direct causal relation by looking up non-zero elements in the matrix B. For example, if ⁇ ji is non-zero, it can be determined that variables j and i are two variables having a direct causal relation.
- the model optimization system 140 determines whether the first and second variables are independent based on the set of observation data. Statistically, Independence between two random variables denotes refers to that the occurrence probabilities of the two variables do not influence each other. That is, if the probability that the first and second variables occur simultaneously equals to a product of their respective occurrence probability, the first and second variables are independent from each other. In most cases, variables influence each other more or less, while normally this kind of influence relies on other variables instead of being generated directly. To this end, in embodiments of the present disclosure, the model optimization system 140 may further determine whether the first and second variables are conditionally independent under a certain condition. Statistically, conditional independence between two random variables means that the occurrence probabilities of the two variables do not influence each other under the occurrence of other variables. How to determine whether the first and second variables are independent from each other will be described in detail later with reference to FIG. 5 .
- the model optimization system 140 deletes the direct causal relation between the first and second variables from the preliminary causal relation model.
- the model optimization system 140 may delete the edge between the node representing the first variable and the node representing the second variable from the directed acyclic graph 200 . More specifically, where the causal relation model is represented as the matrix B mentioned above, the model optimization system 140 may set the element in the matrix B associated with the first and second variables as 0. As shown in FIGS.
- the edge between node 6 and node 27, the edge between node 8 and node 32, the edge between node 31 and node 30, and the edge between node 16 and node 20 and so on are deleted because of independence or conditional independence between nodes, thereby obtaining the optimized causal relation model as shown in FIG. 3 in which pseudo-causes are removed.
- two variables being independent or conditionally independent denotes that the occurrence probabilities of the two variables do not influence each other, namely, the occurrence of one variable does not influence the occurrence of the other. In other words, if two variables are independent or conditionally independent, it demonstrates that one of the two variables cannot be the cause or effect of the other.
- the direct causal relation between these two variables is not true, namely, pseudo-cause. Therefore, deleting the pseudo-cause from the preliminary causal relation model will make the model more accurate.
- FIG. 5 is a flowchart illustrating a method 500 for determining whether two variables are independent in accordance with embodiments of the present disclosure.
- the method 500 may be performed by the model optimization system 140 shown in FIG. 1 .
- the model optimization system 140 may determine an association degree between the first and second variables based on a set of observation data.
- the association degree may be used as a measurement of the relationship between the probability of co-occurrence of the first and second variables and the probability that two variables occur separately.
- the model optimization system 140 may determine types of the first and second variables and select an independence decision method based on the determined types. For example, in the example of the product retail field mentioned above, variables “season” and “weather” are discrete variables while variables “temperature,” “weather,” “sales volume of umbrella,” “sales volume of ice cream” and “sales volume of sunscreen cream” are continuous variables. Based on the types of the first and second variables, the corresponding calculation method of the association degree may be adopted so as to ensure the feasibility of calculation and improve accuracy of calculation.
- the model optimization system 140 may employ a continuous independence decision method such as Pearson correlation test to determine the association degree between the first and second variables. For example, based on the observation data associated with the first variable and the observation data associated with the second variable, a Pearson correlation coefficient between the two variables is calculated as the association degree.
- a continuous independence decision method such as Pearson correlation test
- the model optimization system 140 may determine the association degree between the first and second variables by adopting a discrete independence decision method such as chi-square test. For example, the deviation degree between the value inferred from the assumption that the first and second variables are independent and the actual value of a set of observation data may be used as the association degree between the first and second variables.
- the model optimization system 140 may adopt a hybrid independence check method such as GP-HSIC (Gaussian process-Hilbert-Schmidt independence criterion) to determine the association degree between the first and second variables.
- GP-HSIC Gausian process-Hilbert-Schmidt independence criterion
- the model optimization system 140 may determine whether the association degree between the first and second variables is within a first threshold range.
- the selection of the first threshold range depends on the specific application and the independence decision method in use. In one embodiment of the present disclosure, it may be predefined. If the association degree is within the first threshold range, for example, the Pearson correlation coefficient between two continuous variables is less than the first threshold, it means that the first and second variables are unconditionally independent. In this light, in response to the association degree being within the first threshold range, at block 512 , the model optimization system 140 may determine that the first and second variables are independent.
- the model optimization system 140 may further determine whether the first and second variables are conditionally independent. To this end, in response to the association degree exceeding the first threshold range, at block 506 , the model optimization system 140 may determine a first set of related variables associated with the first variable and a second set of related variables associated with the second variable.
- the model optimization system 140 may determine a set of parent nodes and spouse nodes of the first variable as the first set of related variables, and the model optimization system 140 may determine a set of the parent nodes and spouse nodes of the second variable as the second set of related variables.
- the parent nodes of node 8 is node 7 and node 9
- the spouse nodes of node 8 (namely, nodes having the same child node as node 8) is node 28 and node 31, and thus, the variable set associated with the node 8 is ⁇ node 7, node 9, node 28, and node 31 ⁇ .
- Markov blanket sets of the first and second variables may be determined based on a set of observation data, respectively and used as the first and second sets of related variables, respectively.
- the Markov blanket set for a variable X may be defined as follows: assuming that a complete set U of random variables is divided into three mutually exclusive parts-variable X and set A and set B, which do not intersect and whose union set is U. If when the set A is given, the variable X and set B are unrelated, and then the set A is a Markov blanket set of variable X.
- Markov blanket learning technology that is already known in the art may be used to determine the Markov blanket sets for the first and second variables, which will not be repeated here.
- the model optimization system 140 may determine an association degree between the first and second variables with a union set of the first and second sets of related variables as a condition, which may be abbreviated as conditional association degree in the following.
- the model optimization system 140 may select the conditional independence decision method based on types of the first variable, the second variable and the conditional variable in the union set. For example, if the first variable, the second variable and the conditional variable are all continuous variables, then the model optimization system 140 may select a continuous conditional independence decision method, for example, a partial correlation test, and calculate, under the condition of union set of the first and second sets of related variables, the partial correlation measurement of the first and second variables as conditional association degree.
- a continuous conditional independence decision method for example, a partial correlation test
- the model optimization system 140 may select a discrete decision method (for example, a chi-square test) to determine the conditional association degree. For example, the deviation degree between the assumed value inferred under the condition that the first and second variables are conditionally independent (with the union set of the first and second sets of related variables as a condition) and the actual value may be used as the conditional association degree.
- a discrete decision method for example, a chi-square test
- the model optimization system 140 may select a hybrid check method (such as GP-HSIC or PCI-Permute (Permutation-based Kernel conditional Independence Test)) to determine the conditional association degree.
- a hybrid check method such as GP-HSIC or PCI-Permute (Permutation-based Kernel conditional Independence Test)
- the model optimization system 140 may determine whether the conditional association degree is within a second threshold range.
- the second threshold range may be the same as or different from the first threshold and it also depends on actual application and the independence decision method in use, and may be predefined.
- the model optimization system 140 in response to the conditional association degree being within the second threshold range, the model optimization system 140 may determine that the first and second variables are independent from each other.
- the model optimization system 140 in response to the conditional association degree exceeding the second threshold range, the model optimization system 140 may determine that the first and second variables are not independent.
- the method 500 shown in FIG. 5 it is first determined at blocks 502 and 504 whether the first and second variables are statistically unconditionally independent. In response to the first and second variables not being unconditionally independent, it is determined at blocks 506 , 508 and 510 whether the two variables are statistically conditionally independent. In this manner, more pseudo-causes may be deleted from the causal relation model.
- method 500 is repeated so that all the pseudo-causes in the preliminary causal relation model can be found and deleted, thereby obtaining the optimized causal relation model as shown in FIG. 3 .
- This optimized causal relation model may be further used for follow-up data analysis.
- embodiments of the present disclosure can provide a more accurate causal relation model so as to gain an insight into the complex working mechanism and working process behind a system and provide more effective decisions to a user.
- FIG. 6 is a schematic block diagram illustrating an exemplary device 600 that may be used to implement embodiments of the present disclosure.
- the device 600 may be used to implement both the model training system 110 and model optimization system 140 shown in FIG. 1 .
- the device 600 includes a central processing unit (CPU) 601 which may execute various appropriate actions and processing based on the computer program instructions stored in a read-only memory (ROM) 602 or the computer program instructions loaded into a random access memory (RAM) 603 from a storage unit 608 .
- the RAM 603 may store various kinds of programs and data required by operating the storage device 600 .
- the CPU 601 , ROM 602 and RAM 603 are connected to each other via a bus 604 .
- An input/output (I/O) interface 605 is also connected to the bus 604 .
- I/O input/output
- a plurality of components in the device 600 are connected to the I/O interface 605 , including: an input unit 606 , for example, an keyboard, a mouse and the like; an output unit 607 , for example, various types of displays, loudspeakers and the like; a storage unit 608 , for example, a magnetic disk, an optical disk and the like; and a communication unit 609 , for example a network card, a modem, a wireless communication transceiver and the like.
- the communication unit 609 allows the device 600 to exchange information/data with other devices through computer networks such as Internet and/or various telecommunication networks.
- the processing unit 601 performs various methods and processing described above, for example, the method 400 and/or the method 500 .
- the method 400 and/or the method 500 may be implemented as computer software programs, which are tangibly included in a machine-readable medium, for example the storage unit 608 .
- the computer program may be partially or completely loaded and/or installed to the device 600 via the ROM 602 and/or the communication unit 609 .
- the CPU 601 may be configured to implement the method 400 and/or the method 500 in any other suitable manners (for example, by means of firmware).
- the functionally described herein may be performed, at least in part, by one or more hardware logic components.
- illustrative types of hardware logic components include field-programmable gate arrays (FPGAs), application-specific integrated circuits (ASICs), application-specific standard products (ASSPs), system-on-a-chip systems (SOCs), complex programmable logic devices (CPLDs), and the like.
- Program code for carrying out methods of the subject matter described herein may be written in any combination of one or more programming languages. These program codes may be provided to a processor or a controller of a general purpose computer, special purpose computer, or other programmable data processing apparatus, such that the program codes, when executed by the processor or the controller, cause the functions/operations specified in the flowcharts and/or block diagrams to be implemented.
- the program code may be executed entirely on a machine, partly on the machine, as a stand-alone software package, partly on the machine and partly on a remote machine or entirely on the remote machine or server.
- a machine readable medium may be any tangible medium that may contain, or store a program for use by or in connection with an instruction execution system, an apparatus, or a device.
- the machine readable medium may be a machine readable signal medium or a machine readable storage medium.
- a machine readable medium may include but not limited to an electronic, magnetic, optical, electromagnetic, infrared, or semiconductor system, apparatus, or device, or any suitable combination of the foregoing.
- machine readable storage medium More specific examples of the machine readable storage medium would include an electrical connection having one or more wires, a portable computer diskette, a hard disk, a random access memory (RAM), a read-only memory (ROM), an erasable programmable read-only memory (EPROM or Flash memory), an optical fiber, a portable compact disc read-only memory (CD-ROM), an optical storage device, a magnetic storage device, or any suitable combination of the foregoing.
- RAM random access memory
- ROM read-only memory
- EPROM or Flash memory erasable programmable read-only memory
- CD-ROM portable compact disc read-only memory
- magnetic storage device or any suitable combination of the foregoing.
Landscapes
- Engineering & Computer Science (AREA)
- Theoretical Computer Science (AREA)
- Physics & Mathematics (AREA)
- Software Systems (AREA)
- General Physics & Mathematics (AREA)
- Mathematical Physics (AREA)
- General Engineering & Computer Science (AREA)
- Data Mining & Analysis (AREA)
- Computing Systems (AREA)
- Evolutionary Computation (AREA)
- Artificial Intelligence (AREA)
- Databases & Information Systems (AREA)
- Medical Informatics (AREA)
- Probability & Statistics with Applications (AREA)
- Computer Vision & Pattern Recognition (AREA)
- Fuzzy Systems (AREA)
- Computational Linguistics (AREA)
- Computational Mathematics (AREA)
- Pure & Applied Mathematics (AREA)
- Algebra (AREA)
- Mathematical Analysis (AREA)
- Mathematical Optimization (AREA)
- Information Retrieval, Db Structures And Fs Structures Therefor (AREA)
- Management, Administration, Business Operations System, And Electronic Commerce (AREA)
Abstract
Description
where the matrix B is a p-order matrix containing p×p elements, and each element represents whether there is direct causal relation between two variables corresponding to the positions of the elements. Specifically, a variable βji in the matrix B represents a direct cause relation between the jth variable and the ith variable among p variables. For example, the variable βji in the matrix B represents whether variable i is a direct cause of variable j. Speaking concretely, if |βji|>0, then variable i is a direct cause of variable j. It is to be noted that different order of two variables represents different causal relations. Thus, βji and βij represent different causal relationships. In other words, the directions of edges in the directed graph represented by the matrix B are different. Moreover, a diagonal part in the matrix B represents the causal relation between each element and itself. Since there is no causal relation between specific elements with themselves, the values of the elements at the diagonal part should be set to 0.
where βj represents the jth row of the matrix B, x3 denotes the observation data of the jth variable, xj represents the observation data of variables apart from the jth variable, represents L2-Norm operation, and ∥ ∥1 represents L1-Norm operation.
where a constraint is that graph structure G should not contain a directed cyclic graph. In other words, the graph structure G should be a directed acyclic graph.
Claims (20)
Applications Claiming Priority (2)
| Application Number | Priority Date | Filing Date | Title |
|---|---|---|---|
| CN201810269835.5 | 2018-03-29 | ||
| CN201810269835.5A CN110555047B (en) | 2018-03-29 | 2018-03-29 | Data processing method and electronic equipment |
Publications (2)
| Publication Number | Publication Date |
|---|---|
| US20190303368A1 US20190303368A1 (en) | 2019-10-03 |
| US11461344B2 true US11461344B2 (en) | 2022-10-04 |
Family
ID=68055005
Family Applications (1)
| Application Number | Title | Priority Date | Filing Date |
|---|---|---|---|
| US16/368,382 Active 2040-07-26 US11461344B2 (en) | 2018-03-29 | 2019-03-28 | Data processing method and electronic device |
Country Status (4)
| Country | Link |
|---|---|
| US (1) | US11461344B2 (en) |
| JP (2) | JP6822509B2 (en) |
| CN (1) | CN110555047B (en) |
| WO (1) | WO2019185039A1 (en) |
Families Citing this family (16)
| Publication number | Priority date | Publication date | Assignee | Title |
|---|---|---|---|---|
| CN110555047B (en) * | 2018-03-29 | 2024-03-15 | 日本电气株式会社 | Data processing method and electronic equipment |
| US11189371B2 (en) * | 2019-04-30 | 2021-11-30 | International Business Machines Corporation | Systems and methods for adjusting medical treatment to reduce likelihood of prescription cascade |
| CN111506440B (en) * | 2020-04-14 | 2022-11-04 | 上海春魁信息技术有限公司 | Data processing method, device, equipment and storage medium |
| CN113554449A (en) * | 2020-04-23 | 2021-10-26 | 阿里巴巴集团控股有限公司 | Commodity variable prediction method, commodity variable prediction device, and computer-readable medium |
| CN113761073A (en) * | 2020-06-03 | 2021-12-07 | 日本电气株式会社 | Method, apparatus, device and storage medium for information processing |
| CN111985677B (en) * | 2020-06-30 | 2024-06-21 | 联想(北京)有限公司 | A causal link analysis method, device and computer-readable storage medium |
| CN113887008A (en) * | 2020-07-01 | 2022-01-04 | 日本电气株式会社 | Information processing method, electronic device and computer storage medium |
| CN112116433A (en) * | 2020-09-30 | 2020-12-22 | 拉扎斯网络科技(上海)有限公司 | Order attributing method and device |
| WO2022149372A1 (en) * | 2021-01-08 | 2022-07-14 | ソニーグループ株式会社 | Information processing device, information processing method, and program |
| US12248889B2 (en) | 2021-01-20 | 2025-03-11 | EMC IP Holding Company LLC | Stochastic risk scoring with counterfactual analysis for storage capacity |
| US20220261156A1 (en) * | 2021-02-18 | 2022-08-18 | EMC IP Holding Company LLC | Stochastic risk scoring with counterfactual analysis for storage capacity |
| US20240177065A1 (en) * | 2021-06-21 | 2024-05-30 | Mitsubishi Electric Corporation | Machine learning device, degree of severity prediction device, machine learning method, and degree of severity prediction method |
| JP7622854B2 (en) * | 2021-09-06 | 2025-01-28 | 日本電気株式会社 | Causal exploration device, causal exploration method, and program |
| CN113806452B (en) * | 2021-09-17 | 2022-10-25 | 北京百度网讯科技有限公司 | Information processing method, information processing device, electronic equipment and storage medium |
| CN113986596B (en) * | 2021-10-29 | 2026-01-20 | 北京达佳互联信息技术有限公司 | A data processing method, apparatus, electronic device, and storage medium |
| US11892989B2 (en) * | 2022-03-28 | 2024-02-06 | Bank Of America Corporation | System and method for predictive structuring of electronic data |
Citations (10)
| Publication number | Priority date | Publication date | Assignee | Title |
|---|---|---|---|---|
| JP2005276225A (en) | 2004-03-25 | 2005-10-06 | Microsoft Corp | Tree learning using table |
| US20060059112A1 (en) * | 2004-08-25 | 2006-03-16 | Jie Cheng | Machine learning with robust estimation, bayesian classification and model stacking |
| US20070123773A1 (en) * | 2005-07-15 | 2007-05-31 | Siemens Corporate Research Inc | Method and Apparatus for Classifying Tissue Using Image Data |
| US20070203870A1 (en) * | 2006-02-03 | 2007-08-30 | Infocom Corporation | Graph generating method, graph generating program and data mining system |
| US20130257873A1 (en) * | 2012-03-28 | 2013-10-03 | Sony Corporation | Information processing apparatus, information processing method, and program |
| JP2014228991A (en) | 2013-05-21 | 2014-12-08 | ソニー株式会社 | Information processing apparatus, information processing method, and program |
| JP2015153133A (en) | 2014-02-14 | 2015-08-24 | オムロン株式会社 | Causal network generating system and data structure for causal relationship |
| US20150363702A1 (en) * | 2014-06-16 | 2015-12-17 | Eric Burton Baum | System, apparatus and method for supporting formal verification of informal inference on a computer |
| US20170090889A1 (en) * | 2015-09-30 | 2017-03-30 | Semmle Limited | Hierarchical dependency analysis of source code |
| US20170308836A1 (en) * | 2016-04-22 | 2017-10-26 | Accenture Global Solutions Limited | Hierarchical visualization for decision review systems |
Family Cites Families (7)
| Publication number | Priority date | Publication date | Assignee | Title |
|---|---|---|---|---|
| US7117185B1 (en) * | 2002-05-15 | 2006-10-03 | Vanderbilt University | Method, system, and apparatus for casual discovery and variable selection for classification |
| US10042037B2 (en) * | 2014-02-20 | 2018-08-07 | Nestwave Sas | System and method for estimating time of arrival (TOA) |
| CN114203296B (en) * | 2014-09-11 | 2025-10-17 | 布普格生物制药公司 | Bayesian causal relationship network model for health care diagnosis and treatment based on patient data |
| CN104537418A (en) * | 2014-12-11 | 2015-04-22 | 广东工业大学 | From-bottom-to-top high-dimension-data causal network learning method |
| CN106874589A (en) * | 2017-02-10 | 2017-06-20 | 泉州装备制造研究所 | A kind of alarm root finding method based on data-driven |
| CN107563596A (en) * | 2017-08-03 | 2018-01-09 | 清华大学 | A kind of evaluation index equilibrium state analysis method based on Bayes's causal network |
| CN110555047B (en) | 2018-03-29 | 2024-03-15 | 日本电气株式会社 | Data processing method and electronic equipment |
-
2018
- 2018-03-29 CN CN201810269835.5A patent/CN110555047B/en active Active
-
2019
- 2019-03-28 US US16/368,382 patent/US11461344B2/en active Active
- 2019-03-28 JP JP2019063338A patent/JP6822509B2/en active Active
- 2019-03-29 WO PCT/CN2019/080524 patent/WO2019185039A1/en not_active Ceased
-
2021
- 2021-01-07 JP JP2021001314A patent/JP7392668B2/en active Active
Patent Citations (10)
| Publication number | Priority date | Publication date | Assignee | Title |
|---|---|---|---|---|
| JP2005276225A (en) | 2004-03-25 | 2005-10-06 | Microsoft Corp | Tree learning using table |
| US20060059112A1 (en) * | 2004-08-25 | 2006-03-16 | Jie Cheng | Machine learning with robust estimation, bayesian classification and model stacking |
| US20070123773A1 (en) * | 2005-07-15 | 2007-05-31 | Siemens Corporate Research Inc | Method and Apparatus for Classifying Tissue Using Image Data |
| US20070203870A1 (en) * | 2006-02-03 | 2007-08-30 | Infocom Corporation | Graph generating method, graph generating program and data mining system |
| US20130257873A1 (en) * | 2012-03-28 | 2013-10-03 | Sony Corporation | Information processing apparatus, information processing method, and program |
| JP2014228991A (en) | 2013-05-21 | 2014-12-08 | ソニー株式会社 | Information processing apparatus, information processing method, and program |
| JP2015153133A (en) | 2014-02-14 | 2015-08-24 | オムロン株式会社 | Causal network generating system and data structure for causal relationship |
| US20150363702A1 (en) * | 2014-06-16 | 2015-12-17 | Eric Burton Baum | System, apparatus and method for supporting formal verification of informal inference on a computer |
| US20170090889A1 (en) * | 2015-09-30 | 2017-03-30 | Semmle Limited | Hierarchical dependency analysis of source code |
| US20170308836A1 (en) * | 2016-04-22 | 2017-10-26 | Accenture Global Solutions Limited | Hierarchical visualization for decision review systems |
Non-Patent Citations (1)
| Title |
|---|
| Communication dated May 12, 2020 from Japanese Patent Office in JP Application No. 2019-063338. |
Also Published As
| Publication number | Publication date |
|---|---|
| JP6822509B2 (en) | 2021-01-27 |
| WO2019185039A1 (en) | 2019-10-03 |
| JP7392668B2 (en) | 2023-12-06 |
| JP2021061055A (en) | 2021-04-15 |
| JP2019204499A (en) | 2019-11-28 |
| CN110555047B (en) | 2024-03-15 |
| US20190303368A1 (en) | 2019-10-03 |
| CN110555047A (en) | 2019-12-10 |
Similar Documents
| Publication | Publication Date | Title |
|---|---|---|
| US11461344B2 (en) | Data processing method and electronic device | |
| US10846643B2 (en) | Method and system for predicting task completion of a time period based on task completion rates and data trend of prior time periods in view of attributes of tasks using machine learning models | |
| US12159236B2 (en) | Systems and methods of generating datasets from heterogeneous sources for machine learning | |
| US10009363B2 (en) | Selecting representative metrics datasets for efficient detection of anomalous data | |
| US11928620B2 (en) | Method for estimating amount of task objects required to reach target completed tasks | |
| US9047558B2 (en) | Probabilistic event networks based on distributed time-stamped data | |
| US8190537B1 (en) | Feature selection for large scale models | |
| US9576031B1 (en) | Automated outlier detection | |
| US20160110657A1 (en) | Configurable Machine Learning Method Selection and Parameter Optimization System and Method | |
| US11442891B2 (en) | Holographic quantum dynamics simulation | |
| WO2012045496A2 (en) | Probabilistic data mining model comparison engine | |
| CN115699058B (en) | Feature interaction through edge search | |
| US20240220546A1 (en) | Method and Apparatus for Classifying Blockchain Address | |
| US20190065987A1 (en) | Capturing knowledge coverage of machine learning models | |
| US20220215291A1 (en) | Method and device for use in data processing, and medium | |
| US9324026B2 (en) | Hierarchical latent variable model estimation device, hierarchical latent variable model estimation method, supply amount prediction device, supply amount prediction method, and recording medium | |
| US20230186150A1 (en) | Hyperparameter selection using budget-aware bayesian optimization | |
| Panagopoulos et al. | Learning graph representations for influence maximization | |
| US20220138557A1 (en) | Deep Hybrid Graph-Based Forecasting Systems | |
| WO2022104616A1 (en) | Non-linear causal modeling based on encoded knowledge | |
| CN119295120A (en) | A business opportunity recommendation method, device, equipment, medium and product for Class B enterprises | |
| CN111767290A (en) | Method and apparatus for updating user portraits | |
| CN115409635A (en) | Information prediction method, device, equipment and medium | |
| US20250021388A1 (en) | Using machine learning for executing batch jobs in distributed cloud environment | |
| Manepalli et al. | Map reduce technique for parallel-automata analysis of large scale rainfall data |
Legal Events
| Date | Code | Title | Description |
|---|---|---|---|
| FEPP | Fee payment procedure |
Free format text: ENTITY STATUS SET TO UNDISCOUNTED (ORIGINAL EVENT CODE: BIG.); ENTITY STATUS OF PATENT OWNER: LARGE ENTITY |
|
| AS | Assignment |
Owner name: NEC CORPORATION, JAPAN Free format text: ASSIGNMENT OF ASSIGNORS INTEREST;ASSIGNORS:LIU, CHUNCHEN;WEI, WENJUAN;FENG, LU;REEL/FRAME:051394/0273 Effective date: 20191218 |
|
| STPP | Information on status: patent application and granting procedure in general |
Free format text: NON FINAL ACTION MAILED |
|
| STPP | Information on status: patent application and granting procedure in general |
Free format text: RESPONSE TO NON-FINAL OFFICE ACTION ENTERED AND FORWARDED TO EXAMINER |
|
| STPP | Information on status: patent application and granting procedure in general |
Free format text: FINAL REJECTION MAILED |
|
| STPP | Information on status: patent application and granting procedure in general |
Free format text: RESPONSE AFTER FINAL ACTION FORWARDED TO EXAMINER |
|
| STPP | Information on status: patent application and granting procedure in general |
Free format text: NOTICE OF ALLOWANCE MAILED -- APPLICATION RECEIVED IN OFFICE OF PUBLICATIONS |
|
| STPP | Information on status: patent application and granting procedure in general |
Free format text: PUBLICATIONS -- ISSUE FEE PAYMENT VERIFIED |
|
| STCF | Information on status: patent grant |
Free format text: PATENTED CASE |