US11406997B2 - Apparatus for generating and optically characterizing an aerosol - Google Patents
Apparatus for generating and optically characterizing an aerosol Download PDFInfo
- Publication number
- US11406997B2 US11406997B2 US16/784,534 US202016784534A US11406997B2 US 11406997 B2 US11406997 B2 US 11406997B2 US 202016784534 A US202016784534 A US 202016784534A US 11406997 B2 US11406997 B2 US 11406997B2
- Authority
- US
- United States
- Prior art keywords
- aerosol
- suspension
- tube
- nanorods
- coupled
- Prior art date
- Legal status (The legal status is an assumption and is not a legal conclusion. Google has not performed a legal analysis and makes no representation as to the accuracy of the status listed.)
- Active, expires
Links
Images


Classifications
-
- G—PHYSICS
- G01—MEASURING; TESTING
- G01N—INVESTIGATING OR ANALYSING MATERIALS BY DETERMINING THEIR CHEMICAL OR PHYSICAL PROPERTIES
- G01N21/00—Investigating or analysing materials by the use of optical means, i.e. using sub-millimetre waves, infrared, visible or ultraviolet light
- G01N21/17—Systems in which incident light is modified in accordance with the properties of the material investigated
- G01N21/25—Colour; Spectral properties, i.e. comparison of effect of material on the light at two or more different wavelengths or wavelength bands
- G01N21/31—Investigating relative effect of material at wavelengths characteristic of specific elements or molecules, e.g. atomic absorption spectrometry
-
- B—PERFORMING OPERATIONS; TRANSPORTING
- B05—SPRAYING OR ATOMISING IN GENERAL; APPLYING FLUENT MATERIALS TO SURFACES, IN GENERAL
- B05B—SPRAYING APPARATUS; ATOMISING APPARATUS; NOZZLES
- B05B12/00—Arrangements for controlling delivery; Arrangements for controlling the spray area
- B05B12/004—Arrangements for controlling delivery; Arrangements for controlling the spray area comprising sensors for monitoring the delivery, e.g. by displaying the sensed value or generating an alarm
-
- B—PERFORMING OPERATIONS; TRANSPORTING
- B05—SPRAYING OR ATOMISING IN GENERAL; APPLYING FLUENT MATERIALS TO SURFACES, IN GENERAL
- B05B—SPRAYING APPARATUS; ATOMISING APPARATUS; NOZZLES
- B05B9/00—Spraying apparatus for discharge of liquids or other fluent material, without essentially mixing with gas or vapour
- B05B9/03—Spraying apparatus for discharge of liquids or other fluent material, without essentially mixing with gas or vapour characterised by means for supplying liquid or other fluent material
- B05B9/04—Spraying apparatus for discharge of liquids or other fluent material, without essentially mixing with gas or vapour characterised by means for supplying liquid or other fluent material with pressurised or compressible container; with pump
- B05B9/0403—Spraying apparatus for discharge of liquids or other fluent material, without essentially mixing with gas or vapour characterised by means for supplying liquid or other fluent material with pressurised or compressible container; with pump with pumps for liquids or other fluent material
-
- G—PHYSICS
- G01—MEASURING; TESTING
- G01N—INVESTIGATING OR ANALYSING MATERIALS BY DETERMINING THEIR CHEMICAL OR PHYSICAL PROPERTIES
- G01N1/00—Sampling; Preparing specimens for investigation
- G01N1/02—Devices for withdrawing samples
- G01N1/10—Devices for withdrawing samples in the liquid or fluent state
- G01N1/14—Suction devices, e.g. pumps; Ejector devices
-
- G—PHYSICS
- G01—MEASURING; TESTING
- G01N—INVESTIGATING OR ANALYSING MATERIALS BY DETERMINING THEIR CHEMICAL OR PHYSICAL PROPERTIES
- G01N1/00—Sampling; Preparing specimens for investigation
- G01N1/28—Preparing specimens for investigation including physical details of (bio-)chemical methods covered elsewhere, e.g. G01N33/50, C12Q
- G01N1/40—Concentrating samples
- G01N1/4055—Concentrating samples by solubility techniques
-
- G—PHYSICS
- G01—MEASURING; TESTING
- G01N—INVESTIGATING OR ANALYSING MATERIALS BY DETERMINING THEIR CHEMICAL OR PHYSICAL PROPERTIES
- G01N21/00—Investigating or analysing materials by the use of optical means, i.e. using sub-millimetre waves, infrared, visible or ultraviolet light
- G01N21/17—Systems in which incident light is modified in accordance with the properties of the material investigated
- G01N21/25—Colour; Spectral properties, i.e. comparison of effect of material on the light at two or more different wavelengths or wavelength bands
- G01N21/31—Investigating relative effect of material at wavelengths characteristic of specific elements or molecules, e.g. atomic absorption spectrometry
- G01N21/35—Investigating relative effect of material at wavelengths characteristic of specific elements or molecules, e.g. atomic absorption spectrometry using infrared light
- G01N21/3504—Investigating relative effect of material at wavelengths characteristic of specific elements or molecules, e.g. atomic absorption spectrometry using infrared light for analysing gases, e.g. multi-gas analysis
-
- B—PERFORMING OPERATIONS; TRANSPORTING
- B05—SPRAYING OR ATOMISING IN GENERAL; APPLYING FLUENT MATERIALS TO SURFACES, IN GENERAL
- B05B—SPRAYING APPARATUS; ATOMISING APPARATUS; NOZZLES
- B05B7/00—Spraying apparatus for discharge of liquids or other fluent materials from two or more sources, e.g. of liquid and air, of powder and gas
- B05B7/0012—Apparatus for achieving spraying before discharge from the apparatus
-
- B—PERFORMING OPERATIONS; TRANSPORTING
- B05—SPRAYING OR ATOMISING IN GENERAL; APPLYING FLUENT MATERIALS TO SURFACES, IN GENERAL
- B05B—SPRAYING APPARATUS; ATOMISING APPARATUS; NOZZLES
- B05B7/00—Spraying apparatus for discharge of liquids or other fluent materials from two or more sources, e.g. of liquid and air, of powder and gas
- B05B7/24—Spraying apparatus for discharge of liquids or other fluent materials from two or more sources, e.g. of liquid and air, of powder and gas with means, e.g. a container, for supplying liquid or other fluent material to a discharge device
- B05B7/2402—Apparatus to be carried on or by a person, e.g. by hand; Apparatus comprising containers fixed to the discharge device
- B05B7/2405—Apparatus to be carried on or by a person, e.g. by hand; Apparatus comprising containers fixed to the discharge device using an atomising fluid as carrying fluid for feeding, e.g. by suction or pressure, a carried liquid from the container to the nozzle
- B05B7/2424—Apparatus to be carried on or by a person, e.g. by hand; Apparatus comprising containers fixed to the discharge device using an atomising fluid as carrying fluid for feeding, e.g. by suction or pressure, a carried liquid from the container to the nozzle the carried liquid and the main stream of atomising fluid being brought together downstream of the container before discharge
-
- G—PHYSICS
- G01—MEASURING; TESTING
- G01N—INVESTIGATING OR ANALYSING MATERIALS BY DETERMINING THEIR CHEMICAL OR PHYSICAL PROPERTIES
- G01N1/00—Sampling; Preparing specimens for investigation
- G01N1/02—Devices for withdrawing samples
- G01N1/10—Devices for withdrawing samples in the liquid or fluent state
- G01N2001/1006—Dispersed solids
- G01N2001/1012—Suspensions
- G01N2001/1025—Liquid suspensions; Slurries; Mud; Sludge
-
- G—PHYSICS
- G01—MEASURING; TESTING
- G01N—INVESTIGATING OR ANALYSING MATERIALS BY DETERMINING THEIR CHEMICAL OR PHYSICAL PROPERTIES
- G01N1/00—Sampling; Preparing specimens for investigation
- G01N1/02—Devices for withdrawing samples
- G01N1/10—Devices for withdrawing samples in the liquid or fluent state
- G01N1/14—Suction devices, e.g. pumps; Ejector devices
- G01N2001/1418—Depression, aspiration
- G01N2001/1436—Ejector
-
- G—PHYSICS
- G01—MEASURING; TESTING
- G01N—INVESTIGATING OR ANALYSING MATERIALS BY DETERMINING THEIR CHEMICAL OR PHYSICAL PROPERTIES
- G01N1/00—Sampling; Preparing specimens for investigation
- G01N1/28—Preparing specimens for investigation including physical details of (bio-)chemical methods covered elsewhere, e.g. G01N33/50, C12Q
- G01N1/40—Concentrating samples
- G01N1/4055—Concentrating samples by solubility techniques
- G01N2001/4061—Solvent extraction
-
- G—PHYSICS
- G01—MEASURING; TESTING
- G01N—INVESTIGATING OR ANALYSING MATERIALS BY DETERMINING THEIR CHEMICAL OR PHYSICAL PROPERTIES
- G01N21/00—Investigating or analysing materials by the use of optical means, i.e. using sub-millimetre waves, infrared, visible or ultraviolet light
- G01N21/17—Systems in which incident light is modified in accordance with the properties of the material investigated
- G01N21/25—Colour; Spectral properties, i.e. comparison of effect of material on the light at two or more different wavelengths or wavelength bands
- G01N21/31—Investigating relative effect of material at wavelengths characteristic of specific elements or molecules, e.g. atomic absorption spectrometry
- G01N21/35—Investigating relative effect of material at wavelengths characteristic of specific elements or molecules, e.g. atomic absorption spectrometry using infrared light
- G01N2021/3595—Investigating relative effect of material at wavelengths characteristic of specific elements or molecules, e.g. atomic absorption spectrometry using infrared light using FTIR
-
- G—PHYSICS
- G01—MEASURING; TESTING
- G01N—INVESTIGATING OR ANALYSING MATERIALS BY DETERMINING THEIR CHEMICAL OR PHYSICAL PROPERTIES
- G01N21/00—Investigating or analysing materials by the use of optical means, i.e. using sub-millimetre waves, infrared, visible or ultraviolet light
- G01N21/01—Arrangements or apparatus for facilitating the optical investigation
- G01N21/03—Cuvette constructions
- G01N21/031—Multipass arrangements
Definitions
- the present disclosure is generally related to aerosol generation.
- Aerosol particles serve as nucleation sites for water molecules to condense into droplets that can then form into clouds.
- aerosol particles from the exhaust of ships enhanced the intensity and electrification of storms, showing that the density of lightning strikes doubled over shipping lanes.
- ultrafine aerosol particles (diameter ⁇ 50 nm), once thought to be too small to influence cloud formation, have recently been shown to significantly intensify the convective strength of cloud systems, 2 indicating that nanoparticle aerosols may also be used for geoengineering applications. 4-10
- Plasmonic nanoparticles are promising candidates for benchtop aerosol studies. They couple strongly to light, leading to the capability to optically detect them in dilute concentrations, and they are also sensitive to changes in their surrounding environment.
- a pragmatic nanoparticle to maximize the absorption is a gold nanorod 13-15 due to its large ⁇ p , small L (along the long axis of the nanorod), and mature chemical-based fabrication.
- an apparatus comprising: a vessel for containing a suspension comprising a liquid and solid particles suspended therein; a tube having a narrowed portion configured to draw the suspension from the vessel into the tube when a gas flows through the tube; an aerosol generator coupled to the tube for forming an aerosol from the suspension; a dehydrator coupled to the aerosol generator for removing the liquid from the aerosol forming a dried aerosol; a multiple-pass spectroscopic absorption cell coupled to the dehydrator to pass the dried aerosol into the absorption cell; and a Fourier transform spectrometer coupled to the absorption cell to measure an absorption spectrum of the dried aerosol.
- FIG. 1 schematially illustrates the experimental apparatus to aerosolize and optically measure gold nanorods in the gas phase in situ.
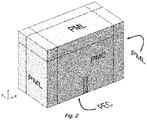
- FIG. 2 shows the geometry of the COMSOL model used in calculating extinction cross sections.
- a gold nanorod is built in a box, with one face as a Perfect Magnetic Conductor (PMC) and another face as a Perfect Electric Conductor (PEC) to account for symmetry. All other edges are surrounded by Perfectly Matched Layers (PML) to absorb reflections.
- PMC Perfect Magnetic Conductor
- PEC Perfect Electric Conductor
- FIG. 3 shows the absorbance spectra of high aspect ratio gold nanorods in the gas phase.
- FIG. 4 shows the absorbance spectra of high aspect ratio gold nanorods in the liquid phase.
- FIG. 5 shows a representative TEM image.
- the scale bar is 500 nm.
- FIG. 6 shows aspect ratio statistics corresponding corresponding to FIG. 5 .
- FIG. 7 shows experimental spectra (top) of gold nanorods with aspect ratios ranging from 1.5, 2.5, 3, 4.5 in water to 10, 15, 30 in toluene and three-dimensional finite-element simulation spectra (bottom) matching the experimental parameters and phases.
- FIG. 8 shows experimental spectra (top) of gold nanorods with aspect ratios of 5, 15, 30 in air and three-dimensional finite-element simulation (bottom) matching the experimental parameters and phases.
- FIG. 9 shows extinction spectra of a nanorod surrounded by water and air, as the diameter of a water droplet D encasing the nanorod decreases.
- FIG. 10 shows a color map of a nanorod surrounded by water and air, as the diameter of a water droplet D encasing the nanorod decreases.
- FIG. 11 shows the extinction of a gold nanorod as the diameter of the water droplet decreases.
- FIG. 12 shows the scattering of a gold nanorod as the diameter of the water droplet decreases.
- FIG. 13 shows the absorption cross section of a gold nanorod as the diameter of the water droplet decreases.
- FIG. 14 shows the evolution of the absorbance peak wavelength as the nanorod aspect ratio and host refractive indexes are varied.
- FIG. 15 shows the evolution of the sensitivity as the nanorod aspect ratio and host refractive indexes are varied.
- FIG. 16 shows the simulated absorbance spectra for plasmonic aerosols as a function of the host gas.
- plasmonic aerosols Disclosed herein is a solution to a decades-old problem of simultaneously aerosolizing and measuring the optical response of plasmonic nanoparticles in the gas phase, thereby uniting the fields of plasmonics and aerosols. It is shown that the aerosols are optically homogeneous, thermodynamically stable, with wide wavelength tunability, and extremely high sensitivities to their environment that may be useful in aiding geoengineering challenges. It is anticipated that plasmonic aerosols will open up broad and innovative approaches to understand the underlying physics of inaccessible climatology, astronomy, petroleum, and medical environments.
- the electro-optic properties of the element may be reconfigurable by controlling the orientational order of the nanorods. 20,21 These materials may also be useful for nonlinear optics 6-8 , nanojet printing 22 , molecular diagnostics 23 , or nanomedicines 24 .
- the disclosed apparatus is illustrated in FIG. 1 . It may be used with a suspension of solid particles in a liquid.
- a suspension of solid particles is nanorods.
- the liquid can be any liquid capable of suspending the particles.
- Aqueous suspensions are typical.
- the suspension is placed in a vessel with a tube having a narrowed portion, such as a Venturi tube. When a gas, such as dry air, flows through the tube, it draws the suspension into the tube. The narrowed portion increases the amount of suspension drawn into the tube.
- the suspension then flows into an aerosol generator which forms an aerosol from the suspension.
- This aerosol contains liquid droplets with suspended particles.
- the droplets may be, for example, up to 1 micron in diameter.
- the aerosol then flows through a dehydrated that removes all or most of the liquid to make a dried aerosol.
- the dehydrator may include a desiccant the dries the aerosol by diffusion.
- the dried aerosol may contain only the particles suspended in the gas, or there may be trace amounts of liquid remaining.
- the dried aerosol then flows into a multiple-path spectroscopic absorption cell, such as a Herriott cell.
- the optical path length of the cell may be, for example, up to 20 meters long.
- a Fourier transform spectrometer is then used to measure an absorption spectrum of the dried aerosol.
- the spectrum may include the IR, visible, and/or UV range, including near and/or far IR.
- a vacuum pump at the spectrometer end may be used to draw the gas or air through the entire apparatus.
- Hexadecyltrimethylammonium bromide (CTAB, >98%) and silver nitrate (>99.99%) were purchased from GFS Chemicals.
- Octadecyltrimethylammonium bromide (OTAB, >98%), benzyldimethylhexadecylammonium chloride (BDAC, >95%), and L-ascorbic acid (>99.0%) were purchased from TCI.
- Gold (III) chloride trihydrate (99.9%), sodium borohydrate (99.99%), hydroquinone (>99%), and trisodium citrate dihydrate were purchased from Sigma-Aldrich.
- Nanorod synthesis Multiple nanorod synthesis techniques were used based on the desired aspect ratio.
- High aspect ratio nanorods (30-40) were synthesized according to the procedure described by Kitahata et al. 25
- a CTAB concentration of 100 mM was used for all high aspect ratio synthesis methods while the OTAB concentration was varied between 30-75 mM to change the nanorod aspect ratio.
- the temperature was fixed at 20° C. for both the seed and growth solutions.
- Nanorods with an aspect ratio of approximately 17 were prepared using the seed-mediated procedure described by Zubarev et al.
- Nanorods with an aspect ratio of 5 were synthesized with a CTAB/BDAC surfactant growth solution as described by Park et al.
- nanorods were centrifuged at either 5,000 rpm (AR 30-40) or 10,000 rpm (AR 5-17) for 15 min. and resuspended in DI water to their initial volumes before another centrifugation step and 10-fold concentration.
- nanorods were phase transferred using thiol-terminated polystyrene according to a previously established procedure.
- Aerosolization The experimental setup is schematically illustrated in FIG. 1 .
- Aqueous gold nanorod suspensions were aerosolized with an atomizer (TSI, Model 3076) in a non-recirculatory mode that generated aerosol droplets with an average diameter of 0.3 ⁇ m.
- the flow rate lof the liquid suspension was 50 mL/h.
- the wet aerosol was then passed through a dehumidifier (TOPAS, DDU 570H) to remove the water content.
- TOPAS dehumidifier
- a Herriott gas cell (Pike Technologies) with a 1-16 m optical path length coupled to a Fourier transform infrared spectrometer (Bruker, Vertex 70) was used for optical measurements, from 0.6-3 ⁇ m or 1-10 ⁇ m with milli-optical density (mOD) resolution.
- the exhaust port from the Herriott cell was connected to a vacuum line at an air flow rate of approximately 3.0 L/min. All instruments were connected with static-dissipative silicone rubber tubing (McMaster-Carr). During each sample measurement, aerosols were flowed for 3 min before spectra collection to ensure aerosol saturation in the gas cell. A pure water aerosol was first collected and subtracted from the nanorod-water aerosols.
- a silicon detector, quartz beamsplitter, and a halogen lamp source were used for optical measurements in the visible and NIR regions while a mercury cadmium telluride (MCT) detector, KBr beamsplitter, and a globar source were used for measurements in the MIR region.
- MCT mercury cadmium telluride
- the xy-plane was specified as a Perfect Electric Conductor (PEC) and the xz-plane was specified as a Perfect Magnetic Conductor (PEC). All other edges were surrounded by Perfectly Matched Layers (PML) to absorb reflections. An illustration of the model can be seen in FIG. 2 .
- ⁇ scat ⁇ ⁇ S P in . Both ⁇ abs and ⁇ scat were multiplied by a factor of four to adjust for calculating the electric field of only 1 ⁇ 4 of the structure.
- FIG. 1 shows a schematic for the transition of aqueous suspensions of gold nanorods from the liquid phase into the gas phase while simultaneously measuring their optical responses.
- the gold nanorods were synthesized using wet-seed mediated synthesis approaches that enabled tuning of the aspect ratio (length l to diameter d) from 1.5 to 38.
- 16,25,26 Transmission electron microscopy (TEM) was used to measure the polydispersity of the nanorods, yielding less than 10% for aspect ratios smaller than 20 and 25% for larger aspect ratios.
- TEM Transmission electron microscopy
- TEM Transmission electron microscopy
- a Venturi tube was used to drive high-velocity air over a reservoir of gold nanorods in a liquid suspension, pulling the suspension into the airstream.
- the liquid suspension Upon exiting the tube, the liquid suspension breaks apart into an aerosol containing liquid droplets (diameter ⁇ 300 nm) with embedded nanorods.
- the droplets then enter a dehumidifier chamber that evaporates the remaining water from the nanorods, thereby creating a suspension of dry nanorods in the gas phase.
- a 10-m optical path length Herriott cell was placed at the exit of the dehumidifier. The Herriott cell was integrated into a Fourier transform infrared (FTIR) spectrometer, enabling the optical signatures of the plasmonic aerosols to be measured from 0.6 to 3 ⁇ m or 1 to 10 ⁇ m in a continuous manner.
- FTIR Fourier transform infrared
- the absorbance spectra of the gold nanorods in the gas phase are shown in FIG. 3 , revealing a well-defined absorption peak at 3.3 ⁇ m.
- the relatively large effective factor ( ⁇ 0 /FWHM) of 1.3 in FIG. 3 suggests that the nanorods are not flocculated or aggregated upon transitioning from the liquid to the gas phase.
- the magnitude of the absorbance peak was constant while the measurements were performed (average of 16 individual spectra) demonstrating the aerosols are temporally stable.
- the constant absorbance peak also implies the aerosols are optically homogeneous, which is expected since the nanorods are generally much smaller than the wavelength of the light ( ⁇ 0 /10).
- the sharp absorbance peaks around 6 ⁇ m are due to the O—H molecular vibration from trace amounts of water vapor.
- the apparent increase in absorbance near 1 ⁇ m may be attributed to these wavelengths being near the wavelength detection limit for the specific FTIR detector-beam-splitter combination, although triangular platelet by-products from the high aspect nanorod synthesis may have resonances in this region as well.
- the nanorods were phase transferred from water into toluene suspensions 20 to enable the absorbance spectra in the infrared region to be measured in the liquid phase, as seen in FIG. 4 . While molecular vibrations from the aromatic ring of toluene are still significant throughout the spectrum, leading to detector saturation in some wavelength bands, the absorbance peak from the nanorods is apparent.
- the aspect ratio of the gold nanorods was varied from 1.5, 2.5, 3, and 4.5 in water to 10, 15, and 30 in toluene in FIG. 7 , demonstrating nearly a decade in experimental wavelength tunability from 0.6 to 5 ⁇ m in the liquid phase.
- the effective factor in the liquid phase varied from 5 to 1 for aspect ratios ranging from 1.5 to 30, respectively.
- the optical response of gold nanorods in the gas phase with aspect ratios of 5, 15, and 30 are shown in FIG. 8 , spanning over 2.5 ⁇ m in wavelength tunability.
- the effective factor in the gas phase varied from 2.4 to 1.3 for aspect ratios of 5 to 30, respectively.
- FIGS. 7 and 8 Three-dimensional finite-element simulations in FIGS. 7 and 8 were used to replicate the experimental isotropic spectra of the nanorods in the liquid and gas states.
- the simulated longitudinal absorbance peak wavelengths are in good agreement with the experimental values as a function of aspect ratio and solvent index.
- the effective factors of the longitudinal absorbance peaks from the simulated spectra are larger than for the experimental spectra due to experimental variations in the aspect ratio of the nanorods 27 .
- the small blueshifted absorbance peaks, relative to the longitudinal peaks, are due to the transverse axis of the nanorods.
- the most striking feature as the water droplet evaporates is the decrease in the visible wavelength scattering.
- Transitioning the nanorods from the liquid to the gas state results in large shifts in the absorbance peak wavelength, as shown in FIGS. 7-8 .
- the local refractive index of the medium surrounding the nanorods e.g., water, toluene, or air.
- the effective factor is a good metric to ensure the nanorods are not aggregated, as discussed with FIGS. 7-8 .
- the longitudinal absorption peak wavelength can be related to the refractive index of the host medium n m 29 by
- ⁇ ⁇ p ⁇ 1 + ( 1 - L ⁇ ⁇ ) ⁇ ( n s 2 - n m 2 ) ⁇ f + ( 1 L ⁇ ⁇ - 1 ) ⁇ n m 2 , ( 1 )
- ⁇ p is the plasma wavelength of gold
- n s is the refractive index of the ligand shell coating the nanorods
- f is the ellipsoidal volume fraction of the inner nanorod to the outer ligand shell.
- the absorbance peak wavelength shifts are on the order of several microns per refractive index unit (RIU) in FIG. 15 .
- This large sensitivity implies that very small changes in the host medium can be detected, suggesting that plasmonic aerosols may be good candidates to accurately probe and model remote environments such as atmospheric systems at benchtop size scales.
- gold nanorods with an aspect ratio of 30 were simulated in He, air, and CO 2 gaseous environments ( FIG. 16 ).
- the absorbance peak wavelength shifted from 3275.94 nm for He to 3277.25 nm for CO 2 , showing that changes of ⁇ nm ⁇ 10 ⁇ 4 may be detectable at atmospheric transmission window wavelengths. 30,31
- the aerosolization of gold nanorods from concentrated liquid suspensions, while simultaneously measuring their optical spectra at benchtop scales was demonstrated.
- the plasmonic aerosol absorption peaks are sharp and well defined with effective quality factors as large as 2.4. It was shown that by controlling the aspect ratio of the nanorods, the aerosol absorption peaks are broadly tunable over 2500 nm from visible to midwave infrared wavelengths. It was found that the sensitivity of the longitudinal absorption peak wavelength to the refractive index of the host medium depends linearly on the nanorod aspect ratio and can be estimated from the geometric and material properties of the nanorod. Utilizing this sensitivity dependence, it was also shown that minute changes of the host refractive index of 10 ⁇ 4 may be detectable, suggesting these materials could be useful for environmental or remote sensing.
Landscapes
- Physics & Mathematics (AREA)
- Analytical Chemistry (AREA)
- Chemical & Material Sciences (AREA)
- Life Sciences & Earth Sciences (AREA)
- General Health & Medical Sciences (AREA)
- Biochemistry (AREA)
- Health & Medical Sciences (AREA)
- General Physics & Mathematics (AREA)
- Immunology (AREA)
- Pathology (AREA)
- Spectroscopy & Molecular Physics (AREA)
- Hydrology & Water Resources (AREA)
- Investigating Or Analysing Materials By Optical Means (AREA)
Abstract
Description
where Pin is the input power, which is calculated as,
where Z0 is the characteristic impedance of vacuum. Scattering cross sections (σscat) were calculated by integrating the Poynting vector, S, over a surface surrounding the simulation domain (the boundary between the surrounding medium and the PML),
Both σabs and σscat were multiplied by a factor of four to adjust for calculating the electric field of only ¼ of the structure.
where λp is the plasma wavelength of gold, ns is the refractive index of the ligand shell coating the nanorods, and f is the ellipsoidal volume fraction of the inner nanorod to the outer ligand shell. The depolarization factor of the long axis of the nanorod is
L ∥=[(1−ϵ2)/ϵ]{[(½ϵ)[ln(1−ϵ)/(1+ϵ)]−1]}
where ϵ=√{square root over (1−(l/d)2)}.
This result implies that if the geometric (L∥) and material (λp) properties of the nanorod are known, the shift in the absorption peak wavelength can be estimated as the host medium surrounding the nanorods is varied.
- [1] IPCC 2013, Climate Change 2013: The Physical Science Basis. Contribution of Working Group I to the Fifth Assessment Report of the Intergovernmental Panel on Climate Change, edited by T. F. Stocker et al. (Cambridge University Press, Cambridge UK, 2013).
- [2] J. Fan, D. Rosenfeld, Y. Zhang, S. E. Giangrande, Z. Li, L. A. T. Machado, S. T. Martin, Y. Yang, J. Wang, P. Artaxo, H. M. J. Barbosa, R. C. Braga, J. M. Comstock, Z. Feng, W. Gao, H. B. Gomes, F. Mei, C. Pohlker, M. L. Pohlker, U. Poschl, and R. A. F. de Souza, Science 359, 411 (2018).
- [3] J. A. Thornton, K. S. Virts, R. H. Holzworth, and T. P. Mitchell, Geophys. Res. Lett. 44, 9102 (2017).
- [4] D. W. Keith, Annu. Rev. Energy Environ. 25, 245 (2000).
- [5] D. W. Keith, Proc. Natl. Acad. Sci. USA 107, 16428 (2010).
- [6] A. J. Palmer, Opt. Lett. 5, 54 (1980).
- [7] A. J. Palmer, J. Opt. Soc. Am. 73, 1568 (1983).
- [8] K. M. Leung, Opt. Lett. 10, 347 (1985).
- [9] L. V. Besteiro, K. Gungor, H. V. Demir, and A. O. Govorov, J. Phys. Chem. C 121, 2987 (2017).
- [10] L. V. Besteiro, X.-T. Kong, Z. Wang, F. Rosei, and A. O. Govorov, Nano Lett. 18, 3147 (2018).
- [11] C. F. Bohren and D. R. Huffman, Absorption and Scattering of Light by Small Particles (Wiley-VCH, New York, 1983).
- [12] V. B. Koman, P. Liu, D. Kozawa, A. T. Liu, A. L. Cottrill, Y. Son, J. A. Lebron, and M. S. Strano, Nat. Nanotechnol. 13, 819 (2018).
- [13] O. D. Miller, C. W. Hsu, M. T. H. Reid, W. Qiu, B. G. DeLacy, J. D. Joannopoulos, M. Soljacic, and S. G. Johnson, Phys. Rev. Lett. 112, 123903 (2014).
- [14] O. D. Miller, A. G. Polimeridis, M. T. Homer Reid, C. W. Hsu, B. G. DeLacy, J. D. Joannopoulos, M. Soljacic, and S. G. Johnson, Opt. Express 24, 3329 (2016).
- [15] V. G. Kravets, F. Schedin, and A. N. Grigorenko, Phys. Rev. B 78, 205405 (2008).
- [16] K. Park, M.-s. Hsiao, Y.-J. Yi, S. Izor, H. Koerner, A. Jawaid, and R. A. Vaia, ACS Appl. Mater. Interfaces 9, 26363 (2017).
- [17] B. R. Stoner and J. T. Glass, Nat. Nanotechnol. 7, 485 (2012).
- [18] S. Srisonphan, Y. S. Jung, and H. K. Kim, Nat. Nanotechnol. 7, 504 (2012).
- [19] W. M. Jones, D. Lukin, and A. Scherer, Appl. Phys. Lett. 110, 263101 (2017).
- [20] J. Fontana, G. K. B. da Costa, J. M. Pereira, J. Naciri, B. R. Ratna, P. Palffy-Muhoray, and I. C. S. Carvalho, Appl. Phys. Lett. 108, 081904 (2016).
- [21] S. Etcheverry, L. F. Araujo, G. K. B. da Costa, J. M. B. Pereira, A. R. Camara, J. Naciri, B. R. Ratna, I. Hernandez-Romano, C. J. S. de Matos, I. C. S. Carvalho, W. Margulis, and J. Fontana,
Optica 4, 864 (2017). - [22] A. A. Gupta, S. Arunachalam, S. G. Cloutier, and R. Izquierdo,
ACS Photonics 5, 3923 (2018). - [23] G. C. Phan-Quang, H. K. Lee, H. W. Teng, C. S. L. Koh, B. Q. Yim, E. K. M. Tan, W. L. Tok, I. Y. Phang, and X. Y. Ling, Angew. Chem., Int. Ed. Engl. 57, 5792 (2018).
- [24] R. Raliya, D. Saha, T. S. Chadha, B. Raman, and P. Biswas, Sci. Rep. 7, 44718 (2017).
- [25] Y. Takenaka and H. Kitahata, Chem. Phys. Lett. 467, 327 (2009).
- [26] B. P. Khanal and E. R. Zubarev, J. Am. Chem. Soc. 130, 12634 (2008).
- [27] S. Eustis and M. A. El-Sayed, J. Appl. Phys. 100, 044324 (2006).
- [28] J. Fontana, R. Nita, N. Charipar, J. Naciri, K. Park, A. Dunkelberger, J. Owrutsky, A. Pique, R. Vaia, and B. Ratna, Adv. Opt. Mater. 5, 1700335 (2017).
- [29] J. Yang, J. C. Wu, Y. C. Wu, J. K. Wang, and C. C. Chen, Chem. Phys. Lett. 416, 215 (2005).
- [30] F. Neubrech, A. Pucci, T. W. Cornelius, S. Karim, A. Garcia-Etxarri, and J. Aizpurua, Phys. Rev. Lett. 101, 157403 (2008).
- [31] A. Raman and S. Fan, Phys. Rev. B 83, 205131 (2011).
- [32] A. D. Rakić, A. B. Djuris̆ić, J. M. Elazar, and M. L. Majewski, Appl. Opt. 37, 5271 (1998) .
Claims (9)
Priority Applications (1)
| Application Number | Priority Date | Filing Date | Title |
|---|---|---|---|
| US16/784,534 US11406997B2 (en) | 2019-02-16 | 2020-02-07 | Apparatus for generating and optically characterizing an aerosol |
Applications Claiming Priority (2)
| Application Number | Priority Date | Filing Date | Title |
|---|---|---|---|
| US201962918713P | 2019-02-16 | 2019-02-16 | |
| US16/784,534 US11406997B2 (en) | 2019-02-16 | 2020-02-07 | Apparatus for generating and optically characterizing an aerosol |
Publications (2)
| Publication Number | Publication Date |
|---|---|
| US20200261939A1 US20200261939A1 (en) | 2020-08-20 |
| US11406997B2 true US11406997B2 (en) | 2022-08-09 |
Family
ID=72043220
Family Applications (1)
| Application Number | Title | Priority Date | Filing Date |
|---|---|---|---|
| US16/784,534 Active 2040-12-16 US11406997B2 (en) | 2019-02-16 | 2020-02-07 | Apparatus for generating and optically characterizing an aerosol |
Country Status (1)
| Country | Link |
|---|---|
| US (1) | US11406997B2 (en) |
Families Citing this family (2)
| Publication number | Priority date | Publication date | Assignee | Title |
|---|---|---|---|---|
| US20240151584A1 (en) * | 2022-11-07 | 2024-05-09 | Endress+Hauser Optical Analysis, Inc. | Flowcell and system with improved collection efficiency for raman spectroscopy |
| US20250035540A1 (en) * | 2023-07-26 | 2025-01-30 | Aerodyne Research, Inc. | Detection of a solute injected into a gas phase optical spectrometer |
Citations (1)
| Publication number | Priority date | Publication date | Assignee | Title |
|---|---|---|---|---|
| US20160214075A1 (en) * | 2015-01-23 | 2016-07-28 | The Board Of Trustees Of The University Of Illinois | Method of producing silicone microspheres |
-
2020
- 2020-02-07 US US16/784,534 patent/US11406997B2/en active Active
Patent Citations (1)
| Publication number | Priority date | Publication date | Assignee | Title |
|---|---|---|---|---|
| US20160214075A1 (en) * | 2015-01-23 | 2016-07-28 | The Board Of Trustees Of The University Of Illinois | Method of producing silicone microspheres |
Non-Patent Citations (1)
| Title |
|---|
| Geldmeier et al., "Plasmonic aerosols" Phys. Rev. B 99, 081112(R) (Feb. 13, 2019). |
Also Published As
| Publication number | Publication date |
|---|---|
| US20200261939A1 (en) | 2020-08-20 |
Similar Documents
| Publication | Publication Date | Title |
|---|---|---|
| Barber et al. | Light scattering by particles: computational methods | |
| Ricci et al. | Accurate mass measurement of a levitated nanomechanical resonator for precision force-sensing | |
| Putnam et al. | Thermal conductivity of nanoparticle suspensions | |
| Liu et al. | λ3/20000 plasmonic nanocavities with multispectral ultra-narrowband absorption for high-quality sensing | |
| Mahmoud et al. | Aggregation of gold nanoframes reduces, rather than enhances, SERS efficiency due to the trade-off of the inter-and intraparticle plasmonic fields | |
| Titova et al. | Generation of terahertz radiation by optical excitation of aligned carbon nanotubes | |
| Wang et al. | Optical trapping and laser-spectroscopy measurements of single particles in air: a review | |
| Shobin et al. | Glycerol mediated synthesis of silver nanowires for room temperature ammonia vapor sensing | |
| Kottmann et al. | Field polarization and polarization charge distributions in plasmon resonant nanoparticles | |
| Taflin et al. | Measurement of droplet interfacial phenomena by light‐scattering techniques | |
| Lu et al. | Hydrophobic Teflon films as concentrators for single-molecule SERS detection | |
| Feng et al. | Silver-coated elevated bowtie nanoantenna arrays: Improving the near-field enhancement of gap cavities for highly active surface-enhanced Raman scattering | |
| US11406997B2 (en) | Apparatus for generating and optically characterizing an aerosol | |
| Nguyen et al. | Rich variety of substrates for surface enhanced Raman spectroscopy | |
| Karlsen et al. | Influence of nanotube length and density on the plasmonic terahertz response of single-walled carbon nanotubes | |
| Komandin et al. | Effect of moisture adsorption on the broadband dielectric response of SiO2-based nanoporous glass | |
| Moirangthem et al. | Interfacial refractive index sensing using visible-excited intrinsic zinc oxide photoluminescence coupled to whispering gallery modes | |
| Geldmeier et al. | Plasmonic aerosols | |
| Darby et al. | Single-molecule surface-enhanced Raman spectroscopy with nanowatt excitation | |
| Phan et al. | Surface plasmon resonances of protein-conjugated gold nanoparticles on graphitic substrates | |
| Gong et al. | Hybrid octahedral Au nanocrystals and Ag nanohole arrays as substrates for highly sensitive and reproducible surface-enhanced Raman scattering | |
| Zaaroura et al. | Experimental studies on evaporation kinetics of gold nanofluid droplets: Influence of nanoparticle sizes and coating on thermal performance | |
| Kareem et al. | Preparation high quality ethanol gas sensor by modifying porous silicon (PS) surface with carbon nanotube (CNTs) | |
| Zhang et al. | Triangular Au nanoparticle arrays based on flexible materials as temperature-sensitive SERS substrates | |
| Girard et al. | Mechanisms of resonant low frequency Raman scattering from metallic nanoparticle Lamb modes |
Legal Events
| Date | Code | Title | Description |
|---|---|---|---|
| AS | Assignment |
Owner name: THE GOVERNMENT OF THE UNITED STATES, AS RESPRESENTED BY THE SECRETARY OF THE NAVY, VIRGINIA Free format text: ASSIGNMENT OF ASSIGNORS INTEREST;ASSIGNORS:FONTANA, JAKE;NACIRI, JAWAD;REEL/FRAME:051749/0951 Effective date: 20200206 |
|
| FEPP | Fee payment procedure |
Free format text: ENTITY STATUS SET TO UNDISCOUNTED (ORIGINAL EVENT CODE: BIG.); ENTITY STATUS OF PATENT OWNER: LARGE ENTITY |
|
| STPP | Information on status: patent application and granting procedure in general |
Free format text: APPLICATION DISPATCHED FROM PREEXAM, NOT YET DOCKETED |
|
| STPP | Information on status: patent application and granting procedure in general |
Free format text: DOCKETED NEW CASE - READY FOR EXAMINATION |
|
| STPP | Information on status: patent application and granting procedure in general |
Free format text: NON FINAL ACTION MAILED |
|
| STPP | Information on status: patent application and granting procedure in general |
Free format text: RESPONSE TO NON-FINAL OFFICE ACTION ENTERED AND FORWARDED TO EXAMINER |
|
| STPP | Information on status: patent application and granting procedure in general |
Free format text: NOTICE OF ALLOWANCE MAILED -- APPLICATION RECEIVED IN OFFICE OF PUBLICATIONS |
|
| STCF | Information on status: patent grant |
Free format text: PATENTED CASE |
|
| CC | Certificate of correction | ||
| FEPP | Fee payment procedure |
Free format text: SURCHARGE FOR LATE PAYMENT, LARGE ENTITY (ORIGINAL EVENT CODE: M1554); ENTITY STATUS OF PATENT OWNER: LARGE ENTITY |
|
| MAFP | Maintenance fee payment |
Free format text: PAYMENT OF MAINTENANCE FEE, 4TH YEAR, LARGE ENTITY (ORIGINAL EVENT CODE: M1551); ENTITY STATUS OF PATENT OWNER: LARGE ENTITY Year of fee payment: 4 |