US11385237B2 - Methods for evaluating glycemic regulation and applications thereof - Google Patents
Methods for evaluating glycemic regulation and applications thereof Download PDFInfo
- Publication number
- US11385237B2 US11385237B2 US16/432,812 US201916432812A US11385237B2 US 11385237 B2 US11385237 B2 US 11385237B2 US 201916432812 A US201916432812 A US 201916432812A US 11385237 B2 US11385237 B2 US 11385237B2
- Authority
- US
- United States
- Prior art keywords
- individual
- glycemic
- glucose
- windows
- variability
- Prior art date
- Legal status (The legal status is an assumption and is not a legal conclusion. Google has not performed a legal analysis and makes no representation as to the accuracy of the status listed.)
- Active, expires
Links
Images


Classifications
-
- G—PHYSICS
- G01—MEASURING; TESTING
- G01N—INVESTIGATING OR ANALYSING MATERIALS BY DETERMINING THEIR CHEMICAL OR PHYSICAL PROPERTIES
- G01N33/00—Investigating or analysing materials by specific methods not covered by groups G01N1/00 - G01N31/00
- G01N33/48—Biological material, e.g. blood, urine; Haemocytometers
- G01N33/50—Chemical analysis of biological material, e.g. blood, urine; Testing involving biospecific ligand binding methods; Immunological testing
- G01N33/66—Chemical analysis of biological material, e.g. blood, urine; Testing involving biospecific ligand binding methods; Immunological testing involving blood sugars, e.g. galactose
-
- G—PHYSICS
- G16—INFORMATION AND COMMUNICATION TECHNOLOGY [ICT] SPECIALLY ADAPTED FOR SPECIFIC APPLICATION FIELDS
- G16H—HEALTHCARE INFORMATICS, i.e. INFORMATION AND COMMUNICATION TECHNOLOGY [ICT] SPECIALLY ADAPTED FOR THE HANDLING OR PROCESSING OF MEDICAL OR HEALTHCARE DATA
- G16H10/00—ICT specially adapted for the handling or processing of patient-related medical or healthcare data
- G16H10/40—ICT specially adapted for the handling or processing of patient-related medical or healthcare data for data related to laboratory analysis, e.g. patient specimen analysis
-
- G—PHYSICS
- G16—INFORMATION AND COMMUNICATION TECHNOLOGY [ICT] SPECIALLY ADAPTED FOR SPECIFIC APPLICATION FIELDS
- G16H—HEALTHCARE INFORMATICS, i.e. INFORMATION AND COMMUNICATION TECHNOLOGY [ICT] SPECIALLY ADAPTED FOR THE HANDLING OR PROCESSING OF MEDICAL OR HEALTHCARE DATA
- G16H20/00—ICT specially adapted for therapies or health-improving plans, e.g. for handling prescriptions, for steering therapy or for monitoring patient compliance
- G16H20/10—ICT specially adapted for therapies or health-improving plans, e.g. for handling prescriptions, for steering therapy or for monitoring patient compliance relating to drugs or medications, e.g. for ensuring correct administration to patients
-
- G—PHYSICS
- G16—INFORMATION AND COMMUNICATION TECHNOLOGY [ICT] SPECIALLY ADAPTED FOR SPECIFIC APPLICATION FIELDS
- G16H—HEALTHCARE INFORMATICS, i.e. INFORMATION AND COMMUNICATION TECHNOLOGY [ICT] SPECIALLY ADAPTED FOR THE HANDLING OR PROCESSING OF MEDICAL OR HEALTHCARE DATA
- G16H20/00—ICT specially adapted for therapies or health-improving plans, e.g. for handling prescriptions, for steering therapy or for monitoring patient compliance
- G16H20/30—ICT specially adapted for therapies or health-improving plans, e.g. for handling prescriptions, for steering therapy or for monitoring patient compliance relating to physical therapies or activities, e.g. physiotherapy, acupressure or exercising
-
- G—PHYSICS
- G16—INFORMATION AND COMMUNICATION TECHNOLOGY [ICT] SPECIALLY ADAPTED FOR SPECIFIC APPLICATION FIELDS
- G16H—HEALTHCARE INFORMATICS, i.e. INFORMATION AND COMMUNICATION TECHNOLOGY [ICT] SPECIALLY ADAPTED FOR THE HANDLING OR PROCESSING OF MEDICAL OR HEALTHCARE DATA
- G16H20/00—ICT specially adapted for therapies or health-improving plans, e.g. for handling prescriptions, for steering therapy or for monitoring patient compliance
- G16H20/60—ICT specially adapted for therapies or health-improving plans, e.g. for handling prescriptions, for steering therapy or for monitoring patient compliance relating to nutrition control, e.g. diets
-
- G—PHYSICS
- G16—INFORMATION AND COMMUNICATION TECHNOLOGY [ICT] SPECIALLY ADAPTED FOR SPECIFIC APPLICATION FIELDS
- G16H—HEALTHCARE INFORMATICS, i.e. INFORMATION AND COMMUNICATION TECHNOLOGY [ICT] SPECIALLY ADAPTED FOR THE HANDLING OR PROCESSING OF MEDICAL OR HEALTHCARE DATA
- G16H50/00—ICT specially adapted for medical diagnosis, medical simulation or medical data mining; ICT specially adapted for detecting, monitoring or modelling epidemics or pandemics
- G16H50/30—ICT specially adapted for medical diagnosis, medical simulation or medical data mining; ICT specially adapted for detecting, monitoring or modelling epidemics or pandemics for calculating health indices; for individual health risk assessment
-
- G—PHYSICS
- G16—INFORMATION AND COMMUNICATION TECHNOLOGY [ICT] SPECIALLY ADAPTED FOR SPECIFIC APPLICATION FIELDS
- G16H—HEALTHCARE INFORMATICS, i.e. INFORMATION AND COMMUNICATION TECHNOLOGY [ICT] SPECIALLY ADAPTED FOR THE HANDLING OR PROCESSING OF MEDICAL OR HEALTHCARE DATA
- G16H50/00—ICT specially adapted for medical diagnosis, medical simulation or medical data mining; ICT specially adapted for detecting, monitoring or modelling epidemics or pandemics
- G16H50/70—ICT specially adapted for medical diagnosis, medical simulation or medical data mining; ICT specially adapted for detecting, monitoring or modelling epidemics or pandemics for mining of medical data, e.g. analysing previous cases of other patients
-
- G—PHYSICS
- G16—INFORMATION AND COMMUNICATION TECHNOLOGY [ICT] SPECIALLY ADAPTED FOR SPECIFIC APPLICATION FIELDS
- G16H—HEALTHCARE INFORMATICS, i.e. INFORMATION AND COMMUNICATION TECHNOLOGY [ICT] SPECIALLY ADAPTED FOR THE HANDLING OR PROCESSING OF MEDICAL OR HEALTHCARE DATA
- G16H80/00—ICT specially adapted for facilitating communication between medical practitioners or patients, e.g. for collaborative diagnosis, therapy or health monitoring
-
- G—PHYSICS
- G01—MEASURING; TESTING
- G01N—INVESTIGATING OR ANALYSING MATERIALS BY DETERMINING THEIR CHEMICAL OR PHYSICAL PROPERTIES
- G01N2800/00—Detection or diagnosis of diseases
- G01N2800/04—Endocrine or metabolic disorders
- G01N2800/042—Disorders of carbohydrate metabolism, e.g. diabetes, glucose metabolism
-
- G—PHYSICS
- G01—MEASURING; TESTING
- G01N—INVESTIGATING OR ANALYSING MATERIALS BY DETERMINING THEIR CHEMICAL OR PHYSICAL PROPERTIES
- G01N33/00—Investigating or analysing materials by specific methods not covered by groups G01N1/00 - G01N31/00
- G01N33/48—Biological material, e.g. blood, urine; Haemocytometers
- G01N33/50—Chemical analysis of biological material, e.g. blood, urine; Testing involving biospecific ligand binding methods; Immunological testing
- G01N33/74—Chemical analysis of biological material, e.g. blood, urine; Testing involving biospecific ligand binding methods; Immunological testing involving hormones or other non-cytokine intercellular protein regulatory factors such as growth factors, including receptors to hormones and growth factors
Definitions
- the invention is generally directed to processes evaluation of glycemic regulation, and more specifically to methods and systems for classifying individuals based on their temporal glycemic pattern, and applications thereof, including treatments.
- glycemia i.e., the level sugar or glucose in blood.
- Standard assessments of glycemia typically utilize single time-point or an average of measurements of blood glucose, without consideration for how blood glucose fluctuates over time.
- a few common methods to assess glycemia include measuring fasting glucose levels, measuring glycated hemoglobin (HbA1c test), and oral glucose tolerance test (OGTT).
- CGM Continuous glucose monitoring
- a number of embodiments are directed to developing a glycemic pattern classification system using continuous glucose monitoring (CGM) data.
- CGM continuous glucose monitoring
- an individual can be classified using CGM data to determine her glycemic pattern.
- Numerous embodiments treat an individual based on her glycemic pattern classification.
- fragment CGM data in a number of temporally defined windows, which are in turn used to develop dissimilarity matrices between the windows.
- spectral clustering is performed to generate classes of glycemic patterns. Numerous embodiments incorporate an individual's glycemic pattern into a dissimilarity matrix to perform spectral clustering to classify that individual based on their glycemic pattern.
- an individual is treated based on their glycemic pattern classification.
- a number of treatments in accordance with various embodiments, treat an individual with medications, dietary supplements, dietary alterations, physical exercise, or any combination thereof.
- a first individual's continuous glucose monitoring data is fragmented into temporally defined windows.
- the first individual's temporally defined windows is entered into a dissimilarity matrix that has been constructed using a panel of individuals' temporally defined windows of fragmented continuous glucose monitoring data.
- the first individual's glycemic pattern is classified into a particular class by performing spectral clustering on the dissimilarity matrix.
- the spectral clustering utilizes continuous glucose monitoring data from a panel of individuals to generate a set of classes.
- the spectral clustering clusters the first individual and each individual of the panel into particular class of the set of classes as determined by each individual's variability in blood glucose levels.
- the first individual is treated based on the individual's glycemic pattern classification.
- the individual is treated with one of the following treatments: a medication, a dietary supplement, a dietary alteration, and physical exercise.
- the spectral clustering classifies the first individual into a class that is characterized as having greater than moderate glycemic variability.
- the first individual is administered a medication used to treat type II Diabetes.
- the medication is one of: insulin, alpha-glucosidase inhibitors, biguanides, dopamine agonists, DPP-4 inhibitors, glucagon-like peptides, meglitinides, sodium glucose transporter 2 inhibitors, sulfonylureas, and thiazolidinediones.
- the spectral clustering classifies the first individual into a class that is characterized as having moderate or greater than moderate glycemic variability.
- the first individual is administered a dietary supplement, which is one of: alpha-lipoic acid, chromium, coenzyme Q10, garlic, hydroxychalcone (cinnamon), magnesium, omega-3 fatty acids, psyllium and vitamin D.
- the temporally defined window has length of: 0.5, 1.0, 1.5, 2.0, 2.5, 3.0, 3.5, 4.0, 4.5, or 5.0 hours
- the temporally defined windows overlap to yield a coverage greater than 1 ⁇ .
- the fragmentation of continuous glucose monitoring data is determined based upon a parameter, which is one of: cluster number, proportion of variance explained, average silhouette width, Calinski-Harabasz index, entropy, and Dunn index.
- the dissimilarity matrix is calculated between all pairs of windows across the first individual.
- the dissimilarity matrix is calculated using at least one of: complexity invariant distance (CID), dynamic time warping (DTW), Euclidean, and a combination of complexity invariant distance with dynamic time warping (CID-DTW).
- CID complexity invariant distance
- DTW dynamic time warping
- Euclidean Euclidean
- CID-DTW a combination of complexity invariant distance with dynamic time warping
- the spectral clustering is performed using the Luxburg method.
- the spectral clustering clusters individuals into at least two classes.
- the spectral clustering clusters individuals into a low glycemic variability class, a moderate glycemic variability class, and a severe glycemic variability class.
- the at least two classes are determined without supervision.
- the first individual has not been diagnosed as diabetic or prediabetic.
- the first individual has not been diagnosed as normoglycemic.
- FIG. 1 illustrates a process for treating an individual based on their glycemic pattern in accordance with an embodiment of the invention.
- FIG. 2 illustrates a process to generate classes of glycemic patterns in accordance with an embodiment of the invention.
- FIG. 3 illustrates a process to classify and treat an individual based on her glycemic pattern in accordance with an embodiment of the invention.
- FIG. 4 illustrates a diagram of computing systems configured to classify individuals based on their glycemic pattern in accordance with various embodiments of the invention.
- FIG. 5 illustrates an exemplary method to classify patterns with spectral clustering and perform various applications based on the clustering results in accordance with an embodiment of the invention.
- FIG. 6 provides a table on general characteristics of individuals used in glycemic panel study, used in accordance with various embodiments of the invention.
- FIG. 7 provides a table on panel characteristics, separated into diabetic diagnosis cohorts, used in accordance with an embodiment of the invention.
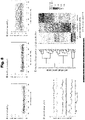
- FIG. 8 illustrates CGM data and glycemic pattern classification in accordance with an embodiment of the invention.
- FIG. 9 provides results of various distance metrics used to measure variability, generated in accordance with an embodiment of the invention.
- FIG. 10 provides a silhouette width results of glycemic pattern classifications, generated in accordance with an embodiment of the invention.
- FIG. 11 provides a table comparing common CGM metrics between glucotypes, generated in accordance with an embodiment of the invention.
- FIG. 12 provides results of a spearman's correlation between each glucotype pattern and a number of clinically relevant metabolic measures, generated in accordance with an embodiment of the invention.
- FIG. 13 provides a table of correlations between each glucotype pattern and a number of clinically relevant metabolic measures, generated in accordance with an embodiment of the invention.
- FIG. 14 provides results of a correlation between glycemic pattern classifications and measures of glucose homeostasis, generated in accordance with an embodiment of the invention.
- FIG. 15 provides a table on nutrition facts of standardized meals, utilized in accordance with an embodiment of the invention.
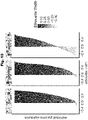
- FIG. 16 provides results of responses of three glycemic pattern classes to three different standardized meals, generated in accordance with an embodiment of the invention.
- FIG. 17 provides results of interstitial glucose concentration of a number participants in response to standardized meal, generated in accordance with an embodiment of the invention.
- FIG. 18 provides results of principal component analysis of common measures comparing glucotype classification and diabetes diagnosis, generated in accordance with an embodiment of the invention.
- FIG. 19 provides results of the fraction of time spent with severe variability for non-diabetic, pre-diabetic, and diabetic individuals, generated in accordance with an embodiment of the invention.
- FIG. 20 provides results of proportions of CGM data in pre-diabetic and diabetic glycemic ranges as defined in the American Diabetes Association Guidelines, generated in accordance with an embodiment of the invention.
- FIG. 21 provides a comparison of glycemic response, insulin secretion, and insulin sensitivity across a spectrum of glucotypes, generated in accordance with an embodiment of the invention.
- continuous glucose monitoring (CGM) data of an individual is collected and used to classify that individual based on their glycemic pattern (an individual's classification is also referred to as “glucotype”).
- CGM continuous glucose monitoring
- Many embodiments utilize an individual's classification to perform a treatment upon that individual.
- a treatment can include a medication, a dietary supplement, a dietary alteration, physical exercise, and any combination thereof.
- Glycemic dysregulation is one of the most significant health problems worldwide, and affects 30.2 million adults in the U.S. and 422 million worldwide with global costs in excess of $825 billion. In the U.S. alone there are 84 million individuals with prediabetes, which convert to type 2 diabetes with an annual rate of approximately 10%.
- a major complication with current metrics of glucose variability is that they measure individual aspects of the time series data, but not entire temporal profiles.
- Technological advances in both wearable devices and time-series data analysis enable the characterization of glucose variability by using the shape of continuous blood glucose curve. By analyzing the shape of the continuous glucose time series data, all aspects of variability can be simultaneously compared.
- numerous embodiments are directed to a comprehensive metric of glycemic variability, which may encompass the magnitude of blood glucose fluctuations, the rate of change of glucose concentration, relative glucose concentration, and magnitude and frequency of blood glucose fluctuations.
- a number embodiments can detect glycemic dysfunction that is not appreciable by the current standard methods, such as HbA1c, OGTT, and fasting glucose tests.
- FIG. 1 An embodiment of a process to treat an individual based on their glycemic pattern is illustrated in FIG. 1 .
- This embodiment is directed to determining an individual's glycemic pattern and applies the knowledge garnered to a treatment plan.
- this process can be used to treat an individual having a highly variable glycemic pattern with a medication, a dietary supplement, a dietary alteration, physical exercise, and any combination thereof.
- Process 100 can begin with obtaining ( 101 ) CGM data of an individual.
- CGM devices are medically attached to an individual to record their continuous blood glucose level.
- a Dexcom San Diego, Calif.
- Abbott Abbott (Abbott Park, Ill.)
- Tandem San Diego, Calif.
- Medtronic Dublin, Ireland
- any appropriate CGM device capable of temporal recordation of blood glucose level can be used.
- an individual is any individual that has their blood glucose level monitored over a period a time.
- an individual has been diagnosed as being diabetic or pre-diabetic.
- Embodiments are also directed to an individual being one that has not been diagnosed with a diabetic status.
- the individual is normoglycemic or diagnosed as normoglycemic, as determined by classical diabetes testing, including (but not limited to) measuring fasting glucose levels, measuring glycated hemoglobin (HbA1c test), and oral glucose tolerance test (OGTT).
- normoglycemia, pre-diabetic, and diabetic assessment is determined by standards set forth by a Diabetes organization such as the American Diabetes Association. It should be understood that any generally accepted diabetic assessment can be utilized.
- process 100 can determine ( 103 ) an individual's glycemic pattern.
- an individual's glycemic pattern accounts for the variability of blood glucose concentration, which can be classified.
- an individual's glycemic pattern falls within a particular glycemic class and/or glucotype.
- Various embodiments develop a number of classes to describe a populations' collection of glycemic pattern.
- glycemic pattern classes are determined empirically defined as low variability, moderate variability, and severe variability. It should be apparent to those skilled in the art that precise definition and label of glycemic pattern classes can vary, depending on the process used to develop the various classes.
- a treatment entails a medication, a dietary supplement, a dietary alteration, physical exercise, or any combination thereof.
- an individual is treated by a medical professional, such as a doctor, nurse, dietician, or similar.
- Various embodiments are directed to self-treatment such that an individual having a particular glycemic pattern intakes a medicine, a dietary supplement, alters her diet, or physically exercises based on the knowledge of their glycemic pattern.
- Process 200 begins with obtaining ( 201 ) CGM data for a panel of individuals.
- this CGM data is obtained from each individual of a panel and is derived from a CGM device that records blood glucose levels over a period of time.
- an individual is any individual that has their blood glucose level monitored over a period a time.
- an individual has been diagnosed as being diabetic or pre-diabetic.
- Embodiments are also directed to an individual being one that has not been diagnosed with a diabetic status.
- the individual is normoglycemic or diagnosed as normoglycemic, as determined by classical diabetes testing, including (but not limited to) measuring fasting glucose levels, measuring glycated hemoglobin (HbA1c test), and oral glucose tolerance test (OGTT).
- normoglycemia, pre-diabetic, and diabetic assessment is determined by standards set forth by a Diabetes organization such as the American Diabetes Association. It should be understood that any generally accepted diabetic assessment can be utilized.
- a period of time that CGM data is recorded is a day, two days, three days, a week, two weeks, a month, or longer. It should be noted that any period of time can be utilized, but longer periods of times result in more data to analyze. Furthermore, it should be noted that individuals within a panel can be monitored for different periods of times.
- the CGM data of each individual is fragmented ( 203 ) into temporally defined windows.
- the fragment window is selected from 0.5, 1.0, 1.5, 2.0, 2.5, 3.0, 3.5, 4.0, 4.5, and 5.0 hours.
- Various embodiments overlap fragment windows, which increases coverage of the various time frames.
- the window overlap is selected from 25%, 50%, 55%, 60%, 65%, 70%, 75%, 80%, 85, and 90%.
- the coverage of time frames is 1 ⁇ , 2 ⁇ , 3 ⁇ , 4 ⁇ , 5 ⁇ , 10 ⁇ , or more.
- the precise temporal window length overlap, and coverage can be selected by a number of methodologies, many of which that would be covered by various embodiments of the invention.
- fragmentation is determined empirically, and/or optimized by examining a number of parameters.
- Parameters that can be examined include (but are not limited to) cluster number, proportion of variance explained, average silhouette width, Calinski-Harabasz index, entropy, and Dunn index.
- cluster number proportion of variance explained, average silhouette width, Calinski-Harabasz index, entropy, and Dunn index.
- Process 200 also computes ( 205 ) a dissimilarity matrix between temporally defined windows.
- a dissimilarity matrix in accordance with numerous embodiments, is a matrix of distance metrics between the temporally defined sliding windows. Multiple embodiments calculate a dissimilarity matrix between all pairs of windows across all individual.
- a dissimilarity matrix is calculated using at least one of: complexity invariant distance (CID), dynamic time warping (DTW), Euclidean, and a combination of complexity invariant distance with dynamic time warping (CID-DTW).
- CID-DTW is used to compute a dissimilarity matrix, which may have advantages in clustering performance and/or applicability in comparing glycemic temporal patterns.
- Spectral clustering can be performed ( 207 ) on a dissimilarity matrix to generate classes of glycemic patterns (also referred to as “glucotypes”).
- Glycemic pattern classes in accordance with numerous embodiments, define a cohort of individuals having a particular variability in blood glucose level. In some embodiments, a glycemic pattern variability classes are used to define cohorts. In some such embodiments, three variability classes are defined, which may be defined as low, moderate and severe.
- spectral clustering can be performed according the Luxburg method (see U. Von Luxburg, Stat. Comput. 17 (2007), the disclosure of which is herein incorporated by reference). Accordingly, in various embodiments, spectral clustering the eigenvalues (spectrum) and eigenvectors of the dissimilarity matrix are computed and only the eigenvectors corresponding to the smallest eigenvalues are considered. This allows a reduction of the dimensionality of the data before performing the clustering. Each temporal window could be seen as projected onto the lower dimensional eigenvector space. K-means clustering, in accordance with several embodiments, is then applied to the windows projected onto the space defined by the smallest k eigenvectors.
- Process 200 also outputs ( 209 ) a report containing classes of glycemic patterns. As is discussed further below, these classes can be used to determine an individual's glycemic pattern, which can further used to treat the individual.
- Process 300 obtains continuous glucose monitoring data of an individual.
- CGM data is derived from a CGM device that records blood glucose levels over a period of time.
- an individual is any individual that has their blood glucose level monitored over a period a time.
- an individual has been diagnosed as being diabetic or pre-diabetic.
- Embodiments are also directed to an individual being one that has not been diagnosed with a diabetic status.
- the individual is normoglycemic or diagnosed as normoglycemic, as determined by classical diabetes testing, including (but not limited to) measuring fasting glucose levels, measuring glycated hemoglobin (HbA1c test), and oral glucose tolerance test (OGTT).
- normoglycemia, pre-diabetic, and diabetic assessment is determined by standards set forth by a Diabetes organization such as the American Diabetes Association. It should be understood that any generally accepted diabetic assessment can be utilized.
- a period of time that CGM data is recorded is a day, two days, three days, a week, two weeks, a month, or longer. It should be noted that any period of time can be utilized, but longer periods of times result in more data to analyze.
- the CGM data is fragmented ( 303 ) into temporally defined windows.
- the fragment window is selected from 0.5, 1.0, 1.5, 2.0, 2.5, 3.0, 3.5, 4.0, 4.5, and 5.0 hours.
- Various embodiments overlap fragment windows, which increases coverage of the various time frames.
- the window overlap is selected from 25%, 50%, 55%, 60%, 65%, 70%, 75%, 80%, 85%, and 90%.
- the coverage of time frames is 1 ⁇ , 2 ⁇ , 3 ⁇ , 4 ⁇ , 5 ⁇ , 10 ⁇ , or more.
- the precise temporal window length overlap, and coverage can be selected by a number of methodologies, many of which that would be covered by various embodiments of the invention.
- fragmentation is determined empirically, and/or optimized by examining a number of parameters.
- Parameters that can be examined include (but are not limited to) cluster number, proportion of variance explained, average silhouette width, Calinski-Harabasz index, entropy, and Dunn index.
- cluster number proportion of variance explained, average silhouette width, Calinski-Harabasz index, entropy, and Dunn index.
- Process 300 also enters ( 305 ) an individual's CGM data into a dissimilarity matrix that measures the dissimilarity between temporally defined windows.
- a dissimilarity matrix in accordance with numerous embodiments, is a matrix of distance metrics between the temporally defined sliding windows. Multiple embodiments calculate a dissimilarity matrix between all pairs of windows across an individual. In several embodiments, a dissimilarity matrix is calculated using at least one of: complexity invariant distance (CID), dynamic time warping (DTW), Euclidean, and a combination of complexity invariant distance with dynamic time warping (CID-DTW).
- CID-DTW is used to compute a dissimilarity matrix, which may have advantages in clustering performance and/or applicability in comparing glycemic temporal patterns. Despite only a few methods to calculate a dissimilarity matrix are described, it should be understood that any appropriate method to calculate a dissimilarity matrix for use in spectral clustering would fall within a number of embodiments of the invention.
- dissimilarity matrices that have been computed for a panel of individuals is utilized, such as (for example) the dissimilarity matrices described in FIG. 2 .
- Spectral clustering can be performed on a dissimilarity matrix having the entered CGM data of an individual to classify ( 307 ) that individual.
- An individual's glycemic pattern can be classified, in accordance with numerous embodiments, as having a particular variability in blood glucose level.
- an individual may be classified into one glycemic pattern variability class of a spectrum of classes.
- three variability classes are defined, and an individual may be classified has having low, moderate or severe glycemic pattern variability.
- spectral clustering can be performed according the Luxburg method (see U. Von Luxburg, Stat. Comput. 17 (2007), the disclosure of which is herein incorporated by reference). Accordingly, in various embodiments, spectral clustering the eigenvalues (spectrum) and eigenvectors of the dissimilarity matrix are computed and only the eigenvectors corresponding to the smallest eigenvalues are considered. This allows a reduction of the dimensionality of the data before performing the clustering. Each temporal window could be seen as projected onto the lower dimensional eigenvector space. K-means clustering, in accordance with several embodiments, is then applied to the windows projected onto the space defined by the smallest k eigenvectors.
- a spectral clustering algorithm incorporates data from a panel of individuals, such as (for example) the spectral clustering algorithm described in FIG. 2 .
- a spectral clustering algorithm utilizes a panel of individuals, a singular individual can be classified based on the classifications generated by the spectral clustering.
- Process 300 also outputs ( 309 ) a report containing an individual's classification of her glycemic pattern. Furthermore, based on an individual's glycemic pattern classification, the individual is treated ( 311 ) to ameliorate a symptom related to the glycemic pattern. In several embodiments, an individual is provided with a personalized treatment plan.
- computer systems ( 401 ) may be implemented on a set of one or more computing devices in accordance with some embodiments of the invention.
- the computer systems ( 401 ) may incorporate a personal computer, a laptop computer, and/or any other computing device with sufficient processing power for the processes described herein.
- the computer systems ( 401 ) include a processor ( 403 ), which may refer to one or more devices within the set of computing devices that can be configured to perform computations via machine readable instructions stored within a memory ( 407 ) of the computer systems ( 401 ).
- the processor may include one or more microprocessors (CPUs), one or more graphics processing units (GPUs), and/or one or more digital signal processors (DSPs). According to other embodiments of the invention, the computer system may be implemented on multiple computers.
- the memory ( 407 ) may contain a glycemic pattern cohort classification application ( 409 ) and a glycemic pattern individual classification application ( 411 ) that performs all or a portion of various methods according to different embodiments of the invention described throughout the present application.
- a processor ( 403 ) may perform a method similar to any of the processes described herein, during which memory ( 407 ) may be used to store various intermediate processing data such as cohort CGM data ( 409 a ), dissimilarity matrices ( 409 b ), spectral clustering results ( 409 c ), individual CGM data ( 411 a ), individual glycemic classification results ( 411 b ), and treatment plans ( 411 c ).
- various intermediate processing data such as cohort CGM data ( 409 a ), dissimilarity matrices ( 409 b ), spectral clustering results ( 409 c ), individual CGM data ( 411 a ), individual glycemic classification results ( 411 b ), and treatment plans ( 411 c ).
- the computer systems ( 401 ) may include an input/output interface ( 405 ) that can be utilized to communicate with a variety of devices, including but not limited to other computing systems, a projector, and/or other display devices.
- an input/output interface 405
- a variety of software architectures can be utilized to implement a computer system as appropriate to the requirements of specific applications in accordance with various embodiments of the invention.
- Various embodiments are directed to development of treatments related to glycemic pattern classifications.
- an individual may be classified as having a particular glycemic pattern. Based on their glycemic pattern classification, individuals with high glycemic variability can be treated with various medications, dietary supplements, dietary alterations, and physical exercise regimens.
- medications and/or dietary supplements are administered in a therapeutically effective amount as part of a course of treatment.
- to “treat” means to ameliorate at least one symptom of the disorder to be treated or to provide a beneficial physiological effect.
- amelioration of a symptom could be a reduction of glycemic pattern variability.
- Assessment of glycemic pattern variability can be performed in many ways, including, but not limited to assessing the changes in variability of an individual's CGM data.
- a therapeutically effective amount can be an amount sufficient to prevent reduce, ameliorate or eliminate the symptoms of diseases or pathological conditions susceptible to such treatment, such as, for example, diabetes, heart disease, or other diseases that are affected by unstable glycemia.
- a therapeutically effective amount is an amount sufficient to reduce the variability of an individual's CGM data.
- Medications include (but are not limited to) insulin, alpha-glucosidase inhibitors (e.g., acarbose, miglitol), biguanides (e.g., metformin), dopamine agonists (e.g., bromocriptine), DPP-4 inhibitors (e.g., alogliptin, linagliptin, saxagliptin, sitagliptin), glucagon-like peptides (e.g., albiglutide, dulaglutide, exenatide, liraglutide), meglitinides (e.g., nateglinide, repaglinide), sodium glucose transporter 2 inhibitors (e.g., dapagliflozin, canagliflozin, empagliflozin), sulfonylureas (e.g.
- alpha-glucosidase inhibitors e.g., acarbo
- an individual may be treated, in accordance with various embodiments, by a single medication or a combination of medications described herein.
- several embodiments of treatments further incorporate heart disease medications (e.g., aspirin, cholesterol and high blood pressure medications), dietary supplements, dietary alterations, physical exercise, or a combination thereof.
- dietary supplements may also help to treat unstable glycemia.
- Various dietary supplements such as alpha-lipoic acid, chromium, coenzyme Q10, garlic, hydroxychalcone (cinnamon), magnesium, omega-3 fatty acids, psyllium and vitamin D have been shown to have beneficial effects on individuals having diabetes and cardiac conditions.
- embodiments are directed to the use of dietary supplements, included those listed herein, to be used to treat an individual based on her glycemic pattern classification.
- a number of embodiments are also directed to combining dietary supplements with medications, dietary alterations, and physical exercise to reduce glycemic variability.
- an individual classified as having greater than moderate (e.g., high or severe) glycemic variability is treated with a medication.
- an individual classified as having moderate or greater than moderate glycemic variability is further monitored and/or treated with dietary supplements.
- Numerous embodiments are directed to dietary alteration and exercise treatments. Altering one's lifestyle, including physical activity and diet, has been shown to improve glycemic regulation. Accordingly, in a number of embodiments, an individual is treated by altering their diet and increasing physical activity in response to a classification to their glycemic regulatory pattern.
- Numerous embodiments are directed to treating an individual by substituting saturated fats with monounsaturated and unsaturated fats to help lower the risk for cardiovascular disease, which would be beneficial for many individuals struggling to control their glycemic pattern. Also, embodiments are directed to increasing amounts of fiber in the diet, which would be highly recommended to both help with glycemic control and also balance serum lipid levels (cholesterol and triglycerides).
- Exercise has a large impact on glycemic control.
- a treatment would entail a minimum of some minutes of active exercise per week.
- treatments would include a minimum of 150 minutes of exercise a week, however, the precise length of exercise may be dependent on the individual to be treated and their cardiovascular health. It is further noted that cardiovascular exercise is important for the immediate glycemic control and weight training will have a long-term effect by increasing muscle mass, affecting glucose utilization during rest.
- a treatment to help control glucose levels is stress management, as stress increases blood glucose levels.
- Some proven ways to help control stress include meditation, social support, adequate sleep, journaling, and therapy.
- Bioinformatic and biological data support the methods and systems of classifying individuals based on glycemic regulation and applications thereof.
- exemplary computational methods and exemplary applications related to classifying individuals based on glycemic regulation are provided.
- a new measure of glucose variability was derived from the spectral clustering of glycemic signatures using time-series-specific distance metrics. This method can be used to define a clinically relevant metric of glycemic patterns that would classify individuals into different glycemic pattern regulation classes, which is referred to throughout as glucotypes.
- a summary metric of glucose variability that encompasses all components of glucose signatures should provide a more comprehensive, dynamic and granular understanding of diabetes etiology, to detect glucose dysregulation at earlier stages of disease, and provide a tool by which one can personalize treatment for optimal glucose response.
- This exemplary methodology identified many individuals not known to be pre-diabetic by standard measures (fasting glucose, oral glucose tolerance test (OGTT) and HbA1c) to have high levels of postprandial glucose similar to pre-diabetics and diabetics. Although postprandial spikes in glucose have been reported previously, the discovery of these in patients that had been demonstrated to be normal by OGTT and insulin resistant individuals was unexpected; Deep phenotyping of participants for different measures of glucose dysfunction further enabled the development of models for glucose dysregulation at an individual level.
- standard measures fasting glucose, oral glucose tolerance test (OGTT) and HbA1c
- glucotype classification 57 healthy participants without prior diagnosis of diabetes were recruited.
- the panel was composed of 32 females and 25 males, with an age range of 25 to 76 (median 51).
- the study was approved under IRB 37141 and written consent was obtained for all participants.
- the blood glucose of each participant was monitored using CGM in their normal environment.
- the participants were extensively characterized with clinical metabolic phenotypes (see FIG. 5 ).
- Dexcom G4 CGM devices which provide interstitial glucose concentrations every five minutes, were placed on participants in the Stanford CTRU and worn by participants for a minimum of two weeks and maximum of four weeks during a period of stability in their lifestyle (no vacations, holidays, holidays, etc.). Participants were instructed to calibrate monitors once to twice daily using glucose meters (AccuCheck Nano SmartView). Subjects were blinded to the results of monitoring until after the monitors were removed so that their dietary habits were not influenced by the glucose recordings.
- Glucose tolerance of each participant was assessed after an overnight fast via oral glucose tolerance test (OGTT) with plasma samples drawn for measurement of glucose (oximetric method) and insulin (radioimmunoassay) at baseline, 30 minutes and 120 minutes after administration of 75 grams of glucose. From the baseline sample hemoglobin A1C (HbA1c), triglyceride, and high-density lipoprotein cholesterol levels were also determined. Insulin-mediated glucose uptake was quantified via a steady-state plasma glucose test. Insulin secretion was calculated from the OGTT as per below. The tests were usually performed when the participants were not wearing the Dexcom device.
- OGTT oral glucose tolerance test
- Insulin secretion rate was estimated from C-peptide concentration measured during OGTT tests, at baseline, 30 minutes and 120 minutes after administration of 75 grams of glucose.
- the Insulin SECretion (ISEC) software was used to calculate pre-hepatic insulin secretion from plasma C-peptide measurements with adjustment for age, sex, and BMI (for more on ISEC software, see R. Hovorka, P. A. Soons, & M. A. Young Comput. Methods Programs Biomed. 50, 253-264 (1996), the disclosure of which is herein incorporated by reference).
- the ISEC software can be obtained from the author Roman Hovorka, PhD, Metabolic Modelling Group, Centre for Measurement and Information in Medicine, Department of System Science, City University, Northampton Square, London EC1V OHB, United Kingdom. An error coefficient of variation of 5% and 15 minutes intervals was required.
- the mean fasting glucose was 93 mg/dL, 2 hour glucose 125 mg/dL and HbA1c ⁇ 5.4%.
- Insulin resistance quantified by the steady-state plasma glucose (SSPG) test, in which a higher value indicates relative resistance to insulin-mediated glucose uptake, ranged from 45 mg/dL to 335 mg/dL, reflecting great heterogeneity in the panel. This measure was particularly variable among the normoglycemic and pre-diabetic group.
- Each member of the panel wore continuous glucose monitors to record their temporal blood glucose levels. Data was extracted directly from the Dexcom G4 CGM system worn by participants. Potential glycemic signatures were generated from overlapping windows.
- the temporal profiles of blood glucose responses of the 57 participants were clustered, testing a variety of approaches, parameters and distance metrics ( FIG. 9 ).
- the number of clusters used for parameter optimization is the optimal k from the eigengap heuristic, which corresponds to the distance between consecutive eigenvalues of the spectral clustering.
- the optimal number of clusters k could vary between different combinations of parameters, and the clustering metrics are computed with respect to a given k for each set of parameters.
- the optimization of window size and window overlap was based on several clustering metrics ( FIG. 9 ):
- s ⁇ ( w ) b ⁇ ( w ) - a ⁇ ( w ) max ⁇ ( a ⁇ ( w ) , b ⁇ ( w ) ) , where b(w) is the lowest average distance of w to all points in any other cluster, of which w is not a member, and a(w) the average distance of w with all other windows within the same cluster.
- p i size i W , p i > 0 , k is the number of clusters and W is the total number of windows.
- CID-DTW complexity-invariant distance dynamic time warping
- Spectral clustering was performed according to the methods in von Luxburg's tutorial on spectral clustering on the dissimilarity matrix consisting of pairwise CID-DTW distance between all pairs of windows across all individuals (see U. Von Luxburg, Stat. Comput. 17 (2007), the disclosure of which is herein incorporated by reference).
- a symmetric step pattern and Sakoe-Chiba band with a size of 10% the window size were used.
- the distance matrix was generated using the ‘DTW’ and ‘Proxy’ package in R (see T. Giorgino, et al., J. Statistical Softw. 31, 1-24 (2009); and D. Meyer & C. Buchta R. Packag. 1-10 (2017); the disclosures of which are herein incorporated by reference).
- the number of neighbors for building the graph for the k-nearest-neighbor affinity matrix (also referred to as the adjacency graph) was optimized by finding the smallest n such that the entire graph was connected.
- the affinity matrix and the unnormalized laplacian were calculated for several n and the smallest n was chosen such that a single eigenvalue from the unnormalized laplacian was zero.
- Clustering was attempted for k ⁇ 5 to k+5 (where k is the optimal number of clusters from the eigengap heuristic) with the bounds that k must be greater than two and less than half the number of windows.
- An ANOVA analysis was performed to determine the parameters that optimized optimal explained-variance and Calinski-Harabasz indices.
- the optimal number of clusters (k) was chosen after considering the elbow-method, CH index, average silhouette index, and the eigengap heuristic.
- each glycemic signature maintained an identifier noting the original participant and starting time. As such, glycemic signatures could easily be linked to participant, time, and glucose concentration. The portion of time spent in each class was estimated by calculating the fraction of a participant's windows assigned to the class.
- the three patterns were classified as low, moderate and severe variability. These groups show a progressive increase in both the severity and magnitude of the variability in glucose concentration. It was determined that the fraction of time each participant spent in each pattern and found that some participants stayed predominantly in the low variability range whereas others were predominantly in the moderate and severe variability range ( FIG. 8E ), with other clear intermediates as well.
- glucotype L low variability
- glucotype M moderate variability
- glucotype S severe variability
- the classification of glycemic patterns is consistent with differences in common metrics of glycemic variability based on an ANOVA analysis (See Table in FIG. 11 ).
- the mean variability values for these metrics increased from low, moderate, to severe glucotype, supporting classification based on increasing variability.
- the classes increase in both variability and mean glucose concentration (77, 96 and 122 mg/dL in low, moderate and severe classes, respectively), making them a more comprehensive metric of glycemic state.
- spectral clustering can be also used to classify CGM profiles that were not included in the initial clustering. This approach can be used to classify individuals by entering in their CGM data into the spectral clustering.
- the initially clustered windows are referred to as training set or training windows (238 windows per person).
- the glucose values are mean-centered and scaled by using pre-computed mean and standard deviation from the training windows.
- Any new CGM profile is fragmented into temporal windows of a similar same size as the training set (e.g., 2.5 hours) in order to have a better accuracy of the computed dynamic time warping distance.
- the overlap between the windows can be variable.
- the training windows are randomly selected—with a fixed random seed—based on their density distribution around the centroids of the three defined classes in the eigenvector space.
- Complexity invariant dynamic time warping is then computed between each pair of new windows and randomly selected training windows.
- This distance matrix is converted to an affinity matrix following the implementation of an affinityMatrix( ) function in a Similarity Network Fusion R package.
- the sigma parameter of the affinityMatrix( ) function is the precomputed estimate based on the entire training set.
- the new windows in the affinity matrix are projected onto the eigenvector space derived from the randomly selected windows of the training set, and individually normalized across the eigenvectors. Finally, the windows in the eigenvector space are assigned to a glycemic signature class according to the class of the closest centroid.
- the fraction of time spent in each glucotype pattern was correlated with a number of clinically relevant metabolic measures ( FIGS. 12 and 13 ). These metrics included descriptive statistics measures such as mean/min/max glucose concentration, mean/max rate of change, interquartile range, and standard deviation. Other metrics included mean amplitude of glycemic excursion (MAGE), distance traveled, J index, and coefficient of variation. Mean amplitude of glycemic excursion was also calculated.
- MAGE mean amplitude of glycemic excursion
- the features for the analysis included clinical tests and CGM metrics commonly used to assess blood sugar control: age, body mass index, HbA1c, fasting blood sugar, OGTT—2 hr, fasting insulin, high sensitivity CRP, total cholesterol, triglycerides, high-density lipoprotein, low density lipoprotein, mean glucose, standard deviation glucose, range of glucose, min glucose, max glucose, glucose 25% quantile, median glucose, glucose 75% quantile, mean rate of change, max range of change, number fluctuations above 140 mg/dL, number fluctuations above 200 mg/dL, percent readings below 80 mg/dL, percent readings above 130 mg/dL, standard error glucose mean, number glucose excursions above standard deviation, mean amplitude of glycemic excursions, J index, interquartile range, mean of daily differences at 6 am, distance traveled, coefficient of variation.
- Diagnosis was determined based on the American Diabetes Association cutoffs for HbA1c, oral glucose tolerance test at two hours, and fasting blood sugar. Categorization of participants was based on the glycemic signature class in which they spent the largest portion of time.
- Each meal plan contained similar calories, but varied in their amounts of proteins, fat and fiber.
- the meal plans consisted of a breakfast which is when participants had a stable baseline.
- the breakfast meals were cornflakes and milk (low fiber and high sugar), a peanut butter sandwich (higher fat and higher protein), and a PROBAR protein bar (moderate fat and protein) (See FIG. 15 ).
- the clustering into glucotypes was applied only to a subset of the CGM profiles for each participant, therefore for several participants not all standardized meals were covered by the selected portion of the CGM profile.
- a trained clustering was used to classify, or “predict”, the entire profiles.
- the classes were recomputed for the entire profiles and used those to assign the standardized meal responses to the three glycemic signatures L, M, S. Consistently with the choice of optimal parameters, sliding windows of 2.5 hours with a 75% overlap were used.
- the windows that were considered started in a 40 minute interval around the annotated consumption time of the meal, i.e. within 20 minutes before or 20 minutes after the meal.
- the responses were assigned to glucotypes based on the most severe glycemic signature of the overlapping windows.
- FIGS. 16 and 17 Several types of meal responses were found in the panel ( FIGS. 16 and 17 ). Over a majority (60%) of the responses to milk/cereal were classified as severe variability whereas the responses to the PROBAR protein bar and to bread and peanut butter exhibited more low and moderate variability among individuals. Importantly, sixteen subjects who were classified as “normal” based on current standard clinical tests for diagnosing diabetes, had glucose levels in the pre-diabetic (>140 mg/dL) or diabetic (>200 mg/dL) range after the consumption of one or more of the standardized meals ( FIG. 16 ). Additionally, twenty-five subjects had higher glycemic responses measured by CGM following mixed meals than the responses noted on the OGTT, even with similar carbohydrate loading.
- Glucose control decreases along both principal component one and principal component two, such that the non-diabetic participants are located in the lower-left corner. Many of those with prediabetes were already dominated by severely variable glycemic signatures, which would be expected of diabetic individuals ( FIGS. 18 and 19 ).
- FIG. 21 To demonstrate heterogeneity in insulin metabolism relative to insulin resistance and glucose profiles, dynamic metabolic responses for several individuals are shown in FIG. 21 .
- patients diagnosed with diabetes showed sustained insulin secretion in response to the oral glucose load, although their insulin sensitivity and glycemic responses varied.
- inset B of FIG. 21 shows an insulin sensitive individual with high insulin secretion and a low blood glucose 2 hrs. postprandially.
- inset C of FIG. 21 represents an individual diagnosed with diabetes demonstrating high glycemic concentrations despite high insulin secretion. Presumably this individual is deficient in glucose uptake (i.e. insulin resistant). Insulin metabolism and glucose response was also in 3 undiagnosed individuals according to standard clinical parameters ( FIG.
- insets D, E and F include: a nondiabetic individual with normal fasting blood glucose, but high 2 hr. OGTT value in setting of insulin resistance and relative deficiency of insulin secretion (inset D of FIG. 21 ); a nondiabetic individual with insulin resistance and low insulin secretion, characterized by early glucose rise after load (inset E of FIG. 21 ); a nondiabetic individual with insulin resistance and high compensatory insulin secretion with relatively normal postprandial glucose following oral glucose load (inset F of FIG. 21 ).
Landscapes
- Health & Medical Sciences (AREA)
- Engineering & Computer Science (AREA)
- Medical Informatics (AREA)
- Public Health (AREA)
- General Health & Medical Sciences (AREA)
- Epidemiology (AREA)
- Primary Health Care (AREA)
- Life Sciences & Earth Sciences (AREA)
- Biomedical Technology (AREA)
- Pathology (AREA)
- Data Mining & Analysis (AREA)
- Chemical & Material Sciences (AREA)
- Hematology (AREA)
- Databases & Information Systems (AREA)
- Medicinal Chemistry (AREA)
- Molecular Biology (AREA)
- Immunology (AREA)
- Urology & Nephrology (AREA)
- Nutrition Science (AREA)
- Bioinformatics & Cheminformatics (AREA)
- Physical Education & Sports Medicine (AREA)
- Biophysics (AREA)
- Biotechnology (AREA)
- Microbiology (AREA)
- Cell Biology (AREA)
- Diabetes (AREA)
- Food Science & Technology (AREA)
- Physics & Mathematics (AREA)
- Analytical Chemistry (AREA)
- Biochemistry (AREA)
- General Physics & Mathematics (AREA)
- Investigating Or Analysing Biological Materials (AREA)
Abstract
Description
-
- Number of clusters: the optimal number based on the eigengap heuristic
- Proportion of variance explained: total between-cluster sum-of-square (totBSS) divided by total sum-of-square (totSS). The sum-of-squares were computed on a given distance matrix with the function css( ) from the R package GMD.
- Average silhouette width: The silhouette value is a measure of how similar a window is to its own cluster compared to other clusters. The silhouette index is the average of the silhouette values for all windows. For a window w, the silhouette is defined as
where b(w) is the lowest average distance of w to all points in any other cluster, of which w is not a member, and a(w) the average distance of w with all other windows within the same cluster.
-
- Calinski-Harabasz (CH) index: ratio between total between-cluster sum-of-square (totBSS) and total within-cluster sum-of-square (totWSS) normalized by the number of windows and number of clusters. Higher CH index means better cluster definition.
- Entropy: similar to the information entropy, it indicates how evenly the windows are assigned to the clusters. Low entropy means unbalanced clusters. Formally, entropy=−Σi=1 kpi*log(pi), where
k is the number of clusters and W is the total number of windows.
-
- Dunn index: given a certain distance metric between two clusters, it is defined as the ratio between the minimum pairwise distance over all pairs of clusters and the maximum within-cluster distance (cluster diameter) over all clusters. For a given assignment of clusters, a higher Dunn index indicates better clustering.
Claims (16)
Priority Applications (1)
| Application Number | Priority Date | Filing Date | Title |
|---|---|---|---|
| US16/432,812 US11385237B2 (en) | 2018-06-05 | 2019-06-05 | Methods for evaluating glycemic regulation and applications thereof |
Applications Claiming Priority (2)
| Application Number | Priority Date | Filing Date | Title |
|---|---|---|---|
| US201862681014P | 2018-06-05 | 2018-06-05 | |
| US16/432,812 US11385237B2 (en) | 2018-06-05 | 2019-06-05 | Methods for evaluating glycemic regulation and applications thereof |
Publications (2)
| Publication Number | Publication Date |
|---|---|
| US20190369108A1 US20190369108A1 (en) | 2019-12-05 |
| US11385237B2 true US11385237B2 (en) | 2022-07-12 |
Family
ID=68692587
Family Applications (1)
| Application Number | Title | Priority Date | Filing Date |
|---|---|---|---|
| US16/432,812 Active 2041-02-13 US11385237B2 (en) | 2018-06-05 | 2019-06-05 | Methods for evaluating glycemic regulation and applications thereof |
Country Status (1)
| Country | Link |
|---|---|
| US (1) | US11385237B2 (en) |
Families Citing this family (6)
| Publication number | Priority date | Publication date | Assignee | Title |
|---|---|---|---|---|
| US12131661B2 (en) * | 2019-10-03 | 2024-10-29 | Willow Laboratories, Inc. | Personalized health coaching system |
| CN111192681A (en) * | 2019-12-25 | 2020-05-22 | 新绎健康科技有限公司 | Method and system for acquiring target blood glucose characteristics |
| CN111048207B (en) * | 2019-12-27 | 2023-06-16 | 四川九八村信息科技有限公司 | Plasma donor evaluation method and system |
| US20210294851A1 (en) * | 2020-03-23 | 2021-09-23 | UiPath, Inc. | System and method for data augmentation for document understanding |
| US20220386965A1 (en) * | 2021-06-04 | 2022-12-08 | University Of Virginia Patent Foundation | Method for structuring and classification of continuous glucose monitoring (cgm) profiles |
| CN117789987B (en) * | 2024-02-23 | 2024-05-28 | 青岛大学附属医院 | Method and system for constructing endocrinology rehabilitation evaluation model |
Citations (2)
| Publication number | Priority date | Publication date | Assignee | Title |
|---|---|---|---|---|
| US20140031658A1 (en) * | 2011-04-12 | 2014-01-30 | Hui Zheng | System and method for monitoring glucose or other compositions in an individual |
| US20200342974A1 (en) * | 2017-12-21 | 2020-10-29 | Eli Lilly And Company | Closed loop control of physiological glucose |
-
2019
- 2019-06-05 US US16/432,812 patent/US11385237B2/en active Active
Patent Citations (2)
| Publication number | Priority date | Publication date | Assignee | Title |
|---|---|---|---|---|
| US20140031658A1 (en) * | 2011-04-12 | 2014-01-30 | Hui Zheng | System and method for monitoring glucose or other compositions in an individual |
| US20200342974A1 (en) * | 2017-12-21 | 2020-10-29 | Eli Lilly And Company | Closed loop control of physiological glucose |
Non-Patent Citations (30)
| Title |
|---|
| "Standards of Medical Care in Diabetes—2017", American Diabetes Association, The Journal of Clinical and Applied Research and Education, vol. 40, Supp. 1, Jan. 2017, 142 pgs. |
| Ahlqvist et al., "Novel subgroups of adult-onset diabetes and their association with outcomes: a data-driven cluster analysis of six variables", The Lancet Diabetes & Endocrinology, vol. 6, No. 5, May 1, 2018, pp. 361-369. |
| Albert et al., "Smart Meter Driven Segmentation: What Your Consumption Says About You", IEEE Transactions on Power Systems, vol. 28, No. 4, Nov. 2013, 12 pgs. |
| Baghurst, "Calculating the Mean Amplitude of Glycemic Excursion from Continuous Glucose Monitoring Data: An Automated Algorithm", Diabetes Technology & Therapeutics, vol. 13, No. 3, Feb. 27, 2011, pp. 296-302. |
| Batista et al., "A Complexity-Invariant Distance Measure for Time Series", Proceedings of the 2011 SIAM International Conference on Data Mining, Mesa, Arizona, Apr. 28-30, 2011, 12 pgs. |
| Bersch et al., "Sensor Data Acquisition and Processing Parameters for Human Activity Classification", Sensors, vol. 14, No. 3, Mar. 4, 2014, pp. 4239-4270. |
| Crenier et al., "Glucose Variability Assessed by Low Blood Glucose Index Is Predictive of Hypoglycemic Events in Patients With Type 1 Diabetes Switched to Pump Therapy", Diabetes Care, vol. 36, No. 8, Aug. 2013, pp. 2148-2153. |
| DPPR Group, "Reduction in the Incidence of Type 2 Diabetes with Lifestyle Intervention or Metformin", The New England Journal of Medicine, vol. 346, No. 6, Feb. 7, 2002, pp. 393-403. |
| Garber, "Postprandial Dysmetabolism and the Heart", Heart Failure Clinics, vol. 8, No. 4, Oct. 2012, pp. 563-573. |
| Giorgino, "Computing and Visualizing Dynamic Time Warping Alignments in R: The dtw Package", Journal of Statistical Software, vol. 31, No. 7, Aug. 2009, 24 pgs. |
| Halkidi et al., "On Clustering Validation Techniques", Journal of Intelligent Information Systems, vol. 17, No. 2/3, 2001, pp. 107-145. |
| Herman et al., "The Cost-Effectiveness of Lifestyle Modification or Metformin in Preventing Type 2 Diabetes in Adults with Impaired Glucose Tolerance", Annals Internal Medicine, vol. 142, No. 5, Mar. 1, 2005, pp. 323-332. |
| Holst et al., "Loss of Incretin Effect Is a Specific, Important, and Early Characteristic of Type 2 Diabetes", Diabetes Care, vol. 34, No. 2, May 2011, pp. S251-S257. |
| Hovorka et al., "ISEC: a program to calculate insulin secretion", Computer Methods and Programs in Biomedicine, vol. 50, No. 3, Aug. 1996, pp. 253-264. |
| Jung, "Clinical Implications of Glucose Variability: Chronic Complications of Diabetes", Endocrinology and Metabolism, vol. 30, No. 2, Jun. 30, 2015, pp. 167-174. |
| Li et al., "The long-term effect of lifestyle interventions to prevent diabetes in the China Da Qing Diabetes Prevention Study: a 20-year follow-up study", The Lancet, vol. 371, No. 9626, May 24, 2008, pp. 1783-1789. |
| Luxburg, "A tutorial on spectral clustering", Statistics and Computing, vol. 17, No. 4, Dec. 2007, pp. 395-416. |
| Meyer et al., "proxy: Distance and Similarity Measures", Package ‘proxy’, Version 0.4-20, Retrieved from: https://mran.microsoft.com/snapshot/2017-12-21/web/packages/proxy/proxy.pdf, Dec. 12, 2017, 10 pgs. |
| Monnier et al., "Activation of oxidative stress by acute glucose fluctuations compared with sustained chronic hyperglycemia in patients with type 2 diabetes", JAMA Network, vol. 295, No. 14, Apr. 12, 2006, pp. 1681-1687. |
| Monnier et al., "The Effect of Glucose Variability on the Risk of Microvascular Complications in Type 1 Diabetes", Diabetes Care, vol. 30, No. 1, Jan. 2007, pp. 187-188. |
| Nathan et al., "Impaired Fasting Glucose and Impaired Glucose Tolerance", Diabetes Care, vol. 30, No. 3, Mar. 2007, pp. 753-759. |
| Suh et al., "Glycemic Variability: How Do We Measure It and Why Is It Important?", Diabetes & Metabolism Journal, vol. 39, No. 4, Aug. 2015, pp. 273-282. |
| Tabak et al., "Prediabetes: A High-Risk State for Diabetes Development", The Lancet, vol. 379, No. 9833, Jun. 16, 2012, pp. 2279-2290. |
| Tuomilehto et al., "Prevention of Type 2 Diabetes Mellitus by Changes in Lifestyle among Subjects with Impaired Glucose Tolerance", The New England Journal of Medicine, vol. 344, No. 18, May 3, 2001, pp. 1343-1350. |
| Tuzcu et al., "Dynamic Time Warping As a Novel Tool in Pattern Recognition of ECG Changes in Heart Rhythm Disturbances", Proceedings of the IEEE International Conference on Systems, Man and Cybernetics, Waikoloa, Hawaii, Oct. 10-12, 2005, 5 pgs. |
| Van Cauter et al., "Estimation of Insulin Secretion Rates from C-Peptide Levels: Comparison of Individual and Standard Kinetic Parameters for C-Peptide Clearance", Diabetes, vol. 41, No. 3, Mar. 1992, pp. 368-377. |
| Wang et al., "Similarity network fusion for aggregating data types on a genomic scale", Nature Methods, vol. 11, No. 3, Mar. 2014, Online Publication: Jan. 26, 2014, pp. 333-337. |
| Wojcicki, ""J"-Index. A New Proposition of the Assessment of Current Glucose Control in Diabetic Patients", Hormone and Metabolic Research, vol. 27, No. 1, 1995, pp. 41-42. |
| Zeevi et al., "Personalized Nutrition by Prediction of Glycemic Responses", Cell, vol. 163, No. 5, Nov. 19, 2015, pp. 1079-1094. |
| Zhao et al., "GMD: Generalized Minimum Distance of distributions", Package ‘GMD’, Version 0.3.3, Retrieved from: https://mran.microsoft.com/snapshot/2016-10-12/web/packages/GMD/GMD.pdf, Feb. 19, 2015, 35 pgs. |
Also Published As
| Publication number | Publication date |
|---|---|
| US20190369108A1 (en) | 2019-12-05 |
Similar Documents
| Publication | Publication Date | Title |
|---|---|---|
| US11385237B2 (en) | Methods for evaluating glycemic regulation and applications thereof | |
| Hall et al. | Glucotypes reveal new patterns of glucose dysregulation | |
| van Duinkerken et al. | Diabetes mellitus in the young and the old: Effects on cognitive functioning across the life span | |
| Gangwisch et al. | Sleep duration as a risk factor for diabetes incidence in a large US sample | |
| Mayeda et al. | Glucose time in range and peripheral neuropathy in type 2 diabetes mellitus and chronic kidney disease | |
| Litonjua et al. | Association of body mass index with the development of methacholine airway hyperresponsiveness in men: the Normative Aging Study | |
| Terada et al. | Targeting specific interstitial glycemic parameters with high-intensity interval exercise and fasted-state exercise in type 2 diabetes | |
| US7395158B2 (en) | Method of screening for disorders of glucose metabolism | |
| Agarwal et al. | Blood pressure recordings within and outside the clinic and cardiovascular events in chronic kidney disease | |
| Peltier et al. | Autonomic dysfunction in obstructive sleep apnea is associated with impaired glucose regulation | |
| Kulawiec et al. | Continuous glucose monitoring to measure metabolic impact and recovery in sub-elite endurance athletes | |
| Xu et al. | Macronutrient intake and glycemic control in a population-based sample of American Indians with diabetes: the Strong Heart Study | |
| Pak et al. | Lower plasma choline levels are associated with sleepiness symptoms | |
| Gold et al. | A structural equation model for predictors of severe hypoglycaemia in patients with insulin‐dependent diabetes mellitus | |
| Bermingham et al. | Glycaemic variability, assessed with continuous glucose monitors, is associated with diet, lifestyle and health in people without diabetes | |
| Nickel et al. | The relationship between heart rate variability and glucose clearance in healthy men and women | |
| US20220406400A1 (en) | Systems and Methods to Identify Metabolic Subphenotypes and Uses Thereof | |
| Yang et al. | Adiposity and smoking mediate the relationship between depression history and inflammation among young adults | |
| Scoubeau et al. | Health-related fitness benefits following concurrent high-intensity interval training and resistance training in patients with type-1 diabetes or type-2 diabetes | |
| Çetiner et al. | Disordered eating behaviors and associated factors in children and adolescents with type 1 diabetes | |
| Hsu | A Comparison of Three Glucose Measurement Results During COVID-19 Period Using GH-Method: Math-Physical Medicine No. 303 | |
| WO2022251884A1 (en) | Systems and methods for assessment of glucose metabolic health | |
| DuBose et al. | The relationship between leisure-time physical activity and the metabolic syndrome: an examination of NHANES III, 1988-1994 | |
| Comite et al. | Abbott FreeStyle libre versus Dexcom G6: detecting disorders of carbohydrate metabolism in a youthful non-diabetic cohort pilot study | |
| Xue et al. | Trends in cardiovascular health metrics and associations with long-term mortality among US adults with coronary heart disease |
Legal Events
| Date | Code | Title | Description |
|---|---|---|---|
| FEPP | Fee payment procedure |
Free format text: ENTITY STATUS SET TO UNDISCOUNTED (ORIGINAL EVENT CODE: BIG.); ENTITY STATUS OF PATENT OWNER: SMALL ENTITY |
|
| FEPP | Fee payment procedure |
Free format text: ENTITY STATUS SET TO SMALL (ORIGINAL EVENT CODE: SMAL); ENTITY STATUS OF PATENT OWNER: SMALL ENTITY |
|
| STPP | Information on status: patent application and granting procedure in general |
Free format text: APPLICATION DISPATCHED FROM PREEXAM, NOT YET DOCKETED |
|
| STPP | Information on status: patent application and granting procedure in general |
Free format text: DOCKETED NEW CASE - READY FOR EXAMINATION |
|
| AS | Assignment |
Owner name: THE BOARD OF TRUSTEES OF THE LELAND STANFORD JUNIOR UNIVERSITY, CALIFORNIA Free format text: ASSIGNMENT OF ASSIGNORS INTEREST;ASSIGNORS:BRESCHI, ALESSANDRA;SNYDER, MICHAEL P.;PERELMAN, DALIA;AND OTHERS;SIGNING DATES FROM 20200722 TO 20201103;REEL/FRAME:056089/0841 |
|
| STPP | Information on status: patent application and granting procedure in general |
Free format text: NOTICE OF ALLOWANCE MAILED -- APPLICATION RECEIVED IN OFFICE OF PUBLICATIONS |
|
| STCF | Information on status: patent grant |
Free format text: PATENTED CASE |
|
| MAFP | Maintenance fee payment |
Free format text: PAYMENT OF MAINTENANCE FEE, 4TH YR, SMALL ENTITY (ORIGINAL EVENT CODE: M2551); ENTITY STATUS OF PATENT OWNER: SMALL ENTITY Year of fee payment: 4 |