US11378581B2 - Monoisotopic mass determination of macromolecules via mass spectrometry - Google Patents
Monoisotopic mass determination of macromolecules via mass spectrometry Download PDFInfo
- Publication number
- US11378581B2 US11378581B2 US16/343,038 US201716343038A US11378581B2 US 11378581 B2 US11378581 B2 US 11378581B2 US 201716343038 A US201716343038 A US 201716343038A US 11378581 B2 US11378581 B2 US 11378581B2
- Authority
- US
- United States
- Prior art keywords
- mass
- mostab
- abundant
- exp
- macromolecule
- Prior art date
- Legal status (The legal status is an assumption and is not a legal conclusion. Google has not performed a legal analysis and makes no representation as to the accuracy of the status listed.)
- Active, expires
Links
Images


Classifications
-
- G—PHYSICS
- G01—MEASURING; TESTING
- G01N—INVESTIGATING OR ANALYSING MATERIALS BY DETERMINING THEIR CHEMICAL OR PHYSICAL PROPERTIES
- G01N33/00—Investigating or analysing materials by specific methods not covered by groups G01N1/00 - G01N31/00
- G01N33/48—Biological material, e.g. blood, urine; Haemocytometers
- G01N33/50—Chemical analysis of biological material, e.g. blood, urine; Testing involving biospecific ligand binding methods; Immunological testing
- G01N33/68—Chemical analysis of biological material, e.g. blood, urine; Testing involving biospecific ligand binding methods; Immunological testing involving proteins, peptides or amino acids
- G01N33/6803—General methods of protein analysis not limited to specific proteins or families of proteins
- G01N33/6848—Methods of protein analysis involving mass spectrometry
-
- G—PHYSICS
- G16—INFORMATION AND COMMUNICATION TECHNOLOGY [ICT] SPECIALLY ADAPTED FOR SPECIFIC APPLICATION FIELDS
- G16Z—INFORMATION AND COMMUNICATION TECHNOLOGY [ICT] SPECIALLY ADAPTED FOR SPECIFIC APPLICATION FIELDS, NOT OTHERWISE PROVIDED FOR
- G16Z99/00—Subject matter not provided for in other main groups of this subclass
-
- H—ELECTRICITY
- H01—ELECTRIC ELEMENTS
- H01J—ELECTRIC DISCHARGE TUBES OR DISCHARGE LAMPS
- H01J49/00—Particle spectrometers or separator tubes
- H01J49/0027—Methods for using particle spectrometers
- H01J49/0036—Step by step routines describing the handling of the data generated during a measurement
-
- G—PHYSICS
- G01—MEASURING; TESTING
- G01N—INVESTIGATING OR ANALYSING MATERIALS BY DETERMINING THEIR CHEMICAL OR PHYSICAL PROPERTIES
- G01N2560/00—Chemical aspects of mass spectrometric analysis of biological material
Definitions
- the present invention relates to the field of mass spectrometry, in particular to the field of the determination of the mass of a macromolecule, such as a protein particularly in top-down proteomics, and the analysis of isotope distributions.
- the elements occurring in most biomolecules including the twenty proteinogenic amino acids, i.e. carbon, hydrogen, oxygen, nitrogen, and sulfur, all possess stable isotopes, the most abundant of which is referred to as the monoisotopic variant.
- the relative amounts of these isotopes are known and relatively constant for terrestrial matter.
- sulfur which is composed of approximately 94.9% 32 S and 5.1% heavier isotopes, the other four elements are composed for at least 98.9% of their lightest variant.
- MS mass spectrometry
- the monoisotopic variant i.e. the variant in which all elements occur in their monoisotopic form
- monoisotopic masses are a constant of nature, unambiguous and invariant, and therefore an optimal choice for analyte identification and other data processing, e.g. database searching.
- direct measurement of the monoisotopic mass of macromolecules, such as proteins is in many instances not feasible in practice.
- FIG. 1 illustrates the difference between monoisotopic mass, average mass, and the mass of the most abundant isotope variant (herein also referred to as the “most abundant mass”) of equine apo-myoglobin.
- these three values may be significantly different (up to more than 10 Da). Accordingly, it is not clear, for the purpose of database searching, what is understood to be a protein's mass. In theory, the three aforementioned masses are exactly defined and equally sound, but in practice they have different operational characteristics and behave differently in the presence of noise and uncertainty. With the absence of the monoisotopic variant (i.e.
- Chen et al. discloses a method for determining the monoisotopic mass of a protein based on a linear relationship with the most abundant mass, which is a physicochemical property measured with high-resolution mass spectrometry. This method usually produces a number of possible monoisotopic masses, each of a corresponding probability predicted by statistical methods. According to Chen, the mono isotopic mass of a protein is determined from the peak in the mass spectrum which corresponds to the most abundant mass M ma , i.e. the most intense signal in an ion cluster.
- M ma The most abundant mass M ma is identified in the spectrum as such and pre-supposes the use of high end instrumentation with optimal spectral accuracy, which is unaccustomed in the field and much more the exception than the rule. Additionally, as a spectrum is the result of sampling from a larger sample, the accuracy of the mass spectrum and thus the accuracy with which M ma can be determined from the spectrum will depend on the size of the sample. The accuracy with which M ma can be determined from the spectrum will generally be acceptable with molecules with a smaller mass, such as those (insulin, ribonuclease A and other proteins smaller than 60 kDa) on which the method developed by Chen is based.
- the mass spectrum of macromolecules with a molecular mass substantially above 60 kDa, such as human proteins, will generally contain a large number of correlated peaks with limited intensity variation and reliable determination of M ma from the spectrum will usually not be possible.
- the inventors have developed an accurate and robust approach to determine the mass of intact macromolecules with larger masses, in particular biomacromolecules, such as proteins, which alleviate at least some of the problems of the prior art.
- the inventors have developed a method for the determination of the monoisotopic mass based on the experimentally determined most abundant mass.
- the methods of the present invention are based on a simple, double-linear model for predicting the monoisotopic mass based on the experimentally determined most abundant mass, with accuracy in the low parts-per-million (ppm) range.
- the application of this double-linear model based approach allows for a highly accurate determination of the monoisotopic mass using the most abundant mass, based on the effective relation between monoisotopic and most abundant mass.
- the methods of the present invention combine the benefits of the most abundant mass (which is robust and easy to detect) with those of the monoisotopic mass (optimal for data processing and molecule identification).
- the accurate determination of the mass of the biomacromolecule can be used in the identification of the biomacromolecule.
- the methods envisaged herein are particularly useful in top-down proteomics.
- the present invention provides a method for determining the monoisotopic mass M Mono M mono of a macromolecule from a mass M mono spectrometry spectrum of said macromolecule, the spectrum comprising a set or plurality of isotopic peaks representing an isotope distribution of said macromolecule, comprising the steps of:
- the method of this invention makes use of the linear relationship observed between a set of known most abundant masses and a set of monoisotopic masses for a plurality of known macromolecules from a macromolecular database, to determine the monoisotopic mass of an unknown macromolecule.
- the macromolecule is a protein.
- ⁇ int is an integer selected from the list consisting of ⁇ 2, ⁇ 1, 0, 1, and 2, preferably wherein ⁇ int is selected from the list consisting of ⁇ 1, 0, and 1.
- selecting ⁇ int comprises the steps: modelling or quantifying the probability of ⁇ int being ⁇ 1, 0, or 1 as a function of the most abundant mass M MostAb ; and selecting ⁇ 1, 0, or 1 as the value of ⁇ int when the probability or quantity that ⁇ int equals ⁇ 1, 0, or 1, respectively, is the highest.
- ⁇ ranges between 0.99 and 1.
- step (a) comprises the steps of:
- the correct M MostAb (exp, cor) is selected as the mass corresponding to the mass of the peak positioned one or two peaks before or after the M MostAb (exp) isotopic peak so that 0.1 ⁇ [M Average (exp) ⁇ M MostAb (exp, cor) ⁇ ] ⁇ 1.1, wherein M MostAb (exp,cor) is selected as the correct M MostAb , corresponding to the theoretical most abundant mass.
- This step permits verifying whether M MostAb that has been identified from the mass spectrum, effectively corresponds to the theoretical M MostAb for a certain macromolecule.
- the method of this invention is therefore not only suitable for identifying M MostAb for small molecules with a mass up to 60 kDa, but also for macromolecules with substantially larger masses.
- step (a) the most abundant mass M MostAb is approximated by the most abundant mass of a scaled averagine model, the scaled averagine model having an average mass equal to the average mass of the isotopic mass spectrum of the macromolecule, in particular a protein or polypeptide.
- the method is a computer-implemented method.
- the method further comprises the step (c) of identification of the macromolecule using M Mono of step (b).
- the present invention further provides a computer program product comprising computer-readable instructions which, when executed on a computer, cause the computer to execute a method according to the present invention as detailed herein.
- FIG. 1 represents a simulated isotope distribution of equine apo-myoglobin (Uniprot entry P68082; chemical formula C 769 H 1212 N 210 O 218 S 2 , average mass 16951.26 Da), at a resolution of 30000 (FWHM). Differences between the monoisotopic, most abundant, and average masses are expressed both in absolute values, as well as fractions of the most abundant mass (expressed in ppm).
- FIG. 2A shows the approximately linear correlation observed between the monoisotopic mass M Mono and most abundant mass M MostAb of human proteins in the UniProt database.
- FIG. 2B represent a histogram of values of the residues ⁇ , showing the residues are nearly always found between ⁇ 2 and +2.
- FIG. 2C presents a plot of ⁇ versus M MostAb , revealing a structure in the deviation from this simple linear model, with the fractional part of ⁇ ( ⁇ frac ) shown in FIG. 2D .
- FIG. 2E shows the percentage of samples having residuals near 0, ⁇ 1 or +1 in function of M MostAb , indicating the periodicity in the nearest integer value to ⁇ , allowing prediction of the integer part of ⁇ ( ⁇ int ).
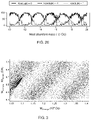
- FIG. 3 shows a plot of the values of (M Average ⁇ M MostAb ) vs. M Average for human proteins in the UniProt database, showing this difference almost always has a value between 0 and 1, and revealing periodicity as a function of M MostAb .
- FIG. 4 represents histograms summarizing the results from 200 spectra of equine apo-myoglobin.
- A Observed values of the most intense isotope peak;
- B observed values of (M Average ⁇ M MostAb );
- C corrected values of the most intense isotope peak;
- D the deviation of the calculated average mass (obtained from the spectra) from the theoretical average mass, expressed in ppm;
- E deviation of the calculated monoisotopic mass (determined using the methods of the present invention) from the theoretica monoisotopic value for the 200 spectra, expressed in ppm.
- FIG. 5 schematically represents a particular embodiment of the method of the present invention.
- the terms “one or more” or “at least one”, such as one or more or at least one member(s) of a group of members, is clear per se, by means of further exemplification, the term encompasses inter alia a reference to any one of said members, or to any two or more of said members, such as, e.g., any ⁇ 3, ⁇ 4, ⁇ 5, ⁇ 6 or ⁇ 7 etc. of said members, and up to all said members.
- M mono means the sum of the masses of the atoms in a molecule using the mass of the principal (most abundant) isotope for each element instead of the isotopic average mass.
- the monoisotopic mass results in the lightest isotope being selected.
- Monoisotopic mass is typically expressed in Daltons (Da) or unified atomic mass units (u).
- average mass corresponds to the sum of the masses of the atoms in a molecule using the isotopic average mass for each element.
- the “experimentally determined average mass” or “experimental average mass” refers to the average mass calculated as a weighted sum of the observed masses and intensities of the isotopic peaks from the mass spectrum of a molecule.
- M MostAb corresponds to the mass of the isotope variant with the highest probability of occurrence.
- this mass may be calculated via software packages that simulate the isotopic distribution of macromolecules (proteins) for mass spectrometry.
- the most abundant mass is the mass of the most abundant isotope variant, i.e. the isotopic peak with the highest intensity of the set of isotopic peaks within a mass spectrum of a molecule.
- the inventors have developed a simple double-linear model which predicts or which permits to identify the monoisotopic mass M Mono M mono of a macromolecule based on the most abundant mass M MostAb from a series of isotopic peaks within a MS spectrum, with an accuracy in the low ppm range, or stated differently, with an accuracy of the same order of magnitude as the accuracy of current high-performance mass spectrometers. Determining the monoisotopic mass M Mono M mono of a macromolecule with high accuracy is primordial to permit a reliable identification of the macromolecule.
- the present invention provides a method for determining the monoisotopic mass M Mono M mono of a macromolecule from a mass M mono spectrometry spectrum of said macromolecule, the spectrum comprising a set or plurality of isotopic peaks representing an isotope distribution of said macromolecule, comprising the steps of:
- the method as envisaged herein is a computer-implemented method.
- the present invention thus relates to improved methods for the analysis or interpretation of spectra obtained by mass spectrometry, in particular of spectra of macromolecules comprising a plurality of isotopic peaks, i.e. a series of regularly spaced peaks representing the isotopic distribution of the macromolecule.
- the invention as envisaged herein is particularly suitable for the determination of M Mono for macromolecules, i.e. molecules of high molecular mass having a structure which essentially comprises of the multiple repetition of units derived from molecules (or subunits) of low molecular mass.
- said macromolecule is a biomacromolecule.
- said biomacromolecule is a protein or polypeptide (made up of amino acids), a polynucleotide (DNA or RNA) (made up of nucleic acids) or a polysaccharide (made up of monosaccharides).
- the term “poly” as in polypeptide, polynucleotide or polysaccharide corresponds to at least 10 subunits.
- a polypeptide, polynucleotide or polysaccharide comprises at least 10 amino acid residues, at least 10 nucleic acid residues, or at least 10 monosaccharides, respectively.
- the present invention is particularly suited for the determination of M Mono of a protein and the subsequent identification and/or quantification of proteins, such as in top-down proteomics.
- macromolecule within the scope of this invention generally refers to molecules, in particular biomolecules, for example proteins but not limited thereto, with a mass substantially above 60 kDa, for example at least 10 5 Da, at least at least 10 6 Da, at least 10 8 Da, or at least 10 9 Da.
- the method of this invention is particularly suitable for the identification of macromolecules with high molecular mass, it is also suitable for the identification of macromolecules with smaller molecular masses, for example a molecular mass of at least 10 3 Da, preferably at least 10 4 Da, more preferably at least 10 5 Da.
- the methods as envisaged herein are not limited to particular mass spectrometers, and does as such not presuppose the use of high end, high resolution mass spectrometers.
- the invention is particularly suitable for analysing a mass spectrum obtained on high-performance mass spectrometers such as Fourier Transform Ion Cyclotron Resonance (FTICR) or Orbitrap instruments, having accuracies in the order of only a few ppm.
- FTICR Fourier Transform Ion Cyclotron Resonance
- Orbitrap instruments having accuracies in the order of only a few ppm.
- the present invention allows determination of M Mono within a few ppm, in line with the accuracy and precision of these high performance instruments.
- the model or a mathematical equivalent thereof according to the equation 1 used in step (b) is obtainable by fitting the slope of the plot of monoisotopic mass M Mono in function of the most abundant mass M MostAb for a plurality of macromolecules, such as macromolecules from a macromolecule database.
- M Mono and M MostAb are derived for a plurality of macromolecules, such as from a macromolecule database, e.g. a protein database.
- M Mono of each macromolecule in the database corresponds to the sum of the masses of the atoms in the macromolecule using the mass of the principal (most abundant) isotope for each element instead of the isotopic average mass.
- M MostAb is typically derived from a simulated isotope distribution using suitable algorithms or software, such as e.g.
- the residuals ⁇ are plotted in function of M MostAb , showing that the different values are found on a set of parallel trend lines. This means that a given particular value of the most abundant mass M MostAb corresponds to several values for the residual ⁇ , intersecting with multiple different trend lines. Each intersect or value for the residual ⁇ indicates a possible solution for the monoisotopic mass for that particular value of the most abundant mass M MostAb The possible solutions differ from each other with an integer mass difference.
- the residuals have a direct relation with the most abundant mass, apart from the integer mass difference ( ⁇ i) between the monoisotopic and most abundant peak.
- ⁇ frac is always positive.
- only a single value for ⁇ frac corresponds to a given particular M MostAb , as can be seen when ⁇ frac is plotted as a function of M MostAb , neglecting the integer part ( ⁇ int ).
- the result is a sawtooth pattern which can be easily modelled, resulting in a specific linear relation for a given M MostAb .range.
- the modelled saw tooth pattern such as e.g. shown in FIG. 2D , allows, for a given value of M MostAb , to calculate three potential values for M Mono , spaced 1 Da apart, one of which is very likely to match the theoretical value to within a few ppm.
- a final refinement of the model allows to model the probability of the variants of monoisotopic masses with different values of ⁇ int . This may be performed by plotting the probability to the nearest integer value to the residuals as a function of M MostAb , allowing to arrive at a single predicted M MostAb value.
- the parameter ⁇ in the linear model represented by Equation 1 is about 1, in particular ⁇ ranges between 0.9 and 1, more in particular ⁇ ranges between 0.99 and 1; even more in particular ⁇ ranges between 0.999 and 1.
- the slope of each linear part of the sawtooth model ranges between 6.2 ⁇ 10 ⁇ 4 and 6.3 ⁇ 10 ⁇ 4 , preferably ranges between 6.24 ⁇ 10 ⁇ 4 and 6.27 ⁇ 10 ⁇ 4 .
- the period of the sawtooth function ranges between 1550 and 1650 Dalton, more particularly ranges between 1575 and 1625 Dalton.
- ⁇ int is an integer selected from the list consisting of ⁇ 2, ⁇ 1, 0, 1, and 2, preferably wherein ⁇ int is selected from the list consisting of ⁇ 1, 0, and 1.
- selecting ⁇ int comprises the steps of (i) modelling the probability of ⁇ int being ⁇ 1, 0, or 1 as a function of the most abundant mass M MostAb ; and selecting ⁇ 1, 0, or 1 as the value of ⁇ int when the probability that ⁇ int respectively equals ⁇ 1, 0, or 1 is the highest.
- the amount of error ( ⁇ 1, 0 or +1) can be quantified after predicting the monoisotopic mass and presented in table format.
- the model is developed only once for a certain class of biomolecules, organisms (plants, animals), organisms (mammals) and/or species (homo sp.), and the model parameters are subsequently stored in a computer memory for further use.
- the determination of a monoisotopic mass for a particular most abundant mass, derived from a series of isotopic peaks within a MS spectrum has a low computational cost as only two linear models need to be evaluated, with the first linear model corresponding to equation 1, and the second linear model corresponding to the sawtooth function, wherein the relevant part of the sawtooth function is determined by the observed or calculated most abundant mass M MostAb .
- the methods of the present invention further include the initial steps of obtaining a mass spectrum of a biomacromolecule, such as a protein or polypeptide, and determining the experimentally most abundant mass after isotopic peak picking and charge deconvolution, as well understood to the skilled person.
- a biomacromolecule such as a protein or polypeptide
- step (a) comprises selecting the mass corresponding to the peak with the highest intensity as M MostAb .
- M MostAb certain factors, noise etc, can cause a minor distortion of the relative intensities of isotope peaks, so that the experimentally observed M MostAb does not correspond to the theoretically derived M MostAb based on the simulation of the isotope distribution for a macromolecule.
- certain steps may be taken to select the correct M MostAb in step (a).
- step (a) comprises the steps of:
- M MostAb (exp) is selected as the correct M MostAb , corresponding to the theoretical most abundant mass.
- the correct M MostAb (exp, cor) is selected as the mass corresponding to the mass of the peak positioned one or two peaks before or after the M MostAb (exp) isotopic peak so that 0.1 ⁇ [M Average (exp) ⁇ M MostAb (exp, cor) ⁇ ] ⁇ 1.1, wherein M MostAb (exp,cor) is selected as the correct M MostAb , corresponding to the theoretical most abundant mass.
- step (a) comprises the step of approximating the most abundant mass M MostAb as the most abundant mass of a scaled averagine model, as described in Senko et al. (J Am Soc Mass Spectrom (1995) 6: 229-233), which is herein incorporated by reference, wherein the scaled averagine model has an average mass equal to the average mass of the isotopic MS spectrum of the protein.
- step (a) comprises increasing the number of charges.
- the accurate determination of M Mono contributes to a more accurate identification of the macromolecule, particularly the more accurate identification of a protein, such as in top-down proteomics.
- step (c) identification of the macromolecule using M Mono of step (b).
- step (c) includes searching a database of biomacromolecules, such as a protein database, using the M Mono and selecting the one or more biomacromolecules with matching monoisotopic mass.
- a particularly preferred embodiment of the method of the present invention is schematically represented as a work flow to derive the monoisotopic mass from a given mass spectrum of an unknown biomacromolecule, such as a protein.
- Isotopic peak picking and charge deconvolution allows to derive the (experimental) most abundant mass from the mass spectrum of the unknown biomacromolecule.
- This value is introduced in both the first linear model, represented by equation 1, as in the sawtooth function, and for assessing the probabilities of ⁇ int being ⁇ 1, 0, or 1.
- the combination of these mathematical operations results in the (theoretical) monoisotopic mass for the unknown spectrum.
- this monoisotopic value can then be cross referenced with a relevant database for identifying the unknown biomacromolecule.
- Another aspect of the present invention provides a computer program product comprising computer-readable instructions which, when executed on a computer, cause the computer to execute a method as envisaged herein.
- the model (and algorithm) described herein was developed using 98616 human proteins (78328 after removing redundant sequences) with a mass between 8-60 kDa in the UniProt database. Although this model and the below cited model parameters may be valid for mammalian proteins as well, the skilled person understands that a similar workflow can easily be followed to generate a model for different classes of proteins, or biomacromolecules in general, if necessary.
- the BRAIN algorithm (Claesen et al.; J Am Soc Mass Spectrom (2012) 23: 753-763; Dittwald P et al.; Anal Chem (2013), 85(4):1991-1994; both incorporated herein by reference) was used to model the isotope distribution of each protein, and to obtain the most abundant mass for each sequence.
- the monoisotopic and average mass for each sequence was obtained based on the mass of the principal (most abundant) isotope for each element and the isotopic average mass, respectively.
- the residuals ⁇ were plotted in function of M MostAb , as shown in FIG. 2C .
- the plot shows that the different values are found on a set of trend lines. When representing a given particular most abundant mass M MostAb by a vertical line, this line will intersect a few of these trend lines. Each intersect indicates a possible solution for the monoisotopic mass given the most abundant mass. Interestingly, the possible solutions exhibit an unexpected relation between each other as they differ with an integer mass difference. Thus, the residuals have a direct relation with the most abundant mass, apart from the integer mass difference (Ai).
- the residuals ⁇ therefore contain structure and relevant information and are not randomly scattered on the [ ⁇ 2; +2] Da range, but appear in distinct groupings.
- the two or three possible values of M Mono (corresponding to as many possible values of ⁇ ) predicted for each value of M MostAb are thus due to different integer values for ⁇ i.
- round( ⁇ ) denotes the round function.
- FIG. 2D This is represented in FIG. 2D , where ⁇ frac is plotted as a function of M MostAb , neglecting the integer part ( ⁇ int ).
- the result is a sawtooth pattern which can be easily modelled.
- the vast majority of ⁇ int values are at 0 or ⁇ 1 Da, with only 3.8% at ⁇ 2 Da, and the values ⁇ 3 or ⁇ 4 Da together occurring in less than 0.05% of cases.
- the model shown in FIG. 2D allows, for a given value of M MostAb , to calculate three potential values for M Mono , spaced 1 Da apart, one of which is very likely to match the theoretical value to within a few ppm.
- FIG. 2E A final refinement of this model allows to choose between these three values and is shown in FIG. 2E , where the probability to the nearest integer value to the residuals is plotted as a function of M MostAb , allowing to arrive at a single predicted M Mono value for a given M MostAb .
- Example 1 The workflow outlined in Example 1 applies to theoretical experimental data, which can be considered as ‘perfect’ experimental data.
- data imperfections must be taken into account. For instance, at the typical precursor ion populations observed in top-down proteomics, it can be shown that the probability of the experimentally observed most abundant isotope peak not matching the theoretically predicted one, is sufficiently high that it should not be neglected. This probability is further increased by the introduction of a small amount of noise, which can also cause a minor distortion of the relative intensities of isotope peaks.
- MS1 spectra of the same compound can be collected. These spectra can be used to pinpoint the most abundant mass as further described in Example 3.
- the most abundant peak can be selected from an averagine model [Senko et al; J Am Soc Mass Spectrom (1995) 6, 229-233, incorporated herein by reference]. This method implies that the theoretically most abundant peak is chosen from a scaled averagine molecule with the same average mass as that observed in the spectrum. This method is described in the next paragraph.
- M Average Due to natural or technical factors M Average can be shifted substantially, considerably more than expected from the specifications of high-end instruments. However, the (stochastic) effects that poor ion statistics and/or noise have on this value are typically far smaller than the error of 1 (or several) Da introduced by inadvertent selection of the wrong isotope peak as most abundant mass.
- FIG. 3 shows a plot of the values of (M Average ⁇ M MostAb ) vs. M Average for human proteins in the UniProt database, showing this difference almost always has a value between 0 and 1, and revealing periodicity as a function of M MostAb .
- the simple averagine model correlates the most abundant mass to the average mass (M Average ) and can again be modelled by a sawtooth pattern. If we compare the observed pattern to that generated by the averagine model, we see that the values for (M Average ⁇ M MostAb ) rarely deviate from the model by more than about 0.2 Da.
- Spectra of equine apo-myoglobin (20 ⁇ g/mL in 49/50/1 H2O/acetonitrile/formic acid) were acquired on a Thermo LTQ Orbitrap Velos, operated at a resolution of 100,000 at 400 m/z and 1,000,000 charges were accumulated in the LTQ for analysis in the Orbitrap. Ionization here was typically performed through nano-ESI using a TriVersa NanoMate (Advion BioSciences, Ithaca, N.Y., USA).
- Calibration was performed using a standard calibration mix containing n-butylamine, caffeine, MRFA, and Ultramark 1621 (Pierce LTQ Velos ESI Positive Calibration Solution, Thermo catalog number 88323).
- lyophilized myoglobin was dissolved in the appropriate buffer and used without further purification.
- the lyophilized protein was typically dissolved at a concentration of 1 mg/mL in 100 mM aqueous ammonium acetate and desalted at least twice using Micro Bio-Spin P-6 gel columns (Bio-Rad, Hercules, Calif., USA).
- the theoretically most abundant mass occurs as the experimentally most intense peak in a majority of the spectra, the experimentally most abundant peak is located 1 or 2 Da away from the theoretical value in nearly 50% of these spectra, even using a fairly high Automatic Gain Control (AGC) target of 10 6 charges.
- AGC Automatic Gain Control
- Example 2 We can correct for this using the procedure outlined in Example 2.
- the measured average mass while showing a systematic deviation of nearly 10 ppm from the calculated value, is relatively constant between scans, and only fluctuates in a range approximately 20 ppm (0.36 Da) wide. In contrast, due to poor ion statistics, this range is 240 ppm (4 Da) wide for the observed most abundant mass.
- FIG. 4B A histogram of the observed values of (M Average ⁇ M MostAb ), as shown in FIG. 4B , shows clear clusters, corresponding to the clusters observed in FIG. 4A .
- FIG. 4C The result of this correction is shown in FIG. 4C , where essentially the same value for M MostAb is generated from all 200 spectra.
- FIGS. 4D and 4E show the deviation of the calculated average mass (as a weighted sum of the observed masses and intensities of the isotope peaks) and monoisotopic mass (predicted using the methods of the present invention) from the theoretical values for the 200 spectra. As mentioned, this ranges between +1.11 and ⁇ 20.37 ppm (interval width 21.48 ppm; average ⁇ 9.63 ppm) for the average mass.
- the predicted monoisotopic mass only shows a deviation from the calculated value between ⁇ 1.16 and ⁇ 2.54 ppm (interval width 1.38 ppm; average ⁇ 1.85 ppm). This difference is in accordance with the accuracy and precision expected from the instrument specifications.
- the workflow presented in FIG. 5 is further illustrated below.
- the highest peak in the spectrum, representing the (experimental) most abundant mass has a value of 2119.88 m/z.
- a temporary vector called diffTemp is calculated that contain the differences between the (i+1) th and i th element in de vector temp. Inverse every value in the vector and round these values, which results in ([7.6923, 8.3333, 7.6923, 8.3333, 7.6923, 8.3333]).
- the charge state is determined by majority vote on the obtained result and the most abundant m/z value is charge deconvoluted with the obtained charge z and the mass of a proton equal to 1.007276466879 Da. Doing so, the most abundant mass becomes 16950.982 Da.
- the monoisotopic mass can then be calculated based on the first linear model, as determined in example 1, i.e 16940.9587041111 Da.
- the predicted monoisotopic mass now becomes 16940.96 Da.
Landscapes
- Life Sciences & Earth Sciences (AREA)
- Health & Medical Sciences (AREA)
- Engineering & Computer Science (AREA)
- Molecular Biology (AREA)
- Physics & Mathematics (AREA)
- Chemical & Material Sciences (AREA)
- Biomedical Technology (AREA)
- Hematology (AREA)
- Bioinformatics & Cheminformatics (AREA)
- Urology & Nephrology (AREA)
- Immunology (AREA)
- Bioinformatics & Computational Biology (AREA)
- Analytical Chemistry (AREA)
- Proteomics, Peptides & Aminoacids (AREA)
- Cell Biology (AREA)
- Biotechnology (AREA)
- Biophysics (AREA)
- Microbiology (AREA)
- Spectroscopy & Molecular Physics (AREA)
- Food Science & Technology (AREA)
- Medicinal Chemistry (AREA)
- Biochemistry (AREA)
- General Health & Medical Sciences (AREA)
- General Physics & Mathematics (AREA)
- Pathology (AREA)
- Other Investigation Or Analysis Of Materials By Electrical Means (AREA)
Abstract
Description
-
- (a) deriving the (experimental) most abundant mass MMostAb from the set or plurality of isotopic peaks; and
- (b) calculating the monoisotopic mass MMono from the (experimental) most abundant mass MMostAb, using the following model or a mathematical equivalent thereof MMono=α+βMMostAb+ε;
wherein β is a scalar slope obtainable by fitting the slope of monoisotopic mass versus most abundant mass for a plurality of macromolecules from a macromolecule database; α is the intercept, and ε is a scalar residue of the form ε=εint+εfrac, εint being an integer, and εfrac being a sawtooth function of MMostAb.
(a2): calculation of [MAverage (exp)−MMostAb (exp)] in order to determine if MMostAb (exp) corresponds to the theoretical MMostAb;
(a3). if 0.1≤[MAverage (exp)−MMostAb (exp)]≤1.1, then MostAb (exp) is selected as the correct MMostAb, corresponding to the theoretical most abundant mass.
if not 0.1≤[MAverage (exp)−MMostAb (exp)]≤1.1; then the correct MMostAb (exp, cor) is selected as the mass corresponding to the mass of the peak positioned one or two peaks before or after the MMostAb (exp) isotopic peak so that 0.1≤[MAverage (exp)−{MMostAb (exp, cor)}]≤1.1, wherein MMostAb (exp,cor) is selected as the correct MMostAb, corresponding to the theoretical most abundant mass.
M Mono =α+βM MostAb+ε; (Eq. 1)
wherein β is a scalar slope obtainable by fitting the slope of the plot of monoisotopic mass MMono in function of the most abundant mass MMostAb for a plurality of macromolecules from a macromolecule database; a is the intersect, and ε is a scalar residue of the form ε=εint+εfrac, εint being an integer, and εfrac being a sawtooth function of MMostAb.
frac(ε)=εfrac=ε−round(ε) (Eq. 2)
wherein round(ε) denotes the round function of ε. As such, εfrac is always positive. Moreover, only a single value for εfrac corresponds to a given particular MMostAb, as can be seen when εfrac is plotted as a function of MMostAb, neglecting the integer part (εint). The result is a sawtooth pattern which can be easily modelled, resulting in a specific linear relation for a given MMostAb.range. The vast majority of εint values are at 0 or ±1 Da, with only 3.8% at ±2 Da, and the values ±3 or ±4 Da together occurring in less than 0.05% of cases. As such, for over 96% of all proteins, the modelled saw tooth pattern, such as e.g. shown in
(a2): calculation of [MAverage (exp)−MMostAb (exp)], particularly for each of the multiple spectra and plotting [MAverage (exp)−MMostAb (exp)] of each of the multiple spectra in a histogram, in order to determine if MMostAb (exp) corresponds to the theoretical MMostAb;
(a3). if 0.1≤[MAverage (exp)−MMostAb (exp)]≤1.1, then MMostAb (exp) is selected as the correct MMostAb, corresponding to the theoretical most abundant mass.
if not 0.1≤[MAverage (exp)−MMostAb (exp)]≤1.1; then the correct MMostAb (exp, cor) is selected as the mass corresponding to the mass of the peak positioned one or two peaks before or after the MMostAb (exp) isotopic peak so that 0.1≤[MAverage (exp)−{MMostAb (exp, cor)}]≤1.1, wherein MMostAb (exp,cor) is selected as the correct MMostAb, corresponding to the theoretical most abundant mass.
M Mono =α+β·M MostAb+ε
wherein MMono is the monoisotopic mass, and MMostAb is the most abundant mass.
frac(ε)=εfrac=ε−round(ε)
Claims (12)
M Mono =α+βM MostAb+ε;
Applications Claiming Priority (4)
| Application Number | Priority Date | Filing Date | Title |
|---|---|---|---|
| EP16194868.2 | 2016-10-20 | ||
| EP16194868 | 2016-10-20 | ||
| EP16194868 | 2016-10-20 | ||
| PCT/EP2017/076827 WO2018073404A1 (en) | 2016-10-20 | 2017-10-20 | Monoisotopic mass determination of macromolecules via mass spectrometry |
Publications (2)
| Publication Number | Publication Date |
|---|---|
| US20190250168A1 US20190250168A1 (en) | 2019-08-15 |
| US11378581B2 true US11378581B2 (en) | 2022-07-05 |
Family
ID=57286216
Family Applications (1)
| Application Number | Title | Priority Date | Filing Date |
|---|---|---|---|
| US16/343,038 Active 2038-07-05 US11378581B2 (en) | 2016-10-20 | 2017-10-20 | Monoisotopic mass determination of macromolecules via mass spectrometry |
Country Status (3)
| Country | Link |
|---|---|
| US (1) | US11378581B2 (en) |
| EP (1) | EP3529724B1 (en) |
| WO (1) | WO2018073404A1 (en) |
Families Citing this family (1)
| Publication number | Priority date | Publication date | Assignee | Title |
|---|---|---|---|---|
| EP4399732A1 (en) * | 2021-09-09 | 2024-07-17 | DH Technologies Development Pte. Ltd. | Methods and systems for determining molecular mass |
Citations (13)
| Publication number | Priority date | Publication date | Assignee | Title |
|---|---|---|---|---|
| WO2000013025A1 (en) | 1998-08-31 | 2000-03-09 | University Of Washington | Stable isotope metabolic labeling for analysis of biopolymers |
| WO2003046577A1 (en) | 2001-11-30 | 2003-06-05 | The European Molecular Biology Laboratory | A system and method for automatic protein sequencing by mass spectrometry |
| WO2003054772A1 (en) | 2001-11-05 | 2003-07-03 | Irm, Llc | Methods and devices for proteomics data complexity reduction |
| WO2004011426A2 (en) | 2002-07-30 | 2004-02-05 | The Regents Of The University Of California | Method for automated, large-scale measurement of the molecular flux rates of the proteome or the organeome using mass spectrometry |
| WO2004025270A2 (en) | 2002-09-13 | 2004-03-25 | The Regents Of The University Of California | Methods for measuring rates of reserve cholesterol transport in vivo, as an index of anti-atherogenesis |
| WO2004102180A2 (en) | 2003-05-15 | 2004-11-25 | Electrophoretics Limited | Mass spectrometry |
| EP1600776A2 (en) | 2004-05-25 | 2005-11-30 | Oxford Gene Technology Ip Limited | Peptide mass spectrometry |
| WO2006050226A2 (en) | 2004-10-28 | 2006-05-11 | Cerno Bioscience Llc | Qualitative and quantitative mass spectral analysis |
| WO2006106724A1 (en) | 2005-03-31 | 2006-10-12 | National Institute Of Advanced Industrial Science And Technology | Method of protein analysis, apparatus and program |
| US20070114373A1 (en) | 2005-11-04 | 2007-05-24 | Zweigenbaum Jerry A | Determination of chemical empirical formulas of unknown compounds using accurate ion mass measurement of all isotopes |
| EP2590206A1 (en) | 2011-11-02 | 2013-05-08 | VITO NV (Vlaamse Instelling voor Technologisch Onderzoek NV) | Method and device for computing molecular isotope distributions and for estimating the elemental composition of a molecule from an isotopic distribution |
| WO2014184320A1 (en) | 2013-05-15 | 2014-11-20 | Electrophoretics Limited | Mass labels |
| WO2016145331A1 (en) | 2015-03-12 | 2016-09-15 | Thermo Finnigan Llc | Methods for data-dependent mass spectrometry of mixed biomolecular analytes |
-
2017
- 2017-10-20 WO PCT/EP2017/076827 patent/WO2018073404A1/en not_active Ceased
- 2017-10-20 EP EP17791031.2A patent/EP3529724B1/en active Active
- 2017-10-20 US US16/343,038 patent/US11378581B2/en active Active
Patent Citations (13)
| Publication number | Priority date | Publication date | Assignee | Title |
|---|---|---|---|---|
| WO2000013025A1 (en) | 1998-08-31 | 2000-03-09 | University Of Washington | Stable isotope metabolic labeling for analysis of biopolymers |
| WO2003054772A1 (en) | 2001-11-05 | 2003-07-03 | Irm, Llc | Methods and devices for proteomics data complexity reduction |
| WO2003046577A1 (en) | 2001-11-30 | 2003-06-05 | The European Molecular Biology Laboratory | A system and method for automatic protein sequencing by mass spectrometry |
| WO2004011426A2 (en) | 2002-07-30 | 2004-02-05 | The Regents Of The University Of California | Method for automated, large-scale measurement of the molecular flux rates of the proteome or the organeome using mass spectrometry |
| WO2004025270A2 (en) | 2002-09-13 | 2004-03-25 | The Regents Of The University Of California | Methods for measuring rates of reserve cholesterol transport in vivo, as an index of anti-atherogenesis |
| WO2004102180A2 (en) | 2003-05-15 | 2004-11-25 | Electrophoretics Limited | Mass spectrometry |
| EP1600776A2 (en) | 2004-05-25 | 2005-11-30 | Oxford Gene Technology Ip Limited | Peptide mass spectrometry |
| WO2006050226A2 (en) | 2004-10-28 | 2006-05-11 | Cerno Bioscience Llc | Qualitative and quantitative mass spectral analysis |
| WO2006106724A1 (en) | 2005-03-31 | 2006-10-12 | National Institute Of Advanced Industrial Science And Technology | Method of protein analysis, apparatus and program |
| US20070114373A1 (en) | 2005-11-04 | 2007-05-24 | Zweigenbaum Jerry A | Determination of chemical empirical formulas of unknown compounds using accurate ion mass measurement of all isotopes |
| EP2590206A1 (en) | 2011-11-02 | 2013-05-08 | VITO NV (Vlaamse Instelling voor Technologisch Onderzoek NV) | Method and device for computing molecular isotope distributions and for estimating the elemental composition of a molecule from an isotopic distribution |
| WO2014184320A1 (en) | 2013-05-15 | 2014-11-20 | Electrophoretics Limited | Mass labels |
| WO2016145331A1 (en) | 2015-03-12 | 2016-09-15 | Thermo Finnigan Llc | Methods for data-dependent mass spectrometry of mixed biomolecular analytes |
Non-Patent Citations (6)
| Title |
|---|
| Chen Ya-Fen et al: "Determination of accurate protein monoisotopic mass with the most abundant mass measurable using high-resolution mass spectrometry" Analytical Biochemistry, vol. 440, No. I, Jun. 4, 2013 (Jun. 4, 2013). pp. 108-113, XP028676657, ISSN: 0003-2697, DOI: 10.1016/J.AB.2013.05.018 the whole document abstract; figures 1-3 table 2. |
| CHEN YA-FEN; CHANG C. ALLEN; LIN YU-HSUAN; TSAY YEOU-GUANG: "Determination of accurate protein monoisotopic mass with the most abundant mass measurable using high-resolution mass spectrometry", ANALYTICAL BIOCHEMISTRY, ACADEMIC PRESS, AMSTERDAM, NL, vol. 440, no. 1, 4 June 2013 (2013-06-04), Amsterdam, NL , pages 108 - 113, XP028676657, ISSN: 0003-2697, DOI: 10.1016/j.ab.2013.05.018 |
| Jurgen Claesen et al: "An Efficient Method to Calculate the Aggregated Isotopic Distribution and Exact Center-Masses" Journal of the American Society for Mass Spectrometry, Feb. 1, 2012 (Feb. 1, 2012), XP055021608, ISSN: 1044-0305, DOI: 10.1007/sl3361-0II-0326-2 the whole document. |
| JÜRGEN CLAESEN, PIOTR DITTWALD, TOMASZ BURZYKOWSKI, DIRK VALKENBORG: "An Efficient Method to Calculate the Aggregated Isotopic Distribution and Exact Center-Masses", JOURNAL OF THE AMERICAN SOCIETY FOR MASS SPECTROMETRY, ELSEVIER, 1 February 2012 (2012-02-01), XP055021608, ISSN: 10440305, DOI: 10.1007/s13361-011-0326-2 |
| Senko et al: "Determination of monoisotopic masses and ion populations for large biomolecules from resolved isotopic distributions" Journal of the American Society for Mass Spectrometry, Elsevier Science Inc, US, vol. 6, No. 4, Apr. 1, 1995 (Apr. 1, 1995), pp. 229-233, XP005357128, ISSN: 1044-0305, DOI: 10.1016/1044-0305(95)00017-8 the whole document. |
| SENKO, M.W. BEU, S.C. MCLAFFERTY, F.W.: "Determination of monoisotopic masses and ion populations for large biomolecules from resolved isotopic distributions", JOURNAL OF THE AMERICAN SOCIETY FOR MASS SPECTROMETRY, ELSEVIER SCIENCE INC, US, vol. 6, no. 4, 1 April 1995 (1995-04-01), US , pages 229 - 233, XP005357128, ISSN: 1044-0305, DOI: 10.1016/1044-0305(95)00017-8 |
Also Published As
| Publication number | Publication date |
|---|---|
| US20190250168A1 (en) | 2019-08-15 |
| WO2018073404A1 (en) | 2018-04-26 |
| EP3529724B1 (en) | 2024-07-03 |
| EP3529724A1 (en) | 2019-08-28 |
Similar Documents
| Publication | Publication Date | Title |
|---|---|---|
| US7781729B2 (en) | Analyzing mass spectral data | |
| US8975577B2 (en) | System and method for grouping precursor and fragment ions using selected ion chromatograms | |
| US20190164735A1 (en) | Methods for Data-Dependent Mass Spectrometry of Mixed Biomolecular Analytes | |
| EP2909618B1 (en) | Accurate and interference-free multiplexed quantitative proteomics using mass spectrometry | |
| CN105122051B (en) | Analysis system | |
| EP3293754A1 (en) | Method for identification of the monoisotopic mass of species of molecules | |
| JP6115288B2 (en) | Peak detection method and system in mass spectrometry | |
| US10460919B2 (en) | Automated determination of mass spectrometer collision energy | |
| JP2020183931A (en) | Chromatograph mass spectrometry data processing method, chromatograph mass spectrometer, and chromatograph mass spectrometry data processing program | |
| EP4078600B1 (en) | Method and system for the identification of compounds in complex biological or environmental samples | |
| CN112640031A (en) | Isotope mass spectrometry | |
| JP2021536567A (en) | Identification and scoring of related compounds in composite samples | |
| JP7144302B2 (en) | Mass spectrum analyzer and method | |
| US11378581B2 (en) | Monoisotopic mass determination of macromolecules via mass spectrometry | |
| JP4857000B2 (en) | Mass spectrometry system | |
| CN104359967B (en) | A kind of analytic method of the overlapping isotope profile of biological mass spectrometry | |
| JP2015152582A (en) | ion trap mass spectrometer and ion trap mass spectrometry method | |
| US8110793B2 (en) | Tandem mass spectrometry with feedback control | |
| JP4950029B2 (en) | Mass spectrometer | |
| Choo et al. | Tandem mass spectrometry data quality assessment by self-convolution | |
| US11694884B2 (en) | Mass spectral analysis of large molecules | |
| US20240412962A1 (en) | Methods and systems for determining molecular mass | |
| Lyutvinskiy et al. | Adding colour to mass spectra: Charge Determination Analysis (CHARDA) assigns charge state to every ion peak | |
| Nosratinia | A Combinatorial Approach to Protein Mixture-Identification based on Mass Spectrometry Data |
Legal Events
| Date | Code | Title | Description |
|---|---|---|---|
| FEPP | Fee payment procedure |
Free format text: ENTITY STATUS SET TO UNDISCOUNTED (ORIGINAL EVENT CODE: BIG.); ENTITY STATUS OF PATENT OWNER: LARGE ENTITY |
|
| STPP | Information on status: patent application and granting procedure in general |
Free format text: APPLICATION DISPATCHED FROM PREEXAM, NOT YET DOCKETED |
|
| AS | Assignment |
Owner name: UNIVERSITEIT ANTWERPEN, BELGIUM Free format text: ASSIGNMENT OF ASSIGNORS INTEREST;ASSIGNORS:VALKENBORG, DIRK;HOOYBERGHS, JEF;SOBOTT, FRANK;AND OTHERS;SIGNING DATES FROM 20190514 TO 20190530;REEL/FRAME:049596/0912 Owner name: VITO NV, BELGIUM Free format text: ASSIGNMENT OF ASSIGNORS INTEREST;ASSIGNORS:VALKENBORG, DIRK;HOOYBERGHS, JEF;SOBOTT, FRANK;AND OTHERS;SIGNING DATES FROM 20190514 TO 20190530;REEL/FRAME:049596/0912 |
|
| STPP | Information on status: patent application and granting procedure in general |
Free format text: DOCKETED NEW CASE - READY FOR EXAMINATION |
|
| STPP | Information on status: patent application and granting procedure in general |
Free format text: NON FINAL ACTION MAILED |
|
| STPP | Information on status: patent application and granting procedure in general |
Free format text: FINAL REJECTION MAILED |
|
| STPP | Information on status: patent application and granting procedure in general |
Free format text: DOCKETED NEW CASE - READY FOR EXAMINATION |
|
| STPP | Information on status: patent application and granting procedure in general |
Free format text: NOTICE OF ALLOWANCE MAILED -- APPLICATION RECEIVED IN OFFICE OF PUBLICATIONS |
|
| STPP | Information on status: patent application and granting procedure in general |
Free format text: AWAITING TC RESP., ISSUE FEE NOT PAID |
|
| STPP | Information on status: patent application and granting procedure in general |
Free format text: NOTICE OF ALLOWANCE MAILED -- APPLICATION RECEIVED IN OFFICE OF PUBLICATIONS |
|
| STPP | Information on status: patent application and granting procedure in general |
Free format text: PUBLICATIONS -- ISSUE FEE PAYMENT VERIFIED |
|
| STCF | Information on status: patent grant |
Free format text: PATENTED CASE |
|
| MAFP | Maintenance fee payment |
Free format text: PAYMENT OF MAINTENANCE FEE, 4TH YEAR, LARGE ENTITY (ORIGINAL EVENT CODE: M1551); ENTITY STATUS OF PATENT OWNER: LARGE ENTITY Year of fee payment: 4 |