US11229372B2 - Systems and methods for computer monitoring of remote photoplethysmography based on chromaticity in a converted color space - Google Patents
Systems and methods for computer monitoring of remote photoplethysmography based on chromaticity in a converted color space Download PDFInfo
- Publication number
- US11229372B2 US11229372B2 US16/335,480 US201716335480A US11229372B2 US 11229372 B2 US11229372 B2 US 11229372B2 US 201716335480 A US201716335480 A US 201716335480A US 11229372 B2 US11229372 B2 US 11229372B2
- Authority
- US
- United States
- Prior art keywords
- color space
- computer system
- image data
- data set
- consecutive images
- Prior art date
- Legal status (The legal status is an assumption and is not a legal conclusion. Google has not performed a legal analysis and makes no representation as to the accuracy of the status listed.)
- Active
Links
Images


Classifications
-
- A—HUMAN NECESSITIES
- A61—MEDICAL OR VETERINARY SCIENCE; HYGIENE
- A61B—DIAGNOSIS; SURGERY; IDENTIFICATION
- A61B5/00—Measuring for diagnostic purposes; Identification of persons
- A61B5/02—Detecting, measuring or recording for evaluating the cardiovascular system, e.g. pulse, heart rate, blood pressure or blood flow
- A61B5/024—Measuring pulse rate or heart rate
- A61B5/02416—Measuring pulse rate or heart rate using photoplethysmograph signals, e.g. generated by infrared radiation
-
- A—HUMAN NECESSITIES
- A61—MEDICAL OR VETERINARY SCIENCE; HYGIENE
- A61B—DIAGNOSIS; SURGERY; IDENTIFICATION
- A61B5/00—Measuring for diagnostic purposes; Identification of persons
- A61B5/0059—Measuring for diagnostic purposes; Identification of persons using light, e.g. diagnosis by transillumination, diascopy, fluorescence
- A61B5/0077—Devices for viewing the surface of the body, e.g. camera, magnifying lens
-
- A—HUMAN NECESSITIES
- A61—MEDICAL OR VETERINARY SCIENCE; HYGIENE
- A61B—DIAGNOSIS; SURGERY; IDENTIFICATION
- A61B5/00—Measuring for diagnostic purposes; Identification of persons
- A61B5/08—Measuring devices for evaluating the respiratory organs
- A61B5/0806—Measuring devices for evaluating the respiratory organs by whole-body plethysmography
-
- G—PHYSICS
- G06—COMPUTING OR CALCULATING; COUNTING
- G06T—IMAGE DATA PROCESSING OR GENERATION, IN GENERAL
- G06T5/00—Image enhancement or restoration
- G06T5/40—Image enhancement or restoration using histogram techniques
-
- G—PHYSICS
- G06—COMPUTING OR CALCULATING; COUNTING
- G06T—IMAGE DATA PROCESSING OR GENERATION, IN GENERAL
- G06T5/00—Image enhancement or restoration
- G06T5/50—Image enhancement or restoration using two or more images, e.g. averaging or subtraction
-
- G—PHYSICS
- G06—COMPUTING OR CALCULATING; COUNTING
- G06T—IMAGE DATA PROCESSING OR GENERATION, IN GENERAL
- G06T7/00—Image analysis
-
- G—PHYSICS
- G06—COMPUTING OR CALCULATING; COUNTING
- G06T—IMAGE DATA PROCESSING OR GENERATION, IN GENERAL
- G06T7/00—Image analysis
- G06T7/0002—Inspection of images, e.g. flaw detection
- G06T7/0012—Biomedical image inspection
-
- G—PHYSICS
- G06—COMPUTING OR CALCULATING; COUNTING
- G06T—IMAGE DATA PROCESSING OR GENERATION, IN GENERAL
- G06T7/00—Image analysis
- G06T7/0002—Inspection of images, e.g. flaw detection
- G06T7/0012—Biomedical image inspection
- G06T7/0014—Biomedical image inspection using an image reference approach
- G06T7/0016—Biomedical image inspection using an image reference approach involving temporal comparison
-
- G—PHYSICS
- G06—COMPUTING OR CALCULATING; COUNTING
- G06T—IMAGE DATA PROCESSING OR GENERATION, IN GENERAL
- G06T7/00—Image analysis
- G06T7/20—Analysis of motion
-
- G—PHYSICS
- G06—COMPUTING OR CALCULATING; COUNTING
- G06T—IMAGE DATA PROCESSING OR GENERATION, IN GENERAL
- G06T7/00—Image analysis
- G06T7/30—Determination of transform parameters for the alignment of images, i.e. image registration
- G06T7/33—Determination of transform parameters for the alignment of images, i.e. image registration using feature-based methods
-
- H—ELECTRICITY
- H04—ELECTRIC COMMUNICATION TECHNIQUE
- H04N—PICTORIAL COMMUNICATION, e.g. TELEVISION
- H04N23/00—Cameras or camera modules comprising electronic image sensors; Control thereof
- H04N23/80—Camera processing pipelines; Components thereof
- H04N23/84—Camera processing pipelines; Components thereof for processing colour signals
- H04N23/88—Camera processing pipelines; Components thereof for processing colour signals for colour balance, e.g. white-balance circuits or colour temperature control
-
- H04N9/735—
-
- A—HUMAN NECESSITIES
- A61—MEDICAL OR VETERINARY SCIENCE; HYGIENE
- A61B—DIAGNOSIS; SURGERY; IDENTIFICATION
- A61B2576/00—Medical imaging apparatus involving image processing or analysis
-
- G—PHYSICS
- G06—COMPUTING OR CALCULATING; COUNTING
- G06T—IMAGE DATA PROCESSING OR GENERATION, IN GENERAL
- G06T2207/00—Indexing scheme for image analysis or image enhancement
- G06T2207/10—Image acquisition modality
- G06T2207/10016—Video; Image sequence
-
- G—PHYSICS
- G06—COMPUTING OR CALCULATING; COUNTING
- G06T—IMAGE DATA PROCESSING OR GENERATION, IN GENERAL
- G06T2207/00—Indexing scheme for image analysis or image enhancement
- G06T2207/10—Image acquisition modality
- G06T2207/10024—Color image
-
- G—PHYSICS
- G06—COMPUTING OR CALCULATING; COUNTING
- G06T—IMAGE DATA PROCESSING OR GENERATION, IN GENERAL
- G06T2207/00—Indexing scheme for image analysis or image enhancement
- G06T2207/30—Subject of image; Context of image processing
- G06T2207/30004—Biomedical image processing
- G06T2207/30076—Plethysmography
-
- G—PHYSICS
- G16—INFORMATION AND COMMUNICATION TECHNOLOGY [ICT] SPECIALLY ADAPTED FOR SPECIFIC APPLICATION FIELDS
- G16H—HEALTHCARE INFORMATICS, i.e. INFORMATION AND COMMUNICATION TECHNOLOGY [ICT] SPECIALLY ADAPTED FOR THE HANDLING OR PROCESSING OF MEDICAL OR HEALTHCARE DATA
- G16H30/00—ICT specially adapted for the handling or processing of medical images
- G16H30/40—ICT specially adapted for the handling or processing of medical images for processing medical images, e.g. editing
Definitions
- This disclosure relates to computer monitoring of remote photoplethysmography (rPPG) from camera images.
- rPPG remote photoplethysmography
- Photoplethysmography is an essential tool to monitor patients' vital signs in medical practice. See Garbey, M., et al., Contact - free measurement of cardiac pulse based on the analysis of thermal imagery , IEEE Transactions on Biomedical Engineering, 2007, 54(8): p. 1418-1426; and Sinex, J. E., Pulse oximetry: Principles and limitations , The American Journal of Emergency Medicine, 1999, 17(1): p. 59-66, the disclosures of which are hereby incorporated herein by reference in their entirety.
- Traditional PPG requires contact with the skin, causing discomfort and even skin damage when used over a long period of time.
- rPPG remote photoplethysmography
- rPPG is attractive because it can potentially track the subject's PPG under free-living conditions, while he/she is performing daily activities (e.g., working on a computer or watching television at home or in the workplace).
- RGB color space which may provide a good signal for still subjects, but is susceptible to contamination by motion artifacts in realistic situations (e.g., subject movement).
- ICA Independent component analysis
- PCA principle component analysis
- rPPG computer monitoring devices with a camera are attractive for non-invasive monitoring of a subject's physiological parameters, but rPPG computer monitoring devices are prone to motion-induced artifacts, making it difficult for such devices to obtain accurate readings in realistic situations.
- rPPG remote photoplethysmography
- CIELab color space is designed to approximate human vision, and separate illumination intensity changes (L* channel) from color changes (a* and b* channels).
- Motion artifacts mainly affect the illumination intensity (L* channel), so that CIELab color space can naturally isolate rPPG signals (a* and b* channels) from the motion artifacts.
- systems and methods disclosed herein employing a converted color space beneficially permit reduction of motion-induced artifacts in camera images for improved (rPPG) computer monitoring (e.g., measurements, tracking, readings, etc.) of physiological parameters.
- rPPG computer monitoring
- CIELab color space is disclosed, other non-RGB color spaces could be used.
- various systems and methods disclosed herein include adaptive selection of a region of interest (ROI) and pruning of image frames by a computer system, such as when a face of a subject moves out of the view or is blocked by objects.
- ROI region of interest
- a method automatically selects, by the computer system, an optimal ROI, removes frames in which the ROI is not clearly captured (e.g., moves out of the view or is blocked by the subject's hands), and analyzes rPPG in CIELab color space, rather than in RGB color space.
- Systems and methods disclosed herein may be used with subjects of varying and diverse skin tones, under realistic free-living conditions.
- a remote photoplethysmography (rPPG) system for monitoring by a computer system of at least one physiological parameter of a living body from image data.
- the rPPG system comprises a processor subsystem to electronically receive, at the computer system, a first image data set from an optical imaging element, the first image data set being representative of a series of consecutive images of at least a portion of the living body; convert, by the computer system, the first image data set from a first color space to a second color space to generate a second image data set including first channel data comprising a luminance component and second channel data comprising a chromatic component; and process, by the computer system, the second channel data to monitor the at least one physiological parameter of the living body.
- a method for remote photoplethysmography (rPPG) monitoring by a computer system comprises electronically receiving, at the computer system, a first image data set from an optical imaging element, the first image data set being representative of a series of consecutive images of at least a portion of a living body; converting, by the computer system, the first image data set from a first color space to a second color space to generate a second image data set including first channel data comprising a luminance component and second channel data comprising a chromatic component; and processing, by the computer system, the second channel data to monitor at least one physiological parameter of the living body.
- rPPG remote photoplethysmography
- a non-transitory computer readable medium containing program instructions for execution by a processor of a computer system causes the computer system to perform the following steps: electronically receiving, at the computer system, a first image data set from an optical imaging element, the first image data set being representative of a series of consecutive images of at least a portion of a living body; converting, by the computer system, the first image data set from a first color space to a second color space to generate a second image data set including first channel data comprising a luminance component and second channel data comprising a chromatic component; and processing, by the computer system, the second channel data to monitor at least one physiological parameter of the living body.
- a remote photoplethysmography (rPPG) system for monitoring by a computer system of at least one physiological parameter of a living body from image data.
- the rPPG system being adapted to electronically receive, at the computer system, a first image data set from an optical imaging element, the first image data set being representative of a series of consecutive images of at least a portion of a living body; convert, by the computer system, the first image data set from a first color space to a second color space to generate a second image data set including first channel data comprising a luminance component and second channel data comprising a chromatic component; and process, by the computer system, the second channel data to monitor at least one physiological parameter of the living body.
- a computer program comprising instructions which, when executed by at least one processor, causes the at least one processor to carry out electronically receiving, at the computer system, a first image data set from an optical imaging element, the first image data set being representative of a series of consecutive images of at least a portion of a living body; converting, by the computer system, the first image data set from a first color space to a second color space to generate a second image data set including first channel data comprising a luminance component and second channel data comprising a chromatic component; and processing, by the computer system, the second channel data to monitor at least one physiological parameter of the living body.
- a computer program comprising instructions which, when executed by at least one processor, causes the at least one processor to carry out any of the above (and/or below).
- a carrier comprises the computer program above (and/or below), wherein the carrier is one of an electronic signal, an optical signal, a radio signal, or a computer readable storage medium.
- the first color space comprises an RGB color space.
- the second color space comprises at least one of: a CIELab color space, wherein the first channel data comprises L* channel data, and the second channel data comprises at least one of a* channel data or b* channel data; or a YCbCr color space, wherein the first channel data comprises Y* channel data, and the second channel data comprises at least one of Cb* channel data or Cr* channel data.
- the at least one physiological parameter comprises at least one (or at least two, or all three) of breathing pattern, respiration rate, or heart rate.
- the rPPG system, method, and/or non-transitory computer readable medium further comprise automatically determining, by the computer system, a region of interest (ROI) of the living body in the first image data set.
- ROI is determined using a Viola-Jones face detection algorithm.
- the rPPG system, method, and/or non-transitory computer readable medium further comprise tracking, by the computer system, the ROI through at least some consecutive images of the series of consecutive images.
- the ROI is tracked using a Kanade-Lucas-Tomasi algorithm.
- the rPPG system, method, and/or non-transitory computer readable medium further comprise initializing, by the computer system, the ROI based on a first image of the series of consecutive images, and reinitializing, by the computer system, the ROI after a predetermined number of images of the series of consecutive images.
- the rPPG system, method, and/or non-transitory computer readable medium further comprise removing, by the computer system, one or more consecutive images of the series of consecutive images if a number of identified feature points in the ROI in the one or more consecutive images is below a predetermined threshold.
- the predetermined threshold is 70%.
- FIG. 1A is a schematic diagram of a computer system capable of monitoring remote photoplethysmography (rPPG) from camera images based on chromaticity in a converted color space according to the present disclosure
- rPPG remote photoplethysmography
- FIG. 1B is a flowchart illustrating steps carried out by the computer system of FIG. 1A for monitoring physiological parameters of a living body;
- FIG. 2A includes three frames providing line charts of time-varying rPPG extraction signals for R*, G*, and B* channels corresponding to RGB color space for images obtained during a specified time period, with a superimposed signal-to-noise ratio (SNR) value for each channel;
- SNR signal-to-noise ratio
- FIG. 2B includes three frames providing line charts of time-varying rPPG extraction signals for L*, a*, and b* channels corresponding to CIELab color space derived from image data represented in the charts of FIG. 2A , with a superimposed SNR value for each channel;
- FIG. 2C includes three frames providing line charts of time-varying rPPG extraction signals for H*, S*, and V* channels corresponding to HSV color space, derived from image data represented in the charts of FIG. 2A , with a superimposed SNR value for each channel;
- FIG. 2D includes three frames providing line charts of time-varying rPPG extraction signals for Y*, Cb*, and Cr* channels corresponding to YCbCr color space, derived from image data represented in the charts of FIG. 2A , with a superimposed SNR value for each channel;
- FIG. 3A shows a face area and division of the face area into three hundred and thirty (22 ⁇ 15) sub-areas
- FIG. 3B is a signal-to-noise ratio (SNR) map corresponding to the sub-areas shown in FIG. 3A ;
- FIG. 3C is a roughness map corresponding to the sub-areas shown in FIG. 3A ;
- FIG. 3D provides a numerical SNR map of the SNR map of FIG. 3B ;
- FIG. 3E provides a numerical SNR map of the roughness map of FIG. 3C ;
- FIG. 4A shows a region of interest (ROI) selection on the forehead of a mannequin
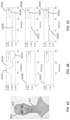
- FIG. 4B includes three frames providing line charts of time-varying signals for L*, a*, and b* channels corresponding to CIELab color space obtained during a specified time period, with the uppermost frame in particular showing motion-induced changes apparent in the L* channel line chart;
- FIG. 4C includes three frames providing line charts of time-varying signals for R*, G*, and B* channels corresponding to RGB color space obtained during the same time period of FIG. 4B , with each frame showing motion-induced changes (i.e., in each of the in R*, G*, and B* channels);
- FIG. 5 is a schematic diagram showing an experimental setup for performing rPPG in a converted color space
- FIG. 6A is a line chart showing average intensity versus time (s) for an rPPG signal from channel a*;
- FIG. 6B is a line chart showing average intensity versus time (s) for an rPPG signal from channel b*;
- FIG. 6C is a line chart showing average intensity versus time (s) for an rPPG signal from channel L*;
- FIG. 7A is a line chart plotting an rPPG signal (average intensity versus time for a period of 0 to 600 seconds) of a living body in channel G* of RGB color space, with an upper inset line chart embodying a magnified portion of the rPPG signal for a time period of about 405 seconds to 440 seconds;
- FIG. 7B is a line chart embodying a comparative plot of rPPG signals (average intensity versus time for the same period of 0 to 600 seconds) of the same living body as depicted in FIG. 7A , but in channel a* of CIELab color space, with an upper inset line chart embodying a magnified portion of the rPPG signal for the time period of about 405 seconds to 440 seconds;
- FIG. 8A is a scatter plot of heart rate detected with G* channel rPPG (RGB color space) and electrocardiography (ECG), overlaid with a linear fit, showing a linear correlation;
- G* channel rPPG RGB color space
- ECG electrocardiography
- FIG. 8B is a scatter plot of heart rate detected with a* channel rPPG (CIELab color space) and ECG, overlaid with a linear fit, showing a linear correlation;
- FIG. 9 is a table showing average signal-to-noise ratio values (SNRs) of a* channel rPPG and G* channel rPPG for each of 17 subjects;
- FIG. 10 is a bar chart comparing average SNRs of all 17 subjects of FIG. 9 for rPPG signals from channels a* and G* of the same subjects;
- FIG. 11A is a line chart showing a peak-to-peak (P-P) interval sequence from G* channel rPPG;
- FIG. 11B is a line chart showing a P-P interval sequence from a* channel rPPG for the same timeframe as FIG. 11A ;
- FIG. 11C is a line chart showing a recorded R wave-to-R wave (R-R) interval sequence from ECG for the same timeframe as FIGS. 11A and 11B ;
- FIG. 12 is a table showing errors in P-P intervals from a* channel and G* channel rPPG.
- FIG. 13 is a schematic diagram of one embodiment of a computer system for monitoring of rPPG in a converted color space.
- Relative terms such as “below,” “above,” “upper,” “lower,” “horizontal,” and/or “vertical” may be used herein to describe a relationship of one element, layer, or region to another element, layer, or region as illustrated in the Figures. It will be understood that these terms and those discussed above are intended to encompass different orientations of the device in addition to the orientation depicted in the Figures.
- CIELab color space is designed to approximate human vision, and is designed to separate illumination intensity changes (channel L*) from color changes (channels a* and b*).
- Motion artifacts mainly affect the illumination intensity (channel L*), so that CIELab color space can naturally isolate rPPG signals (channels a* and b*) from the motion artifacts.
- systems and methods according to various embodiments disclosed herein reduce motion-induced artifacts in camera images for improved (rPPG) computer monitoring (e.g., measurements, tracking, readings, etc.) of physiological parameters.
- rPPG computer monitoring
- systems and methods according to at least certain embodiments include adaptive selection of region of interest (ROI) and pruning of image frames by a computer system, such as when the subject's face moves out of the view or is blocked by objects.
- ROI region of interest
- the method automatically selects, by the computer system, an optimal ROI, removes frames in which the ROI is not clearly captured, and analyzes rPPG in CIELab color space, rather than in RGB color space.
- the systems and methods disclosed herein could be used with subjects of varying and diverse skin tones, under realistic free-living conditions.
- the present disclosure relates to systems and methods (e.g., color space algorithm, color space-based algorithm, color space filter, etc.) capable of removing or minimizing subject motion-induced artifacts in electronic monitoring (e.g., measurements, tracking, readings, etc.) of physiological parameters (e.g., breathing pattern, respiration rate, heart rate, vital signs, etc.) by a computer system.
- electronic monitoring e.g., measurements, tracking, readings, etc.
- physiological parameters e.g., breathing pattern, respiration rate, heart rate, vital signs, etc.
- a computer system can convert a first electronic monitoring signal in RGB color space to a second electronic monitoring signal in CIELab color space.
- the computer system achieves robust tracking of rPPG signal under realistic conditions, where the subject is allowed to move naturally.
- FIGS. 1A and 1B illustrate one embodiment of a computer system configured for monitoring remote photoplethysmography (rPPG) from camera images based on chromaticity in a converted color space according to the present disclosure. More specifically, FIG. 1A illustrates a computer system 100 with an ROI selector 102 , an ROI tracker 104 , a color space converter 106 , and a color space analyzer 108 , as explained in more detail below.
- rPPG remote photoplethysmography
- FIG. 1B illustrates processing steps of a method 110 carried out by the computer system 100 of FIG. 1A .
- the computer system 100 automatically selects an optimal ROI (also referred to herein as ROI), such as by the ROI selector 102 of the computer system 100 .
- the computer system 100 automatically identifies a subject's face, and then automatically selects the forehead and/or cheek areas as the optimal ROI.
- the computer system 100 tracks the ROI and removes frames when the ROI is not clearly captured (e.g., when the ROI moves out of the view or is blocked by the subject's hands), such as by the ROI tracker 104 of the computer system 100 .
- the computer system 100 first determines an optimal ROI for rPPG signal extraction, and then tracks the ROI. See Tomasi, C. and T. Kanade, Detection and tracking of point features, 1991: School of Computer Science, Carnegie Mellon Univ., Pittsburgh, the disclosure of which is hereby incorporated herein by reference in its entirety.
- the subject may move frequently, for example: turning his/her head, raising his/her hands, and/or standing up. In such events, the ROI might be blocked by hands or move out of the image frame.
- the computer system 100 detects such events, and removes the corresponding image frames.
- the computer system 100 then converts one or more images from a first color space (e.g., RGB color space) to a second color space (e.g., CIELab color space) separating chromaticity from luminance, such as by the color space converter 106 of the computer system 100 .
- a first color space e.g., RGB color space
- a second color space e.g., CIELab color space
- the computer system 100 determines rPPG signal in CIELab color space.
- L* channel also referred to herein as *L channel
- *L channel is most prone to motion-induced artifacts because the motion usually affects the intensity distribution more than the color.
- the computer system 100 could be implemented in a home care unit, installed onto a computing device (e.g., desktop computer, laptop, tablet, smartphone, etc.) with an external or internal camera, or implemented on a computing device with electronic access (e.g., over the Internet) to image data (e.g., video data, photo data, etc.).
- a computing device e.g., desktop computer, laptop, tablet, smartphone, etc.
- electronic access e.g., over the Internet
- image data e.g., video data, photo data, etc.
- the computer system 100 analyzes rPPG in the second color space (e.g., CIELab color space rather than in RGB color space) based on chromaticity, such as by the color space analyzer 108 of the computer system 100 .
- the computer system 100 can be combined with other signal de-noising methods (e.g., a wavelet de-noising method and/or an adaptive filter) to further improve performance.
- FIGS. 2A-2D illustrate rPPG extraction from various color spaces, along with the signal-to-noise ratios for comparison of signal performance in the various color spaces.
- FIG. 2A includes three frames providing line charts of time-varying rPPG extraction signals for R*, G*, and B* channels corresponding to RGB color space for images obtained during a specified time period, with a superimposed SNR value for each channel.
- frame 200 A corresponds to the R* channel
- frame 200 B corresponds to the G* channel (also referred to herein as g* channel)
- frame 200 C corresponds to the B* channel.
- FIG. 2B includes three frames providing line charts of time-varying rPPG extraction signals for L*, a*, and b* channels corresponding to CIELab color space derived from image data represented in the charts of FIG. 2A , with a superimposed SNR value for each channel.
- frame 202 A corresponds to the L* channel
- frame 202 B corresponds to the a* channel
- frame 202 C corresponds to the b* channel.
- FIG. 2C includes three frames providing line charts of time-varying rPPG extraction signals for H*, S*, and V* channels corresponding to HSV color space, derived from image data represented in the charts of FIG. 2A , with a superimposed SNR value for each channel.
- frame 204 A corresponds to the H* channel
- frame 204 B corresponds to the S* channel
- frame 204 C corresponds to the V* channel.
- FIG. 2D includes three frames providing line charts of time-varying rPPG extraction signals for Y*, Cb*, and Cr* channels corresponding to YCbCr color space, derived from image data represented in the charts of FIG. 2A , with a superimposed SNR value for each channel.
- frame 206 A corresponds to the Y* channel
- frame 206 B corresponds to the Cb* channel
- frame 206 C corresponds to the Cr* channel.
- a system and method convert a first color space to a second color space to separate motion represented in the intensity channel data from color changes in the chromaticity channel data.
- the results indicate that the chromaticity channels (e.g., a*, H*, and Cr*) from each color space provide better performance (e.g., better and cleaner signals) than the other channels, and channel a* from CIELab provides the best performance.
- systems and methods according to various embodiments of the present disclosure separate a signal into at least a chromaticity component and a luminance component (e.g., brightness component, lightness component, intensity component), and process the chromaticity component for rPPG computer monitoring of physiological parameters.
- a luminance component e.g., brightness component, lightness component, intensity component
- FIGS. 3A-3E illustrate ROI detection and tracking.
- the face 300 of the subject is first detected by a computer system (e.g., computer system 100 shown in FIG. 1A ) with the Viola-Jones (VJ) face detection algorithm as illustrated by the rectangle bordering the grid in FIG. 3A , with such rectangle defining a face area 302 .
- FIG. 3A shows division of the face area 302 into three hundred and thirty sub-areas 302 ′ (calculated from the 22 ⁇ 15 grid).
- the VJ face detection algorithm based on Harr features can identify a multi-scaled face by training a boosted cascade of classifiers. See Viola, P. and M. Jones, Rapid object detection using a boosted cascade of simple features , Proceedings of the 2001 IEEE Computer Society Conference on Computer Vision and Pattern Recognition, 2001 , CVPR 2001, IEEE, the disclosure of which is hereby incorporated herein by reference in its entirety.
- the computer system divides the face area 302 into the three hundred and thirty sub-areas 302 ′, with each sub-area 302 ′ containing four hundred (20 ⁇ 20) pixels.
- the computer system determines the signal-to-noise ratio (SNR) of the rPPG signal in each sub-area 302 ′ as shown in a SNR map 304 in FIG. 3B , which corresponds to the sub-areas 302 ′ shown in FIG. 3A .
- FIG. 3D provides a numerical SNR map 304 ′ of the SNR map 304 of FIG. 3B .
- FIG. 3E provides a numerical SNR map 306 ′ of the roughness map 306 of FIG. 3C .
- the computer system e.g., computer system 100 shown in FIG. 1A
- This size could be empirically decided, such as according to experiment conditions (e.g., distance to camera) to ensure that a large enough feature area (such as forehead) is included.
- the computer system in selecting the optimal ROI 303 the computer system focuses on the forehead and/or cheek areas, as the forehead provides some of the highest quality rPPG signals, followed by the cheek areas. See Gupta, O., D. McDuff, and R. Raskar, Real - Time Physiological Measurement and Visualization Using a Synchronized Multi - Camera System , Proceedings of the IEEE Conference on Computer Vision and Pattern Recognition Workshops, 2016, the disclosure of which is hereby incorporated herein by reference in its entirety. Also, in certain embodiments, the computer system selects the forehead as the optimal ROI 303 for rPPG because the forehead area minimizes complications due to facial expression changes, such as talking and smiling. Furthermore, as mentioned above, in selecting the optimal ROI 303 , the computer system identifies the most uniform area on the forehead, which helps minimize light distribution changes on the face due to motion. The uniformity of an area is evaluated with the following formula (“Eq. 1”):
- r std ⁇ ( I ⁇ ( i , j ) ) mean ⁇ ( I ⁇ ( i , j ) ) , ( 1 )
- I(i,j) is the intensity at pixel (i,j)
- std(I(i,j)) is standard deviation
- mean(I(i,j)) is the mean intensity of the ROI. Since r in Eq. 1 measures the roughness of an area, a reduction in the value of r corresponds to increased uniformity of the area.
- the optimal ROI 303 is subject to change.
- the computer system tracks the optimal ROI 303 with a tracking algorithm, such as with the Kanade-Lucas-Tomasi (KLT) algorithm.
- KLT Kanade-Lucas-Tomasi
- Some of the motions could be large (e.g., sudden turning of head or waving hands in front of the face), which could cause the tracking algorithm to fail.
- the corresponding image frames are pruned with the algorithm described below.
- the computer system calculates a motion vector that describes the motion-induced changes in the optimal ROI 303 by tracking feature points within the optimal ROI 303 with the KLT algorithm. See Id; and Lucas, B. D. and T. Kanade, An iterative image registration technique with an application to stereo vision , IJCAI, 1981, the disclosure of which is hereby incorporated herein by reference in its entirety.
- the computer system uses the motion vector to adjust the location, shape, and size of the optimal ROI 303 for each frame.
- the computer system detects feature points within the optimal ROI 303 in the first frame using the corner point detection algorithm developed by Shi and Tomasi, and these feature points are then tracked on a frame-by-frame basis. See Jianbo, S. and C.
- CIELab color space is perceptually uniform (e.g., the Euclidean distance between two different colors corresponds approximately to the color difference perceived by the human eye). See Tkalcic, M. and J. F. Tasic, Colour spaces: perceptual, historical and applicational background , Eurocon, 2003, the disclosure of which is hereby incorporated herein by reference in its entirety.
- Channel L* is the luminance or lightness component, which ranges from 0 to 100.
- Channels a* and b* are two chromatic components, both ranging from ⁇ 120 to 120.
- Yam, K. L. and S. E. Papadakis A simple digital imaging method for measuring and analyzing color of food surfaces , Journal of Food Engineering, 2004, 61(1): p. 137-142, the disclosure of which is hereby incorporated herein by reference in its entirety.
- To convert an image in RGB to CIELab color space the computer system first converts the image into XYZ color space, as shown below,
- RGB color space is device-dependent, non-intuitive, and perceptually non-uniform, and its three components are highly correlative with cross correlation coefficients of ⁇ 0.78 (between B* and R* channels), ⁇ 0.98 (between R* and G*) and ⁇ 0.94 (between G* and B*).
- ⁇ 0.78 between B* and R* channels
- ⁇ 0.98 between R* and G*
- ⁇ 0.94 between G* and B*
- CIELab color space separates the intensity and chromaticity components.
- CIELab is superior for robust rPPG because the motion of the subject mainly changes the intensity, and PPG arising from heart beats changes both the intensity and chromaticity of the skin.
- FIGS. 4A-4C illustrate motion artifacts obtained using a mannequin 401 subject to manually induced motion.
- FIG. 4A shows a region of interest (ROI) selection on the forehead of the mannequin 401 . More specifically, as shown in FIG. 4A , an optimal ROI 303 was selected (by the user and/or automatically by a computer system (e.g., computer system 100 shown in FIG. 1A )) on the forehead 403 of the mannequin 401 and tracked with the KLT algorithm.
- ROI region of interest
- FIG. 4B includes three frames providing line charts of time-varying signals for L*, a*, and b* channels corresponding to CIELab color space obtained during a specified time period, with the uppermost frame in particular showing motion-induced changes apparent in the L* channel line chart.
- the changes in the three channels were normalized for comparison.
- frame 404 A corresponds to the L* channel
- frame 404 B corresponds to the a* channel
- frame 404 C corresponds to the b* channel.
- Large variations e.g., first variation 400 A and second variation 402 A
- the intensity channel L* (corresponding to frame 404 A)
- the chromaticity channels a* and b* (corresponding to frames 404 B, 404 C, respectively), showed little variation associated with the motions.
- the chromaticity channels a* and b* are more tolerant (e.g., less sensitive) to motion artifacts than the intensity channel L*.
- the chromaticity channels a* and b* are also more tolerant to the motion artifacts than R*, G*, B* channels that contain both intensity and chromaticity information as shown in FIG. 4C , which includes three frames providing line charts of time-varying signals for R*, G*, and B* channels corresponding to RGB color space obtained during the same time period as that of FIG. 4B , with each frame showing motion-induced changes.
- frame 406 A corresponds to the R* channel
- frame 406 B corresponds to the G* channel
- frame 406 C corresponds to the B* channel
- the R* channel shows a first variation 400 B and a second variation 402 B
- the G* channel shows a first variation 400 C and a second variation 402 C
- the B* channel shows a first variation 400 D and a second variation 402 D.
- the first variations 400 B, 400 C, 400 D and the second variations 402 B, 402 C, 402 D correspond to motion of the mannequin 401 as in the *L channel.
- FIG. 5 is a schematic diagram showing an experimental setup for performing rPPG in a converted color space.
- a camera 500 e.g., a Pike color camera (F-032C), although any color video camera could be used
- F-032C Pike color camera
- the camera 500 recorded a 10-minute video for each subject 504 under ambient light (e.g., with a regular fluorescent lamp), and the video was divided into 60 segments, each of 10 s duration.
- rPPG signal within a window of 20 s (two segments) was analyzed by the computer system, and the window was moved from the beginning to the end of the entire 10-minute video with a step of 10 s.
- the video recording frame rate was set to be 30 frames per second (f/s), and each frame contained 307.2K (480*640) pixels.
- an ECG of the subject 504 was synchronously recorded with an ECG device 506 or Electric Potential Integrated Circuit (EPIC) (Plessey Semiconductors, Inc.), using a pair of electrodes 508 attached to the left wrist and ankle of the subject 504 , respectively.
- ECG Electric Potential Integrated Circuit
- Any suitable ECG device 506 could be used, and the ECG device 506 was provided only for comparison purposes with the accuracy of the system disclosed herein.
- FIGS. 6A-6C illustrate examples of rPPG in a*, b*, and L* channels of CIELab color space.
- FIG. 6A is a line chart 600 A showing average intensity versus time (s) for an rPPG signal from channel a*
- FIG. 6B is a line chart 600 B showing average intensity versus time (s) for an rPPG signal from channel b*
- FIG. 6C is a line chart 600 C showing average intensity versus time (s) for an rPPG signal from channel L*.
- the rPPG signal is the cleanest in a* channel (shown in chart 600 A) and most noisy in L* channel (shown in chart 600 C), as the L* channel is the most sensitive to the motion artifacts.
- the rPPG in b* channel (shown in chart 600 B) is better than that in L* channel, but not as clean as the rPPG in a* channel.
- both a* and b* channels are chromatic channels, a* channel performs better than b* channel for rPPG extraction. Blue spectral content in b* channel has less skin penetration, which may affect its sensitivity for rPPG sensing. See Bashkatov, A.
- FIGS. 7A and 7B embody line charts plotting the rPPG signals extracted from a* channel and G* channel, respectively, of the same video.
- chart 700 A in FIG. 7A corresponds to G* channel
- chart 700 B in FIG. 7B corresponds to a* channel. Note that some sections of the video were pruned as described above and as illustrated in dashed lines in FIGS. 7A and 7B .
- FIG. 7A is a plot of rPPG signal (average intensity versus time for a period of 0 to 600 seconds) of a living body in channel G* of RGB color space, with an upper inset plot 702 A embodying a magnified portion of the rPPG signal for a time period of about 405 seconds to 440 seconds.
- FIG. 7 B is a comparative plot of rPPG signals (average intensity versus time for the same period of 0 to 600 seconds) of the same living body as depicted in FIG. 7A , but in channel a* of CIELab color space, with an upper inset plot 702 B embodying a magnified portion of the rPPG signal for the time period of about 405 seconds to 440 seconds.
- FIG. 7B shows more clearly the breathing pattern with an average time interval of ⁇ 10 s.
- Close inspection of the rPPG signals in G* and a* at the same time interval reveals the heart beat signals, and the heart beat signal in a* (illustrated in the upper inset plot 702 B) is far cleaner than that in G* (illustrated in the upper inset plot 702 A).
- the large fluctuations in G* rPPG was due to head movements of the subject. The same head movements had little impact on a* rPPG.
- This comparison shows that the rPPG in CIELab space is more robust (e.g., resistant) to potential disturbance due to subject motion than that in RGB color space.
- FIG. 8A is a scatter plot 800 A (also referred to herein as a correlation plot) of heart rate detected with G* channel rPPG (RGB color space) and electrocardiography (ECG), overlaid with a linear fit, showing a linear correlation.
- FIG. 8B is a scatter plot 800 B (also referred to herein as a correlation plot) of heart rate detected with a* channel rPPG (CIELab color space) and ECG, overlaid with a linear fit, showing a linear correlation.
- the correlation plot 800 A in FIG. 8A for G* channel rPPG has a slope of 0.74 with a Pearson value (r) of 0.79.
- SNR signal-to-noise ratio
- the SNR analysis results for all 17 subjects are summarized in table 900 in FIG. 9 . More specifically, the table 900 in FIG. 9 shows average (SNR) values of a* rPPG and G* rPPG for each of the 17 subjects. Despite the variability among different subjects, the SNRs for the rPPG from CIELab (a* rPPG) are consistently better than those for the rPPG from RGB color space (G* rPPG).
- FIG. 10 is a bar chart 1000 comparing average SNRs (dB) of all 17 subjects for rPPG signals from a* and G* channels.
- Peak-to-peak (P-P) interval is another metric to evaluate the performance of the CIELab color space method.
- P-P interval detects the time period between two adjacent peaks, which is used to evaluate heart rate variability.
- the P-P interval sequence was aligned with the simultaneously recorded R wave-to-R wave (R-R) interval sequence in ECG.
- FIGS. 11A and 11B show typical examples of P-P interval sequences calculated from G* rPPG and a* rPPG, and FIG. 11C provides a comparison for these P-P interval sequences with R-R intervals from the simultaneously recorded ECG. More specifically, FIG. 11A is a line chart showing a P-P interval sequence 1100 A from G* channel rPPG, FIG.
- FIG. 11B is a line chart showing a P-P interval sequence 1100 B from a* channel rPPG for the same timeframe as FIG. 11A
- FIG. 11C is a line chart showing a R-R interval sequence 1100 C from the ECG for the same timeframe as FIGS. 11A and 11B
- the P-P interval sequence 1100 B from a* channel rPPG matches that of ECG (R-R interval sequence 1100 C) much better.
- FIG. 12 summarizes the errors between the P-P intervals from the rPPG signals and the R-R intervals from the reference ECG. More specifically, FIG.
- FIG. 12 is a table 1200 showing the difference between P-P intervals of a* rPPG and the R-R intervals of the ECG and comparing that with the difference between P-P intervals of G* rPPG and the R-R intervals of the ECG.
- the average error between a* rPPG and ECG for all the subjects is 41.4 ms, while the average error between G* rPPG and ECG is 95.9 ms.
- FIG. 13 is a schematic diagram representation of a computer system 1300 that could be employed in any of the above embodiments for monitoring of rPPG in a converted color space.
- the computer system 1300 is configured to execute instructions from an exemplary computer-readable medium to perform these and/or any of the functions or processing described herein.
- the computer system 1300 may be connected (e.g., networked) to other machines in a LAN, an intranet, an extranet, or the Internet. While only a single processing device 1302 is illustrated, the term “device” shall also be taken to include any collection of devices that individually or jointly execute a set (or multiple sets) of instructions to perform any one or more of the methodologies discussed herein.
- the computer system 1300 may be or include a circuit or circuits implemented in or one an electronic board, such as a printed circuit board (PCB), a server, a personal computer, a desktop computer, a laptop computer, a personal digital assistant (PDA), a computing pad, a mobile device, or any other device, and may represent, for example, a server or a computer associated with a user.
- PCB printed circuit board
- PDA personal digital assistant
- the exemplary computer system 1300 in this embodiment includes a processing device or processor 1302 , a main memory 1304 (e.g., read-only memory (ROM), flash memory, dynamic random access memory (DRAM), such as synchronous DRAM (SDRAM), etc.), and a static memory 1306 (e.g., flash memory, static random access memory (SRAM), etc.), which may communicate with each other via a data bus 1308 .
- the processing device 1302 may be connected to the main memory 1304 and/or static memory 1306 directly or via some other connectivity means.
- the processing device 1302 may be a controller, and the main memory 1304 or static memory 1306 may be any type of memory.
- the processing device 1302 may represent one or more general-purpose processing devices, such as a microprocessor, central processing unit, or the like. More particularly, the processing device 1302 may be a complex instruction set computing (CISC) microprocessor, a reduced instruction set computing (RISC) microprocessor, a very long instruction word (VLIW) microprocessor, a processor implementing other instruction sets, or other processors implementing a combination of instruction sets. In certain embodiments, the processing device 1302 may represent one or more application-specific processing devices, such as an application-specific integrated circuit (ASIC). The processing device 1302 is configured to execute processing logic embodied in instructions for performing the operations and steps discussed herein.
- CISC complex instruction set computing
- RISC reduced instruction set computing
- VLIW very long instruction word
- ASIC application-specific integrated circuit
- the computer system 1300 may further include a network interface device 1310 .
- the computer system 1300 also may or may not include an input 1312 , configured to receive input and selections to be communicated to the computer system 1300 when executing instructions.
- the computer system 1300 also may or may not include an output 1314 (including but not limited to a display, a video display unit (e.g., a liquid crystal display (LCD) or a cathode ray tube (CRT))), an alphanumeric input device (e.g., a keyboard), and/or a cursor control device (e.g., a mouse).
- a display e.g., a liquid crystal display (LCD) or a cathode ray tube (CRT)
- an alphanumeric input device e.g., a keyboard
- a cursor control device e.g., a mouse
- the computer system 1300 may or may not include a data storage device that includes instructions 1316 stored in a computer readable medium 1318 .
- the instructions 1316 may also reside, completely or at least partially, within the main memory 1304 and/or within the processing device 1302 during execution thereof by the computer system 1300 , the main memory 1304 and the processing device 1302 also constituting computer-readable medium.
- the instructions 1316 may further be transmitted or received over a network 1320 via the network interface device 1310 .
- While the computer readable medium 1318 is shown in an exemplary embodiment to be a single medium, the term “computer readable medium” should be taken to include a single medium or multiple media (e.g., a centralized or distributed database, and/or associated caches and servers) that store the one or more sets of instructions.
- the term “computer readable medium” shall also be taken to include any medium that is capable of storing, encoding, or carrying a set of instructions for execution by the processing device and that cause the processing device to perform any one or more of the methodologies of the embodiments disclosed herein.
- the term “computer readable medium” shall accordingly be taken to include, but not be limited to, solid-state memories, optical medium, and magnetic medium.
Landscapes
- Engineering & Computer Science (AREA)
- Health & Medical Sciences (AREA)
- Physics & Mathematics (AREA)
- Life Sciences & Earth Sciences (AREA)
- General Physics & Mathematics (AREA)
- Theoretical Computer Science (AREA)
- Computer Vision & Pattern Recognition (AREA)
- General Health & Medical Sciences (AREA)
- Medical Informatics (AREA)
- Veterinary Medicine (AREA)
- Surgery (AREA)
- Public Health (AREA)
- Molecular Biology (AREA)
- Biophysics (AREA)
- Pathology (AREA)
- Heart & Thoracic Surgery (AREA)
- Biomedical Technology (AREA)
- Animal Behavior & Ethology (AREA)
- Cardiology (AREA)
- Physiology (AREA)
- Radiology & Medical Imaging (AREA)
- Quality & Reliability (AREA)
- Nuclear Medicine, Radiotherapy & Molecular Imaging (AREA)
- Multimedia (AREA)
- Hematology (AREA)
- Pulmonology (AREA)
- Signal Processing (AREA)
- Measuring And Recording Apparatus For Diagnosis (AREA)
- Measuring Pulse, Heart Rate, Blood Pressure Or Blood Flow (AREA)
Abstract
Description
where I(i,j) is the intensity at pixel (i,j), std(I(i,j)) is standard deviation and mean(I(i,j)) is the mean intensity of the ROI. Since r in Eq. 1 measures the roughness of an area, a reduction in the value of r corresponds to increased uniformity of the area.
where Rnorm, Gnorm, and Bnorm denote the three channels after normalization by (R+G+B). See Wang, S.-J., et al., Micro-Expression Recognition Using Color Spaces, IEEE Transactions on Image Processing, 2015, 24(12): p. 6034-6047, the disclosure of which is hereby incorporated herein by reference in its entirety. The normalization helps reduce the illumination non-uniformity. The channels of CIELab can be calculated as,
where Xn, Yn, and Zn are the CIE XYZ tristimulus values of the reference white point, and
where Ŝ(f) is the spectrum of the pulse signal (f is frequency), Ut(f) is a binary template window, which is 1 within two frequency windows (one around the fundamental frequency (fHR) ([fHR−0.2, fHR+0.2]), and the other around the first harmonics ([2fHR−0.2, 2fHR+0.2])), and 0 outside of the two frequency windows. See de Haan, G. and V. Jeanne, Robust Pulse Rate From Chrominance-Based rPPG, IEEE Transactions on Biomedical Engineering, 2013, 60(10): p. 2878-2886, the disclosure of which is hereby incorporated herein by reference in its entirety. The SNR analysis results for all 17 subjects are summarized in table 900 in
Claims (19)
Priority Applications (1)
| Application Number | Priority Date | Filing Date | Title |
|---|---|---|---|
| US16/335,480 US11229372B2 (en) | 2016-09-21 | 2017-09-21 | Systems and methods for computer monitoring of remote photoplethysmography based on chromaticity in a converted color space |
Applications Claiming Priority (3)
| Application Number | Priority Date | Filing Date | Title |
|---|---|---|---|
| US201662397530P | 2016-09-21 | 2016-09-21 | |
| PCT/US2017/052744 WO2018057753A1 (en) | 2016-09-21 | 2017-09-21 | Systems and methods for computer monitoring of remote photoplethysmography based on chromaticity in a converted color space |
| US16/335,480 US11229372B2 (en) | 2016-09-21 | 2017-09-21 | Systems and methods for computer monitoring of remote photoplethysmography based on chromaticity in a converted color space |
Publications (2)
| Publication Number | Publication Date |
|---|---|
| US20190239761A1 US20190239761A1 (en) | 2019-08-08 |
| US11229372B2 true US11229372B2 (en) | 2022-01-25 |
Family
ID=61690033
Family Applications (1)
| Application Number | Title | Priority Date | Filing Date |
|---|---|---|---|
| US16/335,480 Active US11229372B2 (en) | 2016-09-21 | 2017-09-21 | Systems and methods for computer monitoring of remote photoplethysmography based on chromaticity in a converted color space |
Country Status (2)
| Country | Link |
|---|---|
| US (1) | US11229372B2 (en) |
| WO (1) | WO2018057753A1 (en) |
Cited By (3)
| Publication number | Priority date | Publication date | Assignee | Title |
|---|---|---|---|---|
| US12039764B2 (en) | 2021-02-19 | 2024-07-16 | SafeTogether Limited Liability Company | Multimodal diagnosis system, method and apparatus |
| WO2025019919A1 (en) * | 2023-07-27 | 2025-01-30 | Copacabana Tecnologia Da Informação Ltda | System capable of assessing blood pressure, oximetry and heart rate |
| WO2025042318A1 (en) * | 2023-08-24 | 2025-02-27 | Detectivio Ab | Non-contact oxygen saturation estimation |
Families Citing this family (26)
| Publication number | Priority date | Publication date | Assignee | Title |
|---|---|---|---|---|
| US20140276104A1 (en) | 2013-03-14 | 2014-09-18 | Nongjian Tao | System and method for non-contact monitoring of physiological parameters |
| US10078795B2 (en) | 2014-08-11 | 2018-09-18 | Nongjian Tao | Systems and methods for non-contact tracking and analysis of physical activity using imaging |
| US10413226B2 (en) | 2015-11-09 | 2019-09-17 | Arizona Board Of Regents On Behalf Of Arizona State University | Noncontact monitoring of blood oxygen saturation using camera |
| US11045095B2 (en) | 2016-03-11 | 2021-06-29 | Arizona Board Of Regents On Behalf Of Arizona State University | Systems and methods for non-contact monitoring of ballistocardiogram, photoplethysmogram, blood pressure and abnormal heart rhythm |
| WO2018057753A1 (en) | 2016-09-21 | 2018-03-29 | Arizona Board Of Regents On Behalf Of Arizona State University | Systems and methods for computer monitoring of remote photoplethysmography based on chromaticity in a converted color space |
| US11576590B2 (en) | 2017-03-13 | 2023-02-14 | Arizona Board Of Regents On Behalf Of Arizona State University | Imaging-based spirometry systems and methods |
| WO2019023320A1 (en) | 2017-07-25 | 2019-01-31 | Arizona Board Of Regents On Behalf Of Arizona State University | Rapid antibiotic susceptibility testing by tracking sub-micron scale motion of single bacterial cells |
| US11293875B2 (en) | 2017-09-27 | 2022-04-05 | Arizona Board Of Regents On Behalf Of Arizona State University | Method and apparatus for continuous gas monitoring using micro-colorimetric sensing and optical tracking of color spatial distribution |
| TWI637354B (en) * | 2017-10-23 | 2018-10-01 | 緯創資通股份有限公司 | Image detection method and image detection device for determining postures of user |
| US12056870B2 (en) * | 2018-05-16 | 2024-08-06 | Mitsubishi Electric Research Laboratories, Inc. | System and method for remote measurements of vital signs of a person in a volatile environment |
| EP3581091A1 (en) * | 2018-06-12 | 2019-12-18 | Koninklijke Philips N.V. | System and method for determining at least one vital sign of a subject |
| US11480541B2 (en) | 2018-09-26 | 2022-10-25 | Arizona Board Of Regents On Behalf Of Arizona State University | Optical imaging of single molecule size, charge, mobility, binding and conformational change |
| JP7299726B2 (en) * | 2019-03-20 | 2023-06-28 | キヤノン株式会社 | Skin color measuring device and program |
| US11543345B2 (en) | 2019-04-25 | 2023-01-03 | Arizona Board Of Regents On Behalf Of Arizona State University | Chemical complementary metal-oxide semiconductor (CCMOS) colorimetric sensors for multiplex detection and analysis |
| CN111860079B (en) * | 2019-04-30 | 2024-05-14 | 北京嘀嘀无限科技发展有限公司 | Living body image detection method and device and electronic equipment |
| EP3820133A1 (en) | 2019-11-06 | 2021-05-12 | Koninklijke Philips N.V. | A system for performing image motion compensation |
| KR102416179B1 (en) * | 2020-05-26 | 2022-07-06 | 주식회사 이모코그 | Device and method for camera based photoplethysmogram estimation using chrominance |
| US20240005505A1 (en) * | 2020-10-29 | 2024-01-04 | Hewlett-Packard Development Company, L.P. | Neural network-based heart rate determinations |
| CN112788200B (en) * | 2020-12-04 | 2022-11-01 | 光大科技有限公司 | Method and device for determining frequency spectrum information, storage medium and electronic device |
| CN114973043A (en) * | 2021-02-20 | 2022-08-30 | 上海交通大学 | Video-based motion robust heart pulse peak-to-peak interval measurement method and device |
| IT202100012380A1 (en) * | 2021-05-13 | 2022-11-13 | Hero S R L | METHOD FOR THE DETECTION OF VITAL PARAMETERS THROUGH VIDEO RECORDS |
| US12482294B2 (en) * | 2022-11-04 | 2025-11-25 | Xim Limited | Method, computer software, non-transitory storage medium, apparatus and system for performing a measurement of a physiological parameter of a person from a series of images |
| US12327642B2 (en) * | 2023-02-18 | 2025-06-10 | Veyetals o/a MarkiTech | System and method for providing telehealth services using touchless vitals and AI-optimixed assessment in real-time |
| US20240406550A1 (en) * | 2023-05-31 | 2024-12-05 | Microsoft Technology Licensing, Llc | Front-end image preprocessing |
| TWI874153B (en) * | 2024-03-06 | 2025-02-21 | 國立成功大學 | Method and detection system for identifying arrhythmias through reconstructing electrocardiogram (ecg) signals |
| CN120616480B (en) * | 2025-08-13 | 2025-10-17 | 中国民用航空飞行学院 | A non-contact athlete physiological state assessment method, system and medium based on feature fusion |
Citations (31)
| Publication number | Priority date | Publication date | Assignee | Title |
|---|---|---|---|---|
| US7018338B2 (en) | 2001-09-28 | 2006-03-28 | Csem Centre Suisse D'electronique Et De Microtechnique Sa | Method and device for pulse rate detection |
| WO2008021614A2 (en) | 2006-08-18 | 2008-02-21 | Arizona Board Of Regents For And On Behalf Of Arizona State University | Coded particle arrays for high throughput analyte analysis |
| US7336982B2 (en) | 2003-07-07 | 2008-02-26 | Sun Kook Yoo | Photoplethysmography (PPG) device and the method thereof |
| WO2009132262A1 (en) | 2008-04-25 | 2009-10-29 | Arizona Board Of Regents And On Behalf Of Arizona State University | Surface impedance imaging methods and apparatuses |
| WO2010030874A1 (en) | 2008-09-11 | 2010-03-18 | Arizona Board Of Regents For And On Behalf Of Arizona State University | Systems and methods for integrated detection |
| WO2010036940A2 (en) | 2008-09-25 | 2010-04-01 | Arizona Board Of Regents And On Behalf Of Arizona State University | Apparatus and method for sensing change in environmental conditions |
| WO2010141610A1 (en) | 2009-06-05 | 2010-12-09 | Arizona Board Of Regents Acting For And On Behalf Of Arizona State University | Integrated optoelectrochemical sensor for nitrogen oxides in gaseous samples |
| WO2011140239A2 (en) | 2010-05-05 | 2011-11-10 | The Arizona Board Of Regents For And On Behalf Of Arizona State University | Sensing materials for selective and sensitive detection of hydrocarbons and acids |
| US20110293179A1 (en) * | 2010-05-31 | 2011-12-01 | Mert Dikmen | Systems and methods for illumination correction of an image |
| WO2013019843A2 (en) | 2011-08-02 | 2013-02-07 | Arizona Board Of Regents Acting For And On Behalf Of Arizona State University | Metabolic analyzer |
| US20130271591A1 (en) | 2011-01-05 | 2013-10-17 | Koninklijke Philips Electronics N.V. | Device and method for extracting information from characteristic signals |
| WO2014020463A1 (en) | 2012-07-30 | 2014-02-06 | Koninklijke Philips N.V. | Device and method for extracting physiological information |
| WO2014116604A1 (en) | 2013-01-22 | 2014-07-31 | Arizona Board Of Regents, A Body Corporate Of The State Of Arizona, Acting For And On Behalf Of Arizona State University | Portable metabolic analyzer system |
| US20140276104A1 (en) | 2013-03-14 | 2014-09-18 | Nongjian Tao | System and method for non-contact monitoring of physiological parameters |
| US20140275832A1 (en) | 2013-03-14 | 2014-09-18 | Koninklijke Philips N.V. | Device and method for obtaining vital sign information of a subject |
| WO2015102902A2 (en) | 2014-01-02 | 2015-07-09 | Arizona Board Of Regents On Behalf Of Arizona State University | Specific, reversible, and wide-dynamic range sensor for real time detection of carbon dioxide |
| WO2015103459A1 (en) | 2014-01-03 | 2015-07-09 | Arizona Board Of Regents On Behalf Of Arizona State University | Plasmonic imaging and detection of single dna molecules |
| EP2960862A1 (en) | 2014-06-24 | 2015-12-30 | Vicarious Perception Technologies B.V. | A method for stabilizing vital sign measurements using parametric facial appearance models via remote sensors |
| US9615749B2 (en) | 2011-08-22 | 2017-04-11 | Isis Innovation Limited | Remote monitoring of vital signs |
| WO2017156084A2 (en) | 2016-03-11 | 2017-09-14 | Arizona Board Of Regents On Behalf Of Arizona State University | Systems and methods for non-contact monitoring of ballistocardiogram, photoplethysmogram, blood pressure and abnormal heart rhythm |
| US9909993B2 (en) | 2014-12-15 | 2018-03-06 | Arizona Board Of Regents On Behalf Of Arizona State University | Label-free detection of small and large molecule interactions, and activities in biological systems |
| WO2018057753A1 (en) | 2016-09-21 | 2018-03-29 | Arizona Board Of Regents On Behalf Of Arizona State University | Systems and methods for computer monitoring of remote photoplethysmography based on chromaticity in a converted color space |
| EP2898477B1 (en) | 2012-09-21 | 2018-07-11 | Koninklijke Philips N.V. | Motion robust vital signal monitoring |
| US10078795B2 (en) | 2014-08-11 | 2018-09-18 | Nongjian Tao | Systems and methods for non-contact tracking and analysis of physical activity using imaging |
| WO2018170009A1 (en) | 2017-03-13 | 2018-09-20 | Arizona Board Of Regents On Behalf Of Arizonia State University | Imaging-based spirometry systems and methods |
| WO2018213790A2 (en) | 2017-05-18 | 2018-11-22 | Arizona Board Of Regents On Behaft Of Arizona State University | Apparatus for analyzing and detecting interactions and reactions of molecules |
| US10222372B2 (en) | 2015-08-03 | 2019-03-05 | Arizona Board Of Regents On Behalf Of Arizona State University | Antibiotic susceptibility testing via plasmonic imaging and tracking |
| US20190094146A1 (en) | 2017-09-27 | 2019-03-28 | Arizona Board of Regents on behalf of Arizona Stat e University | Method and apparatus for continuous gas monitoring using micro-colorimetric sensing and optical tracking of color spatial distribution |
| WO2019136097A1 (en) | 2018-01-02 | 2019-07-11 | Arizona Board Of Regents On Behalf Of Arizona State University | Method and system for assessing metabolic rate and maintaining indoor air quality and efficient ventilation energy use with passive environmental sensors |
| US10398353B2 (en) * | 2016-02-19 | 2019-09-03 | Covidien Lp | Systems and methods for video-based monitoring of vital signs |
| US10413226B2 (en) | 2015-11-09 | 2019-09-17 | Arizona Board Of Regents On Behalf Of Arizona State University | Noncontact monitoring of blood oxygen saturation using camera |
-
2017
- 2017-09-21 WO PCT/US2017/052744 patent/WO2018057753A1/en not_active Ceased
- 2017-09-21 US US16/335,480 patent/US11229372B2/en active Active
Patent Citations (47)
| Publication number | Priority date | Publication date | Assignee | Title |
|---|---|---|---|---|
| US7018338B2 (en) | 2001-09-28 | 2006-03-28 | Csem Centre Suisse D'electronique Et De Microtechnique Sa | Method and device for pulse rate detection |
| US7336982B2 (en) | 2003-07-07 | 2008-02-26 | Sun Kook Yoo | Photoplethysmography (PPG) device and the method thereof |
| WO2008021614A2 (en) | 2006-08-18 | 2008-02-21 | Arizona Board Of Regents For And On Behalf Of Arizona State University | Coded particle arrays for high throughput analyte analysis |
| WO2009132262A1 (en) | 2008-04-25 | 2009-10-29 | Arizona Board Of Regents And On Behalf Of Arizona State University | Surface impedance imaging methods and apparatuses |
| US8416417B2 (en) | 2008-04-25 | 2013-04-09 | Arizona Board Of Regents For And On Behalf Of Arizona State University | Surface impedance imaging methods and apparatuses |
| WO2010030874A1 (en) | 2008-09-11 | 2010-03-18 | Arizona Board Of Regents For And On Behalf Of Arizona State University | Systems and methods for integrated detection |
| US8545683B2 (en) | 2008-09-11 | 2013-10-01 | Arizona Board Of Regent For And On Behalf of Arizona State University | Systems and methods for integrated detection |
| WO2010036940A2 (en) | 2008-09-25 | 2010-04-01 | Arizona Board Of Regents And On Behalf Of Arizona State University | Apparatus and method for sensing change in environmental conditions |
| WO2010141610A1 (en) | 2009-06-05 | 2010-12-09 | Arizona Board Of Regents Acting For And On Behalf Of Arizona State University | Integrated optoelectrochemical sensor for nitrogen oxides in gaseous samples |
| US9581561B2 (en) | 2009-06-05 | 2017-02-28 | Arizona Board Of Regents For And On Behalf Of Arizona State University | Integrated optoelectrochemical sensor for nitrogen oxides in gaseous samples |
| US8668874B2 (en) | 2009-06-05 | 2014-03-11 | Arizona Board Of Regents For And On Behalf Of Arizona State University | Integrated optoelectrochemical sensor for nitrogen oxides in gaseous samples |
| US20130115137A1 (en) | 2010-05-05 | 2013-05-09 | The Arizona Board Of Regents For And On Behlaf Of Arizona State University | Sensing materials for selective and sensitive detection of hydrocarbons and acids |
| WO2011140239A2 (en) | 2010-05-05 | 2011-11-10 | The Arizona Board Of Regents For And On Behalf Of Arizona State University | Sensing materials for selective and sensitive detection of hydrocarbons and acids |
| US20110293179A1 (en) * | 2010-05-31 | 2011-12-01 | Mert Dikmen | Systems and methods for illumination correction of an image |
| US20130271591A1 (en) | 2011-01-05 | 2013-10-17 | Koninklijke Philips Electronics N.V. | Device and method for extracting information from characteristic signals |
| US10143401B2 (en) | 2011-06-13 | 2018-12-04 | Arizona Board Of Regents Acting For And On Behalf Of Arizona State University | Metabolic analyzer |
| WO2013019843A2 (en) | 2011-08-02 | 2013-02-07 | Arizona Board Of Regents Acting For And On Behalf Of Arizona State University | Metabolic analyzer |
| US9615749B2 (en) | 2011-08-22 | 2017-04-11 | Isis Innovation Limited | Remote monitoring of vital signs |
| WO2014020463A1 (en) | 2012-07-30 | 2014-02-06 | Koninklijke Philips N.V. | Device and method for extracting physiological information |
| EP2898477B1 (en) | 2012-09-21 | 2018-07-11 | Koninklijke Philips N.V. | Motion robust vital signal monitoring |
| WO2014116604A1 (en) | 2013-01-22 | 2014-07-31 | Arizona Board Of Regents, A Body Corporate Of The State Of Arizona, Acting For And On Behalf Of Arizona State University | Portable metabolic analyzer system |
| US10078074B2 (en) | 2013-01-22 | 2018-09-18 | Arizona Board Of Regents On Behalf Of Arizona State University | Portable metabolic analyzer system |
| US20140275832A1 (en) | 2013-03-14 | 2014-09-18 | Koninklijke Philips N.V. | Device and method for obtaining vital sign information of a subject |
| US20140276104A1 (en) | 2013-03-14 | 2014-09-18 | Nongjian Tao | System and method for non-contact monitoring of physiological parameters |
| US20180140255A1 (en) | 2013-03-14 | 2018-05-24 | Arizona Board Of Regents On Behalf Of Arizona State University | System and method for non-contact monitoring of physiological parameters |
| US20190257802A1 (en) | 2014-01-02 | 2019-08-22 | Arizona Board Of Regents On Behalf Of Arizona State University | Specific, reversible, and wide-dynamic range sensor for real time detection of carbon dioxide |
| WO2015102902A2 (en) | 2014-01-02 | 2015-07-09 | Arizona Board Of Regents On Behalf Of Arizona State University | Specific, reversible, and wide-dynamic range sensor for real time detection of carbon dioxide |
| US10209232B2 (en) | 2014-01-02 | 2019-02-19 | Arizona Board Of Regents On Behalf Of Arizona State University | Specific, reversible, and wide-dynamic range sensor for real time detection of carbon dioxide |
| WO2015103459A1 (en) | 2014-01-03 | 2015-07-09 | Arizona Board Of Regents On Behalf Of Arizona State University | Plasmonic imaging and detection of single dna molecules |
| US10408757B2 (en) | 2014-01-03 | 2019-09-10 | Arizona Board Of Regents On Behalf Of Arizona State University | Plasmonic imaging and detection of single DNA molecules |
| EP2960862A1 (en) | 2014-06-24 | 2015-12-30 | Vicarious Perception Technologies B.V. | A method for stabilizing vital sign measurements using parametric facial appearance models via remote sensors |
| US10078795B2 (en) | 2014-08-11 | 2018-09-18 | Nongjian Tao | Systems and methods for non-contact tracking and analysis of physical activity using imaging |
| US20190325257A1 (en) | 2014-08-11 | 2019-10-24 | Nongjian Tao | Systems and Methods for Non-Contact Tracking and Analysis of Physical Activity Using Imaging |
| US9909993B2 (en) | 2014-12-15 | 2018-03-06 | Arizona Board Of Regents On Behalf Of Arizona State University | Label-free detection of small and large molecule interactions, and activities in biological systems |
| US10401298B2 (en) | 2014-12-15 | 2019-09-03 | Arizona Board Of Regents On Behalf Of Arizona State University | Label-free detection of small and large molecule interactions, and activities in biological systems |
| US10222372B2 (en) | 2015-08-03 | 2019-03-05 | Arizona Board Of Regents On Behalf Of Arizona State University | Antibiotic susceptibility testing via plasmonic imaging and tracking |
| US20190170748A1 (en) | 2015-08-03 | 2019-06-06 | Arizona Board Of Regents On Behalf Of Arizona State University | Antibiotic susceptibility testing via plasmonic imaging and tracking |
| US10413226B2 (en) | 2015-11-09 | 2019-09-17 | Arizona Board Of Regents On Behalf Of Arizona State University | Noncontact monitoring of blood oxygen saturation using camera |
| US10398353B2 (en) * | 2016-02-19 | 2019-09-03 | Covidien Lp | Systems and methods for video-based monitoring of vital signs |
| US20190082972A1 (en) | 2016-03-11 | 2019-03-21 | Arizona Board Of Regents On Behalf Of Arizona State University | Systems and methods for non-contact monitoring of ballistocardiogram, photoplethysmogram, blood pressure and abnormal heart rhythm |
| WO2017156084A2 (en) | 2016-03-11 | 2017-09-14 | Arizona Board Of Regents On Behalf Of Arizona State University | Systems and methods for non-contact monitoring of ballistocardiogram, photoplethysmogram, blood pressure and abnormal heart rhythm |
| US20190239761A1 (en) | 2016-09-21 | 2019-08-08 | Arizona Board Of Regents On Behalf Of Arizona State University | Systems and methods for computer monitoring of remote photoplethysmography based on chromaticity in a converted color space |
| WO2018057753A1 (en) | 2016-09-21 | 2018-03-29 | Arizona Board Of Regents On Behalf Of Arizona State University | Systems and methods for computer monitoring of remote photoplethysmography based on chromaticity in a converted color space |
| WO2018170009A1 (en) | 2017-03-13 | 2018-09-20 | Arizona Board Of Regents On Behalf Of Arizonia State University | Imaging-based spirometry systems and methods |
| WO2018213790A2 (en) | 2017-05-18 | 2018-11-22 | Arizona Board Of Regents On Behaft Of Arizona State University | Apparatus for analyzing and detecting interactions and reactions of molecules |
| US20190094146A1 (en) | 2017-09-27 | 2019-03-28 | Arizona Board of Regents on behalf of Arizona Stat e University | Method and apparatus for continuous gas monitoring using micro-colorimetric sensing and optical tracking of color spatial distribution |
| WO2019136097A1 (en) | 2018-01-02 | 2019-07-11 | Arizona Board Of Regents On Behalf Of Arizona State University | Method and system for assessing metabolic rate and maintaining indoor air quality and efficient ventilation energy use with passive environmental sensors |
Non-Patent Citations (37)
| Title |
|---|
| Author Unknown, "AVT PIKE F-032B/F-032C AVT PIKE F-032B/F-032C fiber," Aug. 2007, Allied Vision Technologies GMBH, 2 pages. |
| Bashkatov, A.N., et al., "Optical properties of human skin, subcutaneous and mucous tissues in the wavelength range from 400 to 2000 nm," Journal of Physics D: Applied Physics, vol. 38, No. 15, 2005, IOP Publishing Ltd., pp. 2543-2555. |
| Blackford, E.B. et al., "Effects of frame rate and image resolution on pulse rate measured using multiple camera imaging photoplethysmography," Proceedings of SPIE, vol. 9417 94172D-1, Medical Imaging 2015: Biomedical Applications in Molecular, Structural, and Functional Imaging, SPIE, 14 pages. |
| De Haan, G. et al., "Robust Pulse Rate From Chrominance-Based rPPG," IEEE Transactions on Biomedical Engineering, vol. 60, No. 10, Oct. 2013, IEEE, pp. 2878-2886. |
| Estepp, J.R. et al., "Recovering pulse rate during motion artifact with a multi-imager array for non-contact imaging photoplethysmography," 2014 IEEE International Conference on Systems, Man, and Cybernetics (SMC), Oct. 5-8, 2014, San Diego, CA, USA, IEEE, pp. 1462-1469. |
| Feng, L., et al., "Dynamic ROI based on K-means for remote photoplethysmography," 2015 IEEE International Conference on Acoustics, Speech and Signal Processing (ICASSP), Apr. 19-24, 2015, South Brisbane, Queensland, Australia, IEEE, pp. 1310-1314. |
| Feng, L., et al., "Motion Artifacts Suppression for Remote Imaging Photoplethysmography," Proceedings of the 19th International Conference on Digital Signal Processing (DSP), Aug. 20-23, 2014, IEEE, pp. 18-23. |
| Feng, L., et al., "Motion-Resistant Remote Imaging Photoplethysmography Based on the Optical Properties of Skin," IEEE Transactions on Circuits and Systems for Video Technology, vol. 25, No. 5, May 2015, IEEE, pp. 879-891. |
| Garbey, M., et al., "Contact-free measurement of cardiac pulse based on the analysis of thermal imagery," IEEE Transactions on Biomedical Engineering, vol. 54, No. 8, Aug. 2007, IEEE, pp. 1418-1426. |
| Gupta, O. et al., "Real-Time Physiological Measurement and Visualization Using a Synchronized Multi-Camera System," 2016 IEEE Conference on Computer Vision and Pattern Recognition Workshops (CVPRW), Jun. 26-Jul. 1, 2016, Las Vegas, NV, USA, IEEE Computer Society, pp. 312-319. |
| Haque, M.A., et al., "Heartbeat Rate Measurement from Facial Video," IEEE Intelligent Systems, May/Jun. 2016, pp. 40-48. |
| Hulsbusch, M. et al., "Ein bildgestütztes, funktionelles Verfahren zur optoelektronischen Erfassung der Hautperfusion," RWTH Aachen University, 2008, Aachen, Germany, p. 70. |
| International Preliminary Report on Patentability for International Patent Application No. PCT/US2017/052744, dated Apr. 4, 2019, 9 pages. |
| International Search Report and Written Opinion for International Patent Application No. PCT/US2017/052744, dated Nov. 16, 2017, 10 pages. |
| Lewandowska, M. et al., "Measuring Pulse Rate with a Webcam—a Non-contact Method for Evaluating Cardiac Activity," Proceedings of the Federated Conference on Computer Science and Information Systems (FedCSIS), Sep. 18-21, 2011, Szczecin, Poland, IEEE, pp. 405-410. |
| Lucas, B.D. et al., "An iterative image registration technique with an application to stereo vision," Proceedings of the 7th International Joint Conference on Artificial Intelligence (IJCAI), Aug. 24-28, 1981, Vancouver, British Columbia, pp. 674-679. |
| Lueangwattana, C. et al., "A Comparative Study of Video Signals for Non-contact Heart Rate Measurement," 12th International Conference on Electiical Engineering/Electronics, Computer, Telecommunications and Information Technology (ECTI-CON), Jun. 24-27, 2015, Hua Hin, Cha-am, Thailand, IEEE, 5 pages. |
| Nisar, H. et al., "Chapter 5: A Simple Non-Invasive Automated Heart Rate Monitoring System Using Facial Images," Biomedical Image Analysis and Mining Techniques for Improved Health Outcomes, 2015, IGI Global, pp. 100-122. |
| Palus, H., "Representations of colour images in different colour spaces," The Colour Image Processing Handbook, 1998, Chapman & Hall, pp. 68-90. |
| Poh, M.-Z., et al., "Non-contact, automated cardiac pulse measurements using video imaging and blind source separation," Optics Express, vol. 18, No. 10, May 2010, Optical Society of America, pp. 10762-10774. |
| Raghuram, M., et al., "On the performance of wavelets in reducing motion artifacts from photoplethysmographic signals," IEEE 2010 4th International Conference on Bioinformatics and Biomedical Engineering (iCBBE), Jun. 18-20, 2010, Chengdu, China, IEEE, 4 pages. |
| Shao, D., et al., "Noncontact Monitoring Breathing Pattern, Exhalation Flow Rate and Pulse Transit Time," IEEE Transactions on Biomedical Engineering, vol. 61, No. 11, Nov. 2014, IEEE, pp. 2760-2767. |
| Shao, D., et al., "Noncontact Monitoring of Blood Oxygen Saturation Using Camera and Dual-Wavelength Imaging System," IEEE Transactions on Biomedical Engineering, vol. 63, No. 6, Jun. 2016, IEEE, 8 pages. |
| Shi, J. et al., "Good Features to Track," IEEE Conference on Computer Vision and Pattern Recognition (CVPR94), Jun. 1994, Seattle, WA, USA, IEEE, 8 pages. |
| Sinex, J.E., "Pulse oximetry: Principles and limitations," The American Journal of Emergency Medicine, vol. 17, No. 1, Jan. 1999, W.B. Saunders Company, pp. 59-66. |
| Sun, Y., et al., "Motion-compensated noncontact imaging photoplethysmography to monitor cardiorespiratory status during exercise," Journal of Biomedical Optics, vol. 16, No. 7, Jul. 2011, SPIE, pp. 077010-077010-9. |
| Sun, Y., et al., "Noncontact imaging photoplethysmography to effectively access pulse rate variability," Journal of Biomedical Optics, vol. 18, No. 6, Jun. 2013, SPIE, pp. 061205-061205. |
| Tkalcic, M. et al., "Colour spaces—perceptual, historical and applicational background," The IEEE Region 8 EUROCON 2003, Computer as a Tool, Sep. 2003, IEEE, 5 pages. |
| Tomasi, C. et al., "Shape and Motion from Image Streams: a Factorization Method—Part 3—Detection and Tracking of Point Features," Apr. 1991, School of Computer Science, Carnegie Mellon University, Pittsburgh, PA, 38 pages. |
| Tulyakov, S., et al., "Self-adaptive matrix completion for heart rate estimation from face videos under realistic conditions," Proceedings of the IEEE Conference on Computer Vision and Pattern Recognition, 2016, pp. 2396-2404. |
| U.S. Appl. No. 16/490,749. |
| U.S. Appl. No. 16/526,883. |
| U.S. Appl. No. 16/584,120. |
| Verkruysse, W. et al., "Remote plethysmographic imaging using ambient light," Optics Express, vol. 16, No. 26, Dec. 2008, Optical Society of America, pp. 21434-21445. |
| Viola, P. et al., "Rapid Object Detection using a Boosted Cascade of Simple Features," Proceedings of the 2001 IEEE Computer Society Conference on Computer Vision and Pattern Recognition (CVPR), 2001, IEEE, pp. I-511-I-518. |
| Wang, S.-J., et al., "Micro-Expression Recognition Using Color Spaces," IEEE Transactions on Image Processing, vol. 24, No. 12, Dec. 2015, IEEE, pp. 6034-6047. |
| Yam, K.L. et al., "A simple digital imaging method for measuring and analyzing color of food surfaces," Journal of Food Engineering, vol. 61, No. 1, 2004, Elsevier Ltd., pp. 137-142. |
Cited By (4)
| Publication number | Priority date | Publication date | Assignee | Title |
|---|---|---|---|---|
| US12039764B2 (en) | 2021-02-19 | 2024-07-16 | SafeTogether Limited Liability Company | Multimodal diagnosis system, method and apparatus |
| US12211243B2 (en) | 2021-02-19 | 2025-01-28 | Xgenesis | Multimodal diagnosis system, method and apparatus |
| WO2025019919A1 (en) * | 2023-07-27 | 2025-01-30 | Copacabana Tecnologia Da Informação Ltda | System capable of assessing blood pressure, oximetry and heart rate |
| WO2025042318A1 (en) * | 2023-08-24 | 2025-02-27 | Detectivio Ab | Non-contact oxygen saturation estimation |
Also Published As
| Publication number | Publication date |
|---|---|
| WO2018057753A1 (en) | 2018-03-29 |
| US20190239761A1 (en) | 2019-08-08 |
Similar Documents
| Publication | Publication Date | Title |
|---|---|---|
| US11229372B2 (en) | Systems and methods for computer monitoring of remote photoplethysmography based on chromaticity in a converted color space | |
| EP3664704B1 (en) | Device, system and method for determining a physiological parameter of a subject | |
| Yang et al. | Motion robust remote photoplethysmography in CIELab color space | |
| Wang et al. | Robust heart rate from fitness videos | |
| US20200178809A1 (en) | Device, system and method for determining a physiological parameter of a subject | |
| Wang et al. | A novel algorithm for remote photoplethysmography: Spatial subspace rotation | |
| CN103429144B (en) | For the apparatus and method from feature signal extraction information | |
| KR102285999B1 (en) | Heart rate estimation based on facial color variance and micro-movement | |
| Bobbia et al. | Remote photoplethysmography based on implicit living skin tissue segmentation | |
| CN109820499B (en) | High anti-interference heart rate detection method based on video, electronic equipment and storage medium | |
| Feng et al. | Motion artifacts suppression for remote imaging photoplethysmography | |
| US20240041334A1 (en) | Systems and methods for measuring physiologic vital signs and biomarkers using optical data | |
| Wang et al. | Quality metric for camera-based pulse rate monitoring in fitness exercise | |
| Fallet et al. | Imaging photoplethysmography: What are the best locations on the face to estimate heart rate? | |
| Bousefsaf et al. | Automatic selection of webcam photoplethysmographic pixels based on lightness criteria | |
| Wedekind et al. | Automated identification of cardiac signals after blind source separation for camera-based photoplethysmography | |
| WO2018179150A1 (en) | Heart rate estimation apparatus | |
| Cho et al. | Reduction of motion artifacts from remote photoplethysmography using adaptive noise cancellation and modified HSI model | |
| Gupta et al. | A motion and illumination resistant non-contact method using undercomplete independent component analysis and Levenberg-Marquardt algorithm | |
| Hu et al. | Illumination robust heart-rate extraction from single-wavelength infrared camera using spatial-channel expansion | |
| Liu et al. | A robust non-contact heart rate estimation from facial video based on a non-parametric signal extraction model | |
| Panigrahi et al. | Non-contact HR extraction from different color spaces using RGB camera | |
| Li et al. | Comparison of region of interest segmentation methods for video-based heart rate measurements | |
| Macwan et al. | Remote photoplethysmography measurement using constrained ica | |
| Cheng et al. | Motion-robust anterior–posterior imaging ballistocardiography for non-contact heart rate measurements |
Legal Events
| Date | Code | Title | Description |
|---|---|---|---|
| FEPP | Fee payment procedure |
Free format text: ENTITY STATUS SET TO UNDISCOUNTED (ORIGINAL EVENT CODE: BIG.); ENTITY STATUS OF PATENT OWNER: SMALL ENTITY |
|
| FEPP | Fee payment procedure |
Free format text: ENTITY STATUS SET TO SMALL (ORIGINAL EVENT CODE: SMAL); ENTITY STATUS OF PATENT OWNER: SMALL ENTITY |
|
| AS | Assignment |
Owner name: ARIZONA BOARD OF REGENTS ON BEHALF OF ARIZONA STATE UNIVERSITY, ARIZONA Free format text: ASSIGNMENT OF ASSIGNORS INTEREST;ASSIGNORS:YANG, YUTING;TAO, NONGJIAN;SIGNING DATES FROM 20190331 TO 20190411;REEL/FRAME:048898/0856 Owner name: ARIZONA BOARD OF REGENTS ON BEHALF OF ARIZONA STAT Free format text: ASSIGNMENT OF ASSIGNORS INTEREST;ASSIGNORS:YANG, YUTING;TAO, NONGJIAN;SIGNING DATES FROM 20190331 TO 20190411;REEL/FRAME:048898/0856 |
|
| STPP | Information on status: patent application and granting procedure in general |
Free format text: APPLICATION DISPATCHED FROM PREEXAM, NOT YET DOCKETED |
|
| STPP | Information on status: patent application and granting procedure in general |
Free format text: DOCKETED NEW CASE - READY FOR EXAMINATION |
|
| STPP | Information on status: patent application and granting procedure in general |
Free format text: NON FINAL ACTION MAILED |
|
| STPP | Information on status: patent application and granting procedure in general |
Free format text: NON FINAL ACTION MAILED |
|
| STPP | Information on status: patent application and granting procedure in general |
Free format text: RESPONSE TO NON-FINAL OFFICE ACTION ENTERED AND FORWARDED TO EXAMINER |
|
| STPP | Information on status: patent application and granting procedure in general |
Free format text: FINAL REJECTION MAILED |
|
| STPP | Information on status: patent application and granting procedure in general |
Free format text: ADVISORY ACTION MAILED |
|
| STPP | Information on status: patent application and granting procedure in general |
Free format text: DOCKETED NEW CASE - READY FOR EXAMINATION |
|
| STPP | Information on status: patent application and granting procedure in general |
Free format text: NOTICE OF ALLOWANCE MAILED -- APPLICATION RECEIVED IN OFFICE OF PUBLICATIONS |
|
| STPP | Information on status: patent application and granting procedure in general |
Free format text: AWAITING TC RESP., ISSUE FEE NOT PAID |
|
| STPP | Information on status: patent application and granting procedure in general |
Free format text: NOTICE OF ALLOWANCE MAILED -- APPLICATION RECEIVED IN OFFICE OF PUBLICATIONS |
|
| STPP | Information on status: patent application and granting procedure in general |
Free format text: NOTICE OF ALLOWANCE MAILED -- APPLICATION RECEIVED IN OFFICE OF PUBLICATIONS |
|
| STPP | Information on status: patent application and granting procedure in general |
Free format text: PUBLICATIONS -- ISSUE FEE PAYMENT RECEIVED |
|
| STPP | Information on status: patent application and granting procedure in general |
Free format text: PUBLICATIONS -- ISSUE FEE PAYMENT VERIFIED |
|
| STCF | Information on status: patent grant |
Free format text: PATENTED CASE |
|
| MAFP | Maintenance fee payment |
Free format text: PAYMENT OF MAINTENANCE FEE, 4TH YR, SMALL ENTITY (ORIGINAL EVENT CODE: M2551); ENTITY STATUS OF PATENT OWNER: SMALL ENTITY Year of fee payment: 4 |