US11221338B2 - Method for evaluating data from mass spectrometry, mass spectrometry method, and MALDI-TOF mass spectrometer - Google Patents
Method for evaluating data from mass spectrometry, mass spectrometry method, and MALDI-TOF mass spectrometer Download PDFInfo
- Publication number
- US11221338B2 US11221338B2 US16/342,088 US201716342088A US11221338B2 US 11221338 B2 US11221338 B2 US 11221338B2 US 201716342088 A US201716342088 A US 201716342088A US 11221338 B2 US11221338 B2 US 11221338B2
- Authority
- US
- United States
- Prior art keywords
- mass
- defects
- measured
- expected
- peptide
- Prior art date
- Legal status (The legal status is an assumption and is not a legal conclusion. Google has not performed a legal analysis and makes no representation as to the accuracy of the status listed.)
- Active, expires
Links
- 238000000034 method Methods 0.000 title claims abstract description 33
- 238000004949 mass spectrometry Methods 0.000 title claims abstract description 26
- 238000001840 matrix-assisted laser desorption--ionisation time-of-flight mass spectrometry Methods 0.000 title claims abstract description 17
- 230000007547 defect Effects 0.000 claims abstract description 108
- 108090000765 processed proteins & peptides Proteins 0.000 claims abstract description 90
- 102000004196 processed proteins & peptides Human genes 0.000 claims abstract description 26
- 238000004458 analytical method Methods 0.000 claims abstract description 17
- 239000012472 biological sample Substances 0.000 claims abstract description 13
- 238000001228 spectrum Methods 0.000 claims description 81
- 238000005259 measurement Methods 0.000 claims description 34
- 238000010586 diagram Methods 0.000 claims description 15
- 230000003595 spectral effect Effects 0.000 claims description 9
- 238000000816 matrix-assisted laser desorption--ionisation Methods 0.000 claims description 3
- 230000000007 visual effect Effects 0.000 claims description 2
- 230000002950 deficient Effects 0.000 description 10
- 238000000638 solvent extraction Methods 0.000 description 10
- 238000004364 calculation method Methods 0.000 description 6
- 238000011161 development Methods 0.000 description 5
- 239000011159 matrix material Substances 0.000 description 5
- 239000000523 sample Substances 0.000 description 5
- 238000012937 correction Methods 0.000 description 4
- 150000002500 ions Chemical class 0.000 description 4
- 239000000203 mixture Substances 0.000 description 4
- 238000010606 normalization Methods 0.000 description 4
- OKTJSMMVPCPJKN-UHFFFAOYSA-N Carbon Chemical compound [C] OKTJSMMVPCPJKN-UHFFFAOYSA-N 0.000 description 3
- 102000002068 Glycopeptides Human genes 0.000 description 3
- 108010015899 Glycopeptides Proteins 0.000 description 3
- 239000012482 calibration solution Substances 0.000 description 3
- 229910052799 carbon Inorganic materials 0.000 description 3
- 238000001914 filtration Methods 0.000 description 3
- 238000012545 processing Methods 0.000 description 3
- 239000000126 substance Substances 0.000 description 3
- 238000012800 visualization Methods 0.000 description 3
- IJGRMHOSHXDMSA-UHFFFAOYSA-N Atomic nitrogen Chemical compound N#N IJGRMHOSHXDMSA-UHFFFAOYSA-N 0.000 description 2
- 150000001413 amino acids Chemical class 0.000 description 2
- 238000011088 calibration curve Methods 0.000 description 2
- 229910052729 chemical element Inorganic materials 0.000 description 2
- 239000000470 constituent Substances 0.000 description 2
- 238000003795 desorption Methods 0.000 description 2
- 238000011156 evaluation Methods 0.000 description 2
- 238000009472 formulation Methods 0.000 description 2
- 230000010354 integration Effects 0.000 description 2
- 230000003993 interaction Effects 0.000 description 2
- 238000001819 mass spectrum Methods 0.000 description 2
- 239000002207 metabolite Substances 0.000 description 2
- 238000000955 peptide mass fingerprinting Methods 0.000 description 2
- 238000005070 sampling Methods 0.000 description 2
- 239000000243 solution Substances 0.000 description 2
- 238000012935 Averaging Methods 0.000 description 1
- 238000012952 Resampling Methods 0.000 description 1
- NINIDFKCEFEMDL-UHFFFAOYSA-N Sulfur Chemical compound [S] NINIDFKCEFEMDL-UHFFFAOYSA-N 0.000 description 1
- 230000001133 acceleration Effects 0.000 description 1
- 125000004429 atom Chemical group 0.000 description 1
- QVGXLLKOCUKJST-UHFFFAOYSA-N atomic oxygen Chemical compound [O] QVGXLLKOCUKJST-UHFFFAOYSA-N 0.000 description 1
- 150000001720 carbohydrates Chemical class 0.000 description 1
- 235000014633 carbohydrates Nutrition 0.000 description 1
- 230000015556 catabolic process Effects 0.000 description 1
- 150000001875 compounds Chemical class 0.000 description 1
- 238000007796 conventional method Methods 0.000 description 1
- 238000006073 displacement reaction Methods 0.000 description 1
- 230000005684 electric field Effects 0.000 description 1
- 238000005516 engineering process Methods 0.000 description 1
- 235000013305 food Nutrition 0.000 description 1
- 239000012634 fragment Substances 0.000 description 1
- 229910052739 hydrogen Inorganic materials 0.000 description 1
- 239000001257 hydrogen Substances 0.000 description 1
- 125000004435 hydrogen atom Chemical class [H]* 0.000 description 1
- 238000002372 labelling Methods 0.000 description 1
- 150000002632 lipids Chemical class 0.000 description 1
- 229920002521 macromolecule Polymers 0.000 description 1
- 238000001869 matrix assisted laser desorption--ionisation mass spectrum Methods 0.000 description 1
- 230000002503 metabolic effect Effects 0.000 description 1
- 229910052757 nitrogen Inorganic materials 0.000 description 1
- 229910052760 oxygen Inorganic materials 0.000 description 1
- 239000001301 oxygen Substances 0.000 description 1
- 238000012805 post-processing Methods 0.000 description 1
- 238000002360 preparation method Methods 0.000 description 1
- 102000004169 proteins and genes Human genes 0.000 description 1
- 108090000623 proteins and genes Proteins 0.000 description 1
- 238000003908 quality control method Methods 0.000 description 1
- 238000011158 quantitative evaluation Methods 0.000 description 1
- 229910052717 sulfur Inorganic materials 0.000 description 1
- 239000011593 sulfur Substances 0.000 description 1
- 230000009897 systematic effect Effects 0.000 description 1
- 230000009466 transformation Effects 0.000 description 1
Images


Classifications
-
- G—PHYSICS
- G01—MEASURING; TESTING
- G01N—INVESTIGATING OR ANALYSING MATERIALS BY DETERMINING THEIR CHEMICAL OR PHYSICAL PROPERTIES
- G01N33/00—Investigating or analysing materials by specific methods not covered by groups G01N1/00 - G01N31/00
- G01N33/48—Biological material, e.g. blood, urine; Haemocytometers
- G01N33/50—Chemical analysis of biological material, e.g. blood, urine; Testing involving biospecific ligand binding methods; Immunological testing
- G01N33/68—Chemical analysis of biological material, e.g. blood, urine; Testing involving biospecific ligand binding methods; Immunological testing involving proteins, peptides or amino acids
- G01N33/6803—General methods of protein analysis not limited to specific proteins or families of proteins
- G01N33/6848—Methods of protein analysis involving mass spectrometry
-
- G—PHYSICS
- G16—INFORMATION AND COMMUNICATION TECHNOLOGY [ICT] SPECIALLY ADAPTED FOR SPECIFIC APPLICATION FIELDS
- G16B—BIOINFORMATICS, i.e. INFORMATION AND COMMUNICATION TECHNOLOGY [ICT] SPECIALLY ADAPTED FOR GENETIC OR PROTEIN-RELATED DATA PROCESSING IN COMPUTATIONAL MOLECULAR BIOLOGY
- G16B40/00—ICT specially adapted for biostatistics; ICT specially adapted for bioinformatics-related machine learning or data mining, e.g. knowledge discovery or pattern finding
- G16B40/10—Signal processing, e.g. from mass spectrometry [MS] or from PCR
-
- H—ELECTRICITY
- H01—ELECTRIC ELEMENTS
- H01J—ELECTRIC DISCHARGE TUBES OR DISCHARGE LAMPS
- H01J49/00—Particle spectrometers or separator tubes
- H01J49/0009—Calibration of the apparatus
-
- H—ELECTRICITY
- H01—ELECTRIC ELEMENTS
- H01J—ELECTRIC DISCHARGE TUBES OR DISCHARGE LAMPS
- H01J49/00—Particle spectrometers or separator tubes
- H01J49/0027—Methods for using particle spectrometers
- H01J49/0036—Step by step routines describing the handling of the data generated during a measurement
Definitions
- the invention relates to a method to evaluate mass spectrometry data for the analysis of peptides from biological samples, in particular MALDI-TOF mass spectrometry data.
- the invention relates to a mass spectrometric method for the analysis of peptides from biological samples, in particular by using a MALDI-TOF mass spectrometer.
- the invention relates to a mass spectrometric method for the analysis of peptides from biological samples as well as a MALDI-TOF mass spectrometer.
- MALDI-TOF MS Matrix Assisted Laser Desorption/Ionization Time-of-Flight Mass Spectrometry
- a biological tissue sample is coated with a matrix solution after suitable sample preparation and is subjected to laser bombardment in a vacuum.
- Biological macromolecules are thereby extracted from the tissue and ionized, typically with a single positive charge.
- the ions are subsequently accelerated in an electric field and recorded by a detector.
- the m/z value i.e. the mass-to-charge ratio of the molecule, can be determined from the time of flight.
- the mass spectrum measured represents the relative number of recorded ions (spectral intensity) as a function of their m/z values.
- the m/z value is equivalent to the mass m of the ionized molecule.
- the mass m of the ionized molecule is taken to mean the m/z value.
- the mass of a molecule in Da corresponds to the total number of protons and neutrons comprising the atomic nuclei of the molecule.
- the difference between this integer nominal mass and the actual mass is called the mass defect.
- the mass defect of a molecule is the sum of the mass defects of the individual atoms, which are in turn different for each chemical element or isotope.
- mass defect is not used uniformly in the literature.
- a first meaning of the term relates to the difference of the masses in the SI unit kg.
- a second meaning likewise relates to the difference in the masses, but is based on the atomic mass unit u, which is defined with reference to the carbon isotope 12C. This specification means the mass defect of the carbon isotope 12C is zero.
- the term “mass excess” is also used for this second meaning instead of the term “mass defect” to emphasize the difference to the first aforementioned meaning.
- the term “mass defect” is used nevertheless, i.e. in the sense of the second meaning; this is done here also.
- a frequently occurring distortion of the measured data consists in a systematic error in the measured masses, which exceeds the tolerance limit of the measuring technology, even under carefully controlled experimental conditions. In many cases, conventional methods to correct these mass distortions are either too imprecise or too time-consuming.
- the objective of this invention is to create a method for quality control of mass spectrometry data (when analyzing peptides from biological samples) or a mass spectrometric method with a corresponding control or a mass spectrometric method with a signal correction.
- the method is based on computer-aided visualization of the mass defects of the peaks found in a mass spectrum, among other things. It exploits the fact that a great many of the peaks originate from peptides whose mass defects follow a characteristic pattern. By comparing the measured mass defects with the expected mass defects/a theoretically expected mass defect pattern, conclusions can be drawn by calculatory and visual means about the quality of the measured data.
- the mass spectrometric method does not measure the mass defects directly, of course. Rather, they are calculated from the masses ascertained (which are determined in a TOF mass spectrometer from measured times of flight). For simplicity, however, the term “measured mass defect” is used to distinguish it from the “expected mass defect”. The latter is obtained from calculations on the basis of the special characteristics of the peptides.
- a further development of the invention provides for the expected mass defects to be calculated from m N r p , where m N designates the nominal mass of a peptide and r p is preferably between 10 ⁇ 3 and 10 ⁇ 4 , particularly around 4.95 ⁇ 10 ⁇ 4 .
- a further idea of the invention provides for the mass defect for a measured mass m to be calculated from
- a further development of the invention provides for the discrepancy ⁇ P between the measured and the expected mass defect to be calculated directly from the measured mass m as
- ⁇ P ⁇ ( m ) ⁇ ⁇ ( m 1 + r P + 0.5 ) - 0.5
- a further idea of the invention provides for the median of the measured mass defects to be formed and compared with the expected mass defect in order to compare the measured mass defects with the expected mass defects over subintervals of a mass axis.
- the measured mass defects are calculated for local maxima of the spectral intensities. Each local maximum is taken to be the peak of a specific measured mass.
- the data can be assessed as being defective or acceptable.
- a corresponding signal for assessment of the data can also be output by a suitable signal source, for example a display on a screen.
- the data or the measurement are/is assessed as being acceptable, the data are processed further and/or further measurements are undertaken. When data are assessed as being defective, they can be rejected for further processing, for example, and/or the device used to carry out the mass spectrometry is checked.
- a further development of the invention provides for interquartile ranges of the ascertained discrepancies to be determined over subintervals of the mass axis in order to determine a variance of the mass defect discrepancies, and for the data to be rejected as defective particularly when a limit value of the variance is exceeded.
- an interval for acceptable variances is formed by the limit values
- t a specified threshold value
- the upper or lower limit of this mass range gives the extent of the peptide signal range.
- the data, or a measurement on which they are based, can be assessed as being defective or acceptable, depending on whether a tolerance value for the upper limit is not reached, or the extent of the peptide signal range, or whether a tolerance value for the lower limit of the peptide signal range is exceeded.
- a corresponding signal for assessment of the data can also be output by a suitable signal source, for example a display on a screen.
- the data or the measurement are/is assessed as being acceptable, the data are processed further and/or further measurements are undertaken. When data are assessed as being defective, they can be rejected for further processing, for example, and/or the device used to carry out the mass spectrometry is checked.
- the invention can preferably provide that, for each subinterval of the abscissa axis, in particular the horizontal mass axis, the corresponding intensity values of the ordinate axis are statistically evaluated in order to determine cluster points and/or variance values.
- a further example embodiment can provide for circular statistics to be used to describe the distribution of the summed intensity values in the vertical direction, in particular a first circular moment Z can be used as the (complex-valued) statistics.
- a further way of achieving the objective stated in the introduction involves a mass spectrometric method provided to handle an individual spectrum, wherein for a mass shift normalization for an ensemble, for each spectrum
- a common average reference profile is formed from all the individual mass shift profiles by forming the arithmetic mean, element by element,
- each spectrum is modified so that the mass shift profile of the modified spectrum corresponds to the reference profile.
- a MALDI-TOF mass spectrometer to achieve the aforementioned objective is herein. Accordingly, this mass spectrometer has a control unit to carry out the method according to the invention.
- FIG. 1 a section from an average spectrum with clearly visible, wavy base line with a characteristic wavelength of slightly more than 1 Da;
- FIG. 2 a conventional mass defect diagram of an average spectrum with recognizable peptide band
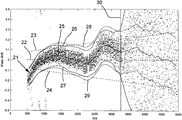
- FIG. 3 a peptide mass defect diagram (PMD) of the average spectrum from FIG. 2 , i.e. showing a mass shift as a function of the mass (m/z), with horizontal reference line for an expected mass defect and reference interval (broken lines), mass defect discrepancy and its variance (solid line) and expected variance (dash-point-dash lines) and upper limit of the mass range with recognizable peptide signal (dotted line);
- PMD peptide mass defect diagram
- FIG. 4 a PMD of an average spectrum with greatly reduced signal--to-noise ratio, recognizable in the reduced peptide signal range, which extends only to approx. 1300 Da;
- FIG. 5 a PMD of a spectrum with significant mass shift by approx. 0.15 to 0.35 Da;
- FIG. 6 a PMD with clearly recognizable line structure due to the equidistant sampling of the mass axis
- FIG. 7 a PMD of an average spectrum with very coarsely sampled mass axis; the coarse sampling makes it almost impossible to recognize the structure of the peptide band;
- FIG. 9 a peptide mass defect histogram (PMH) of an average spectrum with mass shift comparable to the one shown in FIG. 5 ;
- FIG. 10 average spectra before (top) and after (bottom) mass shift normalization.
- the molecules recorded in a MALDI measurement comprise metabolites and peptides in particular.
- Metabolites are metabolic products and can have various chemical forms, e.g. lipids, carbohydrates or breakdown products from substances taken up from food or the environment. Their masses are typically less than 1,000 Da.
- Peptides in contrast, are chains of amino acids with masses of up to 5,000 Da and more.
- the determination of the mass of a molecule is subject to an error which originates mainly from two causes: on the one hand, the time of flight of a molecule can only be measured with a certain accuracy and in discrete intervals, which results in a discretization of the mass axis, i.e. a subdivision into successive intervals (m/z bins).
- the width of the m/z bins is usually not constant, but increases toward higher masses.
- the time of flight of the molecule depends not only on its mass, but also on its original state within the ion cloud at the start of the acceleration.
- This original state, in particular speed and direction of motion of the molecule are largely unknown and lead to a significant measurement error, which is usually corrected by a calibration after the measurement.
- the commonly used calibration methods include external calibration and statistical peptide calibration.
- External calibration involves placing several drops of a solution with defined constituents next to the tissue sample before the measurement. The spectra measured therein are compared with the expected masses of the known constituents after the measurement and a calibration curve is determined for the m/z axis of a spectrum.
- peptide calibration the aforementioned relationship between the true mass of a peptide and its nominal mass is utilized to shift the peak positions which are presumed to belong to a peptide to the theoretically expected m/z values, see Wool A, Smilansky Z: Precalibration of matrix-assisted laser desorption/ionization-time of flight spectra for peptide mass fingerprinting. Proteomics 2002, 2, 1365-1373.
- a calibration solution can only contain a small number of known substances. This limits the number of reference points from which the calibration curve is determined, and thus the accuracy of the calibration. This form of calibration moreover requires a manual user interaction.
- FIG. 2 To visualize the mass defects observed in a spectrum, the m/z values of the peaks found in a spectrum are plotted in a diagram, whose horizontal axis corresponds to the mass m (or m/z value), while their decimal places m-floor(m) are plotted on the vertical axis, see FIG. 2 .
- Such diagrams are used to visualize different compositions of complex molecular mixtures.
- a different version is the so-called Kendrick mass defect diagrams, which are used to characterize chemical compounds of a specific group, see Wikipedia: Kendrick mass. https://en.wikipedia.org/wiki/Kendrick_mass.
- mass defect diagrams can be used to differentiate between peptides and so-called glycopeptides, cf. US 2016/0003842 A1 and Froehlich J et al.: A Classifier Based on Accurate Mass Measurements to Aid Large Scale, Unbiased Glycoproteomics. Mol. Cell. Proteomics 2013, 12, 1017-1025.
- peptides can specifically be chemically modified in such a way that they exhibit a mass defect which differs significantly from the peptide mass model (also known as an averagine model) and can be distinguished from unmodified peptides with the aid of this deviation, cf. Chen X, Savickas P, Vestal M. Methods and systems for mass defect filtering of mass spectrometry data.
- U.S. Pat. No. 7,634,364 filed 2006 Jun. 23, granted 2009 Dec. 15; Yao X, Diego P, Ramos A A, Shi Y. Averagine-scaling analysis and fragment ion mass defect labeling in peptide mass spectrometry. Anal. Chem. 2008 Oct. 1; 80(19):7383-91. doi: 10.1021/ac801096e; Sleno L. The use of mass defect in modern mass spectrometry. J. Mass. Spectrom. 2012, 47: 226-236. doi:10.1002/jms.2953
- the mass defect determined for a spectral peak is used to chemically characterize the corresponding molecule in more detail.
- a precondition for this method is thus that the accuracy of the mass determination is sufficiently high.
- a representation which differs from the usual mass scale is occasionally used to graphically visualize the mass defect filtering.
- the deviation from the nearest mass corresponding to the averagine model in each case is plotted in the vertical direction instead of the mass defect, cf. Yao X, Diego P, Ramos A A, Shi Y. Averagine-scaling analysis and fragment ion mass defect labeling in peptide mass spectrometry, Anal. Chem. 2008 Oct. 1; 80(19):7383-91. doi: 10.1021/ac801096e.
- a diagram known as a peptide mass defect diagram can be created from an average spectrum formed over several spectra of a MALDI measurement. To this end, a list of all local maxima and their respective m/z values is determined, and for each m/z value the deviation from the respective nearest mass corresponding to the theoretical peptide mass model is determined. Assuming that the measured signals are attributable to peptides, for every m/z value m the nominal mass m N is now determined for which the modulus of the deviation between m and the mass expected according to the theoretical peptide mass model (averagine model, see above) m P (m N ) is minimized (see below). The minimum deviation ⁇ P ( ), which can assume values from ⁇ 0.5 to 0.5, is known as the peptide model distance. The peptide model distance corresponds to the above-described discrepancy between measured and expected mass defect.
- PMD peptide mass defect diagram
- the PMD is therefore generated by means of a transformation which reproduces the positions of the theoretically expected peptide mass defects onto the reference line 22 , which is a horizontal zero line.
- the PMD differs from the known representations by virtue of the fact that no prior specific signal analysis is carried out, in particular no identification of significant peptide peaks (peak picking). Rather, the PMD essentially reflects statistical characteristics of the spectral background signal (cf. FIG. 1 ), the only assumption being that the signal originates largely from peptide molecules.
- the vertical axis ranges from ⁇ 0.5 to 0.5 and shows the signed discrepancy between the mass defect expected for a peptide and that which is actually measured.
- a reference interval can be drawn in with lines 23 , 24 , which represents the expected variance of the peptide mass defects about their average, taking into account the given discretization of the mass axis for a measurement.
- a PMD can also be formed for an individual spectrum or for the maximum spectrum over several individual spectra (so-called skyline spectrum), rather than for an average spectrum. This representation does not provide as much information, however.
- floor( x ) for x> 0 designates the integer part of a positive number x
- the PMD of the local maxima of S consists of the graphical representation of the points
- ⁇ P ⁇ ( m ) ⁇ ⁇ ( m 1 + r P + 0.5 ) - 0.5 describes the signed discrepancy between the mass defect expected for a peptide and the one actually measured.
- the above representation of the discrepancy ⁇ P (m) is derived as follows:
- m N floor ⁇ ( m 1 + r P + 0.5 ) .
- Weighting the difference in the mass defects with 1/(1+r P ) serves to normalize ⁇ P (m) to the range of values [ ⁇ 0.5 . . . 0.5].
- the expected variance v(m) of the positions of the local maxima is considered as a function of the mass, which can be estimated by the sum of the variance of the true peptide masses ⁇ 2 P and the variance originating from the discretization of the mass axis,
- v ⁇ ( m ) ⁇ P 2 ⁇ ( m ) + ⁇ ⁇ ⁇ m ⁇ ( m ) 2 12 .
- ⁇ m(m) designates the width of the m/z bins at mass position m.
- the mass range with recognizable peptide signal is determined to be that part of the mass axis for which the ratio of observed (lines 26 , 27 ) and expected variance (lines 28 , 29 ) remains below a specified tolerance threshold t:
- M P ⁇ m ⁇ [ m 1 , m n ] ⁇ : ⁇ e ⁇ ( m ) ⁇ ⁇ v ⁇ ( m ) ⁇ t ⁇ .
- the positions of the outer edges of M P can be drawn in the PMD as vertical lines.
- This disadvantage can be circumvented by representing the spectra in a peptide mass defect histogram (PMH).
- PMH peptide mass defect histogram
- This is created by presenting all spectral intensities for all m/z bins of a spectrum in a 2D histogram, in which the horizontal axis again corresponds to the mass axis, and the vertical axis represents the peptide model distance to the relevant mass (see below).
- Both axes are uniformly subdivided into pre-selected numbers of subintervals (typically 20-50, can be different for each axis), thus partitioning the diagram area into rectangular tiles.
- the tiles can finally be visualized using a suitably selected gray scale or color scale corresponding to the summed intensities.
- the reference line 31 and the reference intervals 32 , 33 are additionally drawn in ( FIG. 9 ).
- the PMH can be interpreted in the same way as the PMD.
- characteristic quantities of a spectrum can also be calculated from a PMH—and thus also for individual spectra, too.
- an evaluation of the vertically arranged summed intensity values is carried out for each subinterval of the horizontal mass axis to determine cluster points and variance values from this.
- top and bottom edge lines of a PMH i.e. the points associated with the extreme distance values +0.5 and ⁇ 0.5
- Circular statistics are therefore suitable to describe the distribution of the summed intensity values in the vertical direction.
- the first circular moment Z in particular can be used as the (complex-valued) statistics (mathematical formulation see below).
- the circular moments Z for all the subintervals of the mass axis taken together are called the mass shift profile of the spectrum considered.
- the complex argument of Z corresponds (apart from a factor 2 ⁇ (1+r P )) to the discrepancy between measured and expected masses.
- the value of Z provides a reciprocal measure for the variance of the measured peptide model distances:
- the two steps to form the 2D histogram and the computation of the circular moments can be combined and expressed as Fourier integrals of the spectrum over the subintervals of the mass axis (see below). These integrals can be numerically approximated with the aid of suitable integration rules (for example the trapezoidal rule or Simpson's rule). It is also possible here to forgo a finer discretization and interpolation of the spectrum and to calculate directly with the discrete spectral intensities in the resolution originally available.
- suitable integration rules for example the trapezoidal rule or Simpson's rule
- the mass shift profile provides an estimate of the measurement errors of the measured masses occurring in a spectrum with respect to the true masses. In practice it is often desirable to correct these shifts and thus achieve a higher accuracy for the measured masses of a spectrum.
- the mass shift profile is obtained by comparing the measured data with the relatively simple, linear averagine model (see above).
- the estimation of the mass errors through the mass shift profile cannot therefore be more accurate than the accuracy of the model itself, which is not sufficiently high for many applications, at least in the lower mass range up to approx. 1,000 Da.
- a correction of the measured masses by the estimated measurement error can therefore lead to parts of the measurement becoming less accurate.
- the method of mass shift normalization consists in initially determining the respective mass shift profile for each spectrum in an ensemble (see above), forming a common, average reference profile from all the individual mass shift profiles, and finally modifying each spectrum in such a way that the mass shift profile of the modified spectrum corresponds to the reference profile.
- the relative deviation between the signal peaks of the individual spectra belonging to one and the same peptide is reduced, and the comparability of the spectra is enhanced ( FIG. 10 , bottom) by this approximation.
- the reference profile is determined by forming the arithmetic mean element by element (see below). To normalize a single spectrum to the reference profile, relative shift values are determined for the individual subintervals for which the mass shift profiles were calculated, and these values are interpolated over the whole mass axis. The measured mass values of the spectrum are then corrected by these interpolated shift values.
- each individual spectrum is given its own mass axis.
- L ⁇ , ⁇ l J l [ ⁇ 1 ⁇ 2, 1 ⁇ 2].
- ⁇ tilde over (S) ⁇ as a linear interpolant of S, for example.
- the integrals can then be evaluated exactly.
- the matrix H(S) is depicted as a gray scale or false color image.
- the Z k can be represented by
- a suitable integration formula e.g. trapezoid formula or Simpson's rule
- the reference profile Z is calculated by forming the arithmetic mean, element by element:
- ⁇ k 1 2 ⁇ ⁇ ⁇ ( arg ⁇ ( Z k ) - arg ⁇ ( Z _ k ) ) is now determined, where arg(z) ⁇ ( ⁇ , ⁇ ] designates the complex argument function.
- the individual shifts ⁇ k are assigned to the midpoints of the subintervals I k and interpolated over the complete mass axis (typically by means of linear interpolation).
Landscapes
- Life Sciences & Earth Sciences (AREA)
- Health & Medical Sciences (AREA)
- Engineering & Computer Science (AREA)
- Physics & Mathematics (AREA)
- Molecular Biology (AREA)
- Chemical & Material Sciences (AREA)
- Bioinformatics & Cheminformatics (AREA)
- Bioinformatics & Computational Biology (AREA)
- Spectroscopy & Molecular Physics (AREA)
- Analytical Chemistry (AREA)
- Urology & Nephrology (AREA)
- Biophysics (AREA)
- Biomedical Technology (AREA)
- Biotechnology (AREA)
- Medical Informatics (AREA)
- Hematology (AREA)
- Immunology (AREA)
- General Health & Medical Sciences (AREA)
- Signal Processing (AREA)
- Data Mining & Analysis (AREA)
- Medicinal Chemistry (AREA)
- Biochemistry (AREA)
- Microbiology (AREA)
- General Physics & Mathematics (AREA)
- Pathology (AREA)
- Proteomics, Peptides & Aminoacids (AREA)
- Artificial Intelligence (AREA)
- Bioethics (AREA)
- Computer Vision & Pattern Recognition (AREA)
- Food Science & Technology (AREA)
- Databases & Information Systems (AREA)
- Epidemiology (AREA)
- Evolutionary Computation (AREA)
- Cell Biology (AREA)
- Public Health (AREA)
- Software Systems (AREA)
- Evolutionary Biology (AREA)
- Theoretical Computer Science (AREA)
- Other Investigation Or Analysis Of Materials By Electrical Means (AREA)
Abstract
-
- a) provide expected mass defects;
- b) determine measured mass defects, i.e. the mass defects resulting from the mass spectrometry data;
- c) compare the measured mass defects with the expected mass defects.
Description
mN rp,
where mN designates the nominal mass of a peptide
and rp is preferably between 10−3 and 10−4, particularly around 4.95×10⁻⁴.
where the function floor(x) for an arbitrary x>0 designates the integer part of x.
where the function φ(x)=x−floor(x) designates the decimal places of x for any x>0.
- and σP(mN)=σ0+sP mN, with σ0≈0.02 and sP≈2.0×10⁻⁵,
- and Δm(m) designates the width of the m/z bins at the mass position m,
- and m/z bins represent the intervals resulting from the discretization of the mass axis,
- and μ>0 provides a scaling factor, preferably μ=2,
- and where, in particular, the data are rejected as defective when the variance of the mass defect discrepancies is outside the interval thus specified.
as Fourier integrals of the continuously interpolated spectrum {tilde over (S)} over the subintervals lk of the abscissa axis.
m≈m P(m N)=(1+r P)m N, where r p≈4.95×10⁻⁴.
σP(m N)=σ0 +s P m N, where σ0≈0.02, s P≈2.0×10⁻⁵.
-
- 1. Mass range with peptide signals: A clearly recognizable band (“
peptide band 21”) close to thereference line 22 points to the presence of peptide signals in the mass range in question. Where the band structure is lost in an unstructured point cloud (typically recognizable at the top end of the mass axis, to the right of an upper limit 30), the peptide signal is lost in the noise (FIGS. 3, 4 ). - 2. Mass shift: If the
peptide band 21 deviates noticeably from thereference line 22, this points to a discrepancy between the true and the measured molecular masses. The magnitude of the discrepancy corresponds to the vertical offset betweenreference line 22 and thecenter line 25 of thepeptide band 21. The reference interval here gives the range in which a shift can be explained by the particular discretization of the mass axis (FIGS. 3, 5 ). - 3. Equidistant or too coarsely sampled mass axis: a MALDI-TOF mass spectrometer does not typically discretize the mass axis with equidistant intervals, but with increasing bin width toward high masses. When spectral data are subjected to post-processing, the data are frequently re-sampled onto an equidistant mass axis with lower resolution, causing a loss in accuracy. An equidistant mass axis can be clearly recognized in the PMD by virtue of the fact that the points plotted have a linear structure (
FIG. 6 ). If the resolution of the data is too low after the resampling, the structure of the peptide band 21 (FIGS. 6, 7 ) is lost. - 4. defective calibration of the mass axis: Errors which lead to a discontinuous distortion of the mass axis can occur during the calibration of the mass axis. Such distortions occur in the PMD as a break or offset in the peptide band 21 (
FIG. 8 ).
- 1. Mass range with peptide signals: A clearly recognizable band (“
-
- 1. Determination of the discrepancy between measured and expected peptide mass defect as a function of mass. To this end, the median of the mass defects over subintervals of the mass axis is formed and compared with the expected value.
- 2. Determination of the variance of the mass defects about their average. To this end, the interquartile range of the mass defects is determined over subintervals and converted into a specified multiple of the standard deviation of an assumed normal distribution.
- 3. Determination of the mass range with recognizable peptide signal. To this end, the variance of the mass defects determined from the data (range between
lines 26, 27) is compared with the width of the reference interval (range betweenlines 23, 24) and the range is determined in which the deviation remains within a selected tolerance.
S=(s j,
describes an (individual, average or skyline) spectrum which consists of the n intensities s1 . . . sn for the m/z values m1 . . . mn.
floor(x) for x>0
designates the integer part of a positive number x , where
φ(x)=x−floor(x) for x>0
designates the part of a positive number x after the decimal point.
where u∈
describes the signed discrepancy between the mass defect expected for a peptide and the one actually measured. The above representation of the discrepancy δP(m) is derived as follows:
m P −m N=(1+r P)m N −m N =r P m N.
|m−(1+rP)mN|
is minimized. This leads to
d P 1,2(
where the scaling factor μ>0 gives the width of the interval as a multiple of a standard deviation (typically μ=2).
I=(I k)k=1 . . . K where K∈
are shown, the discrepancy
E k=median{δF(
is formed to determine the mass discrepancy E(m) for the subintervals Ik. The Ek are shown as points above the respective midpoints of the corresponding subintervals Ik, and a suitable interpolation is carried out in between (e.g. linear). The variance e(m) of the mass defects is similarly formed from the interquartile ranges (IQR),
where the scaling factor μ>0 again gives the width of the interval as a multiple of a standard deviation, typically μ=2, and erf designates the Gaussian error function. The mass range with recognizable peptide signal is determined to be that part of the mass axis for which the ratio of observed (
S=(s j
designates, as above, an (individual, average or skyline) spectrum consisting of the n intensities s1 . . . sn for the m/z values m1 . . . mn.
I=(I k)k=1, . . . , K where K∈
J=(J l)l=1, . . . , L where L∈
Γk,l ={
provides a finer partitioning of the mass axis, where the subintervals Γk,l are assigned to the individual tiles of the 2D histogram. Furthermore, an interpolating line of the spectrum S shall be given by a continuous function {tilde over (S)}(
{tilde over (S)}:[
where {tilde over (δ)}i designates the average values of the intervals Ji. In the limiting case of an infinitesimally fine partitioning J (i.e. L→∞) the Zk can be represented by
Z i=(Z k i)k=1 . . . K für i=1 . . . N
is now determined, where arg(z)∈(−π,π] designates the complex argument function. The individual shifts Δk are assigned to the midpoints of the subintervals Ik and interpolated over the complete mass axis (typically by means of linear interpolation). A shift vector Δ^=(Δ{circumflex over (j)})j=1 . . . n is thus obtained. The normalized spectrum S^ is obtained by applying the shift values to the m/z values of the spectrum S,
S^=(s j
-
- 20 Base line
- 21 Peptide band
- 22 Reference line
- 23 Line for reference interval
- 24 Line for reference interval
- 25 Center line as mass defect discrepancy
- 26 Line for mass defect variance
- 27 Line for mass defect variance
- 28 Line for expected variance
- 29 Line for expected variance
- 30 Upper limit
- 31 Reference line
- 32 Line for reference interval
- 33 Line for reference interval
Claims (10)
mN rp,
Applications Claiming Priority (3)
| Application Number | Priority Date | Filing Date | Title |
|---|---|---|---|
| DE102016012302.8 | 2016-10-17 | ||
| DE102016012302.8A DE102016012302B4 (en) | 2016-10-17 | 2016-10-17 | Method for evaluating data from a mass spectrometry and mass spectrometric method |
| PCT/EP2017/001131 WO2018072862A1 (en) | 2016-10-17 | 2017-09-22 | Method for evaluating data from mass spectrometry, mass spectrometry method, and maldi-tof mass spectrometer |
Related Parent Applications (1)
| Application Number | Title | Priority Date | Filing Date |
|---|---|---|---|
| PCT/EP2017/001131 A-371-Of-International WO2018072862A1 (en) | 2016-10-17 | 2017-09-22 | Method for evaluating data from mass spectrometry, mass spectrometry method, and maldi-tof mass spectrometer |
Related Child Applications (2)
| Application Number | Title | Priority Date | Filing Date |
|---|---|---|---|
| US17/471,473 Continuation US11747343B2 (en) | 2016-10-17 | 2021-09-10 | Method for evaluating data from mass spectrometry, mass spectrometry method, and MALDI-TOF mass spectrometer |
| US17/471,473 Division US11747343B2 (en) | 2016-10-17 | 2021-09-10 | Method for evaluating data from mass spectrometry, mass spectrometry method, and MALDI-TOF mass spectrometer |
Publications (2)
| Publication Number | Publication Date |
|---|---|
| US20190257839A1 US20190257839A1 (en) | 2019-08-22 |
| US11221338B2 true US11221338B2 (en) | 2022-01-11 |
Family
ID=60119986
Family Applications (4)
| Application Number | Title | Priority Date | Filing Date |
|---|---|---|---|
| US16/342,088 Active 2038-04-24 US11221338B2 (en) | 2016-10-17 | 2017-09-22 | Method for evaluating data from mass spectrometry, mass spectrometry method, and MALDI-TOF mass spectrometer |
| US17/471,473 Active 2037-10-21 US11747343B2 (en) | 2016-10-17 | 2021-09-10 | Method for evaluating data from mass spectrometry, mass spectrometry method, and MALDI-TOF mass spectrometer |
| US18/153,738 Active 2038-01-28 US12210020B2 (en) | 2016-10-17 | 2023-01-12 | Method for evaluating data from mass spectrometry, mass spectrometry method, and MALDI-TOF mass spectrometer |
| US18/966,062 Pending US20250093366A1 (en) | 2016-10-17 | 2024-12-02 | Method for evaluating data from mass spectrometry, mass spectrometry method, and maldi-tof mass spectrometer |
Family Applications After (3)
| Application Number | Title | Priority Date | Filing Date |
|---|---|---|---|
| US17/471,473 Active 2037-10-21 US11747343B2 (en) | 2016-10-17 | 2021-09-10 | Method for evaluating data from mass spectrometry, mass spectrometry method, and MALDI-TOF mass spectrometer |
| US18/153,738 Active 2038-01-28 US12210020B2 (en) | 2016-10-17 | 2023-01-12 | Method for evaluating data from mass spectrometry, mass spectrometry method, and MALDI-TOF mass spectrometer |
| US18/966,062 Pending US20250093366A1 (en) | 2016-10-17 | 2024-12-02 | Method for evaluating data from mass spectrometry, mass spectrometry method, and maldi-tof mass spectrometer |
Country Status (6)
| Country | Link |
|---|---|
| US (4) | US11221338B2 (en) |
| EP (1) | EP3526704B1 (en) |
| CN (1) | CN109863558A (en) |
| DE (1) | DE102016012302B4 (en) |
| ES (1) | ES3014394T3 (en) |
| WO (1) | WO2018072862A1 (en) |
Cited By (1)
| Publication number | Priority date | Publication date | Assignee | Title |
|---|---|---|---|---|
| WO2025096593A1 (en) * | 2023-11-03 | 2025-05-08 | Generate Biomedicines, Inc. | Methods and systems for spectrometric analysis |
Families Citing this family (16)
| Publication number | Priority date | Publication date | Assignee | Title |
|---|---|---|---|---|
| US12181452B2 (en) | 2017-09-18 | 2024-12-31 | Waters Technologies Corporation | Use of vapor deposition coated flow paths for improved chromatography of metal interacting analytes |
| US12180581B2 (en) | 2017-09-18 | 2024-12-31 | Waters Technologies Corporation | Use of vapor deposition coated flow paths for improved chromatography of metal interacting analytes |
| US11709155B2 (en) | 2017-09-18 | 2023-07-25 | Waters Technologies Corporation | Use of vapor deposition coated flow paths for improved chromatography of metal interacting analytes |
| US11709156B2 (en) | 2017-09-18 | 2023-07-25 | Waters Technologies Corporation | Use of vapor deposition coated flow paths for improved analytical analysis |
| DE102019109771B4 (en) * | 2019-04-12 | 2022-06-30 | Bruker Daltonics GmbH & Co. KG | Evaluation of complex mass spectrometry data from biological samples |
| JP7156207B2 (en) * | 2019-08-07 | 2022-10-19 | 株式会社島津製作所 | Glycopeptide analyzer |
| CN112834671B (en) * | 2019-11-25 | 2022-02-11 | 中国科学院大连化学物理研究所 | A method for rapid identification of polyethylene glycol contamination in mass spectrometry samples |
| US11918936B2 (en) | 2020-01-17 | 2024-03-05 | Waters Technologies Corporation | Performance and dynamic range for oligonucleotide bioanalysis through reduction of non specific binding |
| WO2022064447A1 (en) | 2020-09-24 | 2022-03-31 | Waters Technologies Corporation | Chromatographic hardware improvements for the separation of reactive molecules |
| CN112415208A (en) * | 2020-11-17 | 2021-02-26 | 北京航空航天大学 | Method for evaluating quality of proteomics mass spectrum data |
| CN113487539B (en) * | 2021-06-08 | 2024-07-16 | 深圳市格灵精睿视觉有限公司 | Gel path quality analysis method, device, system and storage medium |
| CN114858958B (en) * | 2022-07-05 | 2022-11-01 | 西湖欧米(杭州)生物科技有限公司 | Method and device for analyzing mass spectrum data in quality evaluation and storage medium |
| CN115330648B (en) * | 2022-07-29 | 2025-08-29 | 融智生物科技(青岛)有限公司 | Mass spectrometry synthesis method, system, device and medium |
| CN115330649B (en) * | 2022-07-29 | 2025-08-29 | 融智生物科技(青岛)有限公司 | Mass spectrometry synthesis method, system, device and medium |
| CN116297794B (en) * | 2023-05-11 | 2023-10-31 | 深圳大学 | Organic matter determining method and terminal equipment based on ultra-high resolution mass spectrometer |
| CN116912277B (en) * | 2023-09-12 | 2023-12-12 | 山东鲁泰化学有限公司 | Circulating water descaling effect evaluation method and system |
Citations (4)
| Publication number | Priority date | Publication date | Assignee | Title |
|---|---|---|---|---|
| US20070038387A1 (en) | 2005-06-23 | 2007-02-15 | Applera Corporation; Applied Biosystems Group | Methods and systems for mass defect filtering of mass spectrometry data |
| WO2007076606A1 (en) | 2006-01-05 | 2007-07-12 | Mds Analytical Technologies, A Business Unit Of Mds Inc., Doing Business Through Its Sciex Division | Mass defect triggered information dependent acquisition |
| US20120232805A1 (en) | 2011-02-14 | 2012-09-13 | Board Of Regents, The University Of Texas System | Computerized Amino Acid Composition Enumeration |
| WO2014130627A1 (en) | 2013-02-21 | 2014-08-28 | Children's Medical Center Corporation | Glycopeptide identification |
Family Cites Families (1)
| Publication number | Priority date | Publication date | Assignee | Title |
|---|---|---|---|---|
| CN101196498B (en) * | 2006-12-06 | 2011-06-01 | 中国科学院计算技术研究所 | A Prediction Method of Mass Spectrometry Mass Measurement Error |
-
2016
- 2016-10-17 DE DE102016012302.8A patent/DE102016012302B4/en active Active
-
2017
- 2017-09-22 US US16/342,088 patent/US11221338B2/en active Active
- 2017-09-22 EP EP17784841.3A patent/EP3526704B1/en active Active
- 2017-09-22 CN CN201780064259.4A patent/CN109863558A/en active Pending
- 2017-09-22 WO PCT/EP2017/001131 patent/WO2018072862A1/en not_active Ceased
- 2017-09-22 ES ES17784841T patent/ES3014394T3/en active Active
-
2021
- 2021-09-10 US US17/471,473 patent/US11747343B2/en active Active
-
2023
- 2023-01-12 US US18/153,738 patent/US12210020B2/en active Active
-
2024
- 2024-12-02 US US18/966,062 patent/US20250093366A1/en active Pending
Patent Citations (4)
| Publication number | Priority date | Publication date | Assignee | Title |
|---|---|---|---|---|
| US20070038387A1 (en) | 2005-06-23 | 2007-02-15 | Applera Corporation; Applied Biosystems Group | Methods and systems for mass defect filtering of mass spectrometry data |
| WO2007076606A1 (en) | 2006-01-05 | 2007-07-12 | Mds Analytical Technologies, A Business Unit Of Mds Inc., Doing Business Through Its Sciex Division | Mass defect triggered information dependent acquisition |
| US20120232805A1 (en) | 2011-02-14 | 2012-09-13 | Board Of Regents, The University Of Texas System | Computerized Amino Acid Composition Enumeration |
| WO2014130627A1 (en) | 2013-02-21 | 2014-08-28 | Children's Medical Center Corporation | Glycopeptide identification |
Non-Patent Citations (7)
| Title |
|---|
| Assaf Wool et al., "Precalibration of matrix-assisted laser desorption/ionization-time of flight spectra for peptide mass fingerprinting", Proteomics, pp. 1365-1373, Nov. 2002. |
| Bajrami B et al., Journal of the American Society for Mass Spectrometry, vol. 20, No. 11, pp. 2124-2134, Nov. 2009. |
| Can Bruce et al., Analytical Chemistry, vol. 78, No. 13, pp. 4374-4382,Jul. 2006. |
| Del Prete Eugenio et al., "Comparative Analysis of MALDI-TOF Mass Spectrometric Data in Proteomics: A Case Study", Network and Parallel Computing; Notes in Computer Science; Lecture Notes, Springer International Publishing, pp. 154-161, Jul. 2016. |
| Haiying Zhang et al., Journal of Mass Spectrometry, vol. 44, No. 7, pp. 999-1016, Jul. 2009. |
| Indrnil Mitra et al., Analytical Chemistry, vol. 84, No. 6, pp. 3026-3032, Mar. 7, 2012. |
| Melinda L. Toumi et al., Journal of Proteome Research, vol. 9, No. 10, pp. 5492-5495, Oct. 2010. |
Cited By (1)
| Publication number | Priority date | Publication date | Assignee | Title |
|---|---|---|---|---|
| WO2025096593A1 (en) * | 2023-11-03 | 2025-05-08 | Generate Biomedicines, Inc. | Methods and systems for spectrometric analysis |
Also Published As
| Publication number | Publication date |
|---|---|
| WO2018072862A8 (en) | 2018-07-05 |
| US20230160905A1 (en) | 2023-05-25 |
| WO2018072862A1 (en) | 2018-04-26 |
| EP3526704B1 (en) | 2025-02-12 |
| US20190257839A1 (en) | 2019-08-22 |
| ES3014394T3 (en) | 2025-04-22 |
| US12210020B2 (en) | 2025-01-28 |
| EP3526704A1 (en) | 2019-08-21 |
| CN109863558A (en) | 2019-06-07 |
| DE102016012302B4 (en) | 2020-10-29 |
| US20210405062A1 (en) | 2021-12-30 |
| US20250093366A1 (en) | 2025-03-20 |
| DE102016012302A1 (en) | 2018-04-19 |
| US11747343B2 (en) | 2023-09-05 |
Similar Documents
| Publication | Publication Date | Title |
|---|---|---|
| US12210020B2 (en) | Method for evaluating data from mass spectrometry, mass spectrometry method, and MALDI-TOF mass spectrometer | |
| JP3062251B2 (en) | Methods for reducing interference in elemental mass spectrometers | |
| US8010306B2 (en) | Methods for calibrating mass spectrometry (MS) and other instrument systems and for processing MS and other data | |
| EP2558982B1 (en) | Intensity normalization in imaging mass spectrometry | |
| US7488935B2 (en) | Apparatus and method for processing of mass spectrometry data | |
| CN103563044B (en) | The ambient interferences in SRM analyses are determined using the variable XIC width of TOF MSMS data | |
| US20200065699A1 (en) | Analytical data analysis method and analytical data analyzer | |
| US11062891B2 (en) | Evaluation of complex mass spectrometry data from biological samples | |
| US12347664B2 (en) | Processing of spatially resolved, ion-spectrometric measurement signal data to determine molecular content scores in two-dimensional samples | |
| CN107209156B (en) | Detection of Mass Spectrometry-Based Similarities via Curve Subtraction | |
| US11959898B2 (en) | Identification and scoring of related compounds in complex samples | |
| CN107209151A (en) | Interference Detection and peak value deconvolution of interest | |
| US11721534B2 (en) | Peak width estimation in mass spectra | |
| EP2663993B1 (en) | A method of deadtime correction in mass spectrometry | |
| US10236167B1 (en) | Peak waveform processing device | |
| HK40114246A (en) | Peak width estimation in mass spectra | |
| WO2023032181A1 (en) | Mass spectrometry data analysis method, and imaging mass spectrometry device |
Legal Events
| Date | Code | Title | Description |
|---|---|---|---|
| FEPP | Fee payment procedure |
Free format text: ENTITY STATUS SET TO UNDISCOUNTED (ORIGINAL EVENT CODE: BIG.); ENTITY STATUS OF PATENT OWNER: LARGE ENTITY |
|
| AS | Assignment |
Owner name: BRUKER DALTONIK GMBH, GERMANY Free format text: ASSIGNMENT OF ASSIGNORS INTEREST;ASSIGNOR:BOSKAMP, TOBIAS;REEL/FRAME:049018/0044 Effective date: 20190423 |
|
| STPP | Information on status: patent application and granting procedure in general |
Free format text: DOCKETED NEW CASE - READY FOR EXAMINATION |
|
| STPP | Information on status: patent application and granting procedure in general |
Free format text: NON FINAL ACTION MAILED |
|
| STPP | Information on status: patent application and granting procedure in general |
Free format text: RESPONSE TO NON-FINAL OFFICE ACTION ENTERED AND FORWARDED TO EXAMINER |
|
| STPP | Information on status: patent application and granting procedure in general |
Free format text: NOTICE OF ALLOWANCE MAILED -- APPLICATION RECEIVED IN OFFICE OF PUBLICATIONS |
|
| AS | Assignment |
Owner name: BRUKER DALTONICS GMBH & CO. KG, GERMANY Free format text: NUNC PRO TUNC ASSIGNMENT;ASSIGNOR:BRUKER DALTONIK GMBH;REEL/FRAME:057209/0070 Effective date: 20210531 |
|
| STPP | Information on status: patent application and granting procedure in general |
Free format text: AWAITING TC RESP, ISSUE FEE PAYMENT RECEIVED |
|
| STPP | Information on status: patent application and granting procedure in general |
Free format text: PUBLICATIONS -- ISSUE FEE PAYMENT VERIFIED |
|
| STCF | Information on status: patent grant |
Free format text: PATENTED CASE |
|
| MAFP | Maintenance fee payment |
Free format text: PAYMENT OF MAINTENANCE FEE, 4TH YEAR, LARGE ENTITY (ORIGINAL EVENT CODE: M1551); ENTITY STATUS OF PATENT OWNER: LARGE ENTITY Year of fee payment: 4 |