US11216940B2 - Metrology-based assisted defect recognition - Google Patents
Metrology-based assisted defect recognition Download PDFInfo
- Publication number
- US11216940B2 US11216940B2 US16/845,652 US202016845652A US11216940B2 US 11216940 B2 US11216940 B2 US 11216940B2 US 202016845652 A US202016845652 A US 202016845652A US 11216940 B2 US11216940 B2 US 11216940B2
- Authority
- US
- United States
- Prior art keywords
- key points
- training images
- reference image
- image
- pair
- Prior art date
- Legal status (The legal status is an assumption and is not a legal conclusion. Google has not performed a legal analysis and makes no representation as to the accuracy of the status listed.)
- Active, expires
Links
Images


Classifications
-
- G—PHYSICS
- G06—COMPUTING OR CALCULATING; COUNTING
- G06T—IMAGE DATA PROCESSING OR GENERATION, IN GENERAL
- G06T7/00—Image analysis
- G06T7/0002—Inspection of images, e.g. flaw detection
- G06T7/0004—Industrial image inspection
- G06T7/001—Industrial image inspection using an image reference approach
-
- G—PHYSICS
- G06—COMPUTING OR CALCULATING; COUNTING
- G06T—IMAGE DATA PROCESSING OR GENERATION, IN GENERAL
- G06T7/00—Image analysis
- G06T7/0002—Inspection of images, e.g. flaw detection
- G06T7/0004—Industrial image inspection
- G06T7/0006—Industrial image inspection using a design-rule based approach
-
- G—PHYSICS
- G06—COMPUTING OR CALCULATING; COUNTING
- G06T—IMAGE DATA PROCESSING OR GENERATION, IN GENERAL
- G06T2207/00—Indexing scheme for image analysis or image enhancement
- G06T2207/10—Image acquisition modality
- G06T2207/10072—Tomographic images
- G06T2207/10081—Computed x-ray tomography [CT]
-
- G—PHYSICS
- G06—COMPUTING OR CALCULATING; COUNTING
- G06T—IMAGE DATA PROCESSING OR GENERATION, IN GENERAL
- G06T2207/00—Indexing scheme for image analysis or image enhancement
- G06T2207/10—Image acquisition modality
- G06T2207/10116—X-ray image
-
- G—PHYSICS
- G06—COMPUTING OR CALCULATING; COUNTING
- G06T—IMAGE DATA PROCESSING OR GENERATION, IN GENERAL
- G06T2207/00—Indexing scheme for image analysis or image enhancement
- G06T2207/20—Special algorithmic details
- G06T2207/20081—Training; Learning
-
- G—PHYSICS
- G06—COMPUTING OR CALCULATING; COUNTING
- G06T—IMAGE DATA PROCESSING OR GENERATION, IN GENERAL
- G06T2207/00—Indexing scheme for image analysis or image enhancement
- G06T2207/30—Subject of image; Context of image processing
- G06T2207/30108—Industrial image inspection
Definitions
- This application generally concerns computer vision that detects anomalies in images.
- Computer-vision systems can detect visual anomalies in images.
- nondestructive computer-vision testing techniques can be used to examine the properties of objects without causing damage to the objects. These techniques can be used in a quality-control process to identify defects in the objects.
- An aspect of the present disclosure provides an anomaly-detection approach to metrology and learns normal manufacturing variations of a component from training images of the component. This enables the highlighting of manufacturing inconsistencies even when the component may be within manufacturing tolerances. The discovery of these inconsistencies can help manufacturing-process reviews and improvements and can also help to determine the effects of changes made to the manufacturing process.
- Some embodiments of a device comprise one or more computer-readable storage media and one or more processors.
- the one or more processors are configured to cause the device to obtain a plurality of training images; obtain one or more target regions; generate one or more respective statistical characterizations of the one or more target regions; obtain a test image; locate the one or more target regions on the test image; compare the one or more target regions in the test image to the one or more respective statistical characterizations of the one or more target regions; and detect anomalies in the one or more target regions in the test image based at least in part on the comparison of the one or more target regions in the test image to the one or more respective statistical characterizations of the one or more target regions.
- Some embodiments of a method comprise obtaining a plurality of training images that includes a reference image; selecting a target region in the reference image; selecting respective target regions in the other training images in the plurality of training images, wherein the respective target regions in the other training images correspond to the target region in the reference image; selecting a pair of key points in the target region in the reference image; selecting respective pairs of key points in the other training images, wherein the respective pairs of key points in the other training images correspond to the pair of key points in the target region in the reference image; and measuring respective distances between the key points in the pairs of key points in the training images.
- Some embodiments of one or more computer-readable storage media store instructions that, when executed by one or more computing devices, cause the one or more computing devices to perform operations that comprise obtaining a reference image; selecting a pair of key points in the reference image; measuring a distance between the key points in the pair of key points in the reference image; obtaining a test image; selecting a pair of key points in the test image, wherein each key point in the pair of key points in the test image corresponds to a respective key point in the pair of key points in the reference image; measuring a distance between the key points in the pair of key points in the test image; and detecting an anomaly in the test image based at least in part on the distance between the key points in the pair of key points in the test image.
- FIG. 1 illustrates an example embodiment of a system for image anomaly detection.
- FIG. 2 illustrates an example embodiment of an operational flow for anomaly detection.
- FIG. 3 illustrates an example embodiment of an operational flow for training an anomaly detection model.
- FIG. 4 illustrates an example embodiment of an operational flow for testing an image for anomalies.
- FIG. 5A illustrates an example embodiment of an image of a component with target regions.
- FIG. 5B illustrates example embodiments of line intensity profiles.
- FIG. 6A illustrates example embodiments of line intensity profiles.
- FIG. 6B illustrates the first derivatives of the line intensity profiles in FIG. 6A .
- FIG. 6C illustrates the second derivatives of the line intensity profiles in FIG. 6A .
- FIG. 7A illustrates an example embodiment of a user interface that displays key points along a line intensity profile.
- FIG. 7B illustrates example embodiments of distances between pairs of key points.
- FIG. 8 illustrates an example embodiment of an image of a component, a target region, and key points.
- FIG. 9 illustrates an example embodiment of a statistical characterization of the distances between key points on line intensity profiles from training images.
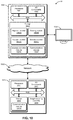
- FIG. 10 illustrates an example embodiment of a system for image anomaly detection.
- explanatory embodiments may include alternatives, equivalents, and modifications. Additionally, the explanatory embodiments may include several novel features, and a particular feature may not be essential to some embodiments of the devices, systems, and methods that are described herein.
- FIG. 1 illustrates an example embodiment of a system 10 for image anomaly detection.
- the system 10 includes one or more anomaly-detection devices 100 ; at least one image-capturing device, such as an x-ray or CT machine 110 A or a camera 1108 ; and a display device 120 .
- the one or more anomaly-detection devices 100 are specially configured computing devices that are configured to learn the variations in target regions of object components that have been imaged through the x-ray or CT machine 110 A or the camera 1108 .
- the one or more anomaly-detection devices 100 are also configured to process an acquired test image (e.g., from the x-ray or CT machine 110 A or the camera 1108 ) and determine whether measurements in the target regions are anomalous or not.
- the one or more anomaly-detection devices 100 are also configured to show the image of the component and any anomalous regions on the display device 120 .
- FIG. 2 illustrates an example embodiment of an operational flow for anomaly detection.
- this operational flow and the other operational flows that are described herein are each presented in a certain respective order, some embodiments of these operational flows perform at least some of the operations in different orders than the presented orders. Examples of different orders include concurrent, parallel, overlapping, reordered, simultaneous, incremental, and interleaved orders. Also, some embodiments of these operational flows include operations (e.g., blocks) from more than one of the operational flows that are described herein.
- some embodiments of the operational flows may omit blocks, add blocks (e.g., include blocks from other operational flows that are described herein), change the order of the blocks, combine blocks, or divide blocks into more blocks relative to the example embodiments of the operational flows that are described herein.
- the flow starts in block B 200 and continues to block B 210 , where an anomaly-detection device trains a metrology model 294 using exemplary training images 292 .
- the metrology model 294 contains statistical characterizations 295 of target regions of a component being imaged.
- FIG. 3 illustrates an example embodiment of an operational flow for training an anomaly detection model.
- the flow begins in block B 300 and continues to block B 305 , where an anomaly-detection device obtains a reference image 391 (e.g., an image of a component).
- the anomaly-detection device defines one or more target regions in the reference image 391 .
- the target region is a line that starts at one pixel in the reference image 391 and ends at a different pixel in the reference image 391 .
- the line defines an intensity profile in the image along the line.
- the line intensity profiles are interpolated along the line to account for transitions across the image pixels in both the x and y directions.
- the line intensity profile interpolation can be achieved by various techniques, such as nearest neighbor, bi-linear interpolation, or bi-cubic interpolation, for example.
- polynomial interpolation is used (e.g., a two-dimensional (for images) or a three-dimensional (for volumes) generalization of a Savitzky-Golay filter), which not only provides image or volume intensity interpolation, but also provides partial derivatives of the intensity along the line.
- the directional derivatives e.g., first and second derivatives
- the anomaly-detection device may later use the intensity profile along the line and one or more of the intensity derivatives along the line.
- the target region may be defined by a user.
- the anomaly-detection device may allow the user to mark the reference image 391 with lines (or other target regions) of interest. This may allow the user to define regions or measurements that are of critical importance to the viability of the component being imaged. And, in some embodiments, the anomaly-detection device determines one or more of the target regions, for example regions that correspond to structural walls or channels.
- a plurality of training images 392 of the component are obtained by the anomaly-detection device.
- the training images 392 as well as the reference image 391 —depict the component in approximately the same orientation and scale.
- the flow then continues to block B 320 , where the anomaly-detection device aligns each of the plurality of training images 392 to the reference image 391 .
- the alignment may include some degree of non-linear warping, rotation, and scaling, for example.
- the output of block B 320 is a respective alignment map 393 for each training image 392 that describes transformations that map the coordinates in the training image 392 to the coordinates of the reference image 391 .
- the first and second key points are points along the line that can be easily recognized from one image to the next image.
- the first and second key points may be selected based on the line's intensity profile, and examples of key points include the following: inflection points along edges, peak intensities, and profile corners at the junction of various intensity regions.
- the anomaly-detection device maps the target region in the reference image 391 to a respective target region in each of the training images 392 .
- the mapping is obtained by using the inverse of the alignment map 393 between the respective training image 392 and the reference image 391 .
- Target regions that correspond to each other depict the same location or approximately the same location on the component.
- the target regions in the training images 392 correspond to the target region in the reference image 391 .
- the target regions in the training images 392 may correspond to each other.
- the anomaly-detection device selects a pair of key points, which includes a third key point and a fourth key point, in the target region in each training image 392 (each target region in each training image 392 has its own third key point and fourth key point).
- the third key point and the fourth key point respectively correspond to the first key point and second key point in the reference image.
- Key points that correspond to each other have the same location or approximately the same location on the component. Accordingly, all of the third key points may correspond to each other, and all of the fourth key points may correspond to each other.
- the anomaly-detection device measures the respective distance between the third and fourth key points in each pair of third and fourth key points.
- the reference image 391 is chosen from the plurality of training images 392 , and therefore the distance between the first and second key points of the reference image 391 is also included in the distances measured.
- the anomaly-detection device calculates a respective global scale factor or a respective local scale factor between each of the training images 392 and the reference image 391 and applies a correction to the respective distance in each of the training images 392 based on the respective global scale factor or the respective local scale factor.
- the anomaly-detection device statistically characterizes the plurality of distances for the target region, thereby generating a statistical characterization 394 of the target region.
- Some embodiments of the anomaly-detection device calculate a mean and a standard deviation of the distances as the statistical characterization 394 .
- some embodiments generate the statistical characterization 394 robustly using one or more of the following: a median value, a MAD (Median Absolute Deviations), or an IQR (Inter-Quartile Range), for example.
- some embodiments perform density estimation, use the distance histograms as the statistical characterization 394 , or fit the observed data to a reference probability distribution or density.
- FIG. 4 illustrates an example embodiment of an operational flow for testing an image for anomalies.
- This embodiment applies a metrology model, for example the metrology model 294 in FIG. 2 .
- the flow begins in block B 400 and moves to block B 405 , where an anomaly-detection device obtains a test image 495 (for example from an image-capturing device 110 A or 1108 in FIG. 1 ).
- the anomaly-detection device generates an alignment map 493 that the anomaly-detection device can use to align the test image 495 to a reference image 491 .
- the anomaly-detection device may project a target region from the reference image 491 to the test image 495 using the inverse of the alignment map 493 .
- the anomaly-detection device selects a pair of key points, which includes a third key point and a fourth key point, in the target region in the test image 495 based on the first and second key points that were defined in the reference image 491 .
- the third key point in the test image 495 corresponds to the first key point in the reference image 491
- the fourth key point in the test image 495 corresponds to the second key point in the reference image 491 .
- the anomaly-detection device calculates the distance between the third and fourth key points in the test image 495 . Some embodiments of the anomaly-detection device adjust the distance between the third and fourth key points in the test image 495 based on global scaling or local scaling.
- the anomaly-detection device compares the distance to the statistical characterization 494 of the target region's corresponding training distances (the distances between the third and fourth key points in the training images).
- n standard deviations from the mean or median
- the flow moves to block B 445 , where the anomaly-detection device marks the region with an abnormal marking 496 .
- training and test images are aligned and mapped directly back to the original reference-image coordinates.
- distances are implicitly scaled to the reference space, and the target regions are defined on the aligned images all in the reference-image coordinates. This may simplify some of the processing but may also present problems if the alignment includes warping, which may distort some distances.
- some embodiments use linear or affine alignment methods to prevent unanticipated contraction or dilation of distance measurements.
- these embodiments may optionally use non-linear alignment methods (local warping) to help determine correspondences between the first and third key points and the second and fourth key points.
- FIG. 5A illustrates an example embodiment of an image of a component 581 with target regions (a first target region 583 A and a second target region 583 B).
- the image shows a cross-section of the component 581 , which include three openings or channels 582 .
- Some embodiments of an anomaly-detection device generate a user interface that provides a user the ability to indicate the first target region 583 A and the second target region 583 B by drawing respective lines across regions of interest that are to be measured.
- the wall thickness of the component 581 may be of critical design importance to the structural integrity or function of the component 581 .
- a user may identify such regions in the component 581 by drawing a respective line across each region.
- FIG. 5B illustrates example embodiments of line intensity profiles.
- the y axis indicates intensity
- the x axis indicates position.
- the first target region 583 A was identified in a plurality of training images, and each line intensity profile shows the intensity of the first target region 583 A in a respective training image of the plurality of training images.
- FIG. 5B shows significant variations in the intensity profiles in the first target region 583 A.
- FIG. 6A illustrates example embodiments of line intensity profiles
- FIG. 6B illustrates the first derivatives of the line intensity profiles in FIG. 6A
- FIG. 6C illustrates the second derivatives of the line intensity profiles in FIG. 6A .
- FIG. 6A illustrates the line intensity profiles from the first target region 583 A in FIG. 5A .
- the y axis indicates intensity
- the x axis indicates position.
- the line intensity profiles in FIG. 6A , the first derivatives in FIG. 6B , and the second derivatives in FIG. 6C have been smoothed.
- the smoothed profiles and their respective derivatives were calculated by fitting each sample in the profile to a polynomial using the three neighboring samples to the left and to the right of the sample in question. This approach is sometimes referred to as a Savitzky-Golay filter.
- each point is fit to a local polynomial, derivatives of the polynomial fit can be easily calculated, provided that the polynomial order is high enough to support non-zero higher-order derivatives.
- the line profiles were linearly extrapolated by three samples on the left side and by three samples of the right side of the profiles to calculate the smoothed profiles and their derivatives at the beginnings and the ends of the profiles.
- the smoothed profiles and their derivatives may be truncated at the beginning and end or estimated causally or non-causally.
- the polynomial should be at least cubic.
- other smoothing filters such as Gaussian filters, sliding median filters, or mean filters, can be used to smooth the line intensity profiles.
- FIGS. 6B and 6C show that the intensity profile derivatives are highly repeatable across the training images.
- key points can be selected based on the line intensity profiles, based on the first derivatives of the line intensity profiles, and based on the second derivatives of the line intensity profiles.
- key points e.g., as selected in B 335 or B 345 in FIG. 3 , as selected in B 425 in FIG. 4
- anomaly-detection device uses other techniques to select key points, and above-describe embodiments present a few example embodiments.
- approximations of first derivative filters such as Prewitt and Sobel filters
- second derivative filters such as Laplacian filters
- first derivative filters such as Prewitt and Sobel filters
- second derivative filters such as Laplacian filters
- the target region in an image may be filtered with Sobel kernels in the horizontal and vertical directions, and then the resulting filter magnitudes may be projected onto the target region to select key points along the target region.
- key points to be selectable by a user based on the stability and repeatability of the key points across the set of training images.
- the anomaly-detection device provide suggestions of key point pairs to a user. For example, candidate key points may be determined based on the derivatives as described above. Then candidate key-point pairs can be ranked based on the variance or MAD of distances between the key points in the pairs so that the key points suggested to the user represent the key points that provide more consistency in measurement across the training images.
- the variation e.g., variance or MAD
- an anomaly-detection device display ranked key-point pairs on a user interface, highlight suggested key-point pairs on the user interface, and receive one or more user selections of key-point pairs via the user interface.
- FIG. 7A illustrates an example embodiment of a user interface that displays key points along a line intensity profile.
- the user interface 770 shows the line intensity profile of a reference image from FIG. 6A .
- the user interface 770 also shows various candidate key points 771 A-F.
- Candidate key points 771 A and 771 B which are marked with diamonds, were obtained from local minima of the line intensity profile's second derivative.
- Candidate key points 771 C and 771 D which are marked with squares, were obtained from the extrema of the first derivative (e.g., the maximum value and the minimum value along the intensity profile's first derivative).
- Candidate key points 771 E and 771 F which are marked with circles, were obtained from the local maxima of the second derivative of the intensity profile.
- the highlighted region 772 is a user-interface element that may be adjusted by moving the edges 773 A- 773 B of the highlighted region.
- Some embodiments of the anomaly-detection device allow the highlighted region 772 to snap to two of the candidate key points 771 A-F. In this way, the user may define the critical measurement to make along the target region's intensity profile by defining the key points. Using key points that are consistent across images improves the automation and detection of measurements in test and training images.
- key-point correspondence between third and fourth key points (e.g., as selected in B 345 in FIG. 3 , as selected in B 425 in FIG. 4 ) and first and second key points (e.g., as selected in B 335 in FIG. 3 ) along the line intensity profile is performed for a plurality of key points along the line intensity profile.
- the additional non-measurement key points may be used to more accurately register the intensity profiles between images.
- a median shift between key points along the profile may be used and can even help determine a test-image key-point location.
- some embodiments measure the distance between key points in pixels. And some embodiments measure the distance in some other unit of measurement using a conversion scale that converts the scale in the image to the other unit of measurement (e.g., that converts pixels to another unit of distance, such as a nanometer or a millimeter).
- a conversion scale that converts the scale in the image to the other unit of measurement (e.g., that converts pixels to another unit of distance, such as a nanometer or a millimeter).
- some embodiments statistically characterize variations of a plurality of key points to help the anomaly-detection device determine whether statistically significant component variation (e.g., distortion) has occurred along the intensity profile of the target region.
- statistically significant component variation e.g., distortion
- some embodiments statistically characterize the target region through a correlation or normalized correlation of the target region or line intensity profile.
- the intensity of the target region or the line intensity profile is first normalized with the intensity of the reference target region or line intensity profile or is normalized based on the statistics of a bigger region that contains the defined target region or line intensity profile.
- variations in the target region or line intensity profile can be measured wholly along the line intensity profile, instead of only a measurement of variation in distances.
- These embodiments may help further detect abnormalities in the target region.
- Some embodiments perform stretching of intensity profiles to make the profiles the same length when performing correlations. Other embodiments do not perform stretching and pad shorter profiles, for example with an average value or zero.
- find key points on the line intensity profile by finding points on the intensity profile that have a maximal orthogonal distance from a line connecting the profile extrema points.
- FIG. 7B illustrates example embodiments of distances 776 A-F between pairs of key points 771 A-F.
- the key points 771 A-F in FIG. 7B are the same as the candidate key points 771 A-F in FIG. 7A .
- the distance between a pair of key points depends on the key points 771 A-F that are selected. For example, the distance will be distance 776 A if key point 771 E and key point 771 B are selected. The distance will be distance 776 C if key point 771 A and key point 771 D are selected. The distance will be distance 776 F if key point 771 E and key point 771 F are selected.
- FIG. 8 illustrates an example embodiment of an image of a component, a target region, and key points.
- the component 581 and the first target region 583 A are the same as in FIG. 5A .
- FIG. 8 shows the candidate key points 771 A-F from FIG. 7A in the first target region 583 A.
- a pair of key points from the candidate key points 771 A-F can be used to measure the thickness of the component 581 in the first target region 583 A.
- FIG. 9 illustrates an example embodiment of a statistical characterization of the distances between key points on line intensity profiles from training images.
- FIG. 9 includes a histogram 975 of third-to-fourth key-point distances, and the histogram 975 can be used to characterize the distances. For example, a mean and a standard deviation may be calculated, and a corresponding test-image measurement (e.g., test-image measurement 976 ) may be compared against the mean and the standard deviation to determine if the test-image measurement 976 is an abnormal (e.g., outlying) measurement.
- Some embodiments use the histogram 975 to estimate the probability density of the measurements, which may reflect naturally occurring manufacturing variances of the region of the component under scrutiny.
- some embodiments use a classifier that learns abnormal and non-abnormal measurements. Additionally, although the x axis in FIG. 9 indicates the distance in pixels, some embodiments use other measures of distance (e.g., millimeters, centimeters, inches).
- some embodiments may not use a statistical characterization of the distance between key points.
- the key points are used to compare a region of a test image to a respective region of a reference image, and anomalies are generated when the measurement deviates from an expected measurement (within a specified tolerance) or deviates from the measurement (within the specified tolerance) obtained in the reference image.
- only one training image (the reference image) is needed instead of a plurality of training images.
- some embodiments may still use the plurality of training images to determine the expected measurement, to identify stable or repeatable key points, or to provide the user with feedback as to the distribution of the measurements found in the training images relative to the manufacturing tolerance. In this manner, the user can then see how close the manufacturing variation is to the specified tolerance.
- FIG. 10 illustrates an example embodiment of a system for image anomaly detection.
- the system 10 includes an anomaly-detection device 1000 , which is a specially-configured computing device; an image-capturing device 1010 ; and a display device 1020 .
- the anomaly-detection device 1000 and the image-capturing device 1010 communicate via one or more networks 1099 , which may include a wired network, a wireless network, a LAN, a WAN, a MAN, and a PAN. Also, in some embodiments the devices communicate via other wired or wireless channels.
- the anomaly-detection device 1000 includes one or more processors 1001 , one or more I/O components 1002 , and storage 1003 . Also, the hardware components of the anomaly-detection device 1000 communicate via one or more buses or other electrical connections. Examples of buses include a universal serial bus (USB), an IEEE 1394 bus, a PCI bus, an Accelerated Graphics Port (AGP) bus, a Serial AT Attachment (SATA) bus, and a Small Computer System Interface (SCSI) bus.
- USB universal serial bus
- AGP Accelerated Graphics Port
- SATA Serial AT Attachment
- SCSI Small Computer System Interface
- the one or more processors 1001 include one or more central processing units (CPUs), which may include one or more microprocessors (e.g., a single core microprocessor, a multi-core microprocessor); one or more graphics processing units (GPUs); one or more tensor processing units (TPUs); one or more application-specific integrated circuits (ASICs); one or more field-programmable-gate arrays (FPGAs); one or more digital signal processors (DSPs); or other electronic circuitry (e.g., other integrated circuits).
- CPUs central processing units
- microprocessors e.g., a single core microprocessor, a multi-core microprocessor
- GPUs graphics processing units
- TPUs tensor processing units
- ASICs application-specific integrated circuits
- FPGAs field-programmable-gate arrays
- DSPs digital signal processors
- the I/O components 1002 include communication components (e.g., a graphics card, a network-interface controller) that communicate with the display device 1020 , the network 1099 , the image-capturing device 1010 , and other input or output devices (not illustrated), which may include a keyboard, a mouse, a printing device, a touch screen, a light pen, an optical-storage device, a scanner, a microphone, a drive, and a game controller (e.g., a joystick, a gamepad).
- communication components e.g., a graphics card, a network-interface controller
- the display device 1020 e.g., the display device 1020 , the network 1099 , the image-capturing device 1010 , and other input or output devices (not illustrated), which may include a keyboard, a mouse, a printing device, a touch screen, a light pen, an optical-storage device, a scanner, a microphone, a drive, and a game controller (e.g.,
- the storage 1003 includes one or more computer-readable storage media.
- a computer-readable storage medium includes an article of manufacture, for example a magnetic disk (e.g., a floppy disk, a hard disk), an optical disc (e.g., a CD, a DVD, a Blu-ray), a magneto-optical disk, magnetic tape, and semiconductor memory (e.g., a non-volatile memory card, flash memory, a solid-state drive, SRAM, DRAM, EPROM, EEPROM).
- the storage 1003 which may include both ROM and RAM, can store computer-readable data or computer-executable instructions.
- the anomaly-detection device 1000 also includes an alignment module 1003 A, a training module 1003 B, a key-point module 1003 C, a statistics module 1003 D, an anomaly-detection module 1003 E, and a communication module 1003 F.
- a module includes logic, computer-readable data, or computer-executable instructions.
- the modules are implemented in software (e.g., Assembly, C, C++, C#, Java, BASIC, Perl, Visual Basic, Python). However, in some embodiments, the modules are implemented in hardware (e.g., customized circuitry) or, alternatively, a combination of software and hardware.
- the software can be stored in the storage 1003 .
- the anomaly-detection device 1000 includes additional or fewer modules, the modules are combined into fewer modules, or the modules are divided into more modules.
- the alignment module 1003 A includes instructions that cause the anomaly-detection device 1000 to align training images or test images (e.g., align training images or test images to a reference image) and produce corresponding alignment maps.
- some embodiments of the alignment module 1003 A include instructions that cause the anomaly-detection device 1000 to perform at least some of the operations that are described in block B 320 in FIG. 3 or in block B 410 of FIG. 4 .
- the training module 1003 B includes instructions that cause the anomaly-detection device 1000 to train a metrology model using a reference image and a plurality of training images.
- some embodiments of the training module 1003 B include instructions that cause the anomaly-detection device 1000 to perform at least some of the operations that are described in block B 210 in FIG. 2 or in blocks B 300 -B 355 in FIG. 3 .
- the training module 1003 B may call the alignment module 1003 A, the key-point module 1003 C, or the statistics module 1003 D.
- the key-point module 1003 C includes instructions that cause the anomaly-detection device 1000 to select key points in a target region (e.g., based on the target region's intensity profile). For example, some embodiments of the key-point module 1003 C include instructions that cause the anomaly-detection device 1000 to perform at least some of the operations that are described in blocks B 335 and B 345 in FIG. 3 or in block B 425 in FIG. 4 .
- the statistics module 1003 D includes instructions that cause the anomaly-detection device 1000 to generate a statistical characterization of one or more target regions.
- some embodiments of the statistics module 1003 D include instructions that cause the anomaly-detection device 1000 to perform at least some of the operations that are described in block B 355 in FIG. 3 to produce a statistical characterization 394 of a target region.
- the anomaly-detection module 1003 E includes instructions that cause the anomaly-detection device 1000 to detect one or more anomalies in target regions based on statistical characterizations of the regions. For example, some embodiments of the anomaly-detection module 1003 E include instructions that cause the anomaly-detection device 1000 to perform the operations that are described in blocks B 220 -B 260 in FIG. 2 or in blocks B 415 -B 445 in FIG. 4 . Results from the anomaly-detection module 1003 E may be shown on the display device 1020 by highlighting potential anomalies in a test image to a user of the device. Also, anomaly-detection module 1003 E may call the key-point module 1003 C.
- the communications module 1003 F includes instructions that cause the anomaly-detection device 1000 to communicate with one or more other devices (e.g., the image-capturing device 1010 , the display device 1020 ), for example to obtain one or more images from the other devices or to send one or more images to the other devices.
- one or more other devices e.g., the image-capturing device 1010 , the display device 1020
- the image-capturing device 1010 includes one or more processors 1011 , one or more I/O components 1012 , storage 1013 , a communication module 1013 A, and an image-capturing assembly 1014 .
- the image-capturing assembly 1014 includes one or more image sensors and may include one or more lenses and an aperture.
- the communication module 1013 A includes instructions that, when executed, or circuits that, when activated, cause the image-capturing device 1010 to capture an image, receive a request for an image from a requesting device, retrieve a requested image from the storage 1013 , or send a retrieved image to the requesting device (e.g., the detection device 1000 ).
- At least some of the above-described devices, systems, and methods can be implemented, at least in part, by providing one or more computer-readable media that contain computer-executable instructions for realizing the above-described operations to one or more computing devices that are configured to read and execute the computer-executable instructions.
- the systems or devices perform the operations of the above-described embodiments when executing the computer-executable instructions.
- an operating system on the one or more systems or devices may implement at least some of the operations of the above-described embodiments.
- some embodiments use one or more functional units to implement the above-described devices, systems, and methods.
- the functional units may be implemented in only hardware (e.g., customized circuitry) or in a combination of software and hardware (e.g., a microprocessor that executes software).
Landscapes
- Engineering & Computer Science (AREA)
- Quality & Reliability (AREA)
- Computer Vision & Pattern Recognition (AREA)
- Physics & Mathematics (AREA)
- General Physics & Mathematics (AREA)
- Theoretical Computer Science (AREA)
- Image Analysis (AREA)
Abstract
Description
Claims (20)
Priority Applications (1)
| Application Number | Priority Date | Filing Date | Title |
|---|---|---|---|
| US16/845,652 US11216940B2 (en) | 2019-04-15 | 2020-04-10 | Metrology-based assisted defect recognition |
Applications Claiming Priority (2)
| Application Number | Priority Date | Filing Date | Title |
|---|---|---|---|
| US201962834291P | 2019-04-15 | 2019-04-15 | |
| US16/845,652 US11216940B2 (en) | 2019-04-15 | 2020-04-10 | Metrology-based assisted defect recognition |
Publications (2)
| Publication Number | Publication Date |
|---|---|
| US20200327655A1 US20200327655A1 (en) | 2020-10-15 |
| US11216940B2 true US11216940B2 (en) | 2022-01-04 |
Family
ID=72748067
Family Applications (1)
| Application Number | Title | Priority Date | Filing Date |
|---|---|---|---|
| US16/845,652 Active 2040-06-08 US11216940B2 (en) | 2019-04-15 | 2020-04-10 | Metrology-based assisted defect recognition |
Country Status (1)
| Country | Link |
|---|---|
| US (1) | US11216940B2 (en) |
Families Citing this family (1)
| Publication number | Priority date | Publication date | Assignee | Title |
|---|---|---|---|---|
| EP4614435A1 (en) * | 2024-03-05 | 2025-09-10 | Fraunhofer-Gesellschaft zur Förderung der angewandten Forschung e.V. | Method for detecting anomalies in shaped components, device for data processing of the method and computer program product |
Citations (6)
| Publication number | Priority date | Publication date | Assignee | Title |
|---|---|---|---|---|
| US20090279772A1 (en) * | 2008-05-12 | 2009-11-12 | General Electric Company | Method and System for Identifying Defects in NDT Image Data |
| US7711514B2 (en) | 2007-08-10 | 2010-05-04 | Kla-Tencor Technologies Corp. | Computer-implemented methods, carrier media, and systems for generating a metrology sampling plan |
| US8248618B2 (en) | 2009-02-28 | 2012-08-21 | Vistec Semiconductor Systems Gmbh | Method for determining positions of structures on a mask |
| US9201022B2 (en) | 2011-06-02 | 2015-12-01 | Taiwan Semiconductor Manufacturing Company, Ltd. | Extraction of systematic defects |
| US9417058B1 (en) | 2014-10-24 | 2016-08-16 | Matrox Electronic Systems Ltd. | Detecting a position of a sheet of light in an image |
| US9754374B1 (en) | 2016-02-12 | 2017-09-05 | Matrox Electronic Systems Ltd. | Detection of a sheet of light based on second derivative |
-
2020
- 2020-04-10 US US16/845,652 patent/US11216940B2/en active Active
Patent Citations (7)
| Publication number | Priority date | Publication date | Assignee | Title |
|---|---|---|---|---|
| US7711514B2 (en) | 2007-08-10 | 2010-05-04 | Kla-Tencor Technologies Corp. | Computer-implemented methods, carrier media, and systems for generating a metrology sampling plan |
| US20090279772A1 (en) * | 2008-05-12 | 2009-11-12 | General Electric Company | Method and System for Identifying Defects in NDT Image Data |
| US8131107B2 (en) | 2008-05-12 | 2012-03-06 | General Electric Company | Method and system for identifying defects in NDT image data |
| US8248618B2 (en) | 2009-02-28 | 2012-08-21 | Vistec Semiconductor Systems Gmbh | Method for determining positions of structures on a mask |
| US9201022B2 (en) | 2011-06-02 | 2015-12-01 | Taiwan Semiconductor Manufacturing Company, Ltd. | Extraction of systematic defects |
| US9417058B1 (en) | 2014-10-24 | 2016-08-16 | Matrox Electronic Systems Ltd. | Detecting a position of a sheet of light in an image |
| US9754374B1 (en) | 2016-02-12 | 2017-09-05 | Matrox Electronic Systems Ltd. | Detection of a sheet of light based on second derivative |
Also Published As
| Publication number | Publication date |
|---|---|
| US20200327655A1 (en) | 2020-10-15 |
Similar Documents
| Publication | Publication Date | Title |
|---|---|---|
| Liu et al. | Concrete crack assessment using digital image processing and 3D scene reconstruction | |
| US8786700B2 (en) | Position and orientation measurement apparatus, position and orientation measurement method, and storage medium | |
| US10776937B2 (en) | Image processing apparatus and image processing method for setting measuring point to calculate three-dimensional coordinates of subject image with high reliability | |
| GB2569803A (en) | Analysis of a captured image to determine a test outcome | |
| Zheng et al. | Similarity evaluation of topography measurement results by different optical metrology technologies for additive manufactured parts | |
| CN105372712B (en) | Vehicle inspection method and system | |
| US11168976B2 (en) | Measuring device for examining a specimen and method for determining a topographic map of a specimen | |
| US20160292888A1 (en) | Image measurement device, and recording medium | |
| US10997712B2 (en) | Devices, systems, and methods for anchor-point-enabled multi-scale subfield alignment | |
| JP2011182397A (en) | Method and apparatus for calculating shift length | |
| CN115546145B (en) | A defect detection method, device, and electronic equipment based on machine vision | |
| TWI468658B (en) | Lens test device and method | |
| Bergström et al. | Virtual projective shape matching in targetless CAD-based close-range photogrammetry for efficient estimation of specific deviations | |
| US11216940B2 (en) | Metrology-based assisted defect recognition | |
| CN103063139A (en) | Device and method for dimension measurement | |
| CN120220053A (en) | Image deformation monitoring method, device, equipment and program product | |
| Zhu et al. | Image quality evaluation method for surface crack detection based on standard test chart | |
| US10817994B2 (en) | Method and system for obtaining a true shape of objects in a medical image | |
| Roy et al. | Abnormal regions detection and quantification with accuracy estimation from MRI of brain | |
| CN117336608A (en) | Camera parameter determination method, size detection method, device, equipment and media | |
| Icasio-Hernandez et al. | VDI/VDE 2634-2 and ISO 10360-13 performance evaluation tests, and systematic errors in structured light systems | |
| Wang et al. | Parameter calibration of a vision sensor with a geometric similarity constraint | |
| JP2013053948A (en) | Device and method for measuring camera state | |
| Park et al. | Grid refinement in adaptive non-rigid registration | |
| CN119600256A (en) | Point cloud region of interest division method, device, computer equipment and medium |
Legal Events
| Date | Code | Title | Description |
|---|---|---|---|
| FEPP | Fee payment procedure |
Free format text: ENTITY STATUS SET TO UNDISCOUNTED (ORIGINAL EVENT CODE: BIG.); ENTITY STATUS OF PATENT OWNER: LARGE ENTITY |
|
| STPP | Information on status: patent application and granting procedure in general |
Free format text: APPLICATION DISPATCHED FROM PREEXAM, NOT YET DOCKETED |
|
| AS | Assignment |
Owner name: CANON VIRGINIA, INC., VIRGINIA Free format text: ASSIGNMENT OF ASSIGNORS INTEREST;ASSIGNORS:DENNEY, BRADLEY SCOTT;ZHAO, YUNZHE;SIGNING DATES FROM 20200718 TO 20200721;REEL/FRAME:053553/0176 |
|
| STPP | Information on status: patent application and granting procedure in general |
Free format text: DOCKETED NEW CASE - READY FOR EXAMINATION |
|
| STPP | Information on status: patent application and granting procedure in general |
Free format text: NON FINAL ACTION MAILED |
|
| STPP | Information on status: patent application and granting procedure in general |
Free format text: RESPONSE TO NON-FINAL OFFICE ACTION ENTERED AND FORWARDED TO EXAMINER |
|
| STPP | Information on status: patent application and granting procedure in general |
Free format text: NOTICE OF ALLOWANCE MAILED -- APPLICATION RECEIVED IN OFFICE OF PUBLICATIONS |
|
| STPP | Information on status: patent application and granting procedure in general |
Free format text: PUBLICATIONS -- ISSUE FEE PAYMENT RECEIVED |
|
| STPP | Information on status: patent application and granting procedure in general |
Free format text: PUBLICATIONS -- ISSUE FEE PAYMENT VERIFIED |
|
| STCF | Information on status: patent grant |
Free format text: PATENTED CASE |
|
| MAFP | Maintenance fee payment |
Free format text: PAYMENT OF MAINTENANCE FEE, 4TH YEAR, LARGE ENTITY (ORIGINAL EVENT CODE: M1551); ENTITY STATUS OF PATENT OWNER: LARGE ENTITY Year of fee payment: 4 |