US11085981B2 - Magnetic resonance imaging apparatus for generating T1 map having highly accurate T1 values - Google Patents
Magnetic resonance imaging apparatus for generating T1 map having highly accurate T1 values Download PDFInfo
- Publication number
- US11085981B2 US11085981B2 US16/419,155 US201916419155A US11085981B2 US 11085981 B2 US11085981 B2 US 11085981B2 US 201916419155 A US201916419155 A US 201916419155A US 11085981 B2 US11085981 B2 US 11085981B2
- Authority
- US
- United States
- Prior art keywords
- pulse
- magnetic resonance
- inversion
- sequence
- value
- Prior art date
- Legal status (The legal status is an assumption and is not a legal conclusion. Google has not performed a legal analysis and makes no representation as to the accuracy of the status listed.)
- Active, expires
Links
Images


Classifications
-
- G—PHYSICS
- G01—MEASURING; TESTING
- G01R—MEASURING ELECTRIC VARIABLES; MEASURING MAGNETIC VARIABLES
- G01R33/00—Arrangements or instruments for measuring magnetic variables
- G01R33/20—Arrangements or instruments for measuring magnetic variables involving magnetic resonance
- G01R33/44—Arrangements or instruments for measuring magnetic variables involving magnetic resonance using nuclear magnetic resonance [NMR]
- G01R33/48—NMR imaging systems
- G01R33/50—NMR imaging systems based on the determination of relaxation times, e.g. T1 measurement by IR sequences; T2 measurement by multiple-echo sequences
-
- A—HUMAN NECESSITIES
- A61—MEDICAL OR VETERINARY SCIENCE; HYGIENE
- A61B—DIAGNOSIS; SURGERY; IDENTIFICATION
- A61B5/00—Measuring for diagnostic purposes; Identification of persons
- A61B5/05—Detecting, measuring or recording for diagnosis by means of electric currents or magnetic fields; Measuring using microwaves or radio waves
- A61B5/055—Detecting, measuring or recording for diagnosis by means of electric currents or magnetic fields; Measuring using microwaves or radio waves involving electronic [EMR] or nuclear [NMR] magnetic resonance, e.g. magnetic resonance imaging
-
- A—HUMAN NECESSITIES
- A61—MEDICAL OR VETERINARY SCIENCE; HYGIENE
- A61B—DIAGNOSIS; SURGERY; IDENTIFICATION
- A61B5/00—Measuring for diagnostic purposes; Identification of persons
- A61B5/72—Signal processing specially adapted for physiological signals or for diagnostic purposes
- A61B5/7271—Specific aspects of physiological measurement analysis
- A61B5/7285—Specific aspects of physiological measurement analysis for synchronizing or triggering a physiological measurement or image acquisition with a physiological event or waveform, e.g. an ECG signal
-
- G—PHYSICS
- G01—MEASURING; TESTING
- G01R—MEASURING ELECTRIC VARIABLES; MEASURING MAGNETIC VARIABLES
- G01R33/00—Arrangements or instruments for measuring magnetic variables
- G01R33/20—Arrangements or instruments for measuring magnetic variables involving magnetic resonance
- G01R33/44—Arrangements or instruments for measuring magnetic variables involving magnetic resonance using nuclear magnetic resonance [NMR]
- G01R33/48—NMR imaging systems
- G01R33/54—Signal processing systems, e.g. using pulse sequences ; Generation or control of pulse sequences; Operator console
- G01R33/543—Control of the operation of the MR system, e.g. setting of acquisition parameters prior to or during MR data acquisition, dynamic shimming, use of one or more scout images for scan plane prescription
-
- G—PHYSICS
- G01—MEASURING; TESTING
- G01R—MEASURING ELECTRIC VARIABLES; MEASURING MAGNETIC VARIABLES
- G01R33/00—Arrangements or instruments for measuring magnetic variables
- G01R33/20—Arrangements or instruments for measuring magnetic variables involving magnetic resonance
- G01R33/44—Arrangements or instruments for measuring magnetic variables involving magnetic resonance using nuclear magnetic resonance [NMR]
- G01R33/48—NMR imaging systems
- G01R33/54—Signal processing systems, e.g. using pulse sequences ; Generation or control of pulse sequences; Operator console
- G01R33/56—Image enhancement or correction, e.g. subtraction or averaging techniques, e.g. improvement of signal-to-noise ratio and resolution
- G01R33/5602—Image enhancement or correction, e.g. subtraction or averaging techniques, e.g. improvement of signal-to-noise ratio and resolution by filtering or weighting based on different relaxation times within the sample, e.g. T1 weighting using an inversion pulse
-
- G—PHYSICS
- G01—MEASURING; TESTING
- G01R—MEASURING ELECTRIC VARIABLES; MEASURING MAGNETIC VARIABLES
- G01R33/00—Arrangements or instruments for measuring magnetic variables
- G01R33/20—Arrangements or instruments for measuring magnetic variables involving magnetic resonance
- G01R33/44—Arrangements or instruments for measuring magnetic variables involving magnetic resonance using nuclear magnetic resonance [NMR]
- G01R33/48—NMR imaging systems
- G01R33/54—Signal processing systems, e.g. using pulse sequences ; Generation or control of pulse sequences; Operator console
- G01R33/56—Image enhancement or correction, e.g. subtraction or averaging techniques, e.g. improvement of signal-to-noise ratio and resolution
- G01R33/567—Image enhancement or correction, e.g. subtraction or averaging techniques, e.g. improvement of signal-to-noise ratio and resolution gated by physiological signals, i.e. synchronization of acquired MR data with periodical motion of an object of interest, e.g. monitoring or triggering system for cardiac or respiratory gating
- G01R33/5673—Gating or triggering based on a physiological signal other than an MR signal, e.g. ECG gating or motion monitoring using optical systems for monitoring the motion of a fiducial marker
-
- G—PHYSICS
- G01—MEASURING; TESTING
- G01R—MEASURING ELECTRIC VARIABLES; MEASURING MAGNETIC VARIABLES
- G01R33/00—Arrangements or instruments for measuring magnetic variables
- G01R33/20—Arrangements or instruments for measuring magnetic variables involving magnetic resonance
- G01R33/44—Arrangements or instruments for measuring magnetic variables involving magnetic resonance using nuclear magnetic resonance [NMR]
- G01R33/48—NMR imaging systems
- G01R33/54—Signal processing systems, e.g. using pulse sequences ; Generation or control of pulse sequences; Operator console
- G01R33/546—Interface between the MR system and the user, e.g. for controlling the operation of the MR system or for the design of pulse sequences
Definitions
- Embodiments described herein relate generally to a magnetic resonance imaging apparatus.
- Magnetic resonance imaging is an imaging method of magnetically exciting atomic nucleus spins of a subject, which is laid in a still magnetic field, using an RF signal of a Larmor frequency and reconstructing an image from an MR signal generated along with the excitation.
- T1 mapping a technique called “T1 mapping” that enables quantitatively imaging a longitudinal relaxation time (T1 value) of a tissue.
- Inversion Recovery method which is one of imaging methods concerning T1 mapping, a pulse called an inversion recovery pulse which inverts longitudinal magnetization, is used.
- a plurality of pieces of data that differ in period of time (hereinafter, referred to as “TI” (inversion time)) from an inversion pulse to a data collection are obtained by repeating application of the inversion pulse and the data collection.
- a magnetic resonance imaging apparatus calculates a T1 value on a pixel to pixel basis by using the plurality of pieces of data and each inversion time of the plurality of pieces of data and obtains a T1 map.
- MOLLI Mode-Locker Inversion Recovery
- imaging is performed over a plurality of heartbeats in the timing that the cardiac phase becomes identical, and data different in inversion time is collected.
- the application of an inversion pulse is performed plural times, and a recovery time of longitudinal magnetization is provided after the collection of data such that the longitudinal magnetization is sufficiently recovered before the application of each of inversion pulses.
- the inversion time corresponding to each image depends on the number of heartbeats at the time of imaging. For this reason, there may be a case where data cannot be collected in a desired inversion time, and a distribution of data relative to the inversion time is biased.
- the inversion time which depends on the number of heartbeats at the time of imaging, causes a degradation in the measurement accuracy of T1 values.
- the number of times an inversion pulse is applied may sometimes increase. In such a case, there is a problem that a period over which a breath is held (or a “breath-hold”) is prolonged due to an extension of the imaging time, resulting in a burden on the subject.
- FIG. 10 is a view illustrating a relaxation curve (ReL) of longitudinal magnetization in the MOLLI method, along with an electrocardiographic waveform.
- the relaxation curve ReL illustrated in FIG. 10 shows temporal changes in a relative value to a signal value (hereinafter, referred to as “relative signal value”) obtained by a data collection according to the MOLLI method.
- relative signal value a signal value obtained by a data collection according to the MOLLI method.
- the longitudinal magnetization is attenuated under the influence of an RF pulse during the collection of data.
- the influence of attenuation of the longitudinal magnetization during a data collection is indicated, for example, by ⁇ ro shown in FIG. 10 . Therefore, there is a problem that data (a signal value) in the next data collection represents a signal value lower than that shown in the original T1 relaxation curve, resulting in a degradation in the measurement accuracy of T1 values.
- a signal value does not increase in the ascending order of TI due to the influence of an RF pulse at the time of data collection and an insufficient recovery time of longitudinal magnetization. That is, as illustrated in FIG. 10 , a relative signal value MS 1 obtained by the data collection in an inversion time TI 1 after a first inversion pulse may be sometimes greater than a relative signal value MS 2 obtained by the data collection in an inversion time TI 2 after a second inversion pulse.
- a difference between the relative signal value MS 1 and the relative signal value MS 2 is represented by ⁇ rs .
- FIG. 11 is a view illustrating an example in which relative signal values of data collected by the MOLLI method are plotted against the TI (inversion times).
- the relative signal value MS 2 becomes smaller than the relative signal value MS 1 by only the difference ⁇ rs , but the relative signal values may not be increased monotonously in accordance with the inversion times. Therefore, there is a problem that the relative signal value does not increase in the ascending order of the inversion times, causing a failure of an inversion of the polarity of a signal value in the calculation process of a T1 value, which leads to a degradation of the calculation accuracy of the T1 value.
- FIG. 1 is a block view illustrating the entire configuration of a magnetic resonance imaging apparatus according to an embodiment.
- FIG. 2 is a flow chart illustrating an example of a procedure of T1 map generation processing in the embodiment.
- FIG. 3 is a view illustrating an example of a pulse relation in the embodiment along with the inversion time.
- FIG. 4 is a view illustrating an example of a plurality of T1 sequences respectively corresponding to a plurality of collection patterns in the embodiment.
- FIG. 5 is a view illustrating an example of recovery of signs of signal values in the embodiment.
- FIG. 6 is a view illustrating an example of relative errors of T1 values when a T1 sequence MI 2 using a flip angle of 10° or 13° is executed for different heart rates.
- FIG. 7 is a view illustrating, as a comparative example, an example of relative errors of T1 values when a pulse sequence having the same inversion time as the inversion time in the T1 sequence MI 2 in the embodiment, flip angle of 10° or 13°, and a collection pattern of “*/-****/**/**/*” is executed relative to different heart rates.
- FIG. 8 is a view illustrating, as a comparative example, an example of relative errors of T1 values when a pulse sequence having the same inversion time as the inversion time in the T1 sequence MI 2 in the embodiment, a flip angle of 10° or 13°, and a collection pattern of “*/***-*/**/**/*” is executed relative to different heart rates.
- FIG. 9 is a view illustrating an example of calculation results of relative signal values in a certain pixel relating to a T1 sequence in the case where the collection pattern is “*-/*-*-*-/-*/*” in the embodiment.
- FIG. 10 is a view illustrating a relaxation curve of longitudinal magnetization in a conventional MOLLI method, along with an electrocardiographic waveform.
- FIG. 11 is a view illustrating an example where data collected in a conventional MOLLI method is plotted as relative signal values against the TI (inversion times).
- FIG. 12 is a view illustrating an example of T1 map generation processing in a variation of the embodiment.
- FIG. 13 is a view illustrating an example of an entered GUI and a selection guideline list displayed on a display screen of a display, in the variation of the embodiment.
- FIG. 14 is a view illustrating an example of a T1 recovery graph in the variation of the embodiment.
- FIG. 15 is a view illustrating an example of an accuracy heartbeat graph in the variation of the embodiment.
- FIG. 16 is a view illustrating an example of an accuracy T1 graph in the variation of the embodiment.
- FIG. 17 is a view illustrating an example of an accuracy flip graph according to a heart rate in the variation of the embodiment.
- a magnetic resonance imaging apparatus includes sequence control circuitry and processing circuitry.
- the sequence control circuitry executes a pulse sequence for collecting magnetic resonance signals in a plurality of collecting timings along a relaxation curve of longitudinal magnetization in synchronization of heartbeats or blood beats.
- the processing circuitry generates a T1 map representing a distribution of T1 values by using the magnetic resonance signals collected in the plurality of collection timings.
- the pulse sequence is set so as not to collect any magnetic resonance signal in at least one heartbeat or at least one blood beat among a plurality of heartbeats or a plurality of blood beats included between a first inversion pulse which inverts a polarity of the longitudinal magnetization and a second inversion pulse which is applied after applying the first inversion pulse, and so as to collect a magnetic resonance signal in a heartbeat or a blood beat subsequent to the at least one heartbeat or the at least one blood beat in which no magnetic resonance signal is collected.
- An object is to generate a T1 map having highly accurate T1 values.
- MRI apparatus magnetic resonance imaging apparatus
- FIG. 1 is a block view illustrating the entire configuration of an MRI apparatus 1 according to the embodiment.
- the MRI apparatus 1 includes a static field magnet 101 , a gradient magnetic field coil 103 , a gradient magnetic field power supply 105 , a couch 107 , couch control circuitry 109 , transmission circuitry (transmission unit) 113 , a transmit coil 115 , a receive coil 117 , reception circuitry (reception unit) 119 , sequence control circuitry (sequence control unit) 121 , an interface (accepting unit) 125 , a display (display unit) 127 , a storage apparatus (storage unit) 129 , and processing circuitry (processing unit) 131 .
- a pintle mount 10 in the MRI apparatus 1 includes the static field magnet 101 , the gradient magnetic field coil 103 , and the transmit coil 115 .
- the pintle mount 10 may include a hollow cylinder-shaped shim coil between the static field magnet 101 and the gradient magnetic field coil 103 .
- the static field magnet 101 is a magnet formed, for example, in a hollow cylindrical shape.
- the static field magnet 101 generates a uniform static field in a bore 111 corresponding to a space into which a subject P is inserted.
- As the static field magnet 101 for example, a superconducting magnet, or the like is used.
- the gradient magnetic field coil 103 is a coil formed, for example, in a hollow cylindrical shape.
- the gradient magnetic field coil 103 is disposed in the inside of the static field magnet 101 .
- the gradient magnetic field coil 103 is formed by combining three coils corresponding to X-, Y- and Z-axes which are orthogonal to each other.
- the Z-axis direction is identical to the direction of the static magnetic field.
- the Y-axis direction is a vertical direction.
- the X-axis direction is a direction perpendicular to the Z-axis and Y-axis.
- the gradient magnetic field coil 103 generates a gradient magnetic field to be superposed on the static magnetic field.
- the three coils in the gradient magnetic field coil 103 individually receive supply of currents from the gradient magnetic field power supply 105 and generate a gradient field with a field intensity varying along each of the X-, Y- and Z-axes.
- the gradient fields of the X-, Y- and Z-axes which are generated by the gradient magnetic field coil 103 , form, for example, a frequency encode gradient magnetic field (also referred to as “readout gradient magnetic field”), a phase encode gradient field, and a slice selection gradient field.
- the frequency encode gradient magnetic field is utilized in order to vary the frequency of a magnetic resonance (hereinafter, referred to as “MR (Magnetic Resonance)”) signal in accordance with a spatial position.
- MR Magnetic Resonance
- the phase encode gradient field is utilized in order to vary the phase of the MR signal in accordance with a spatial position.
- the slice selection gradient field is utilized in order to determine an imaging cross section.
- the gradient fields of the X-, Y- and Z-axes generated by the gradient magnetic field coil 103 are used as re-convergence pulses in which the direction of the gradient magnetic field is inverted twice in order to make, for example, phases of spins on the X-Y plane re-converge.
- the gradient magnetic field power supply 105 is a power supply device which supplies current to the gradient magnetic field coil 103 under the control of the sequence control circuitry 121 .
- the couch 107 is an apparatus which includes a couch top 1071 on which the subject P is placed. Under the control of the couch control circuitry 109 , the couch 107 inserts the couch top 1071 on which the subject P is placed into the bore 111 .
- the couch 107 is disposed in an inspection room such that the longitudinal direction of the couch 107 is parallel to the center axis of the static field magnet 101 .
- the couch top 1071 includes a plurality of coil ports to which the receive coil 117 can be connected.
- the subject P is placed on the couch top 1071 .
- a connector provided at one end of a cable in the receive coil 117 is connected to one coil port 1073 of the plurality of coil ports.
- the location where the coil ports are arranged is not limited to the couch top 1071 , and the coil ports may be provided in the couch 107 , the pintle mount 10 , or the like.
- a signal line from the coil port 1073 is connected to the reception circuitry 119 . If the receive coil 117 has a transmission function with a high-frequency magnetic field, the signal line (not shown in FIG. 1 ) from the coil port 1073 is also connected to the transmission circuitry 113 in addition to the reception circuitry 119 .
- the couch control circuitry 109 is circuitry which controls the couch 107 .
- the couch control circuitry 109 drives the couch 107 by means of instructions of the operator via the interface 125 to thereby move the couch top 1071 in the longitudinal direction, in the up-and-down direction, and in some situations, in the lateral direction.
- the transmission circuitry 113 supplies high-frequency pulses modulated using a Larmor frequency to the transmit coil 115 by the control of the sequence control circuitry 121 .
- the transmit coil 115 is an RF coil disposed within the gradient magnetic field coil 103 .
- the transmit coil 115 generates an RF (Radio Frequency) pulse corresponding to a high-frequency magnetic field in accordance with an output from the transmission circuitry 113 .
- the transmit coil 115 is, for example, a coil for whole body (hereinafter, referred to as “WB (whole body) coil”).
- the WB coil may be used as a transmit/receive coil.
- the transmit coil 115 may be a WB coil formed from one coil.
- the receive coil 117 is an RF coil disposed within the gradient magnetic field coil 103 .
- the receive coil 117 receives an MR signal radiated from the subject P by a high-frequency magnetic field and outputs the received MR signal to the reception circuitry 119 .
- the receive coil 117 is, for example, a coil array including one or more, typically, a plurality of coil elements.
- FIG. 1 illustrates the transmit coil 115 and the receive coil 117 as separate RF coils; however, the transmit coil 115 and the receive coil 117 may be executed as an integrated transmit/receive coil.
- the transmit/receive coil corresponds to an imaging site of the subject P, for example, a local transmit/receive RF coil like a head coil.
- the reception circuitry 119 generates a digital MR signal (hereinafter, referred to as “MR data”), based on the MR signal output from the receive coil 117 under the control of the sequence control circuitry 121 . Specifically, the reception circuit 119 performs various kinds of signal processing for the MR signals output from the receive coil 117 , and thereafter executes an analogue/digital (A/D (Analog to Digital)) conversion for data that has been subjected to the various kinds of signal processing. The reception circuitry 119 samples the A/D-converted data (sampling). With this configuration, the reception circuitry 119 creates MR data. The reception circuitry 119 outputs the created MR data to the sequence control circuitry 121 .
- MR data digital MR signal
- the sequence control circuitry 121 controls the gradient magnetic field power supply 105 , the transmission circuitry 113 , and the reception circuitry 119 in accordance with an imaging protocol output from the processing circuitry 131 , and takes images of the subject P.
- the imaging protocol includes various kinds of pulse sequences according to inspections.
- the intensity of current supplied from the gradient magnetic field power supply 105 to the gradient magnetic field coil 103 , the timing in which the current is supplied from the gradient magnetic field power supply 105 to the gradient magnetic field coil 103 , the intensity or the time width of a high-frequency pulse supplied from the transmission circuitry 113 to the transmit coil 115 , the timing in which the high-frequency pulse is supplied from the transmission circuitry 113 to the transmit coil 115 , and the timing in which an MR signal is received by the receive coil 117 are set.
- the interface 125 includes circuitry which accepts various kinds of instructions or entries of information from an operator.
- the interface 125 includes circuitry relating to, for example, a pointing device, such as a mouse, or an input device, such as a keyboard.
- the circuitry included in the interface 125 is not limited to circuitry relating to physical operational components, such as a mouse and a keyboard.
- the interface 125 may include processing circuitry of such an electric signal that receives an electric signal corresponding to an input operation from an external input device which is provided separately from the MRI apparatus 1 and outputs the received electric signal to various kinds of circuitry.
- Biosignal measuring devices typified by an electrocardiograph, a sphygmograph, a phonocardiograph, a pulse counter, and a respiration sensor, external storage devices (not shown), and a network may be connected to the interface 125 .
- the interface 125 outputs, to the processing circuitry 131 , an R wave of an electrocardiographic waveform transmitted from an ECG electrode attached to the subject P.
- the display 127 is a display device, for example, a CRT display, a liquid crystal display, an organic EL display, an LED display, a plasma display, or other discretional display or monitor known in this technical field.
- the display 127 displays, under the control of a system control function 1311 in the processing circuitry 131 , various MR images generated by an image generation function 1313 , a T1 sequence selected by a T1 sequence determining function 1315 (to be described later), a T1 map generated by a T1 map generation function 1317 , and various kinds of information relating to imaging and image processing.
- the T1 map is an image in which a value (T1 value) of a relaxation time is provided on a pixel to pixel basis.
- the T1 sequence is a pulse sequence to collect MR data in a plurality of timings along a relaxation curve of the longitudinal magnetization in synchronization with heartbeats or blood beats and is composed of a value of inversion time (TI) from an inversion pulse to a data collection, and a collection pattern.
- the T1 sequence is a pulse sequence which is executed for, for example, an organ showing a periodic movement, such as a heart, as an imaging target, to collect MR signals relating to generation of a T1 map.
- the collection pattern corresponds to a collection rule schematically showing imaging which is executed on a heartbeat or a blood beat before the initial inversion pulse of a plurality of inversion pulses which invert the polarity of the longitudinal magnetization in a T1 sequence (hereinafter, referred to as “pre-inversion imaging”); a heartbeat or a blood beat in which no MR data is collected in at least one heartbeat or at least one blood beat among a plurality of heartbeats or a plurality of blood beats after the initial inversion pulse (hereinafter, referred to as “non-read-out period”); and a plurality of inversion pulses which are executed without waiting for recovery of relaxation of the longitudinal magnetization (hereinafter, referred to as “unrelaxed IR pulses”).
- pre-inversion imaging a heartbeat or a blood beat in which no MR data is collected in at least one heartbeat or at least one blood beat among a plurality of heartbeats or a plurality of blood beats after the initial inversion pulse
- the storage apparatus 129 stores MR data supplied to a k-space via the image generation function 1313 , image data generated by the image generation function 1313 , a T1 map generated by the T1 map generation function 1317 , and the like.
- the storage apparatus 129 stores a plurality of collection patterns according to a relation (hereinafter, referred to as “pulse relation”) among heartbeats or blood beats, collection timings of MR signals, and an inversion pulse.
- the storage apparatus 129 stores imaging conditions, etc. including a plurality of imaging parameters that define an imaging protocol.
- the pulse relation corresponds to at least one imaging parameter in a T1 sequence.
- the storage apparatus 129 stores programs corresponding to various functions executed by the processing circuitry 131 .
- the storage apparatus 129 is, for example, a semiconductor memory device, such as RAM (Random Access Memory) and a flash memory; a hard disk drive; a solid state drive, or an optical disc.
- the storage apparatus 129 may be a drive which reads/writes various information from/to a portable storage medium.
- the processing circuitry 131 includes, as hardware resources, a processor (not shown) and memories, such as a ROM (Read-Only Memory) and a RAM, to control the MRI apparatus 1 .
- the processing circuitry 131 includes the system control function 1311 , the image generation function 1313 , the T1 sequence determining function 1315 , and the T1 map generation function 1317 .
- Various functions performed by the system control function 1311 , image generation function 1313 , T1 sequence determining function 1315 , and T1 map generation function 1317 are stored in the storage apparatus 129 in the form of programs executable by a computer.
- the processing circuitry 131 is a processor that realizes a function corresponding to each program by reading out a program corresponding to each of these various functions from the storage apparatus 129 and executing the program.
- the processing circuitry 131 in a state of reading out various programs has a plurality of functions illustrated in the processing circuitry 131 in FIG. 1 .
- FIG. 1 the embodiment is described in which these various functions are realized by single processing circuitry 131 ; however, a plurality of independent processors may be combined to structure processing circuitry 131 in such a manner that each of the processors realizes a function by executing a program.
- the processing circuitry 131 may be a case where the above described respective functions are configured as programs, and one processing circuitry executes each program, or may be a case where a specific function is mounted on dedicated independent program-executing circuitry.
- processor means, for example, a CPU (Central Processing Unit), a GPU (Graphics Processing Unit), or circuitry such as an ASIC (Application Specific Integrated Circuit), a programmable logic device (e.g. SPLD (Simple Programmable Logic Device), CLPD (Complex Programmable Logic Device), FPGA (Field Programmable Gate Array)), or the like.
- a CPU Central Processing Unit
- GPU Graphics Processing Unit
- ASIC Application Specific Integrated Circuit
- SPLD Simple Programmable Logic Device
- CLPD Complex Programmable Logic Device
- FPGA Field Programmable Gate Array
- the processor realizes various functions by reading out and executing the programs stored in the storage apparatus 129 .
- the processor instead of storing the programs in the storage apparatus 129 , such a configuration may be adopted that the programs are directly incorporated in the circuitry in the processor.
- the processor realizes the functions by reading out and executing the programs incorporated in the circuitry in the processor.
- the couch control circuitry 109 , the transmission circuitry 113 , the reception circuitry 119 , and the sequence control circuitry are similarly composed of electronic circuitry such as the above described processor.
- system control function 1311 image generation function 1313 , T1 sequence determining function 1315 , and T1 map generation function 1317 included in the processing circuitry 131 are examples of a system controlling unit, an image generating unit, a T1 sequence determining unit, and a T1 map generating unit, respectively.
- the processing circuitry 131 controls various types of circuitry in the MRI apparatus 1 by the system control function 1311 . Specifically, the processing circuitry 131 reads out a system control program stored in the storage apparatus 129 , develops the read-out control program on the memory, and controls each circuitry of the MRI apparatus 1 in accordance with the developed control program. For example, the processing circuitry 131 reads out an imaging protocol from the storage apparatus 129 by the system control function 1311 , based on the image conditions entered by an operator via the interface 125 . The processing circuitry 131 may be configured to generate an imaging protocol based on the imaging conditions. The processing circuitry 131 transmits the imaging protocol to the sequence control circuitry 121 and controls various kinds of imaging for a subject P.
- the processing circuitry 131 fills MR data in a k-space by the image generation function 1313 .
- the processing circuit 131 generates an MR image by performing the Fourier transform on the MR data filled in the k-space.
- the image generation function 1313 , T1 sequence determining function 1315 , and T1 map generation function 1317 will be described later.
- T1 map generation processing the processing including imaging relating to the generation of a T1 map according to the present embodiment (hereinafter, referred to as “T1 map generation processing) will be explained.
- the interface 125 acquires heartbeats of a subject P from an electrocardiograph (not shown).
- the interface 125 may acquire a blood beat of the subject P from a pulse meter (not shown).
- FIG. 2 is a flow chart showing an example of the procedure of the T1 map generation processing.
- An interface 125 accepts a setting of a pulse relation in a T1 sequence from an operator.
- the interface 125 accepts at least one of the range of a heart rate or the range of a pulse rate, a plurality of inversion times, and the number of inversion pulse times (hereinafter, referred to “the number of inversion times”).
- the interface 125 outputs the setting of the pulse relation to a processing circuitry 131 .
- FIG. 3 is a view illustrating an example of a pulse relation along with inversion times.
- the pulse relation includes pre-inversion imaging executed in a heartbeat prior to a first inversion pulse IR 1 , a plurality of non-read-out periods respectively corresponding to a plurality of heartbeats in which read-out of MR signals is not executed after the execution of the first inversion pulse IR 1 (in other words, no RF pulse is applied to the subject P), and a plurality of unrelaxed IR pulses.
- a plurality of collection timings are each represented by a symbol “*”. Specifically, the plurality of collection timings illustrated in FIG.
- the third imaging I 3 in which the inversion time TI corresponds to 60 ms+2 ⁇ an RR interval
- the fourth imaging I 4 in which the inversion time TI corresponds to 60 ms+4 ⁇ an RR interval
- the fifth imaging I 5 in which the inversion time TI corresponds to 97 ms
- the sixth imaging I 6 in which the inversion time TI corresponds to 97 ms+an RR interval
- the eighth imaging I 8 in which the inversion time TI corresponds to 157 ms+an RR interval
- the ninth imaging I 9 in which the inversion time TI corresponds to 253 ms.
- MR signals are collected at the first imaging I 1 before the first inversion pulse IR 1 is applied to the subject P.
- a non-read-out period is represented by a symbol “-”.
- the non-read-out period shown in FIG. 3 is set at NI in the second heartbeat immediately after the first inversion pulse IR 1 and at NI in the fifth heartbeat.
- a plurality of unrelaxed IR pulses in FIG. 3 correspond to a second inversion pulse IR 2 , a third inversion pulse IR 3 , and a fourth inversion pulse IR 4 .
- the processing circuitry 131 selects one collection pattern from a plurality of collection patterns, based on the setting accepted by the T1 sequence determining function 1315 in Step Sa1.
- a collection pattern when an inversion pulse is represented by a symbol “/”, a collection timing is represented by a symbol “*”, and a non-read-out period is represented by a symbol “-”, a collection pattern corresponding to FIG. 3 results in “*/-**-*/**/**/*”.
- the processing circuitry 131 makes the selected collection pattern displayed as a setting screen of imaging conditions on a display 127 . At this time, the processing circuitry 131 may cause the display 127 to display the setting accepted via the interface 125 along with the selected collection pattern.
- FIG. 4 is a view illustrating an example of a plurality of T1 sequences respectably corresponding to a plurality of collection patterns.
- a storage apparatus 129 stores a correspondence list of the plurality of collection patterns relative to settings of a plurality of pulse relations.
- the plurality of collection patterns stored in the storage apparatus 129 are not limited to the collection patterns illustrated in FIG. 4 .
- the processing circuitry 131 selects a collection pattern indicating “*/-**-*/**/**/*” among the plurality of collection patterns shown in FIG. 4 .
- the processing circuitry 31 selects a collection pattern indicating “*-/*-*-*-/-*/*” among the plurality of collection patterns by a T1 sequence determining function 1315 .
- the plurality of T1 sequences shown in FIG. respectively include a combination of pre-inversion imaging, a collection pattern having at least one of the three references (to be described later), and a plurality of inversion times.
- pre-inversion imaging and the three references will be described in detail.
- a parameter A indicating a signal value of an MR signal at the time of an infinite inversion time, i.e., at the time when the longitudinal magnetization completely recovers, and a parameter B′ in which “1” is added to the efficiency of an inversion pulse (hereinafter, referred to as “inversion efficiency”) are indirectly calculated.
- the parameter A is a relative signal value with reference to a signal value of an MR signal corresponding to the longitudinal magnetization in a thermal equilibrium state prior to the execution of the MOLLI method (hereinafter, referred to as “thermal equilibrium signal value”). Therefore, calculation errors in the parameter A and parameter B′ calculated in the calculation process of a T1 value result in an error factor.
- the following factors have an influence on the value of the parameter A and the value of the parameter B′.
- the factors are a change in signal value due to the application of an RF pulse at the time of reading out an MR signal (hereinafter, referred to as “read-out change”), applying an invention pulse before the longitudinal magnetization completely recovers, and the inversion efficiency being not “1”, Due to these factors, a systematic error occurs in the calculated T1 value.
- an effective flip angle is required which corresponds to a pixel value of each of a plurality of pixels in a B1 map representing a distribution of transmission intensities of an RF pulse.
- additional imaging for example, a double angle method is required in addition to the MOLLI method, leading to a problem in which the imaging time is prolonged.
- the pre-inversion imaging in a T1 sequence in the present embodiment it is possible to collect a signal value of an MR signal which is close to a signal value obtained when the longitudinal magnetization completely recovers.
- the signal values collected by pre-inversion imaging correspond to thermal equilibrium signal values.
- the signal values collected by the pre-inversion imaging may be used to determine the inversion efficiency, based on the relation with the signal values collected immediately after the next inversion pulse, for example, a comparison therebetween. Thereby, the accuracy of the estimation of the inversion efficiency is improved in the processing of Step Sa6 (to be described later) using thermal equilibrium signal values. Therefore, the accuracy of the estimation of a read-out change is improved even if a rough flip angle is used.
- a signal value also referred to as “signal intensity”
- sign-attached signal values are used in calculation of T1 values.
- the signal values pixel values at the same position in a plurality of MR images respectively corresponding to a plurality of inversion times are used. Since the pixel values in MR images are represented by absolute values of signal values, a negative sign needs to be recovered for the signal values in the plurality of MR images at the prior step of the calculation of a T1 value.
- a signal value provided with a sign (hereinafter, referred to as “sign-attached signal value”) F 1 is generated by selecting signal values whose signs are inverted from a plurality of signal values (hereinafter, referred to as absolute values) F Ni respectively corresponding to a plurality of pixels at the same position of a plurality of MR images and inverting the sign of the selected signal values.
- the subscript “N” is the total number of MR images generated by the execution of the T1 sequence.
- a sign-attached signal value is generated by multiplying an absolute value in an MR image generated before Np corresponding to a specific “i” (i ⁇ Np) by ⁇ 1 as shown in the cases described below.
- F i ⁇ F Ni ( i ⁇ Np )
- F i F Ni ( t ⁇ Np )
- sign-attached signal values are generally arranged in the ascending order relative to the inversion times except for an influence of noise
- sign-attached signal values can be generated by the above described method.
- the absolute values on or after Np are not arranged in the ascending order relative to the inversion times as illustrated in, for example, FIG. 11 .
- a T1 value is calculated using erroneously generated sign-attached signal values, and the calculated T1 value resultantly has a significant calculation error.
- the plurality of collection patterns in the T1 sequence are set such that the signal intensity of an MR signal is monotonously increased with the ascending order of the inversion time from the time point of applying an inversion pulse to the time point of each of the plurality of collection timings. Furthermore, since a non-read-out period can be set discretionally in accordance with the first reference after an inversion pulse “/” as shown by the symbol “-” in the collection patterns in FIG. 4 , the sign can be recovered such that the sign-attached signal value can be monotonously increased along the ascending order of the inversion time, making it possible to improve the calculation accuracy of T1 values.
- a gradient magnetic field may be applied similarly to the case of collecting an MR signal.
- the influence of the eddy from the gradient magnetic field in a receive coil can be kept in the same manner as in the case of imaging, the pattern of generated sounds during the imaging can be made homogeneous over the execution period of the T1 sequence. With this configuration, it is possible to reduce a psychological burden to a subject P in the execution period of the T1 sequence.
- the collection timings may be determined at the processing circuitry 131 or may be preliminarily determined, for example, by an apparatus different from the MRI apparatus 1 , for example, a work station.
- a plurality of signal intensities accompanied by signs to be collected in a certain collection pattern are estimated using a simulation, etc. in each of a plurality of inversion times.
- a drop width of a signal intensity can be calculated by determining a difference, from an estimated value of a signal intensity in a certain inversion time among a plurality of inversion times, a signal value corresponding to an inversion time longer than this inversion time.
- a maximum value of the calculated drop widths (hereinafter, referred to as “maximum drop width”) is specified for each of the plurality of invention times.
- a signal intensity which is estimated when a signal is tentatively collected (hereinafter, referred to as “tentative estimation value”) is calculated in the same manner as in the above described procedure.
- a maximum value (hereinafter, referred to as “tentative maximum drop width”) is specified by using the tentative estimation value in the same manner as in the above described procedure.
- a plurality of collection timings are determined such that the maximum drop width is smaller than all tentative maximum drop widths or the maximum drop width is equal to or less than 0.
- FIG. 5 is a view illustrating an example of a recovery of signs of signal values.
- the horizontal axes in the graphs illustrated in FIG. 5 indicate the inversion time (TI).
- the vertical axes of the graphs in FIG. 5 indicate signal values (pixel value) of pixels in MR images.
- the upper graph 5 UG in FIG. 5 shows a distribution of signal values of the same pixel in a plurality of MR images generated based on the MR signal collected in each of the plurality of inversion times relative to a plurality of inversion times. Since the pixel values in the MR images are represented by absolute values, all signal values are positive as shown in the upper graph 5 UG.
- the lower graph 5 DG in FIG. 5 is a view showing an example in which the two signal values in inversion times shorter than the invention time with the smallest signal value in the graph 5 UG are symmetrically inverted relative to the horizontal axis.
- a plurality of sign-attached signal values monotonously increase with an increase in the inversion time, in other words, in the ascending order in line with the ascending order of the invention time, and it is possible to calculate a T1 value with high accuracy. That is, the calculation errors in T1 values can be reduced by the execution of a T1 sequence based on the first reference.
- the T1 sequence MI 2 in which the range of a heart rate is wide, and the number of inversion times is 4 has a non-read-out period in the fourth heartbeat after application of the first inversion pulse.
- the collection pattern of the T1 sequence MI 2 is “*/-**-*/**/**/*” as shown in FIG. 3 .
- the inversion times in the T1 sequence MI 2 are 60, 97, 157, and 253 in the ascending order.
- a read-out i.e., a collection of an MR signal is performed in the fourth heartbeat NI after application of the first inversion pulse IR 1 .
- the intervals of read-out in the case of a high heart rate shorten, and thus the calculation error concerning a large T1 value increases.
- FIG. 6 is a view illustrating an example of relative errors of T1 values when the T1 sequence MI 2 using a flip angle 10° or 13° is executed relative to different heart rates. As illustrated in FIG. 6 , in the case of a collection pattern of “*/-**-*/**/**/*”, the relative errors of the calculated T1 values are small values of 2% or less, regardless of the heart rate and the flip angle.
- FIG. 7 is a view illustrating, as a comparative example, an example of relative errors of T1 values when a pulse sequence having the same inversion times as those of the T1 sequence MI 2 , a flip angle of 10° or 13°, and a collection pattern of “*/-****/**/**/*” is executed relative to different heart rates.
- the calculated relative errors of T1 values increase with an increase in the heart rate and an increase in the flip angle as compared with the relative errors of T1 values shown in FIG. 6 .
- a T1 sequence when imaging is executed over three or more heart beats or three or more blood beats following the application of an inversion pulse, a T1 sequence includes a non-read-out period in which MR data is not collected in at least one heartbeat or at least one blood beat of a plurality of heartbeats or a plurality of blood beats included between a time point of application of an inversion pulse and a time point of application of the next inversion pulse executed after the application of the invention pulse.
- a T1 sequence relating to the second reference includes one or more non-read-out periods during a plurality of heart beats respectively corresponding to a plurality of collections by using an imaging-related inversion pulse in a collection pattern including an inversion pulse (hereinafter, referred to as “imaging-related inversion pulse”) relating to a plurality of collections over three or more heart beats after a certain inversion pulse.
- imaging-related inversion pulse an inversion pulse
- the T1 sequence MI 2 in FIG. 4 includes a non-read-out period immediately after the first inversion pulse IR 1 as illustrated in FIG. 3 .
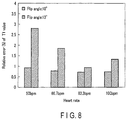
- FIG. 8 is a view illustrating, as a comparative example, an example of relative errors of T1 values in the case of executing a pulse sequence having the same inversion times as the inversion times in the T1 sequence MI 2 , a flip angle of 10° or 13°, and a collection pattern of “*/***-*/**/**/*” relative to different heart rates. As shown in FIG.
- the calculated relative errors of T1 values increase as the flip angle is increased and the heart rate lowers as compared with the relative errors of T1 values shown in FIG. 6 . That is, as illustrated in FIG. 8 , the calculation accuracy of a large T1 value when the heart rate is low degrades as compared with the calculation accuracy shown in FIG. 6 . Such a degradation in calculation accuracy tends to occur when the inversion time is short. This phenomenon can be avoided, for the imaging to be performed when the inversion time is short, by not collecting an MR signal immediately after an inversion pulse or not collecting an MR signal immediately before an inversion pulse.
- a T1 sequence includes a non-read-out period in which no MR data is collected in a heartbeat or a blood beat immediately before an inversion pulse or in a heartbeat or a blood beat immediately after an inversion pulse.
- an inversion pulse may be applied to a subject P at short intervals, for example, at intervals of five or less heartbeats or five or less blood beats, in addition to the above described contents.
- a collection pattern having short inversion times can be set in such a manner that an inversion pulse is applied before the longitudinal magnetization completely recovers. It is possible to obtain the same information (signal values) as in the case of collecting an MR signal in an inversion time corresponding to the time interval of two collections of MR signals immediately after the inversion pulse by executing the inversion pulse before the longitudinal magnetization completely recovers.
- a common collection method such as a MOLLI method in which an MR signal is collected after waiting for recovery of the longitudinal magnetization
- a collection of an MR signal in a long inversion time is required to collect a T1 value with high accuracy.
- a large T1 value can be calculated with high accuracy even if an inversion time relating to the execution of collection is short.
- the processing circuitry 131 repeats the processing of Step Sa1 and the processing of Sat by the T1 sequence determining function 315 (Step Sa3: “Yes”).
- the processing circuitry 131 determines a T1 sequence using the selected collection pattern and the accepted setting. It should be noted that the processing circuitry 131 may automatically determine a T1 sequence based on imaging conditions including the heart rate of a subject, presence or absence of use of an imaging agent, the frequency of heartbeat fluctuation, and the like.
- the processing circuitry 131 determines a T1 sequence as shown below responsive to an entry of the instruction for determining a T1 sequence.
- the processing circuitry 131 outputs the determined T1 sequence to a sequence control circuitry 121 .
- An FFE (Fast Field Echo) sequence having a spoiler pulse that erases transverse magnetization before reading out an MR signal i.e., a spoiled gradient echo method, is used as an imaging method in the T1 sequence.
- a gradient spoiler or an RF spoiler is used as the spoiler pulse.
- the embodiment will be described assuming that a T1 sequence having a collection pattern indicating “*-/*-*-*-/-*/*” is executed by the sequence control circuitry 121 .
- the sequence control circuitry 121 executes imaging over the subject P in synchronization with the heartbeats (electrocardiogram (ECG) gated) or in synchronization with blood beats in accordance with the T1 sequence using the selected collection pattern and the accepted setting.
- the processing circuitry 131 collects an MR signal corresponding to each of the plurality of inversion times.
- the processing circuitry 131 generates an MR image corresponding to each of the plurality of inversion times using the collected MR signal by an image generation function 1313 .
- the generated MR image is made to correspond to the inversion time and stored in a storage apparatus 129 .
- the pixel value of each of a plurality of pixels in the MR images corresponds to a signal intensity that reflects the magnitude of the longitudinal magnetization at a position corresponding to a pixel.
- the processing circuitry 131 determines a T1 value by using the imaging conditions in the T1 sequence and a model simulating a change in the longitudinal magnetization using T1 values as parameters by a T1 map generation function 1317 so that a difference between a signal value corresponding to each of the plurality of inversion times and a pixel value in each of the plurality of MR images becomes minimum. With this configuration, the processing circuitry 131 executes determination of a T1 value in the MR images on a pixel to pixel basis.
- the processing circuitry 131 determines such a T1 value that minimizes a value of an objective function using a T1 value as a variable (unknown number) in the optimization on a pixel to pixel basis, by the T1 map generation function 1317 by using various optimization methods, such as a golden section method.
- the objective function has three main parameters: a thermal equilibrium signal value A, an inversion efficiency B, and a T1 value. As explained later, since the thermal equilibrium signal value A and the inversion efficiency B can be calculated from a calculated T1 value, the parameter in the objective function substantially becomes one variable of a T1 value.
- the objective function will be described, and then a model will be described.
- a signal value f i of an MR signal is represented by the following equation (1) by using a pixel-by-pixel relative signal value g i which is calculated by a simple simulation using a model.
- f i ( T 1 ) Ag i ( T 1 ,t 1 , . . . ,t i , . . . ,t N ,T IR1 , . . . ,T IRi , . . . T IRN ,B ) (1)
- g i is a pixel-by-pixel relative signal value calculated by a simple simulation using a model at the time point of collecting an i th MR image (a signal value obtained when a signal value when imaging is performed in a state where the longitudinal magnetization is completely relaxed is normalized to “1”)
- t 1 is an inversion time at the time point of collecting the i th MR image
- q i g i ( T 1 ,t 1 , . . . ,t i , . . . ,t N ,T IR1 , . . . ,T IRi , . . .
- Estimated values of the parameters in the equation (5) are represented by the following equation (6), based on a linear optimization formula.
- ⁇ B 2 is a normalization parameter.
- the parameters v 1 (T 1 ) and v 2 (T 2 ) obtained by the equation (6) are obtained by minimizing the following equation (7).
- the w in the equation (7) is defined by the following equation.
- the right-hand side of the equation (8) is a function of only a T1 value. Therefore, the processing circuitry 131 can calculate an estimated value of T1, ⁇ tilde over (T) ⁇ 1 by calculating such a T1 value that minimizes the right-hand side of the equation (8) by the T1 map generation function 1317 .
- a resulting signal value obtained by applying a relative signal value g i which is a result of a simple simulation using a model, to the equation (3), f ( ⁇ tilde over (T) ⁇ 1) is represented as follows.
- F ⁇ f ( ⁇ tilde over (T) ⁇ 1 ) an objective function s′ is defined by the following equation (9). s′ ⁇
- the processing circuitry 131 executes the calculation of a T1 value using the equation (9) by the T1 map generation function 1317 .
- the value of a normalization parameter ⁇ B in the penalty term is, for example, 0.05
- the value of a representative value B fix of the inversion efficiency is, for example, 0.93. If a large value, such as 1, is used as the normalization parameter ⁇ B, the parameter B is fixed to approximately the value of B fix , and the processing circuitry 131 can perform the estimation with two variables (thermal equilibrium signal value A and a T1 value). At this time, in the calculation of a T1 value, system errors caused by using the value of B increase; however, the stability against noise is improved.
- the thermal equilibrium signal value A is generally determined by a signal value of an MR signal collected in pre-inversion imaging, and thus the only completely free parameter in the objective function s′ is the value T1.
- the processing circuitry 131 can calculate, in the T1 map generation function 1317 , a signal value of an MR signal for each inversion time by a comparatively simple calculation.
- a plurality of parameters as shown below are necessary.
- an R wave is used as a trigger in the electrocardiographic waveform.
- the interval of an R wave is not constant; however, assuming that the rhythm of the R wave is constant, the processing circuitry 131 can determine the trigger interval from the heart rate of a subject P by the T1 map generation function 1317 .
- an FFE spoiled gradient echo
- the sequence concerning read-out of MR signals is, for example, a scan sequence concerning arrangement of MR data in the k-space, for example, a centric order method.
- the estimated accuracy of the inversion efficiency B is improved by using a pixel value of an MR image obtained by the centric order method in the objective function of the equation (9), because the center of the k-space most highly contributes to the contrast of an MR image.
- the sequence concerning the read-out of MR signals is not limited to the centric order method, and other scan sequence, such as a sequential order method, and radial scanning may be used.
- the pixel value of the MR image obtained based on the above assumption by the execution of the T1 sequence is proportional to the pixel value of longitudinal magnetization.
- a signal value of an MR signal in a steady state i.e., a thermal equilibrium signal value is regarded as “1”
- the magnitude of a signal value is represented as a relative value (relative signal value).
- signal changes a model of various changes in signal value (hereinafter, referred to as “signal changes”) in this simulation.
- stabilization pulses means a plurality of RF pulses which are applied to a subject P per imaging for stabilization of an MR signal immediately before applying the initial RF pulse during imaging. That is, the stabilization pulse is applied to a subject P before the application of an RF pulse in each of a plurality of collections in a T1 sequence. It is assumed that the number of application times N d of the stabilization pulse used in one imaging is fixed over a plurality of collections in the T1 sequence. It should be noted that if the stabilization pulse is not executed at the time point of the collection of an MR signal, the estimation of signal attenuation explained in this item is unnecessary.
- the processing circuitry 131 executes a calculation by the T1 map generation function 1317 , regarding a signal value at an infinite distance clock time as “1” in this simulation.
- a result of the simulation by the processing circuitry 131 is applied to the equation (9) of the objective function, from the viewpoint of the consistency with a measured value, it is convenient to normalize a signal value measured when tentatively measuring an MR signal at an infinite distance clock time to “1”.
- the processing circuitry 131 multiplies a signal value calculated in the simulation in each of the collections of an MR signal (hereinafter, referred to as “a simulation calculation value”) by a ratio 1/S Nd , which is a ratio of a thermal equilibrium signal value 1 obtained at an infinite distance clock time to a signal value when tentatively calculated at the infinite distance clock time.
- a simulation calculation value a signal value calculated in the simulation in each of the collections of an MR signal
- a signal value before the application of the stabilization pulse is represented as S j
- the signal value results in S j ⁇ cos ( ⁇ ) due to attenuation of the longitudinal magnetization with use of a flip angle ⁇ .
- the stabilization pulse is applied again.
- the signal value after the application of the stabilization pulse over the N d times may be calculated according to the number of application times of the stabilization pulse, the repetitive time, and the flip angle by the processing circuitry 131 , or may be stored in the storage apparatus 129 in the form of a correspondence list according to the number of application times of the stabilization pulse, the repetitive time, and the flip angle.
- the longitudinal magnetization is multiplied by ⁇ B by using the inversion efficiency B.
- An f(x) in the equation (13) is a signal value after a time x when a signal value so before the read-out is represented by f(0) and a flip angle is represented by ⁇ . It should be noted that the equation (13) may be used for the calculation of attenuation of a signal due to the stabilization pulse. If SSFP is used as imaging in a T1 sequence, a relative signal value g 1 is calculated by changing the model in accordance with the change in the longitudinal magnetization in the SSFP.
- the processing circuitry 131 calculates, by the T1 map generation function 1317 , signal values of MR signals in a plurality of collection timings, based on a model for calculating a change in longitudinal magnetization in a relaxation process of the longitudinal magnetization, a change in longitudinal magnetization due to an inversion pulse, a change in longitudinal magnetization due to an RF pulse used for collections of MR signals, and a change in longitudinal magnetization due to a stabilization pulse applied to a subject for stabilization of an MR signal immediately before the application of the RF pulse.
- the processing circuitry 131 calculates a T1 value such that the calculated signal values are matched with pixel values in a plurality of MR images generated based on the collected MR signals in the plurality of collection timings. Specifically, the processing circuitry 131 calculates a signal value on a pixel to pixel basis by an execution of a T1 sequence by using the equation (10), the equation (13), and the signal change due to an inversion pulse, piecewise.
- the processing circuitry 131 sectionalizes timewise the process of signal change during the execution period of a T1 sequence, by the T1 map generation function 1317 , in accordance with (1) attenuation of the longitudinal magnetization depending on a T1 value, (2) attenuation of a signal due to a stabilization pulse, (3) a signal change due to an inversion pulse, and (4) a signal change due to read-out of an MR signal, based on imaging parameters relating to the execution of the T1 sequence and a collection pattern in the T1 sequence.
- the processing circuitry 131 calculates a change in the longitudinal magnetization in each of the sectionalized ranges, using the equation (10) and the equation (13), and the like.
- the processing circuitry 131 calculates a signal value varying timewise over the execution period of the T1 sequence.
- the processing circuitry 131 determines a T1 value in which a corresponding pixel value (or a sign-attached signal value, or a value obtained by normalizing a sign-attached signal by a thermal equilibrium signal value) in each of the plurality of inversion times is consistent with the calculated signal value in each of the plurality of inversion times by comparing the corresponding pixel value with the calculated signal value. That is, the processing circuitry 131 determines a T1 value such that a value of the objective function s′ (hereinafter, referred to as “function value”) becomes a minimum.
- function value a value of the objective function s′
- FIG. 9 is a view illustrating an example of a calculation result of a relative signal value in a certain pixel relating to a T1 sequence in the case of a collection pattern of “*-/*-*-*-/-*/*”.
- an inversion time of first imaging I 1 i.e., pre-inversion imaging, executed two heartbeats prior to a first inversion pulse IR 1 virtually corresponds to infinity.
- a pixel value of a first MR image generated by the first imaging I 1 corresponds to a component F 1 of a vector F in the right-hand side of the objective function s′ in the equation (9).
- a pixel value of a second MR image generated by the second imaging I 2 corresponds to a component F 2 of the vector F in the equation (9).
- An inversion time of third imaging I 3 after the second imaging I 2 is (482+2 ⁇ RR interval) ms.
- a pixel value of a third MR image generated by the third imaging I 3 corresponds to a component F 3 of the vector F in the equation (9).
- An inversion time of fourth imaging I 4 after the third imaging I 3 is (482+4 ⁇ RR interval) ms.
- a pixel value of a fourth. MR image generated by the fourth imaging I 4 corresponds to a component F 4 of the vector F in the equation (9).
- An inversion time of fifth imaging I 5 after a second inversion pulse IR 2 is (170+RR interval) ms.
- a pixel value of a fifth MR image generated by fifth imaging I 5 corresponds to a component.
- An inversion time of sixth imaging I 6 after a third inversion pulse IR 3 is 60 ms.
- a pixel value of a sixth MR image generated by the sixth imaging I 6 corresponds to a component F 6 of the vector F in the equation (9).
- a relative signal value is used at the point of starting imaging as illustrated in FIG. 9 .
- a plurality of glare not limited to relative signal values at the center collection time point, and a relative signal value at discretional time points during the imaging time in each of the plurality of collections may be used as g 1 .
- F 1 to F 6 and the g 1 to g 6 shown in FIG. 9 are used for calculating a function value which is a value of the objective function.
- the processing circuitry 131 determines a T1 value such that the function value becomes a minimum, in other words, the value of the objective function becomes a minimum.
- the determination of a T1 value is executed on a pixel to pixel basis.
- the processing circuitry 131 generates a T1 map by the T1 map generation function 1317 , using a T1 value determined on a pixel to pixel basis.
- the processing circuitry 131 displays the generated T1 map on the display 127 .
- Summarizing the processing of Step Say and Step Sa6, the processing circuitry 131 generates a T1 map representing a distribution of T1 values using MR signals collected in a plurality of collection timings and displays the generated T1 map on the display 127 .
- the MRI apparatus 1 of the embodiment it is possible to execute a pulse sequence for collecting MR signals in a plurality of collection timings along a relaxation curve of longitudinal magnetization in synchronization with heartbeats or blood beats, to generate a T1 map representing a distribution of T1 values using the MR signals collected in the plurality of collection timings, and to execute, in the pulse sequence, collecting none of magnetic resonance signals in at least one heartbeat or at least one blood beat among a plurality of heartbeats or a plurality of blood beats following the application of an inversion pulse which inverts the polarity of longitudinal magnetization.
- the MRI apparatus 1 it enables not collecting any magnetic resonance signal in at least one heartbeat or at least one blood beat among a plurality of heartbeats or a plurality of blood beats included between a first inversion pulse which inverts a polarity of the longitudinal magnetization and a second inversion pulse which is applied after application of the first inversion pulse, and collecting a magnetic resonance signal in a heartbeat subsequent to or a blood beat subsequent to the at least one heartbeat or the at least one blood beat in which no magnetic resonance signal is collected.
- the MRI apparatus 1 with respect to a pulse sequence, it is possible to accept a setting concerning a relation among heartbeats or blood beats, collecting timings, a first inversion pulse, and a second inversion pulse from an operator.
- the MRI apparatus 1 it is possible to calculate a T1 value in each pixel in a T1 map according to the relation among the heartbeats or blood beats, collecting timings, the first inversion pulse, and the second inversion pulse in the pulse sequence executed by the sequence control unit (sequence control circuitry).
- the second inversion pulse can be applied before the longitudinal magnetization completely recovers after the application of the first inversion pulsed.
- it is possible to collect an MR signal before application of the first inversion pulse as an initial collecting timing of a plurality of collection timings in a pulse sequence.
- the MRI apparatus 1 it is possible to set a plurality of collection timings in a pulse sequence such that a signal value of an MR signal provided with a sign is monotonously increased along the ascending order of the inversion time from the time point of application of the first inversion pulse to each of the collection timings.
- the MRI apparatus 1 when imaging is executed over three or more heartbeats or three or more blood beats following the application of a first inversion pulse in the execution of a pulse sequence, it is possible to collect none of magnetic resonance signals in at least one heartbeat or at least one blood beat of a plurality of heartbeats or a plurality of blood beats included between the point of application of the first inversion pulse and the point of application of the second inversion pulse.
- a first inversion pulse can be applied at intervals of five or less heartbeats or five or less blood beats in the execution of a pulse sequence.
- the MRI apparatus 1 it is possible to calculate signal values of MR signals in a plurality of collection timings, based on a model for calculating a change in longitudinal magnetization in a relaxation process of the longitudinal magnetization, a change in the longitudinal magnetization due to a first inversion pulse and a second inversion pulse, a change in the longitudinal magnetization due to an RF pulse used for collection of MR signals, and a change in the longitudinal magnetization due to a stabilization pulse applied to a subject for stabilization of MR signals immediately before application of the RF pulse and to calculate T1 values so as to match the calculated signal values for pixel values in a plurality of MR images generated based on the collected MR signals.
- the calculation is executed in a state where a temporal change of signal values by read-out of an image (collection of MR signals) and an effect brought about by performing application of an inversion pulse before the longitudinal magnetization completely recovers are incorporated into a simulation, and thus a T1 value can be calculated using a plurality of MR images based on an MR signal collected by the execution of a T1 sequence as illustrated in FIG. 4 .
- the MRI apparatus 1 can determine a T1 value with high accuracy in a short period of breath-hold without extending the period of breath-hold, i.e., in a short time.
- the MRI apparatus 1 can determine a T1 value relative to a wide range of heart rates as shown in FIG. 4 . Furthermore, according to the MRI apparatus 1 , it is possible to increase the number of signal values used in the calculation of a T1 value by pre-inversion imaging and to determine a T1 value with high accuracy.
- a server on the internet includes, for example, the storage apparatus 129 and the processing circuitry 131 in the configuration view of FIG. 1 .
- the T1 map generation function 1317 , etc. can be realized by installing a program for executing the function (medical processing program) in the processing circuitry 131 of the server and developing the program on the memory.
- the T1 map generation processing described in the embodiment may also be realized as a magnetic resonance imaging method.
- FIG. 12 is a view illustrating an example of the T1 map generation processing in the application of the embodiment.
- the processing circuitry 131 displays, for example, as a GUI (graphical user interface) on the display 127 by the T1 sequence determining function 1315 , an input screen for inputting information (hereinafter, referred to as “setting information”) used for specifying collection patterns recommended by the operator (hereinafter, referred to as “recommended patterns”) among a plurality of collection patterns stored in the storage apparatus 129 .
- the setting information includes at least one setting parameter relating to the setting of a pulse sequence (T1 sequence).
- the setting parameters are, for example, a flip angle of an RF pulse in a pulse sequence, a T1 value relating to an imaging target (hereinafter, referred to as “target T1 value), and the like.
- the GUI is provided with input items for the setting parameters.
- the input screen may include a GUI capable of discretionally adjusting an inversion pulse, collection timings, non-read-out periods, and the like. In this case, the collection patterns can be discretionally adjusted as desired by the operator.
- the setting information may further include, as an input item, a heart rate or a pulse rate.
- the heart rate or pulse rate as an input item is not limited to a single value, and the input item may be a heart rate range or a pulse rate range defined by an upper limit value and a lower limit value.
- the setting information includes, as a plurality of input items, a heart rate (bpm), a target T1 value (ms), and a flip angle (degree).
- the interface 125 acquires a heart rate of a subject P from an electrocardiogram. It should be noted that the interface 125 may acquire a pulse rate of a subject P from a pulse counter.
- the display 127 displays the input screen. Specifically, the display 127 displays an input screen in a state where various numerical values can be entered in each of the plurality of input items on the input screen by the operator. It should be noted that the display 127 may display a plurality of input candidates relating to the input items in accordance with an input item at which a cursor is positioned, for example, in a pull-down menu form.
- the display 127 may display, in the input item of the heart rate on the input screen, an average value of heart rates acquired. It should be noted that the display 127 may display, in the input item of the heart rate on the input screen, a heart rate range based on the acquired heart rates. At this time, the heart rate range corresponds to, for example, a 95% confidence interval based on the plurality of heart rates acquired over a predetermined period. Also, the display 127 may display, in the input item of a pulse rate on the input screen, an average value of pulse rates acquired. It should be noted that the display 127 may display, in the input item of the pulse rate on the input screen, a pulse rate range based on the acquired pulse rates.
- the pulse rate range corresponds to, for example, a 95% confidence interval based on the plurality of pulse rates acquired over a predetermined period. It should be noted that the heart rate range and the pulse rate range are not limited to 95% confidence intervals, and these ranges may be set discretionally. If a flip angle is entered as an imaging condition, the display 127 may display, in the input item of a flip angle on the input screen, a flip angle in the imaging condition.
- the processing circuitry 131 may determine a T1 value by the T1 sequence determining function 1315 , based on a correspondence list for an imaging target (hereinafter, referred to as “target T1 value correspondence list”) and an imaging target entered. At that time, the processing circuitry 131 may display the determined T1 value in the input item of a target T1 value on the input screen of the display 127 .
- the target T1 value correspondence list is preliminarily stored in the storage apparatus 129 .
- the interface 125 inputs a numerical value for each of a plurality of input items on the input screen by an instruction of the operator.
- the interface 125 outputs a plurality of numerical values in the plurality of input items to the processing circuitry 131 .
- the processing circuitry 131 determines, by the T1 sequence determining function 1315 , at least one recommended sequence which is recommended as a pulse sequence (T1 sequence) based on setting information including at least one setting parameter relating to the setting of the pulse sequence. Specifically, the processing circuitry 131 determines a plurality of recommended patterns respectively corresponding to a plurality of recommended sequences, based on a plurality of numerical values respectively corresponding to the plurality of input items. For example, if 60 is entered in the input item of heart rate, the processing circuitry 131 identifies 10 collection patterns included in “Wide range (50 to 100 bpm)” and “Low heart rate (50 to 75 bpm)” among the plurality of collection patterns illustrated in FIG. 4 .
- the processing circuitry 131 executes a simulation using the flip angle in the input item for each of the identified 10 collection patterns.
- the processing circuitry 131 calculates a T1 value by execution of the simulation.
- the processing circuitry 131 determines, as recommended patterns, a plurality of collection patterns, which are close to the target T1 value, from among the T1 values (hereinafter, referred to as “estimated T1 value”) calculated for each of the identified 10 collection patterns.
- the processing circuitry 131 may calculate T1 recovery curves respectively corresponding to the plurality of recommended patterns by using each of a plurality of estimated T1 values.
- the processing circuitry 131 may generate a graph (hereinafter, referred to as “T1 recovery graph”) representing T1 recovery curves respectively corresponding to the plurality of recommended patterns.
- the processing circuitry 131 calculates the accuracy of T1 values by the T1 sequence determining function 1315 by changing the setting parameters, based on a recommended sequence and the setting parameters. Specifically, the processing circuitry 131 executes a simulation using a flip angle in the input item for each of the plurality of recommended patterns by changing the heart rate. The processing circuitry 131 calculates relative errors of T1 values relative to the plurality of heart rates as the accuracy of T1 values, by executing the simulation. In each of the recommended patterns, the relative error of T1 value relative to the plurality of heart rates represents a degree of robustness (hereinafter, referred to as “heartbeat robustness”) of the T1 value relative to the heartrate.
- heartbeat robustness a degree of robustness of the T1 value relative to the heartrate.
- the processing circuitry 131 may generate a graph (hereinafter, referred to as “accuracy heartbeat graph”) representing the heartbeat robustness relative to each of the plurality of recommended patterns.
- the processing circuitry 131 may generate a list (hereinafter, referred to as “heartbeat robustness list”) representing the heartbeat robustness relative to each of the plurality of recommended patterns, instead of the accuracy heartbeat graph.
- the processing circuitry 131 may execute a simulation using a flip angle in the input item by the T1 sequence determining function 315 by changing the T1 value relative to each of the recommended patterns.
- the processing circuitry 131 calculates a relative error of a T1 value relative to a plurality of T1 values as the accuracy of the plurality of T1 values by executing the simulation.
- the relative error of a T1 value relative to the plurality of T1 values indicates a degree of T1 value robustness (hereinafter, referred to as “T1 robustness”) relative to the T1 value.
- the processing circuitry 131 may generate a graph (hereinafter, referred to as “accuracy T1 graph”) indicating the T1 robustness relative to each of the plurality of recommended patterns.
- the processing circuitry 131 may generate a list (hereinafter, referred to as “T1 robustness list”) indicating the T1 robustness relative to each of the plurality of recommended patterns.
- the processing circuitry 131 may execute a simulation by the T1 sequence determining function 1315 , by changing a flip angle in the input item relative to each of the plurality of recommended patterns.
- the processing circuitry 131 calculates a relative error of a T1 value relative to a plurality of flip angles as the accuracy of the T1 value.
- the relative error of a T1 value relative to a plurality of flip angles indicates a degree of the robustness (hereinafter, referred to as “flip robustness”) of T1 value relative to flip angles.
- the processing circuitry 131 may generate a graph (hereinafter, referred to as “accuracy flip graph”) indicating the flip robustness relative to each of the plurality of recommended patterns.
- the processing circuitry 131 may generate a list (hereinafter, referred to as “flip robustness list”) indicating the flip robustness relative to each of the plurality of recommended patterns, instead of the accuracy flip graph.
- the processing circuitry 131 determines, by the T1 sequence determining function 1315 , a period of breath-hold, an imaging time, and the like in each of the recommended patterns, based on the number of inversion times, a collection heart rate, a plurality of TIs in each of the recommended patterns.
- the processing circuitry 131 generates a list (hereinafter, referred to as “selection guideline list”) representing a period of breath-hold, an imaging time, heartbeat robustness, an estimated T1 value, and the like.
- the processing circuitry 131 displays, on the display 127 , a selection guideline list along with a GUI indicating a numerical value entered for each of the plurality of input items (hereinafter, referred to as “entered GUI”).
- FIG. 13 is a view illustrating an example of an entered GUI 1271 and a selection guideline list 1273 displayed on a display screen 1270 of the display 127 .
- the selection guideline list 1273 is displayed along with the entered GUI 1271 on the display 127 as illustrated on the display screen 1270 in FIG. 13 .
- Collection patters 1 to 4 in the selection guideline list in FIG. 13 may be displayed, for example, in the form of using symbols as shown in FIG. 4 .
- the display 127 displays a recommended sequence, setting parameters, and the accuracy of the T1 value.
- the display 127 displays the selection guideline list 1273 and the entered GUI 1271 .
- the display 127 may display at least one of a T1 recovery graph, an accuracy heartbeat graph, an accuracy T1 graph, and an accuracy flip graph in addition to the selection guideline list 1273 and the entered GUI 1271 .
- the display 127 may display, in addition to the selection guideline list 1273 and the entered GUI 1271 , a heartbeat robust list instead of the accuracy heartbeat graph, may display a T1 robust list instead of the accuracy T1 graph, and may display a flip robustness list instead of the accuracy flip graph.
- FIG. 14 is a view illustrating an example of a T1 recovery graph. As illustrated in FIG. 14 , a plurality of T1 recovery curves respectively corresponding to the plurality of recommended patterns are shown in the T1 recovery graph.
- OT 1 shown in FIG. 14 indicates a T1 recovery curve generated based on a target T1 value.
- RP 1 shown in FIG. 14 indicates a T1 recovery curve generated based on the estimated T1 value concerning the collection pattern 1 among the plurality of collection patterns in the selection guideline list 1273 .
- RP 2 shown in FIG. 14 indicates a T1 recovery curve generated based on an estimated T1 value concerning the collection pattern 2 among the plurality of collection patterns in the selection guideline list 1273 .
- T1 recovery curve 14 respectively indicate a T1 recovery curve generated based on the estimated T1 value concerning the collection pattern 3 among the plurality of collection patterns in the section guideline list 1273 and a T1 recovery curve generated based on the estimated T1 value concerning the collection pattern 4 among the plurality of collection patterns in the section guideline list 1273 .
- FIG. 15 is a view illustrating an example of an accuracy heartbeat graph.
- AP 1 and AP 2 shown in FIG. 15 respectively indicate the heartbeat robustness concerning the collection pattern 1 among the plurality of recommended patterns in the selection guideline list 1273 and the heartbeat robustness concerning the collection pattern 2 among the plurality of recommended patterns in the selection guideline list 1273 .
- AP 3 shown in FIG. 15 indicates the heartbeat robustness concerning the collection pattern 3 among the plurality of recommended patterns in the selection guideline list 1273 .
- AP 4 shown in FIG. 15 indicates the heartbeat robustness concerning the collection pattern 4 among the plurality of recommended patterns in the selection guideline list 1273 .
- An interval CI shown in FIG. 15 indicates a 95% confidence interval.
- an upper limit heart rate (not shown) and a lower limit heart rate (not shown) may be displayed which are not shown in FIG. 15 .
- the display of the confidence interval in the accuracy heartbeat graph is not limited to 95% and may be set discretionally.
- the heartbeat robustness AP 4 concerning the collection pattern 4 has high robustness relative to the heart rate as compared with those of the other recommended patterns.
- FIG. 16 is a view illustrating an example of an accuracy T1 graph.
- the accuracy T1 graph indicates the T1 robustness concerning a particular collection pattern among the plurality of recommended patterns in the selection guideline list 1273 .
- the accuracy T1 graph indicates that T1 values can be measured using a particular collection pattern to a T1 value of 1700 ms within a 10% error.
- the accuracy T1 graph indicates that if the T1 value exceeds 1700 ms, the accuracy of T1 values measured using the particular collection pattern degrades.
- FIG. 17 is a view illustrating an example of an accuracy flip graph according to a heart rate.
- the accuracy flip graph illustrated in FIG. 17 indicates the flip robustness concerning a particular collection pattern of the plurality of recommended patterns in the selection guideline list 1273 , for example, the third collection pattern from the top (Range of heart rate: 50 to 100 bpm) of the collection patterns described in FIG. 4 for each of the heart rates.
- the accuracy flip graph indicates that even if the collection pattern is included in the wide range of heart rates of 50 to 100 bpm, the accuracy of a T1 value to be measured may degrade depending on a flip angle adopted.
- Step Sb3 Yes
- the processing circuitry 131 determines a T1 sequence corresponding to the selected collection pattern (Step Sb3: No).
- Step Sb4 the sequence control circuitry 121 collects MR signals in accordance with the determined T1 sequence.
- the MRI apparatus 1 it is possible to determine at least one recommended sequence which is recommended as a pulse sequence, based on setting information including at least one setting parameter relating to setting of a pulse sequence, to calculate the accuracy of the T1 value by changing the setting parameter, based on the recommended sequence and the setting parameter, and to display the recommended sequence, the setting parameter, and the accuracy. Furthermore, according to the MRI apparatus 1 , it is possible to use, as the accuracy of T1 value, a graph or a list showing a relative error of the T1 value relative to the setting parameter, using, as a setting parameter, at least one of heartbeats or blood beats, a T1 value, and a flip angle of an RF pulse in the pulse sequence.
- the operator can select a collection pattern and generate a T1 map with high accuracy T1 values by using a selected collection pattern in consideration of setting parameters, heartbeat robustness, T1 robustness, flip robustness, etc. which serve as guidelines for selecting a collection pattern.
- a magnetic resonance imaging apparatus 1 such as the embodiment described above, it is possible to generate a T1 map having highly accurate T1 values.
Landscapes
- Physics & Mathematics (AREA)
- Health & Medical Sciences (AREA)
- Life Sciences & Earth Sciences (AREA)
- High Energy & Nuclear Physics (AREA)
- Engineering & Computer Science (AREA)
- General Physics & Mathematics (AREA)
- Condensed Matter Physics & Semiconductors (AREA)
- Nuclear Medicine, Radiotherapy & Molecular Imaging (AREA)
- Signal Processing (AREA)
- General Health & Medical Sciences (AREA)
- Radiology & Medical Imaging (AREA)
- Biophysics (AREA)
- Animal Behavior & Ethology (AREA)
- Physiology (AREA)
- Molecular Biology (AREA)
- Medical Informatics (AREA)
- Public Health (AREA)
- Veterinary Medicine (AREA)
- Heart & Thoracic Surgery (AREA)
- Biomedical Technology (AREA)
- Pathology (AREA)
- Surgery (AREA)
- Artificial Intelligence (AREA)
- Computer Vision & Pattern Recognition (AREA)
- Psychiatry (AREA)
- Cardiology (AREA)
- Power Engineering (AREA)
- Pulmonology (AREA)
- Magnetic Resonance Imaging Apparatus (AREA)
Abstract
Description
F i =−F Ni (i<Np)
F i =F Ni (t≥Np)
-
- TI in the first imaging before the first inversion pulse: 482 ms (corresponding to TI=∞)
- TI in the second imaging after the first inversion pulse: 482 ms
- TI in the third imaging after the second imaging: (482+2×RR interval) ms
- TI in the fourth imaging after the third imaging: (482+4×RR interval) ms
- TI in the fifth imaging after the second inversion pulse: (170+RR interval) ms
- TI in the sixth imaging after the third inversion pulse: 60 ms
f i(T 1)=Ag i(T 1 ,t 1 , . . . ,t i , . . . ,t N ,T IR1 , . . . ,T IRi , . . . T IRN ,B) (1)
f(T 1)=Ag(T 1 ,t 1 , . . . ,t i , . . . ,t N ,T IR1 , . . . ,T IRi , . . . T IRN ,B) (2)
p i=(g i)(T 1 ,t 1 , . . . ,t i , . . . ,t N ,T IR1 , . . . ,T IRi , . . . T IRN,0.9)
q i =g i(T 1 ,t 1 , . . . ,t i , . . . ,t N ,T IR1 , . . . ,T IRi , . . . T IRN,1.0)
and summarizing pi and qi as a column vector across (i=1, N), the equation (2) is represented by the following equation (3).
f(T 1)=cp+dp=(10A−10AB)p+(−9A+10AB)q (3)
B fix(10q−10p)
the following result is obtained.
H=(F10(p−q)).
{tilde over (T)} 1
by calculating such a T1 value that minimizes the right-hand side of the equation (8) by the T1
Ã,{tilde over (B)}
of the thermal equilibrium signal value A and the inversion efficiency B from the following calculations
Ã=v 1({tilde over (T)} 1)
{tilde over (B)} 2 =v 2({tilde over (T)} 1)−B fix
by the T1
f({tilde over (T)}1)
is represented as follows.
f({tilde over (T)} 1)=cp+dp=Ãg(T 1 ,t 1 , . . . ,t i , . . . ,t N ,T IR1 , . . . ,T IRi , . . . T IRN ,{tilde over (B)})
By using a difference between a measured vector and a signal value as a simulation result, and a penalty term,
F−f({tilde over (T)} 1)
an objective function s′ is defined by the following equation (9).
s′≡|F−Ãg(T 1 ,t 1 , . . . ,t i , . . . ,t N ,T IR1 , . . . ,T IRi , . . . T IRN ,{tilde over (B)})|2λB 2 Ã 2(B fix −{tilde over (B)})2 (9)
-
- T1 sequence (Collection pattern and collection timing (a value of the inversion time during imaging relating to each of a plurality of inversion pulses))
- Time interval of the adjacent inversion pulse in a plurality of inversion pulses
- Trigger interval of heartbeats
-
- Echo time (TE)
- Repetition time (TR)
- Flip angle: (FA)
- The number of phase encoding steps
- Inversion efficiency B
- T1 value (which is a parameter intended for imaging and an initial value at the time of a simulation)
s(t)=1−(1−s(0))exp(−t/T 1) (10)
s(T R)=1−(1−s(0))exp(−T R /T 1) (11)
Therefore, the signal change from a time point immediately following the application of the stabilization pulse to the repetitive time TR is represented as follows.
s j+1=1−(1−s j cos(α))exp(−T R /T 1) (12)
The signal change represented by equation (12) is repeated over the number of application times “Nd” of the stabilization pulse in one imaging. Therefore, if a signal value is measured tentatively at an infinite distance time clock, a signal value SNd after the application of the stabilization pulse over the Nd times can be obtained by repetitively calculating the equation (12) with a setting of si=S0=1 over the Nd times. It should be noted that the signal value after the application of the stabilization pulse over the Nd times may be calculated according to the number of application times of the stabilization pulse, the repetitive time, and the flip angle by the
An f(x) in the equation (13) is a signal value after a time x when a signal value so before the read-out is represented by f(0) and a flip angle is represented by α. It should be noted that the equation (13) may be used for the calculation of attenuation of a signal due to the stabilization pulse. If SSFP is used as imaging in a T1 sequence, a relative signal value g1 is calculated by changing the model in accordance with the change in the longitudinal magnetization in the SSFP.
Claims (20)
Applications Claiming Priority (6)
| Application Number | Priority Date | Filing Date | Title |
|---|---|---|---|
| JP2018106849 | 2018-06-04 | ||
| JPJP2018-106849 | 2018-06-04 | ||
| JP2018-106849 | 2018-06-04 | ||
| JP2019090734A JP7237719B2 (en) | 2018-06-04 | 2019-05-13 | Magnetic resonance imaging system |
| JPJP2019-090734 | 2019-05-13 | ||
| JP2019-090734 | 2019-05-13 |
Publications (2)
| Publication Number | Publication Date |
|---|---|
| US20190369188A1 US20190369188A1 (en) | 2019-12-05 |
| US11085981B2 true US11085981B2 (en) | 2021-08-10 |
Family
ID=68694630
Family Applications (1)
| Application Number | Title | Priority Date | Filing Date |
|---|---|---|---|
| US16/419,155 Active 2039-10-31 US11085981B2 (en) | 2018-06-04 | 2019-05-22 | Magnetic resonance imaging apparatus for generating T1 map having highly accurate T1 values |
Country Status (1)
| Country | Link |
|---|---|
| US (1) | US11085981B2 (en) |
Citations (5)
| Publication number | Priority date | Publication date | Assignee | Title |
|---|---|---|---|---|
| US20060161060A1 (en) * | 2005-01-14 | 2006-07-20 | New York University | Multi-echo magnetic resonance imaging method and system |
| US20140350385A1 (en) | 2011-12-13 | 2014-11-27 | Isis Innovation Limited | Systems and methods for gated mapping of t1 values in abdominal visceral organs |
| US9129424B2 (en) | 2012-04-17 | 2015-09-08 | Siemens Aktiengesellschaft | Phase sensitive T1 mapping in magnetic resonance imaging |
| US9285446B2 (en) | 2010-09-29 | 2016-03-15 | Isis Innovation Limited | Systems and methods for shortened look locker inversion recovery (Sh-MOLLI) cardiac gated mapping of T1 |
| US20180217217A1 (en) * | 2017-01-31 | 2018-08-02 | Regents Of The University Of Minnesota | System and method for dynamic, cardiac phase-resolved quantitative longitudinal relaxation parameter mapping |
-
2019
- 2019-05-22 US US16/419,155 patent/US11085981B2/en active Active
Patent Citations (5)
| Publication number | Priority date | Publication date | Assignee | Title |
|---|---|---|---|---|
| US20060161060A1 (en) * | 2005-01-14 | 2006-07-20 | New York University | Multi-echo magnetic resonance imaging method and system |
| US9285446B2 (en) | 2010-09-29 | 2016-03-15 | Isis Innovation Limited | Systems and methods for shortened look locker inversion recovery (Sh-MOLLI) cardiac gated mapping of T1 |
| US20140350385A1 (en) | 2011-12-13 | 2014-11-27 | Isis Innovation Limited | Systems and methods for gated mapping of t1 values in abdominal visceral organs |
| US9129424B2 (en) | 2012-04-17 | 2015-09-08 | Siemens Aktiengesellschaft | Phase sensitive T1 mapping in magnetic resonance imaging |
| US20180217217A1 (en) * | 2017-01-31 | 2018-08-02 | Regents Of The University Of Minnesota | System and method for dynamic, cardiac phase-resolved quantitative longitudinal relaxation parameter mapping |
Non-Patent Citations (2)
| Title |
|---|
| Kellman, P., et al., "T1-mapping in the heart: accuracy and precision", Journal of Cardiovascular Magnetic Resonance, vol. 16. No. 2, 2014, pp. 1-20. |
| Messroghli, D. et al. "Modified Look-Locker Inversion Recovery (MOLLI) for High-Resolution T1 Mapping of the Heart", Magnetic Resonance in Medicine vol. 52., 2004, pp. 141-146. |
Also Published As
| Publication number | Publication date |
|---|---|
| US20190369188A1 (en) | 2019-12-05 |
Similar Documents
| Publication | Publication Date | Title |
|---|---|---|
| US9687172B2 (en) | System for motion corrected MR diffusion imaging | |
| US9709653B2 (en) | Mapping eddy current fields in MRI system | |
| CN101884534B (en) | Method for contrast-agent-free angiographic imaging in magnetic resonance tomography | |
| US10302729B2 (en) | Method and magnetic resonance apparatus for speed-compensated diffusion-based diffusion imaging | |
| WO2001017428A1 (en) | Magnetic resonance imaging device and method therefor | |
| KR20140058378A (en) | Fat and iron quantification using a multi-step adaptive fitting approach with multi-echo magnetic resonance imaging | |
| JP6708525B2 (en) | Magnetic resonance measuring apparatus and image processing method | |
| US8890527B1 (en) | Methods of radio frequency magnetic field mapping | |
| EP3193185B1 (en) | Magnetic resonance imaging apparatus and method of controlling the same | |
| US10429468B2 (en) | Simultaneous dynamic contrast enhanced and dynamic susceptibility magnetic resonance imaging using magnetic resonance fingerprinting | |
| US6198960B1 (en) | Flip angle modulated magnetic resonance angiography | |
| US10551462B2 (en) | Accuracy and off-resonance performance in quantitative magnetization prepared magnetic resonance imaging | |
| JP2001095773A (en) | Magnetic resonance image diagnostic apparatus | |
| US20100019766A1 (en) | System for Dynamically Compensating for Inhomogeneity in an MR Imaging Device Magnetic Field | |
| US8217649B2 (en) | System for use in MR imaging using tissue mechanical resonance | |
| US11519987B2 (en) | Magnetic resonance fingerprinting thermometry | |
| US10429479B2 (en) | Rapid measurement of perfusion using optimized magnetic resonance fingerprinting | |
| US6759848B2 (en) | Magnetic resonance method and apparatus for spatially resolved presentation of change in the functional activities of a brain | |
| JP2021520951A (en) | Arterial spin labeling method with evaluation of inversion of magnetization | |
| WO2016009844A1 (en) | Magnetic resonance imaging device and blood flow drawing method | |
| US11085981B2 (en) | Magnetic resonance imaging apparatus for generating T1 map having highly accurate T1 values | |
| JP4564015B2 (en) | Magnetic resonance imaging apparatus and magnetic resonance imaging method | |
| US11187760B2 (en) | Magnetic resonance imaging apparatus and quantitative-value computing program | |
| JP7237719B2 (en) | Magnetic resonance imaging system | |
| JP3189982B2 (en) | Magnetic resonance imaging equipment |
Legal Events
| Date | Code | Title | Description |
|---|---|---|---|
| AS | Assignment |
Owner name: CANON MEDICAL SYSTEMS CORPORATION, JAPAN Free format text: ASSIGNMENT OF ASSIGNORS INTEREST;ASSIGNORS:BANNAE, SHUHEI;OHYU, SHIGEHARU;REEL/FRAME:049251/0641 Effective date: 20190509 |
|
| FEPP | Fee payment procedure |
Free format text: ENTITY STATUS SET TO UNDISCOUNTED (ORIGINAL EVENT CODE: BIG.); ENTITY STATUS OF PATENT OWNER: LARGE ENTITY |
|
| STPP | Information on status: patent application and granting procedure in general |
Free format text: DOCKETED NEW CASE - READY FOR EXAMINATION |
|
| STPP | Information on status: patent application and granting procedure in general |
Free format text: NON FINAL ACTION MAILED |
|
| STPP | Information on status: patent application and granting procedure in general |
Free format text: RESPONSE TO NON-FINAL OFFICE ACTION ENTERED AND FORWARDED TO EXAMINER |
|
| STPP | Information on status: patent application and granting procedure in general |
Free format text: NOTICE OF ALLOWANCE MAILED -- APPLICATION RECEIVED IN OFFICE OF PUBLICATIONS |
|
| STPP | Information on status: patent application and granting procedure in general |
Free format text: PUBLICATIONS -- ISSUE FEE PAYMENT VERIFIED |
|
| STCF | Information on status: patent grant |
Free format text: PATENTED CASE |
|
| MAFP | Maintenance fee payment |
Free format text: PAYMENT OF MAINTENANCE FEE, 4TH YEAR, LARGE ENTITY (ORIGINAL EVENT CODE: M1551); ENTITY STATUS OF PATENT OWNER: LARGE ENTITY Year of fee payment: 4 |