US10969382B2 - Systems and methods for assessing data collected from an electrically active cell culture - Google Patents
Systems and methods for assessing data collected from an electrically active cell culture Download PDFInfo
- Publication number
- US10969382B2 US10969382B2 US15/964,139 US201815964139A US10969382B2 US 10969382 B2 US10969382 B2 US 10969382B2 US 201815964139 A US201815964139 A US 201815964139A US 10969382 B2 US10969382 B2 US 10969382B2
- Authority
- US
- United States
- Prior art keywords
- cell culture
- electrically active
- beats
- active cell
- beat
- Prior art date
- Legal status (The legal status is an assumption and is not a legal conclusion. Google has not performed a legal analysis and makes no representation as to the accuracy of the status listed.)
- Active, expires
Links
Images


Classifications
-
- G—PHYSICS
- G01—MEASURING; TESTING
- G01N—INVESTIGATING OR ANALYSING MATERIALS BY DETERMINING THEIR CHEMICAL OR PHYSICAL PROPERTIES
- G01N33/00—Investigating or analysing materials by specific methods not covered by groups G01N1/00 - G01N31/00
- G01N33/48—Biological material, e.g. blood, urine; Haemocytometers
- G01N33/50—Chemical analysis of biological material, e.g. blood, urine; Testing involving biospecific ligand binding methods; Immunological testing
- G01N33/5005—Chemical analysis of biological material, e.g. blood, urine; Testing involving biospecific ligand binding methods; Immunological testing involving human or animal cells
- G01N33/5008—Chemical analysis of biological material, e.g. blood, urine; Testing involving biospecific ligand binding methods; Immunological testing involving human or animal cells for testing or evaluating the effect of chemical or biological compounds, e.g. drugs, cosmetics
- G01N33/5044—Chemical analysis of biological material, e.g. blood, urine; Testing involving biospecific ligand binding methods; Immunological testing involving human or animal cells for testing or evaluating the effect of chemical or biological compounds, e.g. drugs, cosmetics involving specific cell types
-
- A—HUMAN NECESSITIES
- A61—MEDICAL OR VETERINARY SCIENCE; HYGIENE
- A61B—DIAGNOSIS; SURGERY; IDENTIFICATION
- A61B5/00—Measuring for diagnostic purposes; Identification of persons
- A61B5/24—Detecting, measuring or recording bioelectric or biomagnetic signals of the body or parts thereof
-
- G—PHYSICS
- G01—MEASURING; TESTING
- G01N—INVESTIGATING OR ANALYSING MATERIALS BY DETERMINING THEIR CHEMICAL OR PHYSICAL PROPERTIES
- G01N33/00—Investigating or analysing materials by specific methods not covered by groups G01N1/00 - G01N31/00
- G01N33/48—Biological material, e.g. blood, urine; Haemocytometers
- G01N33/50—Chemical analysis of biological material, e.g. blood, urine; Testing involving biospecific ligand binding methods; Immunological testing
- G01N33/5005—Chemical analysis of biological material, e.g. blood, urine; Testing involving biospecific ligand binding methods; Immunological testing involving human or animal cells
- G01N33/5091—Chemical analysis of biological material, e.g. blood, urine; Testing involving biospecific ligand binding methods; Immunological testing involving human or animal cells for testing the pathological state of an organism
-
- H—ELECTRICITY
- H04—ELECTRIC COMMUNICATION TECHNIQUE
- H04L—TRANSMISSION OF DIGITAL INFORMATION, e.g. TELEGRAPHIC COMMUNICATION
- H04L67/00—Network arrangements or protocols for supporting network services or applications
- H04L67/01—Protocols
- H04L67/12—Protocols specially adapted for proprietary or special-purpose networking environments, e.g. medical networks, sensor networks, networks in vehicles or remote metering networks
-
- A61B5/04—
-
- A61B5/0464—
-
- A—HUMAN NECESSITIES
- A61—MEDICAL OR VETERINARY SCIENCE; HYGIENE
- A61B—DIAGNOSIS; SURGERY; IDENTIFICATION
- A61B5/00—Measuring for diagnostic purposes; Identification of persons
- A61B5/24—Detecting, measuring or recording bioelectric or biomagnetic signals of the body or parts thereof
- A61B5/316—Modalities, i.e. specific diagnostic methods
- A61B5/318—Heart-related electrical modalities, e.g. electrocardiography [ECG]
- A61B5/346—Analysis of electrocardiograms
- A61B5/349—Detecting specific parameters of the electrocardiograph cycle
- A61B5/363—Detecting tachycardia or bradycardia
-
- G—PHYSICS
- G01—MEASURING; TESTING
- G01N—INVESTIGATING OR ANALYSING MATERIALS BY DETERMINING THEIR CHEMICAL OR PHYSICAL PROPERTIES
- G01N2800/00—Detection or diagnosis of diseases
- G01N2800/32—Cardiovascular disorders
- G01N2800/326—Arrhythmias, e.g. ventricular fibrillation, tachycardia, atrioventricular block, torsade de pointes
-
- G—PHYSICS
- G01—MEASURING; TESTING
- G01N—INVESTIGATING OR ANALYSING MATERIALS BY DETERMINING THEIR CHEMICAL OR PHYSICAL PROPERTIES
- G01N33/00—Investigating or analysing materials by specific methods not covered by groups G01N1/00 - G01N31/00
- G01N33/48—Biological material, e.g. blood, urine; Haemocytometers
- G01N33/50—Chemical analysis of biological material, e.g. blood, urine; Testing involving biospecific ligand binding methods; Immunological testing
- G01N33/5005—Chemical analysis of biological material, e.g. blood, urine; Testing involving biospecific ligand binding methods; Immunological testing involving human or animal cells
- G01N33/5008—Chemical analysis of biological material, e.g. blood, urine; Testing involving biospecific ligand binding methods; Immunological testing involving human or animal cells for testing or evaluating the effect of chemical or biological compounds, e.g. drugs, cosmetics
- G01N33/5044—Chemical analysis of biological material, e.g. blood, urine; Testing involving biospecific ligand binding methods; Immunological testing involving human or animal cells for testing or evaluating the effect of chemical or biological compounds, e.g. drugs, cosmetics involving specific cell types
- G01N33/5058—Neurological cells
-
- G—PHYSICS
- G01—MEASURING; TESTING
- G01N—INVESTIGATING OR ANALYSING MATERIALS BY DETERMINING THEIR CHEMICAL OR PHYSICAL PROPERTIES
- G01N33/00—Investigating or analysing materials by specific methods not covered by groups G01N1/00 - G01N31/00
- G01N33/48—Biological material, e.g. blood, urine; Haemocytometers
- G01N33/50—Chemical analysis of biological material, e.g. blood, urine; Testing involving biospecific ligand binding methods; Immunological testing
- G01N33/5005—Chemical analysis of biological material, e.g. blood, urine; Testing involving biospecific ligand binding methods; Immunological testing involving human or animal cells
- G01N33/5008—Chemical analysis of biological material, e.g. blood, urine; Testing involving biospecific ligand binding methods; Immunological testing involving human or animal cells for testing or evaluating the effect of chemical or biological compounds, e.g. drugs, cosmetics
- G01N33/5044—Chemical analysis of biological material, e.g. blood, urine; Testing involving biospecific ligand binding methods; Immunological testing involving human or animal cells for testing or evaluating the effect of chemical or biological compounds, e.g. drugs, cosmetics involving specific cell types
- G01N33/5061—Muscle cells
-
- H05K999/99—
Definitions
- interconnected cellular networks of cardiomyocytes may be formed on a substrate for the testing of potential new heart therapies.
- Primary cardiomyocytes harvested from an animal, or animal or human stem cell-derived cardiomyocytes form interconnected cellular networks when cultured on a cell culture substrate.
- the individual cardiomyocytes within a network are connected through gap junctions that allow ions to flow from one cell to another. This electrical connection allows an electrical action potential, which is first generated by a pacemaker cell, to propagate from one cell to the next.
- Formation of an electrical action potential starts with a buildup of charge across a cell membrane. This buildup occurs spontaneously in cardiac cells, and more frequently in pacemaker cardiomyocytes than non-pacemaking cardiomyocytes. When the transmembrane charge reaches a threshold value, ions rush into the first cell (the depolarization phase). This triggers an action potential, which is a sharp influx of additional ions into the cytoplasm.
- the gap junctions distributed across the cell membrane allow ions to flow into neighboring cells, enabling the spread of the action potential.
- a cardiomyocyte culture may be assessed by the gap junction distribution, or degree of electrical connectivity between cells. This property may relate to the ability of a beat to be transmitted homogenously throughout a culture.
- electrical measurements taken from a cardiomyocyte give researchers an indication of the cell health, quality, and level of maturity.
- patch-clamp techniques provide measures of the action potential of an individual cell.
- a patch-clamp uses an electrode inserted into the cell membrane to measure transmembrane voltage.
- the cardiac action potential is initiated with a depolarization phase, where sodium rushes into the cell.
- the depolarization phase is followed by a plateau phase, dominated by the influx of calcium, where the cells remains depolarized, and ultimately a repolarization phase characterized by an outflux of potassium and a return to the starting transmembrane potential.
- Patch-clamp technologies can be used to detect abnormalities in the action potential within a single cell, which may point to functional problems.
- performing testing on individual cells is difficult and time-consuming.
- cardiomyocytes may behave differently when separated from their network, thus calling experimental results into question.
- Microelectrode arrays having a plurality of microelectrodes situated within each well enable researchers to measure signals from electrically active cells cultured on their surfaces.
- “microelectrode” and “electrode” will be used interchangeably.
- Cells are cultured across the array of electrodes within a well such that signals are detected from multiple electrically active cells, such as cardiomyocytes, simultaneously.
- These signals called field potential signals, may change shape in response to the addition of a candidate compound to the cardiomyocyte culture. The changes may be used to evaluate the cardiac safety risk of a compound. Additionally, these measures may be used to develop and characterize new stem cell lines, to compare the electrophysiology of the cells to in vivo signals from native cardiomyocytes, and/or to evaluate in vitro models of disease.
- a beat in a culture with below average cell density may be slower than normal. This could be incorrectly interpreted as an immature developmental state in a stem cell differentiation process.
- Electrically active cell cultures may have spatial variability across the culture. One region of the culture may beat more frequently, or a beat may be transmitted faster in certain regions.
- a culture may also have temporal instability. For example, the beat period (time between beats) may increase or decrease sporadically due to environmental conditions such as, for example, changing temperature. This could lead to unreliable data if, for example, the researcher were testing a compound meant to increase heart rate.
- Arrhythmia analysis for an in vitro assay consists of identifying, in a binary sense, whether an arrhythmic event has or has not occurred during a defined analysis time window. In other words, the presence or absence of drug-induced arrhythmic events is assessed (without quantification) according to conventional techniques.
- Recent studies have aimed to provide an analog, or graded, quantification of the arrhythmia burden induced by a test compound. For example, in a recent study, the effects of a test drug on an in vitro culture of stem cell-derived cardiomyocytes was evaluated at multiple concentrations and the number of irregular beats was counted during a fixed time window. The concentration at which 20% of the beats were irregular was compared to the clinical Cmax drug concentration to quantify arrhythmic risk.
- the data can be collected using a microelectrode array (MEA).
- electrically active cells such as cardiomyocytes
- the electrically active cells are cultured such that they are in electrical communication with at least a portion of the electrodes of a well of the MEA.
- the electrically active cells are cardiomyocytes and/or cardiomyocyte-like cells.
- the electrically active cells are derived from one or more of a primary cell harvest, a stem cell, or a cell line.
- the assessments derived from the disclosed methods can be used to reduce the effects of confounding variables in data obtained from an electrically active cell culture.
- the methods can also be used to decide if a particular culture is suitable for inclusion in scientific and characterization studies. Also disclosed is a method of finding the global conduction velocity of an electrically active cell culture.
- the data such as field potential signals, are measured and collected by a plurality of electrodes.
- the data are collected by at least two electrodes and over at least two individual beats.
- a researcher can use the data to determine one or more parameters associated with the electrically active cell culture.
- the researcher can make an assessment of the electrically active cell culture based on the parameters.
- the parameters can pertain to the temporal stability or the spatial stability associated with the electrically active cell culture.
- the plurality of electrodes that measure the data are in electrical communication with at least a portion of the electrically active cell culture.
- the plurality includes at least two electrodes. In some implementations, the plurality includes three or more electrodes. In other implementations, the plurality includes 10-10000 electrodes.
- the electrodes make up at least part of a microelectrode array (MEA).
- the MEA is communicatively coupled with an analyzer having a processor.
- the processor executes computer-executable instructions to determine the one or more parameters associated with the electrically active cell culture based on the data collected.
- the analyzer further includes a display.
- the processor is in communication with the display and is configured to display information associated with the one or more parameters or the data collected.
- the data measured by the plurality of electrodes can be used to determine one or more parameters that are associated with the electrically active cell culture. These parameters include but are not limited to: cell density, an ion channel distribution, arrhythmogenic behaviors, early after depolarization events, cell viability, number of pacemaker regions, distribution of pacemaker regions, pacemaker region activation frequency and timing, areas of conduction block, quality of attachment to a cell culture substrate, quality of contact with the electrodes, conduction velocity, global conduction velocity, field potential duration, repolarization morphology, amplitude of the field potential signal, slope of the field potential signal, beat period, variability in beat period, and beat propagation patterns of the electrically active cell culture based on the data collected.
- the quality level can be compared to a threshold requirement for the given parameter.
- a researcher can make a decision to include or exclude the electrically active cell culture in scientific and characterization studies based on the quality level. These studies can include evaluation of candidate compounds prior to clinical trials, for example, human clinical trials.
- the determined parameters can be compared to a threshold requirement for quality level.
- the electrically active cell culture is only included in the scientific and characterization studies if it meets or exceeds the threshold requirement.
- a researcher can increase the quality level of the electrically active cell culture by delivering electrical stimulation to the culture via the electrodes.
- the electrical stimulation can improve the temporal stability or the spatial stability of the parameters.
- beat propagation patterns are determined for use in making assessments of the electrically active cell culture.
- a beat is identified within the electrically active cell culture.
- the beat is associated with a corresponding beat start time, beat starting location, and an adjacent beat starting electrode based on the data collected by the MEA.
- the transmission of the beat can be monitored as it propagates from the beat starting electrode to a beat receiving electrode.
- Data collected by the beat receiving electrode is used to register a beat arrival time.
- the difference in the beat arrival time and the beat start time is calculated as the delay time for the given beat receiving electrode.
- the delay times calculated for a plurality of electrodes are used to generate a multi-dimensional data array. Each point in the data array represents the delay time for an individual beat receiving electrode.
- the data array can be used to create a delay map of a spatial beat propagation pattern.
- Implementations of the methods can also include generating a plurality of delay maps over multiple beats. Non-dominant beat propagation patterns can be identified and the associated data arrays can be eliminated from further calculations. Comparisons can be made between the first delay map and an additional delay map, and the comparison can be used to make an assessment pertaining to the spatial stability and/or the temporal stability of the beat propagation pattern. The assessment can be used to decide if the electrically active cell culture will be included in scientific and characterization studies.
- the data are used to determine the conduction velocity of an electrical signal through the electrically active cell culture.
- a data array of delay times can be used to calculate the conduction velocity in more than one dimension, or in a plurality of directions simultaneously.
- the data array of delay times is used to calculate global conduction velocity
- the global conduction velocity is used to make the assessment of the electrically active cell culture.
- a processor uses the data array of delay times to create a scatter plot of the beat propagation.
- the x-axis of the scatter plot represents the distance between the beat starting electrode and the beat receiving electrode, and the y-axis of the scatter plot represents the corresponding delay time.
- a best fit line is found through the delay times on the scatter plot.
- the corresponding slope of the best fit line, m can be used to calculate the global conduction velocity.
- the best fit line is found using a least squares approach.
- the global conduction velocity is the reciprocal of the slope, m.
- the assessment of the electrically active cell culture can pertain to a temporal stability of at least one of the one or more parameters, a spatial stability of at least one of the one or more parameters, or both, depending upon the particular implementation of the methods.
- the assessment can include consideration of the coefficient of variation or the standard deviation of at least one of the parameters.
- the assessment can be compared to a predetermined threshold requirement, and the comparison can be used to decide if the electrically active cell culture will be included or excluded in scientific and characterization studies.
- an assessment of temporal stability can be used to detect early after depolarization events.
- Some implementations of the methods for assessing an electrically active cell culture include filtering the data obtained from an electrically active cell culture. These methods include using a processor to collect field potential signals over a period of time. The field potential signals are measured by the plurality of electrodes that are in electrical communication with at least a portion of the electrically active cell culture. The electrodes are communicatively coupled with the processor.
- methods of filtering data can include using a processor to determine the temporal stability of at least one parameter associated with the electrically active cell culture based on the data collected.
- the coefficient of variance or the standard deviation of the parameter over time is considered in the in the determination of temporal stability.
- the temporal stability is used in a decision of whether the electrically active cell culture will be included in scientific and characterization studies.
- methods of filtering data can include using a processor to determine the spatial stability of at least one parameter associated with the electrically active cell culture based on the data collected.
- the determination of spatial stability accounts for a coefficient of variance or a standard deviation of the parameter at different locations within the cell culture.
- the spatial stability is used in a decision of whether the electrically active cell culture will be included in scientific and characterization studies.
- the methods for assessing an electrically active cell culture can also include identifying abnormal electrical activity. Identifying abnormal electrical activity includes collecting, over a period of time, by a processor, field potential signals measured by a plurality of electrodes. The plurality of electrodes are in electrical communication with at least a portion of the electrically active cell culture. The plurality of electrodes are also communicatively coupled with the processor.
- the methods for identifying abnormal electrical activity also include determining, by the processor, a series of beat periods. A beat period is the duration of time between a first field potential signal and a second field potential signal. The methods further include comparing each beat period in the series to a predetermined threshold requirement and designating each beat period as a long beat period or a short beat period relative to the threshold requirement. The methods of identifying abnormal electrical activity further include making an assessment of abnormal electrical activity based on the relative number of long beat periods to short beat periods. In some implementations, the assessment can pertain to early after depolarization events.
- the system includes a plurality of electrodes. At least a portion of the plurality of electrodes are in electrical communication with at least a portion of an electrically active cell culture.
- the system also includes an analyzer having a processor.
- the processor is communicatively coupled with the plurality of electrodes and is configured to execute computer-readable instructions.
- the computer-readable instructions include instructions to at least 1) collect data measured by the plurality of electrodes, and 2) determine at least one or more parameters associated with the electrically active cell culture based on the data collected. An assessment can be made of the electrically active cell culture based on the one or more determined parameters.
- the data collected can be, for example, field potential signals.
- the processor can be configured to deliver electrical stimulation to the electrically active cell culture via at least one of the plurality of electrodes.
- the electrical stimulation can improve a temporal stability of a beat propagation pattern, a spatial stability of a beat propagation pattern, or both.
- the processor is configured to determine at least one or more parameters associated with temporal stability or spatial stability associated with the electrically active cell culture based on the data collected.
- the processor is configured to calculate a delay time between the beat arrival time and the beat start time.
- the system further include a memory.
- the processor can be configured to generate a multi-dimensional data array of the delay times for a plurality of electrodes around the beat starting electrode. Each point in the data array represents the delay time for an individual beat receiving electrode.
- the data array is stored in the memory.
- the processor is configured to generate a first delay map of a spatial beat propagation pattern using the data array of delay times.
- the processor is configured to generate a plurality of delay maps for multiple beats and identify any non-dominant beat propagation patterns in the electrically active cell culture.
- the processor can further be configured to eliminate the data arrays associated with non-dominant beat propagation patterns from further calculations.
- the processor can also be configured to make a comparison between a first delay map and an additional delay map, and use the comparison in making an assessment.
- the assessment can pertain to at least one of the spatial stability and the temporal stability of the beat propagation pattern.
- the processor is configured to determine the conduction velocity.
- the data array of delay times is used by the processor to calculate the conduction velocity of an electrical signal through the cell culture.
- the processor is configured to measure conduction velocity in a plurality of directions simultaneously, or in more than one dimension.
- the processor is configured to calculate a global conduction velocity for an electrically active cell culture, and the global conduction velocity is used to make the assessment of the electrically active cell culture.
- the assessment of the electrically active cell culture can pertain to a temporal stability of at least one parameter, a spatial stability of at least one parameter, or both.
- the system can include a sensor (e.g., one or more electrodes, photosensors, etc.) configured to record a physiological signal from an electrically active cell culture, and an analyzer having a processor that is communicatively coupled with the sensor.
- the processor can be configured to execute computer-readable instructions that cause the processor to receive the physiological signal recorded by the sensor, analyze the physiological signal to determine a beat period associated with the electrically active cell culture and a pro-arrhythmic indicator, and determine a quantitative measure of arrhythmia burden.
- the quantitative measure of arrhythmia burden can be a relationship between the beat period associated with the electrically active cell culture and the pro-arrhythmic indicator.
- determining a pro-arrhythmic indicator can include determining a percentage (or a ratio) of beats exhibiting the pro-arrhythmic indicator.
- the quantitative measure of arrhythmia burden can a specific beat period associated with the electrically active cell culture at which a predetermined percentage of beats exhibit the pro-arrhythmic indicator (e.g., EAD50, EAD20).
- the senor can be at least one electrode further configured to deliver electrical stimulation to the electrically active cell culture.
- the processor can be configured to execute further computer-readable instructions that cause the processor to control the beat period associated with the electrically active cell culture using electrical stimulation.
- the system can include at least one light-emitting element configured to deliver optogenetic stimulation to the electrically active cell culture.
- the processor can be configured to execute further computer-readable instructions that cause the processor to control the beat period associated with the electrically active cell culture using optogenetic stimulation.
- the processor can be configured to execute further computer-readable instructions that cause the processor to generate a curve that defines the relationship between the beat period associated with the electrically active cell culture and the percentage of beats exhibiting the pro-arrhythmic indicator.
- the quantitative measure of arrhythmia burden can be a characteristic of the curve (e.g., a slope and/or amplitude).
- determining a pro-arrhythmic indicator can include detecting a region of beat period bi-stability by estimating a probability distribution of beat period.
- the region of beat period bi-stability can be a plurality of beats with a bimodal probability distribution of beat period.
- the probability distribution of beat period can be estimated using kernel density estimation.
- the plurality of beats with the bimodal probability distribution can be a set of beats having a short beat period and a set of beats having a long beat period.
- detecting a region of beat period bi-stability can include classifying each of a plurality of beats as having a short beat period or a long beat period.
- the processor can be configured to execute further computer-readable instructions that cause the processor to determine a quantitative measure of arrhythmia burden based on the number of beats classified as having the long beat period.
- the processor can be configured to execute further computer-readable instructions that cause the processor to identify a predetermined number of consecutive beats having maximum stability.
- the quantitative measure of arrhythmia burden can be determined based on the predetermined number of consecutive beats having maximum stability.
- identifying a predetermined number of consecutive beats having maximum stability can include estimating a coefficient of variation of beat period. The coefficient of variation can be the measure of stability.
- the quantitative measure can be used to assess the safety of a pharmaceutical compound in contact with the electrically active cell culture.
- the physiological signal can be a cardiac beat signal.
- the cardiac beat signal can include at least one of a field potential signal, an impedance signal, an action potential signal, a calcium signal, an optical signal, or combinations thereof.
- the pro-arrhythmic indicator can be an early after depolarization (EAD) event.
- the pro-arrhythmic indicator can be other events including, but not limited to, a rolling EAD, ectopic beat, and/or tachyarrhythmia.
- the electrically active cell culture can be an in vitro cell culture.
- the method can include recording a physiological signal from an electrically active cell culture; analyzing the physiological signal to determine a beat period associated with the electrically active cell culture and a pro-arrhythmic indicator; and determining a quantitative measure of arrhythmia burden.
- the quantitative measure of arrhythmia burden can be a relationship between the beat period associated with the electrically active cell culture and the pro-arrhythmic indicator.
- determining a pro-arrhythmic indicator can include determining a percentage (or a ratio) of beats exhibiting the pro-arrhythmic indicator.
- the quantitative measure of arrhythmia burden can a specific beat period associated with the electrically active cell culture at which a predetermined percentage of beats exhibit the pro-arrhythmic indicator (e.g., EAD50, EAD20).
- the method can further include controlling the beat period associated with the electrically active cell culture using at least one of electrical stimulation, optogenetic stimulation, or temperature.
- the method can further include generating a curve that defines the relationship between the beat period associated with the electrically active cell culture and the percentage of beats exhibiting the pro-arrhythmic indicator.
- the quantitative measure of arrhythmia burden can be a characteristic of the curve (e.g., a slope and/or amplitude).
- the method can further include maintaining the beat period associated with the electrically active cell culture at a fixed beat period; and contacting a pharmaceutical compound with the electrically active cell culture.
- the quantitative measure of arrhythmia burden can be a concentration of the pharmaceutical compound that induces a predetermined percentage of beats exhibiting the pro-arrhythmic indicator.
- determining a pro-arrhythmic indicator can include detecting a region of beat period bi-stability by estimating a probability distribution of beat period.
- the region of beat period bi-stability can be a plurality of beats with a bimodal probability distribution of beat period.
- the probability distribution of beat period can be estimated using kernel density estimation.
- the plurality of beats with the bimodal probability distribution can be a set of beats having a short beat period and a set of beats having a long beat period.
- detecting a region of beat period bi-stability can include classifying each of a plurality of beats as having a short beat period or a long beat period.
- the processor can be configured to execute further computer-readable instructions that cause the processor to determine a quantitative measure of arrhythmia burden based on the number of beats classified as having the long beat period.
- the method can further include identifying a predetermined number of consecutive beats having maximum stability.
- the quantitative measure of arrhythmia burden can be determined based on the predetermined number of consecutive beats having maximum stability.
- identifying a predetermined number of consecutive beats having maximum stability can include estimating a coefficient of variation of beat period. The coefficient of variation can be the measure of stability.
- the method can further include contacting a pharmaceutical compound with the electrically active cell culture.
- the method can further include assessing the safety of the pharmaceutical compound based on the quantitative measure.
- the physiological signal can be a cardiac beat signal.
- the cardiac beat signal can include at least one of a field potential signal, an impedance signal, an action potential signal, a calcium signal, an optical signal, or combinations thereof.
- the pro-arrhythmic indicator can be an early after depolarization (EAD) event.
- the pro-arrhythmic indicator can be other events including, but not limited to, a rolling EAD, ectopic beat, and/or tachyarrhythmia.
- the electrically active cell culture can be an in vitro cell culture.
- the system can include a sensor (e.g., one or more electrodes, photosensors, etc.) configured to record a physiological signal from an electrically active cell culture, and an analyzer having a processor that is communicatively coupled with the sensor.
- the processor can be configured to execute computer-readable instructions that cause the processor to receive the physiological signal recorded by the sensor, analyze the physiological signal to determine a beat period associated with the electrically active cell culture, detect a region of beat period bi-stability, and identify one or more beats exhibiting a pro-arrhythmic indicator within the region of beat period bi-stability.
- the method can include recording a physiological signal from an electrically active cell culture; analyzing the physiological signal to determine a beat period associated with the electrically active cell culture; detecting a region of beat period bi-stability; and identifying the one or more beats exhibiting the pro-arrhythmic indicator within the region of beat period bi-stability.
- detecting a region of beat period bi-stability can include estimating a probability distribution of beat period.
- the region of beat period bi-stability can be a plurality of beats with a bimodal probability distribution of beat period.
- the probability distribution of beat period can be estimated using kernel density estimation.
- the plurality of beats with the bimodal probability distribution can be a set of beats having a short beat period and a set of beats having a long beat period.
- detecting a region of beat period bi-stability can include classifying each of a plurality of beats as having a short beat period or a long beat period.
- the processor can be configured to execute further computer-readable instructions that cause the processor to determine a quantitative measure of arrhythmia burden based on the number of beats classified as having the long beat period.
- the method can further include generating an average short beat period from one or more beats classified as having the short beat period.
- the method can further include generating an average long beat period from one or more beats classified as having the long beat period.
- the method can further determining a quantitative measure of arrhythmia burden based on at least one of the average short beat period or the average long beat period.
- the method can further include assessing the safety of the pharmaceutical compound in contact with the electrically active cell culture based on the quantitative measure.
- the physiological signal can be a cardiac beat signal.
- the cardiac beat signal can include at least one of a field potential signal, an impedance signal, an action potential signal, a calcium signal, an optical signal, or combinations thereof.
- the pro-arrhythmic indicator can be an early after depolarization (EAD) event.
- the pro-arrhythmic indicator can be other events including, but not limited to, a rolling EAD, ectopic beat, and/or tachyarrhythmia.
- the electrically active cell culture can be an in vitro cell culture.
- the system can include a sensor (e.g., one or more electrodes, photosensors, etc.) configured to record a physiological signal from an in vitro electrically active cell culture, and an analyzer having a processor that is communicatively coupled with the sensor.
- the processor can be configured to execute computer-readable instructions that cause the processor to receive the physiological signal recorded by the sensor, analyze the physiological signal to determine a beat period associated with the in vitro electrically active cell culture, identify a predetermined number of consecutive beats having maximum stability, and determine a quantitative measure of cardiac beating based on the predetermined number of consecutive beats having maximum stability.
- the method can include recording a physiological signal from an in vitro electrically active cell culture; analyzing the physiological signal to determine a beat period associated with the in vitro electrically active cell culture; identifying a predetermined number of consecutive beats having maximum stability, and determining a quantitative measure of cardiac beating based on the predetermined number of consecutive beats having maximum stability.
- the quantitative measure of cardiac beating can include, but is not limited to, beat period, field potential duration (FPD), depolarization spike amplitude, or conduction velocity.
- the predetermined number of consecutive beats having maximum stability can be between about 5 and about 500 consecutive beats.
- the predetermined number of consecutive beats having maximum stability can be about 30 consecutive beats. It should be understood that about 30 consecutive beats is provided only as an example and that the predetermined number of consecutive beats having maximum stability can be more or less than about 30 beats.
- the method can further include estimating a coefficient of variation of beat period.
- the predetermined number of consecutive beats having maximum stability can be identified using the coefficient of variation of beat period.
- the predetermined number of consecutive beats having maximum stability have relatively lowest coefficients of variation of beat period.
- the method can further include excluding from the determination of the quantitative measure of arrhythmia burden a plurality of consecutive beats with relatively high coefficients of variation of beat period.
- the coefficient of variation is provided only as an example stability metric. In other words, the coefficient of variation is provided as only one example of a statistical measure of a collection of beat periods. This disclosure contemplates that other stability metrics (e.g., standard deviation) can be used with the techniques described herein.
- the method can further include assessing the safety of a pharmaceutical compound in contact with the in vitro electrically active cell culture based on the quantitative measure of cardiac beating.
- the physiological signal can be a cardiac beat signal.
- the cardiac beat signal can include at least one of a field potential signal, an impedance signal, an action potential signal, a calcium signal, an optical signal, or combinations thereof.
- the system can include a plurality of sensors configured to record a physiological signal from an electrically active cell culture; and an analyzer having a processor that is communicatively coupled with the plurality of sensors.
- the processor can be configured to execute computer-readable instructions that cause the processor to receive the physiological signal recorded by the sensors, analyze the physiological signal to determine beat timings associated with the electrically active cell culture, generate a propagation pattern from respective beat timings for the same beat recorded by the plurality of sensors, and using the propagation pattern, determining whether the electrically active cell culture exhibits stable or unstable beat propagation.
- the plurality of sensors can be a plurality of electrodes and/or photosensors (e.g., an array of electrodes and/or photosensors).
- the method can include recording a physiological signal from an electrically active cell culture using a plurality of sensors; analyzing the physiological signal to determine beat timings associated with the electrically active cell culture; generating a propagation pattern from respective beat timings for the same beat recorded by the plurality of sensors; and, using the propagation pattern, determining whether the electrically active cell culture exhibits stable or unstable beat propagation.
- the method can further include determining a quantitative measure of beat propagation stability using the propagation pattern.
- the propagation pattern comprises a spatial propagation pattern.
- the method can further include generating a respective spatial propagation pattern from respective beat timings for each of a plurality of beats recorded by the plurality of sensors.
- the quantitative measure can be a number of different respective spatial propagation patterns.
- the respective spatial propagation patterns can include a dominant propagation pattern, which is the spatial propagation pattern with the most occurrences across the plurality of beats (e.g., the most common spatial propagation pattern among the generated propagation patterns).
- the quantitative measure can be determined based on the dominant propagation pattern.
- the quantitative measure can be a percentage of the plurality of beats following the dominant propagation pattern.
- the quantitative measure can be ratio of the respective propagation patterns following the dominant propagation pattern to the total number of respective propagation patterns.
- the quantitative measure of beat propagation stability can be a conduction velocity.
- the propagation pattern can be a plot of respective delay times versus respective distances for each of the plurality of sensors.
- a respective distance can be a distance between an origin sensor (e.g., an origin electrode) and a respective sensor (e.g., a respective electrode), and a respective delay time can be a difference between a recorded beat time at the origin sensor and a recorded beat time at the respective sensor (e.g., which is spaced apart from the origin sensor).
- the method can further include determining the respective delay times for each of the plurality of sensors.
- the method can further include performing a least squares regression on the plot of respective delay times versus respective distances for each of the plurality of sensors to determine a best fit line.
- the conduction velocity can be an inverse slope of the best fit line.
- the method can further include controlling the propagation pattern associated with the electrically active cell culture using at least one of electrical stimulation, optogenetic stimulation, or temperature.
- the method can further include assessing the safety of a pharmaceutical compound in contact with the electrically active cell culture based on the quantitative measure.
- the electrically active cell culture can be an in vitro cell culture.
- FIG. 1 is a high-throughput electrophysiology culture system including a microelectrode array (MEA).
- MEA microelectrode array
- FIG. 2 is a cross-sectional schematic of electrically active cells cultured on an MEA.
- FIG. 3 is a graph of an exemplary cardiomyocyte action potential.
- FIG. 4 is a graph of an exemplary field potential signal detected by an electrode of a MEA.
- FIG. 5 is a side-by-side comparison of an exemplary cardiomyocyte action potential and the corresponding field potential signal.
- FIG. 6A is a schematic of an exemplary microelectrode array, as viewed from the top.
- FIG. 6B is an exemplary scatter plot of delay times obtained from an MEA.
- the distance a beat travels from a starting electrode to a receiving electrode is graphed along the x-axis, and the time a beat takes to travel the distance is graphed along the y-axis.
- FIG. 7A is an exemplary map of a beat propagation pattern, depicting a beat that started on the edge of a culture.
- FIG. 7B is an exemplary map of a beat propagation pattern, depicting a beat that started in the center of a culture.
- FIG. 8A is an exemplary map of a beat propagation pattern prior to addition of flecainide, a conduction blocker, to a cardiomyocyte culture.
- FIG. 8B is an exemplary map of a beat propagation pattern from the culture of FIG. 8A , after the introduction of flecainide.
- FIG. 8C is a bar graph of conduction velocities from an exemplary culture.
- conduction velocity slows with increasing concentrations of flecainide.
- FIG. 9A is a flow chart of an exemplary method of filtering data.
- FIG. 9B shows a graph of an exemplary culture having a time window of temporal stability, and the corresponding beat propagation maps from that time window.
- FIG. 10A shows a beat propagation map of an exemplary culture having a conduction block.
- FIG. 10B shows a beat propagation map of an exemplary culture with multiple pacemaker regions.
- FIG. 11 shows two different beat propagation patterns originating from the same exemplary culture, and a histogram of conduction velocities from various beats within the same culture.
- FIG. 12 shows a graph of data from an exemplary culture having temporal instability of the beat period.
- FIG. 13 shows a graph of an exemplary culture having temporal instability of the beat period. In various regions, the field potential signals are shown to demonstrate the presence of early afterdepolarization events corresponding to regions of temporal instability.
- FIG. 14A shows beat propagation maps of an exemplary culture being paced from the lower right hand corner.
- FIG. 14B shows beat propagation maps of an exemplary culture being paced from the upper left hand corner.
- FIG. 15 shows beat propagation maps of an exemplary culture being paced from the lower left hand corner.
- FIG. 16 shows a histogram of the conduction velocity from a single exemplary well under paced versus spontaneous conditions.
- FIG. 17 is an exemplary schematic diagram of the electronics that are adapted to interface with a MEA.
- FIG. 18 illustrates the rate-dependence of early afterdepolarization (EAD) events.
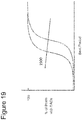
- FIG. 19 is a curve illustrating the relationship between beat period and arrhythmic burden.
- FIG. 20 illustrates example types of arrhythmic events.
- FIG. 21 is a flow diagram illustrating example operations for quantifying an arrhythmia burden.
- FIG. 22 is a flow diagram illustrating example operations for identifying one or more beats exhibiting a pro-arrhythmic indicator.
- FIG. 23 is a flow diagram illustrating example operations for assessing electrically active cell culture data.
- FIG. 24 is another flow diagram illustrating example operations for assessing electrically active cell culture data.
- the word “comprise” and variations of the word, such as “comprising” and “comprises,” means “including but not limited to,” and is not intended to exclude, for example, other additives, components, integers or steps.
- “Exemplary” means “an example of” and is not intended to convey an indication of a preferred or ideal aspect. “Such as” is not used in a restrictive sense, but for explanatory purposes.
- FIG. 1 illustrates an implementation of one exemplary aspect of a high-throughput electrophysiology culture system 100 that can be used for the systems and methods described herein.
- an electrophysiology culture plate, or MEA, 20 can comprise, for example, a monolithic MEA plate 104 integrated with a biologic culture plate 106 , and the system 100 can further comprise electronics 108 together with software configured to stimulate a cell culture via the electrophysiology culture plate to evoke a response and to record data.
- the electrophysiology culture plate 20 can comprise a plurality of culture wells 114 configured to culture electroactive cells (or electrically active cells).
- An array of microelectrodes 22 configured to extracellularly interface with the cultured cells is operatively associated with each culture well 114 .
- Each electrode 22 is also communicatively coupled with the electronics 108 .
- Each electrode 22 can be configured to record electrical activity from a cell culture located within a well 114 and also to electrically stimulate those cells. This technique can provide an extracellular, label free method for examining both individual cellular behavior and overall network activity, optionally, simultaneously. Additional information regarding one type of MEA culture plates that are suitable for using in the methods and systems described herein can be found in U.S. Pre-Grant Publication No.
- the system 100 can optionally be configured to deliver optogenetic stimulation to the electroactive cells.
- the system 100 can further include a respective light emitting element set corresponding to each of the plurality of culture wells 114 . Additional information regarding a system suitable for delivering optogenetic stimulation can be found in U.S. Pre-Grant Publication No.
- the system 100 can optionally include heating and/or cooling elements configured for controlling/adjusting the temperature of the plurality of culture wells 114 .
- each well plate can have an area of interest, e.g. an electroactive area that can be, for example and without limitation, about 1.25 mm to 2 mm in diameter.
- Suitable MEA systems can be obtained, for example from Axion Biosystems (Atlanta, Ga., USA).
- the system 100 can be configured to collect data from an electrically active cell culture using an imaging system.
- an imaging system for example, microscopy imaging systems for visualizing cell structures and biological processes are known in the art. This disclosure contemplates that a microscopy imaging system can be used to collect data from an electrically active cell culture.
- the data from the electrically active cell culture obtained using a microelectrode array (MEA) can be used to determine parameters that assist in making assessments of the electrically active cell culture.
- Electrically active cells such as cardiomyocytes, are cultured such that they are in electrical communication with at least a portion of the electrodes in a well of the MEA.
- the assessments derived from the disclosed methods can be used to reduce the effects of confounding variables in data obtained from an electrically active cell culture.
- the methods can also be used to decide if a particular culture is suitable for inclusion in scientific and characterization studies. Also disclosed is a method of finding the global conduction velocity of an electrically active cell culture.
- Cardiomyocytes or cardiomyocyte-like cells can be derived from primary tissue harvests, from cell lines, from stem cells, or from cellular reprogramming protocols.
- the term “cardiomyocyte-like” is used to describe cells that have certain aspects in common with cardiomyocytes present in actual heart tissue. For example, like cardiomyocytes, cardiomyocyte-like cells can beat and transmit electrical signals to neighboring cells via gap junctions.
- the methods described herein use the term cardiomyocyte. However, the methods can be also performed using cardiomyocyte-like cell cultures or other electrically active cell cultures.
- FIG. 2 shows cardiomyocytes 26 cultured within a well of an MEA 20 . Some of the cardiomyocytes 26 are in contact with electrodes 22 , which are configured to detect extracellular changes in the field potential.
- a cardiomyocyte action potential 1 is initiated with a depolarization phase 2 , where sodium rushes into the cell. The depolarization phase is followed by a plateau phase 4 , dominated by the influx of calcium, where the cells remains depolarized, and ultimately a repolarization phase 6 characterized by an outflux of potassium and a return to the starting transmembrane potential.
- the field potential 7 the signal captured by the electrodes 22 of an MEA 20 in contact with the cellular network 24 is referred to as the field potential 7 .
- the field potential contains functional markers that represent the depolarization and repolarization of the cardiac action potential.
- FIG. 5 demonstrates the temporal relationship between the action potential 1 and the field potential, 7 , that is measured by the electrodes of the MEA.
- the depolarization phase 2 is detected by the biphasic signal generated by the influx of sodium crossing a threshold.
- the depolarization time 8 is marked in time when the field potential signal trace hits its maximum slope.
- the field potential signal can also be characterized by its amplitude 18 , as shown in FIG. 4 .
- the amplitude is the difference in voltage between the depolarization peak 14 and the depolarization trough 16 .
- the repolarization phase is marked by the peak of the T-wave 10 that follows the depolarization phase.
- the T-wave corresponds to the influx of potassium back into the cell and the return to the starting transmembrane potential.
- the field potential duration (FPD) 12 is measured as the difference between the depolarization time 8 and the peak of the T-wave 10 .
- the beat period is the time from one depolarization 8 to the next.
- the relative timing of the depolarization 8 across the MEA enables the computation of a conduction velocity measurement.
- the beat timestamp is measured for each beat on each electrode in the array 20 .
- Beats detected on individual electrodes 22 can be grouped into well-wide beats, based on the timestamp registered by each electrode.
- a single well-wide beat is expected to manifest as a single depolarization spike occurring on each electrode in very close proximity in time (for
- FIG. 6A is a representation of an array of electrodes 22 of an exemplary well of a MEA 20 having electrodes 22 spaced 200 ⁇ m from one another in the vertical and horizontal directions. It is to be appreciated that the number of electrodes 22 and the spacing shown in FIG. 6A are for example purposes only and greater or fewer electrodes 22 can be used and the spacing can also differ from what is shown. As shown in FIG. 6A , the electrode that first detected the beat is considered the beat starting electrode 30 . The beat timestamps, or arrival times, on the neighboring beat receiving electrodes can be used to generate a data array of delay times, as shown in Table 1. Table 1 shows an exemplary data array of delay times registered across the electrodes 22 of a well of an MEA 20 .
- the beat starting electrode 30 is represented by the data point in column 1, row 2.
- the delay time (t di ) at each electrode 22 is the difference between the beat arrival time (t i ) on that particular beat receiving electrode 22 and the beat start time, to, at the beat starting electrode 30 .
- t di t i ⁇ t 0
- the velocity at which a beat propagates through the cellular network is a useful parameter for assessing a cardiomyocyte culture.
- the conduction velocity can vary depending upon the location within the cell culture, and thus it is another example of a parameter that is subject to spatial variability.
- a data array of delay times such as the one shown in Table 1, can be used to calculate a global conduction velocity (GCV) that is representative for the entire cell culture.
- the data array can be presented, for example, as a scatter plot, as shown in FIG. 6B .
- the X-axis of the plot is the distance between the beat starting electrode and the beat receiving electrode.
- the Y-axis is the corresponding delay time at the beat receiving electrode.
- these delay values can be graphically displayed to illustrate the beat propagation across the MEA 20 .
- the beat propagation pattern, and therefore the delay map can vary from well to well of the MEA 20 and beat to beat. Sometimes the beat begins in the edge of the culture and propagates from one side to the other, as shown in FIG. 7A . At other times, a beat can originate in the center of the MEA and propagate outward, as in FIG. 7B .
- the GCV method can be useful for detecting changes induced by adding compounds to a cardiomyocyte culture.
- flecainide is an exemplary compound known to slow beat conduction velocity by blocking sodium channels within the cardiomyocyte network.
- FIGS. 8A-B show maps of exemplary recordings made before ( FIG. 8A ) and after ( FIG. 8B ) the addition of flecainide to a cardiomyocyte culture. Measurements of the conduction velocity using the GCV method described above were systematically reduced as the concentration of flecainide was increased.
- FIG. 8C shows the exemplary GCV plotted as a function of the increasing flecainide concentration.
- Cardiomyocyte cultures can be used to evaluate the safety risk of a candidate compound before the compound is advanced to human clinical trials.
- Growing cells on an MEA 20 allows baseline measurements of the field potential 7 to be made. These measurements can be used to assess parameters relating to the cellular health, function, and quality level of the culture. The parameters can include, for example, the amplitude 18 or maximum slope 8 of the depolarization spike, the beat period, the field potential duration 12 , the global conduction velocity, or others.
- the measurements can then be repeated after the candidate compound has been exposed to the cellular network for a pre-determined amount of time. The degree to which any of the measurements changes upon addition of the candidate compound can inform the safety risk of the compound.
- These measurements can also be used to develop and characterize new stem cell lines, to compare the electrophysiology of cultured cardiomyocytes to in vivo cardiomyocytes, and/or to evaluate in vitro models of disease.
- the methods of filtering data can include gauging a quality level of the cell culture based on one or more parameters.
- the assessment of a cardiac cell culture may be more accurate if it is made using only cultures that are high quality, reliable, and healthy at baseline. Accuracy can be further improved by taking measurements across many individual beats.
- a threshold requirement can be defined that states 1) if a particular cardiomyocyte network should be included in an evaluation of the compound, and 2) which collection of individual beats should be used to make the measurements from that particular cardiomyocyte culture. Data and parameters determined from the data can be compared to the threshold requirement to determine if the data should be included in further analyses and/or scientific and characterization studies.
- Parameters that can be used in the methods of filtering data and assessing a quality level of a culture can include but are not limited to: cell density, an ion channel distribution, arrhythmogenic behaviors, early after depolarization events, cell viability, number of pacemaker regions, distribution of pacemaker regions, pacemaker region activation frequency and timing, areas of conduction block, quality of attachment to a cell culture substrate, quality of contact with the electrodes, conduction velocity, global conduction velocity, field potential duration, repolarization morphology, amplitude of the field potential signal, slope of the field potential signal, beat period, variability in beat period, and beat propagation patterns of the electrically active cell culture based on the data collected.
- determining which wells and/or beats will be included in further scientific and characterization studies is a four-step process.
- a flow chart of the exemplary, four-step method of filtering data and assessing a quality level of a culture is shown in FIG. 9A .
- data is recorded and prepared for processing.
- a region of temporal stability is identified, as shown on the graph in FIG. 9B .
- a region of temporal stability 32 can be characterized as the timespan with the lowest coefficient of variation for a given parameter.
- the parameter can be, for example, the beat period. Alternatively, the parameter can be any parameter that varies over time.
- beats that are spatially stable are identified within the selected timespan. Beats with spatial stability 34 follow the same propagation pattern, and can be identified using the beat propagation maps, as shown in FIG. 9B . These beats are selected for further analyses (the fourth step).
- Methods of filtering data from inclusion in scientific and characterization studies can consider the spatial stability of one or more parameters.
- the timestamp of the beat detected by each electrode 22 can be used to generate a delay map illustrating the spatial pattern of beat propagation across a culture in a well of the MEA 20 .
- the beat begins in one portion of the culture and propagates uniformly through the rest of the culture. This manifests in a delay map that indicates a single beat origin location and a smooth gradient of time delays through the rest of the array, as seen in FIG. 7B .
- Irregular propagation patterns may be due to morphological or functional causes.
- a poor culture due to low density, poor attachment, etc.
- the cell culture may have a functional deficit affecting beat propagation.
- impairments in the gap junctions may inhibit an action potential from one portion of the culture from travelling to neighboring cells. This results in propagation maps that may not be missing data points, but that indicate conduction block due to larger than expected delays as seen in FIG. 10A .
- a culture can also have multiple pacemaker regions, resulting in action potentials propagating through the culture in two different directions simultaneously. This can result in a collision of the beats at particular regions of the culture, which manifests in the propagation delay maps as non-uniform beat propagation as seen in FIG. 10B . Exclusion of wells that have irregular propagation patterns at baseline can be helpful to scientific and characterization studies, especially if beat propagation and conduction velocity are relevant outcome metrics.
- a threshold requirement can be set and compared to the assessment of spatial stability. If the spatial stability does not meet the threshold requirement, the data and/or particular culture can be excluded from further analyses, including scientific and characterization studies.
- a single cardiomyocyte culture can present different propagation patterns at different times. This can be the result of, for example, changes in the syncytium as the culture develops over time, the existence of multiple pacemaking sites, or the addition of a compound affecting propagation. These varying propagation patterns can have different conduction velocities.
- An example of this phenomenon is shown in FIG. 11 .
- a beat originating in the upper right corner of the MEA and propagating downward and leftward can have a conduction velocity of, for example, 0.2 mm/ms.
- a beat in the exact same well/culture originating in the lower left corner of the MEA and propagating upward and rightward can have a conduction velocity of, for example, 0.3 mm/ms.
- propagation patterns can lead to noisy and potentially unreliable data.
- the propagation patterns can be sorted, and non-dominant patterns excluded from further analyses. This could produce a more reliable estimate of the conduction velocity and any changes caused by the experimental treatments.
- Temporal stability of various parameters can also be considered when performing the methods of filtering data and gauging the quality level of an electrically active cell culture.
- the beat period is the time difference between two consecutive beats.
- a healthy culture will exhibit low variability in beat period from beat to beat.
- spontaneous changes in beat period can occur.
- FIG. 12 graphs the beat period over time and shows a region of spontaneous instability 38 .
- the region of spontaneous instability 38 is the time frame in which the beat period dips down (around 18 minutes). The beat period then returns to the steady-state around 19 minutes. Incorporating measurements taken during this timeframe can lead a researcher to unreliable conclusions.
- Using measurements recorded during a timeframe with a stable beat period 32 can reduce noise and increase reliability.
- a threshold requirement can be set and compared to an assessment of temporal stability. If the temporal stability does not meet the threshold requirement, the data and/or particular culture can be excluded from further analyses, including scientific and characterization studies.
- a measure of stability, S can be defined as the standard deviation of a parameter (for example, the beat period) over a collection of N beats ⁇ .
- a lower value of S indicates greater stability, given by the following equation:
- ⁇ stable arg ⁇ ⁇ min ⁇ ⁇ ⁇ S ⁇ ( ⁇ ) If the beat periods are unstable throughout the entire measurement period for a baseline condition, the well can be excluded from further participation in the study.
- An unhealthy, low quality culture, or a culture that has been exposed to a dangerous compound, may exhibit irregular beating.
- Irregular beat periods induced by addition of a compound may be an indication of the compound being pro-arrhythmic, which is an important determination in cardiac drug safety testing.
- Arrhythmias can present in different forms within the culture, but in all cases a measurement of the temporal stability over a collection of beats, as described above, can be used to detect the arrhythmic activity.
- a specific arrhythmic pattern can further indicate the presence of an early afterdepolarization (EAD) event, which is another important pro-arrhythmic indicator.
- Other pro-arrhythmic indicators can include ectopic beats, triggered activity, “rolling” EADs, or repolarization instability.
- pro-arrhythmic indicators EAD 2002 , rolling EAD 2004 , and ectopic beat 2006
- Detection of EADs can assist researchers in determining the safety of a candidate pharmaceutical compound.
- An EAD is an abnormal depolarization event which occurs during the plateau phase 4 of the cardiac action potential 1 , before repolarization is complete. This manifests as a small depolarization event 40 in the field potential around the time that repolarization (t-wave) 10 is expected, as seen in FIG. 13 .
- Detection of EADs can be automated by detecting regions of beat period “bi-stability” within the time frame of measurement.
- a period of “bi-stability” is characterized by a rapid switching of the beat period between two different values, as is illustrated in FIG. 13 .
- the two beat period values can be defined as SHORT and LONG, where the SHORT beat period is less than the value of the LONG beat period.
- the LONG beat period is highly predictive of the presence of an EAD 40 . This is illustrated in FIG. 13 where each of the LONG beat periods exhibits an EAD feature 40 .
- the switching between the SHORT and LONG beat period may, or may not, occur on each consecutive beat.
- a measure of the proportion of LONG beats to SHORT beats can be used as a measure of the intensity of the arrhythmia, or arrhythmic load.
- the LONG beats and/or the SHORT beats can be used to determine a quantitative measure of cardiac beating including, but not limited to, beat period, field potential duration (FPD), depolarization spike amplitude, or conduction velocity.
- FPD field potential duration
- Temporal and spatial stability can be altered, and in some cases improved, by electrically pacing or electrically stimulating the culture.
- electrical current is applied to the culture via one or more of the microelectrodes 22 . This current triggers a well-wide beat in the culture. Electrical stimulation can be applied at 1 Hz, for example, so that the culture beats reliably at 1 Hz.
- FIGS. 14A-B pacing causes the beat to reliably begin in the region being stimulated. The beat propagates outward from there.
- the cardiomyocyte culture is first stimulated in the lower right corner of the well, causing beats to initiate from the lower right.
- FIG. 14A the cardiomyocyte culture is first stimulated in the lower right corner of the well, causing beats to initiate from the lower right.
- the culture is stimulated in the upper left corner of the well, causing the beats to initiate from the upper left.
- Pacing reduces the variability of many parameters, including but not limited to the beat propagation pattern and the conduction velocity.
- the spatial stability of the beat propagation pattern is illustrated by FIG. 15 , where the propagation pattern does not change across the paced beats.
- FIG. 16 shows a histogram of the conduction velocity over time, comparing the frequency that a beat propagates at a given velocity. The improvement in the temporal stability upon pacing is evident by the increased number of beats having the same conduction velocity for the paced group 42 as compared to the spontaneous group 44 .
- optical stimulation can be delivered to the culture via one or more light emitting elements sets.
- a light emitting element set can be provided corresponding to each of the plurality of culture wells 114 .
- the temperature of the culture can be adjusted, for example, using heating and/or cooling elements associated with each of the plurality of culture wells 114 .
- At least portions of the methods and systems can take the form of a computer program product on a computer-readable storage medium having computer-readable program instructions (e.g., computer software) embodied in the storage medium.
- computer-readable program instructions e.g., computer software
- Any suitable computer-readable storage medium can be utilized including hard disks, CD-ROMs, optical storage devices, or magnetic storage devices.
- These computer program instructions can also be stored in a computer-readable memory that can direct a computer or other programmable data processing apparatus to function in a particular manner, such that the instructions stored in the computer-readable memory produce an article of manufacture including computer-readable instructions for implementing the function specified in the flowchart block or blocks.
- the computer program instructions can also be loaded onto a computer or other programmable data processing apparatus to cause a series of operational steps to be performed on the computer or other programmable apparatus to produce a computer-implemented process such that the instructions that execute on the computer or other programmable apparatus provide steps for implementing the functions specified in the flowchart block or blocks.
- blocks of the block diagrams and flowchart illustrations support combinations of means for performing the specified functions, combinations of steps for performing the specified functions and program instruction means for performing the specified functions. It will also be understood that each block of the block diagrams and flowchart illustrations, and combinations of blocks in the block diagrams and flowchart illustrations, can be implemented by special purpose hardware-based computer systems that perform the specified functions or steps, or combinations of special purpose hardware and computer instructions.
- FIG. 17 illustrates an exemplary schematic diagram associated with electronics 108 that is adapted to interface with a multiwell microelectrode array (MEA) 20 , which can be used in the systems and methods described herein.
- Electronics 108 can include a processor-based device that includes its own microcontroller, volatile and non-volatile memory, one or more databases, and one or more interfaces for communicating data with a user.
- arrhythmia analysis consists of identifying, in a binary sense, whether an arrhythmic event has or has not occurred during a defined analysis time window.
- recent studies e.g., Guo, L. et al. and Gilchrist, K. H. et al.
- these recent studies have not involved assigning quantitative arrhythmic risk scores based on a relationship between beat period (or beat rate) associated with an electroactive cell culture and arrhythmic indicators or events.
- beat period (or beat rate, which is the inverse of beat period) can be adjusted or controlled by pacing the electroactive cell culture, and pro-arrhythmic indicators can be automatically identified and counted at each of a plurality of beat periods. Additionally, a quantitative measure of arrhythmia burden can be assigned based on the relationship between beat period and pro-arrhythmic indicators.
- EAD early afterdepolarization
- Sotalol an example pro-arrhythmic compound
- an electrically active cell culture e.g., cardiomyocytes
- EADs 1800 shown by arrows in FIG. 18
- the arrhythmic burden is defined as a 100% at the spontaneous beat period, i.e., pro-arrhythmic indicators occurring during each beat.
- the beat-by-beat prevalence of arrhythmic indicators, such as EAD events can be assessed by determining the percentage (or ratio) of beats that exhibit arrhythmic indicators from an overall number of beats.
- the overall number of beats can be the number of beats in a time period of analysis having any length.
- the percentage of beats exhibiting pro-arrhythmic indicators can be referred to as the arrhythmia burden.
- the arrhythmia burden is dependent on the beating rate of the electrically active cell culture. As the beating rate increases (i.e., the beat period decreases) through pacing, the arrhythmia burden is reduced (e.g., arrhythmia burden of 50% at beat period of 1200 ms), and then eventually reduced to arrhythmia burden of 0% at the 1 Hz pacing rate (or beat period of 1000 ms).
- sotalol is only provided as an example compound or drug and that other compounds or drugs can be placed in contact with the electrically active cell culture. Additionally, this disclosure contemplates that the techniques described herein are applicable with other compounds or drugs.
- the relationship between beating rate and arrhythmia burden can be measured and analyzed. Additionally, by pacing the activity of the electrically active cell culture at a plurality of frequencies following drug or compound addition, the arrhythmia burden can be determined at each of the plurality of frequencies. The relationship between beat period and arrhythmic burden can then be plotted as shown in FIG. 19 . The difference between two curves, shown by arrow 1900 in FIG. 19 , can be used to inform arrhythmia risk. For example, in FIG. 19 , the curve on the left may be considered a higher arrhythmia risk. Additionally, a quantitative measure of the arrhythmia burden can be obtained from the relationship between beat period and arrhythmic burden.
- the quantitative measure of arrhythmia burden can be a specific beat period (or beat rate) associated with the electrically active cell culture at which a predetermined percentage (e.g., 50%) of beats exhibit the pro-arrhythmic indicator (e.g., EAD event).
- EAD50 can be defined as the specific beat period (or beat rate) that produces an EAD on 50% of the beats, or 50% arrhythmia burden.
- This quantitative measure provides a means for comparing the pro-arrhythmic risk of different concentrations of the same drug and across different drugs.
- the quantitative measure can be used to assess the safety of a compound or drug, for example, the quantitative measure can be used to estimate, evaluate, or rank the safety of a compound or drug.
- EAD50 is provided only as one example.
- the arrhythmic burden can have other values.
- EAD20 can be similarly defined as the beat period (or beat rate) that produces a pro-arrhythmic indicator such as an EAD on 20% of the beats.
- the quantitative measure of arrhythmia burden can be obtained from the curve defining the relationship between beat period and arrhythmic burden (e.g., FIG. 19 ).
- the quantitative measure can include, but is not limited to, a slope of a portion of the curve defining the relationship between beat period and arrhythmic burden.
- the quantitative measure can be a maximum amplitude (e.g., the maximum EAD percentage) of the curve defining the relationship between beat period and arrhythmic burden.
- Arrhythmia burden can also be quantified by pacing the electrically active culture at a fixed beat rate (e.g., 1 Hz) and identifying the concentration at which a compound or drug induces a predetermined percentage of beats exhibiting the pro-arrhythmic indicator.
- the electrically active culture can be paced at a fixed beat rate of 1 Hz, and the concentration of the compound or drug can be adjusted to achieve EAD50.
- This concentration can be referred to as the EAD50 concentration.
- the quantitative measure provides a means for comparing the pro-arrhythmic risk of different concentrations of the same drug and across drugs. It should be understood that the fixed beat rate of 1 Hz and EAD50 are provided only as examples and can have other values.
- electronics 108 can include one or more hardware components such as a central processing unit (CPU) or microprocessor 811 , a random access memory (RAM) module 812 , a read-only memory (ROM) module 813 , a memory or data storage module 814 , a database 815 , one or more input/output (I/O) devices 816 , and an interface 817 .
- electronics 108 can include one or more software media components such as a computer-readable medium including computer-executable instructions for performing methods consistent with certain disclosed embodiments. It is contemplated that one or more of the hardware components listed above can be implemented using software.
- storage 814 can include a software partition associated with one or more other hardware components of control and monitoring system 800 .
- Electronics 108 can include additional, fewer, and/or different components than those listed above. It is understood that the components listed above are exemplary only and not intended to be limiting.
- CPU 811 can include one or more processors, each configured to execute instructions and process data to perform one or more functions associated with electronics 108 . As illustrated in FIG. 8 , CPU 811 can be communicatively coupled to RAM 812 , ROM 813 , storage 814 , database 815 , I/O devices 816 , and interface 817 . CPU 811 can be configured to execute sequences of computer program instructions to perform various processes. The computer program instructions can be loaded into RAM 812 for execution by CPU 811 .
- RAM 812 and ROM 813 can each include one or more devices for storing information associated with an operation of electronics 108 and/or CPU 811 .
- ROM 813 can include a memory device configured to access and store information associated with control and monitoring system 800 , including, for example, stimulation schemes for different types of experiments.
- RAM 812 can include a memory device for storing data associated with one or more operations of CPU 811 .
- ROM 303 can load instructions into RAM 302 for execution by CPU 811 .
- Storage 814 can include any type of mass storage device configured to store information that CPU 811 can need to perform processes consistent with the disclosed embodiments.
- storage 814 can include one or more magnetic and/or optical disk devices, such as hard drives, CD-ROMs, DVD-ROMs, or any other type of mass media device.
- storage 814 can include flash memory mass media storage or other semiconductor-based storage medium.
- Database 815 can include one or more software and/or hardware components that cooperate to store, organize, sort, filter, and/or arrange data used by electronics 108 and/or CPU 811 .
- I/O devices 816 can include one or more components configured to communicate information with a component or user associated with electronics 108 .
- I/O devices 816 can include a console with an integrated keyboard and mouse to allow a user to input parameters associated with electronics 108 .
- I/O devices 816 can also include a display including a graphical user interface (GUI) for providing a network management console for network administrators to configure electronics 108 .
- GUI graphical user interface
- I/O devices 816 can also include peripheral devices such as a printer for printing information associated with electronics 108 , a user-accessible disk drive (e.g., a USB port, a floppy, CD-ROM, or DVD-ROM drive, etc.) to allow a user to input data stored on a portable media device, a microphone, a speaker system, or any other suitable type of interface device.
- I/O devices can be configured to output network analysis results and traffic characteristics.
- Interface 817 can include one or more components configured to transmit and receive data via a communication network, such as the Internet, a local area network, a workstation peer-to-peer network, a direct link network, a wireless network, MEA 20 , or any other suitable communication platform.
- interface 817 can include one or more modulators, demodulators, multiplexers, demultiplexers, network communication devices, wireless devices, antennas, modems, and any other type of device configured to enable data communication via a communication network.
- interface 817 can be coupled to or include wireless communication devices, such as a module or modules configured to transmit information wirelessly using Wi-Fi or Bluetooth wireless protocols.
- the logical operations described herein with respect to the various figures may be implemented (1) as a sequence of computer implemented acts or program modules (i.e., software) running on a computing device (e.g., the computing device described in FIG. 17 ), (2) as interconnected machine logic circuits or circuit modules (i.e., hardware) within the computing device and/or (3) a combination of software and hardware of the computing device.
- the logical operations described herein with respect to the various figures can be implemented using the high-throughput electrophysiology culture system including a microelectrode array (MEA) as described in FIG. 1 .
- MEA microelectrode array
- the logical operations described herein with respect to the various figures can be implemented using other electrophysiology culture systems (i.e., not limited to systems having an MEA).
- the logical operations discussed herein are not limited to any specific combination of hardware and software. The implementation is a matter of choice dependent on the performance and other requirements of the computing device. Accordingly, the logical operations described herein are referred to variously as operations, structural devices, acts, or modules. These operations, structural devices, acts and modules may be implemented in software, in firmware, in special purpose digital logic, and any combination thereof. It should also be appreciated that more or fewer operations may be performed than shown in the figures and described herein. These operations may also be performed in a different order than those described herein.
- a physiological signal from an electrically active cell culture is recorded.
- the physiological signal can be recorded using a sensor such as one or more electrodes, photosensors, etc.
- the physiological signal can be recorded using an MEA, e.g., the MEA of the high-throughput electrophysiology culture system 100 of FIG. 1 .
- the physiological signal can be transmitted to electronics (e.g., a computing device) communicatively coupled with the sensor.
- the physiological signal can be a cardiac beat signal.
- the cardiac beat signal can include at least one of a field potential signal, an impedance signal, an action potential signal, a calcium signal, an optical signal, or combinations thereof.
- the physiological signal is analyzed to determine a beat period (or beat rate) associated with the electrically active cell culture and a pro-arrhythmic indicator.
- a pro-arrhythmic indicator can be identified automatically (e.g., as described in FIG. 22 ).
- the beat period can be the time interval from one depolarization to the next of the physiological signal, for example.
- a quantitative measure of arrhythmia burden is determined.
- the quantitative measure of arrhythmia burden can be a relationship between the beat period associated with the electrically active cell culture and the pro-arrhythmic indicator.
- the quantitative measure of arrhythmia burden can be a measure of beats exhibiting a pro-arrhythmic indicator (or other arrhythmic indicator).
- the quantitative measure of arrhythmia burden can be a specific beat period (or beat rate) associated with the electrically active cell culture at which a predetermined percentage of beats exhibit the pro-arrhythmic indicator such as EAD 50 or EAD 20 .
- the quantitative measure of arrhythmia burden can be based on a curve that defines the relationship between the beat period associated with the electrically active cell culture and the percentage of beats exhibiting the pro-arrhythmic indicator (e.g., FIG. 19 ).
- the electrically active cell culture can be paced using electrical, optical, and/or temperature stimulation to generate the curve.
- the quantitative measure of arrhythmia burden can be based on a number of beats classified as having a long beat period. The quantitative measure provides a means for comparing the pro-arrhythmic risk of different concentrations of the same drug and across different drugs.
- the quantitative measure can be used to assess the safety of a compound or drug, for example, the quantitative measure can be used to estimate, evaluate, or rank the safety of a compound or drug.
- a physiological signal from an electrically active cell culture is recorded.
- the physiological signal can be recorded using a sensor such as one or more electrodes, photosensors, etc.
- the physiological signal can be recorded using an MEA, e.g., the MEA of the high-throughput electrophysiology culture system 100 of FIG. 1 .
- the physiological signal can be transmitted to electronics (e.g., a computing device) communicatively coupled with the sensor.
- the physiological signal can be a cardiac beat signal.
- the cardiac beat signal can include at least one of a field potential signal, an impedance signal, an action potential signal, a calcium signal, an optical signal, or combinations thereof.
- the physiological signal is analyzed to determine a beat period associated with the electrically active cell culture. As described herein, the beat period can be the time interval from one depolarization to the next of the physiological signal, for example.
- a region of beat period bi-stability is detected. An example region of beat period bi-stability is illustrated by FIG. 13 , where beat period rapidly switches between LONG and SHORT beat periods.
- the one or more beats exhibiting the pro-arrhythmic indicator are identified within the region of beat period bi-stability.
- the LONG beat period can be highly predictive of the presence of an EAD.
- a quantitative measure of arrhythmic burden can be determined based on the number of beats exhibiting the pro-arrhythmic indicator as described herein.
- a quantitative measure of cardiac beating can be determined based on the beats having the LONG beat period and/or the SHORT beat period.
- the quantitative metric can be used to assess the safety of a pharmaceutical compound as described herein.
- a physiological signal from an in vitro electrically active cell culture is recorded.
- the physiological signal can be recorded using a sensor such as one or more electrodes, photosensors, etc.
- the physiological signal can be recorded using an MEA, e.g., the MEA of the high-throughput electrophysiology culture system 100 of FIG. 1 .
- the physiological signal can be transmitted to electronics (e.g., a computing device) communicatively coupled with the sensor.
- the physiological signal can be a cardiac beat signal.
- the cardiac beat signal can include at least one of a field potential signal, an impedance signal, an action potential signal, a calcium signal, an optical signal, or combinations thereof.
- the physiological signal is analyzed to determine a beat period associated with the in vitro electrically active cell culture. As described herein, the beat period is the time interval from one depolarization to the next of the physiological signal, for example.
- a predetermined number of consecutive beats having maximum stability is identified.
- the predetermined number of consecutive beats having maximum stability can be between about 5 and about 500.
- the predetermined number of consecutive beats having maximum stability can be about 30 consecutive beats, for example.
- beats having maximum stability can be identified using a coefficient of variation (or other stability metric) of beat period.
- a predetermined number of consecutive beats having maximum stability can be identified based on the coefficients of variation. It should be understood that the coefficient of variation is provided only as an example stability metric and that other stability metrics (e.g., standard deviation) can be used to identify beats with maximum stability.
- a quantitative measure of cardiac beating is determined based on the predetermined number of consecutive beats having maximum stability. In other words, the beats having maximum stability are used in the further analysis (e.g., determination of a quantitative measure) while beats having lesser stability are excluded from the further analysis.
- the quantitative measure of cardiac beating can include, but is not limited to, beat period, field potential duration (FPD), depolarization spike amplitude, or conduction velocity.
- a physiological signal from an electrically active cell culture can be recorded using a plurality of sensors.
- the physiological signal can be recorded using a plurality of sensors such as an array of electrodes, photosensors, etc.
- the physiological signal can be recorded using an MEA, e.g., the MEA of the high-throughput electrophysiology culture system 100 of FIG. 1 .
- the physiological signal can be transmitted to electronics (e.g., a computing device) communicatively coupled with the sensors.
- the physiological signal can be a cardiac beat signal.
- the cardiac beat signal can include at least one of a field potential signal, an impedance signal, an action potential signal, a calcium signal, an optical signal, or combinations thereof.
- the physiological signal is analyzed to determine beat timings associated with the electrically active cell culture.
- a propagation pattern is generated from respective beat timings for the same beat recorded by the plurality of sensors. Propagation patterns are described with regard to FIGS. 7A, 7B, 8A, 8B, 9B, 10A, 10B, 11, 14A, 14B, and 15 . In other words, by generating a propagation pattern, beat timings can be transformed into delay maps.
- the propagation patterns can optionally be visually displayed, for example, using a display device of the electronics.
- the propagation patterns facilitate visualization of how beats start and end as they travel across the electrodes and/or MEA.
- the propagation patterns also facilitate visualization of beat conduction well-to-well across an MEA plate and/or beat-to-beat in the same well or in different wells of an MEA plate.
- a determination is made as to whether the electrically active cell culture exhibits stable or unstable beat propagation using the propagation pattern.
- beats with spatial stability follow the same propagation pattern (e.g., FIG. 9B )
- irregular beats follow different propagation patterns (e.g., FIGS. 10A and 10B ).
- quantitative measures of beat propagation stability can be obtained from the propagation pattern as described herein.
Landscapes
- Health & Medical Sciences (AREA)
- Life Sciences & Earth Sciences (AREA)
- Engineering & Computer Science (AREA)
- Immunology (AREA)
- Biomedical Technology (AREA)
- Molecular Biology (AREA)
- Urology & Nephrology (AREA)
- Hematology (AREA)
- Chemical & Material Sciences (AREA)
- General Health & Medical Sciences (AREA)
- Cell Biology (AREA)
- Pathology (AREA)
- Physics & Mathematics (AREA)
- Biotechnology (AREA)
- Food Science & Technology (AREA)
- Tropical Medicine & Parasitology (AREA)
- General Physics & Mathematics (AREA)
- Biochemistry (AREA)
- Microbiology (AREA)
- Analytical Chemistry (AREA)
- Medicinal Chemistry (AREA)
- Medical Informatics (AREA)
- Toxicology (AREA)
- Bioinformatics & Cheminformatics (AREA)
- Computing Systems (AREA)
- Computer Networks & Wireless Communication (AREA)
- Signal Processing (AREA)
- Physiology (AREA)
- Biophysics (AREA)
- Heart & Thoracic Surgery (AREA)
- Surgery (AREA)
- Animal Behavior & Ethology (AREA)
- Veterinary Medicine (AREA)
- Public Health (AREA)
- Measuring Or Testing Involving Enzymes Or Micro-Organisms (AREA)
- Apparatus Associated With Microorganisms And Enzymes (AREA)
Abstract
Description
| TABLE 1 | ||
| | ||
| Row |
| 1 | 2 | 3 | 4 | 5 | 6 | 7 | 8 | |
| 8 | 3.6327 | 3.6964 | 3.78702 | 4.18841 | 4.37583 | 4.67548 | 5.17479 | 5.66754 |
| 7 | NaN | 2.9467 | 3.11522 | 3.30799 | 3.64539 | NaN | 4.53261 | 5.05423 |
| 6 | 2.35768 | 2.20678 | 2.42413 | 2.54364 | 2.94875 | 3.33247 | NaN | 4.55266 |
| 5 | 1.62226 | 1.53979 | 1.66882 | 2.00895 | 2.2531 | 2.79953 | 3.24352 | 4.08216 |
| 4 | 0.85232 | 0.83772 | 1.08154 | 1.32714 | 1.92559 | 2.50316 | 2.99534 | 3.72355 |
| 3 | 0.32801 | 0.33066 | 0.56054 | 1.00057 | 1.56233 | 2.37925 | 2.75342 | 3.37616 |
| 2 | 0 | 0.32583 | 0.39601 | 0.89373 | 1.34638 | 2.02139 | 2.58265 | 3.32552 |
| 1 | 0.32329 | 0.36746 | 0.43794 | 0.70659 | 1.19332 | 1.93906 | 2.52624 | 3.24036 |
example, within 30 ms).
t di =t i −t 0
The reciprocal of the slope of this line is the global conduction velocity, reported in distance/time.
The most stable set of N beats, ωstable, is chosen by minimizing the stability metric S:
If the beat periods are unstable throughout the entire measurement period for a baseline condition, the well can be excluded from further participation in the study.
Claims (27)
Priority Applications (1)
| Application Number | Priority Date | Filing Date | Title |
|---|---|---|---|
| US15/964,139 US10969382B2 (en) | 2015-03-19 | 2018-04-27 | Systems and methods for assessing data collected from an electrically active cell culture |
Applications Claiming Priority (3)
| Application Number | Priority Date | Filing Date | Title |
|---|---|---|---|
| US201562135382P | 2015-03-19 | 2015-03-19 | |
| US15/076,223 US9983198B2 (en) | 2015-03-19 | 2016-03-21 | Systems and methods for assessing data collected from an electrically active cell culture |
| US15/964,139 US10969382B2 (en) | 2015-03-19 | 2018-04-27 | Systems and methods for assessing data collected from an electrically active cell culture |
Related Parent Applications (1)
| Application Number | Title | Priority Date | Filing Date |
|---|---|---|---|
| US15/076,223 Continuation US9983198B2 (en) | 2015-03-19 | 2016-03-21 | Systems and methods for assessing data collected from an electrically active cell culture |
Publications (2)
| Publication Number | Publication Date |
|---|---|
| US20180292389A1 US20180292389A1 (en) | 2018-10-11 |
| US10969382B2 true US10969382B2 (en) | 2021-04-06 |
Family
ID=56923648
Family Applications (2)
| Application Number | Title | Priority Date | Filing Date |
|---|---|---|---|
| US15/076,223 Active US9983198B2 (en) | 2015-03-19 | 2016-03-21 | Systems and methods for assessing data collected from an electrically active cell culture |
| US15/964,139 Active 2037-04-01 US10969382B2 (en) | 2015-03-19 | 2018-04-27 | Systems and methods for assessing data collected from an electrically active cell culture |
Family Applications Before (1)
| Application Number | Title | Priority Date | Filing Date |
|---|---|---|---|
| US15/076,223 Active US9983198B2 (en) | 2015-03-19 | 2016-03-21 | Systems and methods for assessing data collected from an electrically active cell culture |
Country Status (1)
| Country | Link |
|---|---|
| US (2) | US9983198B2 (en) |
Families Citing this family (9)
| Publication number | Priority date | Publication date | Assignee | Title |
|---|---|---|---|---|
| US20180169403A1 (en) | 2015-01-09 | 2018-06-21 | President And Fellows Of Harvard College | Nanowire arrays for neurotechnology and other applications |
| US11768196B2 (en) | 2017-07-07 | 2023-09-26 | President And Fellows Of Harvard College | Current-based stimulators for electrogenic cells and related methods |
| US12174140B2 (en) | 2017-11-01 | 2024-12-24 | President And Fellows Of Harvard College | Electronic circuits for analyzing electrogenic cells and related methods |
| EP3502695A1 (en) * | 2017-12-22 | 2019-06-26 | IMEC vzw | A method and a system for analysis of cardiomyocyte function |
| WO2021257686A1 (en) | 2020-06-17 | 2021-12-23 | President And Fellows Of Harvard College | Complementary metal-oxide-semiconductor (cmos) multi-well apparatus for electrical cell assessment |
| CA3187430A1 (en) | 2020-06-17 | 2021-12-23 | President And Fellows Of Harvard College | Systems and methods for patterning and spatial electrochemical mapping of cells |
| JP7792356B2 (en) | 2020-06-17 | 2025-12-25 | プレジデント アンド フェローズ オブ ハーバード カレッジ | Apparatus for cell mapping by impedance measurements and method of operation thereof - Patent Application 20070122997 |
| US20240315631A1 (en) * | 2021-07-09 | 2024-09-26 | Sharp Kabushiki Kaisha | Evaluation method, evaluation device, and computer program for evaluating neurotransmitter signals conducted through axon bundles |
| CN113466110A (en) * | 2021-07-19 | 2021-10-01 | 中山大学 | Cell electrophysiological signal discrete in-situ long-time measurement and recording system and method |
Citations (5)
| Publication number | Priority date | Publication date | Assignee | Title |
|---|---|---|---|---|
| US20040106095A1 (en) | 2002-07-26 | 2004-06-03 | Thomson James A. | Functional cardiomyocytes from human embryonic stem cells |
| US20110300569A1 (en) | 2008-05-05 | 2011-12-08 | Acea Biosciences, Inc. | Data analysis of impedance-based cardiomyocyte-beating signals as detected on real-time cell analysis (rtca) cardio instruments |
| US20120107861A1 (en) | 2010-10-29 | 2012-05-03 | Rory Abrams | Method of determining risk of arrhythmia |
| US8560054B2 (en) | 2006-05-08 | 2013-10-15 | A.M.P.S., Llc | Method and apparatus for extracting optimum holter ECG reading |
| US20130274838A1 (en) | 2010-10-18 | 2013-10-17 | The Research Foundation Of State University Of New York | Optical control of cardiac function |
-
2016
- 2016-03-21 US US15/076,223 patent/US9983198B2/en active Active
-
2018
- 2018-04-27 US US15/964,139 patent/US10969382B2/en active Active
Patent Citations (5)
| Publication number | Priority date | Publication date | Assignee | Title |
|---|---|---|---|---|
| US20040106095A1 (en) | 2002-07-26 | 2004-06-03 | Thomson James A. | Functional cardiomyocytes from human embryonic stem cells |
| US8560054B2 (en) | 2006-05-08 | 2013-10-15 | A.M.P.S., Llc | Method and apparatus for extracting optimum holter ECG reading |
| US20110300569A1 (en) | 2008-05-05 | 2011-12-08 | Acea Biosciences, Inc. | Data analysis of impedance-based cardiomyocyte-beating signals as detected on real-time cell analysis (rtca) cardio instruments |
| US20130274838A1 (en) | 2010-10-18 | 2013-10-17 | The Research Foundation Of State University Of New York | Optical control of cardiac function |
| US20120107861A1 (en) | 2010-10-29 | 2012-05-03 | Rory Abrams | Method of determining risk of arrhythmia |
Non-Patent Citations (7)
Also Published As
| Publication number | Publication date |
|---|---|
| US20180292389A1 (en) | 2018-10-11 |
| US20160274088A1 (en) | 2016-09-22 |
| US9983198B2 (en) | 2018-05-29 |
Similar Documents
| Publication | Publication Date | Title |
|---|---|---|
| US10969382B2 (en) | Systems and methods for assessing data collected from an electrically active cell culture | |
| Liu et al. | A consensus statement on detection of hippocampal sharp wave ripples and differentiation from other fast oscillations | |
| Nigam et al. | Rich-club organization in effective connectivity among cortical neurons | |
| Thomson et al. | Postsynaptic pyramidal target selection by descending layer III pyramidal axons: dual intracellular recordings and biocytin filling in slices of rat neocortex | |
| Ito et al. | Segregation of visual response properties in the mouse superior colliculus and their modulation during locomotion | |
| Niwa et al. | Activity related to perceptual judgment and action in primary auditory cortex | |
| Goetz et al. | A novel model incorporating two variability sources for describing motor evoked potentials | |
| Bologna et al. | Investigating neuronal activity by SPYCODE multi-channel data analyzer | |
| Ladavich et al. | Rate-independent detection of atrial fibrillation by statistical modeling of atrial activity | |
| Titiz et al. | Cognitive impairment in temporal lobe epilepsy: role of online and offline processing of single cell information | |
| CN112534279B (en) | System and method for estimating physical parameters of a medium | |
| CN106175757A (en) | Behaviour decision making prognoses system based on brain wave | |
| Feliciano-Ramos et al. | Hippocampal memory reactivation during sleep is correlated with specific cortical states of the retrosplenial and prefrontal cortices | |
| Kudoh et al. | A simple exploratory algorithm for the accurate and fast detection of spontaneous synaptic events | |
| US10294470B2 (en) | Electronic expression of the inward rectifier in cardiocytes derived from human induced pluripotent stem cells | |
| Grigorovsky et al. | Low-to-high cross-frequency coupling in the electrical rhythms as biomarker for hyperexcitable neuroglial networks of the brain | |
| Yamamura et al. | An analysis of current source density profiles activated by local stimulation in the mouse auditory cortex in vitro | |
| Trujillo et al. | Response properties underlying selectivity for the rate of frequency modulated sweeps in the auditory cortex of the mouse | |
| Rubin | Normal and abnormal voluntary activity | |
| Nácher et al. | Asymmetric effective connectivity between primate anterior cingulate and lateral prefrontal cortex revealed by electrical microstimulation | |
| JP2006521550A (en) | Method and system for analyzing compounds | |
| Beer et al. | Revealing and reshaping attractor dynamics in large networks of cortical neurons | |
| Zhu et al. | Heterogeneity of neuronal populations within columns of primate V1 revealed by high-density recordings | |
| Tóth et al. | Do not waste your electrodes—principles of optimal electrode geometry for spike sorting | |
| Oshio et al. | Temporal filtering by prefrontal neurons in duration discrimination |
Legal Events
| Date | Code | Title | Description |
|---|---|---|---|
| FEPP | Fee payment procedure |
Free format text: ENTITY STATUS SET TO UNDISCOUNTED (ORIGINAL EVENT CODE: BIG.); ENTITY STATUS OF PATENT OWNER: LARGE ENTITY Free format text: ENTITY STATUS SET TO UNDISCOUNTED (ORIGINAL EVENT CODE: BIG.); ENTITY STATUS OF PATENT OWNER: SMALL ENTITY |
|
| FEPP | Fee payment procedure |
Free format text: ENTITY STATUS SET TO SMALL (ORIGINAL EVENT CODE: SMAL); ENTITY STATUS OF PATENT OWNER: LARGE ENTITY Free format text: ENTITY STATUS SET TO SMALL (ORIGINAL EVENT CODE: SMAL); ENTITY STATUS OF PATENT OWNER: SMALL ENTITY |
|
| AS | Assignment |
Owner name: AXION BIOSYSTEMS, INC., GEORGIA Free format text: ASSIGNMENT OF ASSIGNORS INTEREST;ASSIGNORS:CHVATAL, STACIE ANN;MILLARD, DANIEL CHRISTOPHER;ROSS, JAMES DAVID;REEL/FRAME:046812/0231 Effective date: 20160324 |
|
| STPP | Information on status: patent application and granting procedure in general |
Free format text: DOCKETED NEW CASE - READY FOR EXAMINATION |
|
| STPP | Information on status: patent application and granting procedure in general |
Free format text: NON FINAL ACTION MAILED |
|
| STPP | Information on status: patent application and granting procedure in general |
Free format text: RESPONSE TO NON-FINAL OFFICE ACTION ENTERED AND FORWARDED TO EXAMINER |
|
| STPP | Information on status: patent application and granting procedure in general |
Free format text: NOTICE OF ALLOWANCE MAILED -- APPLICATION RECEIVED IN OFFICE OF PUBLICATIONS |
|
| STPP | Information on status: patent application and granting procedure in general |
Free format text: PUBLICATIONS -- ISSUE FEE PAYMENT RECEIVED |
|
| STPP | Information on status: patent application and granting procedure in general |
Free format text: PUBLICATIONS -- ISSUE FEE PAYMENT VERIFIED |
|
| STCF | Information on status: patent grant |
Free format text: PATENTED CASE |
|
| CC | Certificate of correction | ||
| FEPP | Fee payment procedure |
Free format text: ENTITY STATUS SET TO UNDISCOUNTED (ORIGINAL EVENT CODE: BIG.); ENTITY STATUS OF PATENT OWNER: LARGE ENTITY |
|
| MAFP | Maintenance fee payment |
Free format text: PAYMENT OF MAINTENANCE FEE, 4TH YEAR, LARGE ENTITY (ORIGINAL EVENT CODE: M1551); ENTITY STATUS OF PATENT OWNER: LARGE ENTITY Year of fee payment: 4 |