US10859622B2 - Accurate detection and correction of technical and non-technical losses using smart metering - Google Patents
Accurate detection and correction of technical and non-technical losses using smart metering Download PDFInfo
- Publication number
- US10859622B2 US10859622B2 US16/219,384 US201816219384A US10859622B2 US 10859622 B2 US10859622 B2 US 10859622B2 US 201816219384 A US201816219384 A US 201816219384A US 10859622 B2 US10859622 B2 US 10859622B2
- Authority
- US
- United States
- Prior art keywords
- power
- smart meter
- error
- cable
- readings
- Prior art date
- Legal status (The legal status is an assumption and is not a legal conclusion. Google has not performed a legal analysis and makes no representation as to the accuracy of the status listed.)
- Expired - Fee Related, expires
Links
Images


Classifications
-
- G—PHYSICS
- G06—COMPUTING OR CALCULATING; COUNTING
- G06Q—INFORMATION AND COMMUNICATION TECHNOLOGY [ICT] SPECIALLY ADAPTED FOR ADMINISTRATIVE, COMMERCIAL, FINANCIAL, MANAGERIAL OR SUPERVISORY PURPOSES; SYSTEMS OR METHODS SPECIALLY ADAPTED FOR ADMINISTRATIVE, COMMERCIAL, FINANCIAL, MANAGERIAL OR SUPERVISORY PURPOSES, NOT OTHERWISE PROVIDED FOR
- G06Q50/00—Information and communication technology [ICT] specially adapted for implementation of business processes of specific business sectors, e.g. utilities or tourism
- G06Q50/06—Energy or water supply
-
- G—PHYSICS
- G01—MEASURING; TESTING
- G01R—MEASURING ELECTRIC VARIABLES; MEASURING MAGNETIC VARIABLES
- G01R31/00—Arrangements for testing electric properties; Arrangements for locating electric faults; Arrangements for electrical testing characterised by what is being tested not provided for elsewhere
- G01R31/08—Locating faults in cables, transmission lines, or networks
- G01R31/081—Locating faults in cables, transmission lines, or networks according to type of conductors
- G01R31/085—Locating faults in cables, transmission lines, or networks according to type of conductors in power transmission or distribution lines, e.g. overhead
-
- G—PHYSICS
- G01—MEASURING; TESTING
- G01R—MEASURING ELECTRIC VARIABLES; MEASURING MAGNETIC VARIABLES
- G01R19/00—Arrangements for measuring currents or voltages or for indicating presence or sign thereof
- G01R19/25—Arrangements for measuring currents or voltages or for indicating presence or sign thereof using digital measurement techniques
- G01R19/2513—Arrangements for monitoring electric power systems, e.g. power lines or loads; Logging
-
- G—PHYSICS
- G01—MEASURING; TESTING
- G01R—MEASURING ELECTRIC VARIABLES; MEASURING MAGNETIC VARIABLES
- G01R21/00—Arrangements for measuring electric power or power factor
- G01R21/133—Arrangements for measuring electric power or power factor by using digital technique
- G01R21/1331—Measuring real or reactive component, measuring apparent energy
-
- H—ELECTRICITY
- H02—GENERATION; CONVERSION OR DISTRIBUTION OF ELECTRIC POWER
- H02J—ELECTRIC POWER NETWORKS; CIRCUIT ARRANGEMENTS OR SYSTEMS FOR SUPPLYING OR DISTRIBUTING ELECTRIC POWER; SYSTEMS FOR STORING ELECTRIC ENERGY
- H02J13/00—Circuit arrangements for providing remote monitoring or remote control of equipment in a power distribution network
- H02J13/12—Monitoring network conditions, e.g. electrical magnitudes or operational status
-
- H—ELECTRICITY
- H02—GENERATION; CONVERSION OR DISTRIBUTION OF ELECTRIC POWER
- H02J—ELECTRIC POWER NETWORKS; CIRCUIT ARRANGEMENTS OR SYSTEMS FOR SUPPLYING OR DISTRIBUTING ELECTRIC POWER; SYSTEMS FOR STORING ELECTRIC ENERGY
- H02J3/00—Circuit arrangements for AC mains or AC distribution networks
-
- H—ELECTRICITY
- H02—GENERATION; CONVERSION OR DISTRIBUTION OF ELECTRIC POWER
- H02J—ELECTRIC POWER NETWORKS; CIRCUIT ARRANGEMENTS OR SYSTEMS FOR SUPPLYING OR DISTRIBUTING ELECTRIC POWER; SYSTEMS FOR STORING ELECTRIC ENERGY
- H02J3/00—Circuit arrangements for AC mains or AC distribution networks
- H02J3/001—Arrangements for handling faults or abnormalities, e.g. emergencies or contingencies
- H02J3/00125—Transmission line or load transient problems, e.g. overvoltage, resonance or self-excitation of inductive loads
-
- H—ELECTRICITY
- H03—ELECTRONIC CIRCUITRY
- H03M—CODING; DECODING; CODE CONVERSION IN GENERAL
- H03M13/00—Coding, decoding or code conversion, for error detection or error correction; Coding theory basic assumptions; Coding bounds; Error probability evaluation methods; Channel models; Simulation or testing of codes
- H03M13/03—Error detection or forward error correction by redundancy in data representation, i.e. code words containing more digits than the source words
- H03M13/05—Error detection or forward error correction by redundancy in data representation, i.e. code words containing more digits than the source words using block codes, i.e. a predetermined number of check bits joined to a predetermined number of information bits
- H03M13/13—Linear codes
- H03M13/136—Reed-Muller [RM] codes
-
- H—ELECTRICITY
- H03—ELECTRONIC CIRCUITRY
- H03M—CODING; DECODING; CODE CONVERSION IN GENERAL
- H03M13/00—Coding, decoding or code conversion, for error detection or error correction; Coding theory basic assumptions; Coding bounds; Error probability evaluation methods; Channel models; Simulation or testing of codes
- H03M13/03—Error detection or forward error correction by redundancy in data representation, i.e. code words containing more digits than the source words
- H03M13/05—Error detection or forward error correction by redundancy in data representation, i.e. code words containing more digits than the source words using block codes, i.e. a predetermined number of check bits joined to a predetermined number of information bits
- H03M13/13—Linear codes
- H03M13/15—Cyclic codes, i.e. cyclic shifts of codewords produce other codewords, e.g. codes defined by a generator polynomial, Bose-Chaudhuri-Hocquenghem [BCH] codes
- H03M13/1505—Golay Codes
-
- H—ELECTRICITY
- H03—ELECTRONIC CIRCUITRY
- H03M—CODING; DECODING; CODE CONVERSION IN GENERAL
- H03M13/00—Coding, decoding or code conversion, for error detection or error correction; Coding theory basic assumptions; Coding bounds; Error probability evaluation methods; Channel models; Simulation or testing of codes
- H03M13/03—Error detection or forward error correction by redundancy in data representation, i.e. code words containing more digits than the source words
- H03M13/05—Error detection or forward error correction by redundancy in data representation, i.e. code words containing more digits than the source words using block codes, i.e. a predetermined number of check bits joined to a predetermined number of information bits
- H03M13/13—Linear codes
- H03M13/19—Single error correction without using particular properties of the cyclic codes, e.g. Hamming codes, extended or generalised Hamming codes
-
- H—ELECTRICITY
- H04—ELECTRIC COMMUNICATION TECHNIQUE
- H04L—TRANSMISSION OF DIGITAL INFORMATION, e.g. TELEGRAPHIC COMMUNICATION
- H04L63/00—Network architectures or network communication protocols for network security
- H04L63/14—Network architectures or network communication protocols for network security for detecting or protecting against malicious traffic
- H04L63/1408—Network architectures or network communication protocols for network security for detecting or protecting against malicious traffic by monitoring network traffic
- H04L63/1416—Event detection, e.g. attack signature detection
-
- H—ELECTRICITY
- H04—ELECTRIC COMMUNICATION TECHNIQUE
- H04L—TRANSMISSION OF DIGITAL INFORMATION, e.g. TELEGRAPHIC COMMUNICATION
- H04L63/00—Network architectures or network communication protocols for network security
- H04L63/14—Network architectures or network communication protocols for network security for detecting or protecting against malicious traffic
- H04L63/1441—Countermeasures against malicious traffic
-
- G—PHYSICS
- G01—MEASURING; TESTING
- G01R—MEASURING ELECTRIC VARIABLES; MEASURING MAGNETIC VARIABLES
- G01R22/00—Arrangements for measuring time integral of electric power or current, e.g. electricity meters
- G01R22/06—Arrangements for measuring time integral of electric power or current, e.g. electricity meters by electronic methods
- G01R22/061—Details of electronic electricity meters
- G01R22/066—Arrangements for avoiding or indicating fraudulent use
-
- H—ELECTRICITY
- H02—GENERATION; CONVERSION OR DISTRIBUTION OF ELECTRIC POWER
- H02J—ELECTRIC POWER NETWORKS; CIRCUIT ARRANGEMENTS OR SYSTEMS FOR SUPPLYING OR DISTRIBUTING ELECTRIC POWER; SYSTEMS FOR STORING ELECTRIC ENERGY
- H02J2103/00—Details of circuit arrangements for mains or AC distribution networks
- H02J2103/30—Simulating, planning, modelling, reliability check or computer assisted design [CAD] of electric power networks
-
- H02J2203/20—
-
- Y—GENERAL TAGGING OF NEW TECHNOLOGICAL DEVELOPMENTS; GENERAL TAGGING OF CROSS-SECTIONAL TECHNOLOGIES SPANNING OVER SEVERAL SECTIONS OF THE IPC; TECHNICAL SUBJECTS COVERED BY FORMER USPC CROSS-REFERENCE ART COLLECTIONS [XRACs] AND DIGESTS
- Y02—TECHNOLOGIES OR APPLICATIONS FOR MITIGATION OR ADAPTATION AGAINST CLIMATE CHANGE
- Y02E—REDUCTION OF GREENHOUSE GAS [GHG] EMISSIONS, RELATED TO ENERGY GENERATION, TRANSMISSION OR DISTRIBUTION
- Y02E60/00—Enabling technologies; Technologies with a potential or indirect contribution to GHG emissions mitigation
-
- Y—GENERAL TAGGING OF NEW TECHNOLOGICAL DEVELOPMENTS; GENERAL TAGGING OF CROSS-SECTIONAL TECHNOLOGIES SPANNING OVER SEVERAL SECTIONS OF THE IPC; TECHNICAL SUBJECTS COVERED BY FORMER USPC CROSS-REFERENCE ART COLLECTIONS [XRACs] AND DIGESTS
- Y04—INFORMATION OR COMMUNICATION TECHNOLOGIES HAVING AN IMPACT ON OTHER TECHNOLOGY AREAS
- Y04S—SYSTEMS INTEGRATING TECHNOLOGIES RELATED TO POWER NETWORK OPERATION, COMMUNICATION OR INFORMATION TECHNOLOGIES FOR IMPROVING THE ELECTRICAL POWER GENERATION, TRANSMISSION, DISTRIBUTION, MANAGEMENT OR USAGE, i.e. SMART GRIDS
- Y04S10/00—Systems supporting electrical power generation, transmission or distribution
- Y04S10/30—State monitoring, e.g. fault, temperature monitoring, insulator monitoring, corona discharge
-
- Y—GENERAL TAGGING OF NEW TECHNOLOGICAL DEVELOPMENTS; GENERAL TAGGING OF CROSS-SECTIONAL TECHNOLOGIES SPANNING OVER SEVERAL SECTIONS OF THE IPC; TECHNICAL SUBJECTS COVERED BY FORMER USPC CROSS-REFERENCE ART COLLECTIONS [XRACs] AND DIGESTS
- Y04—INFORMATION OR COMMUNICATION TECHNOLOGIES HAVING AN IMPACT ON OTHER TECHNOLOGY AREAS
- Y04S—SYSTEMS INTEGRATING TECHNOLOGIES RELATED TO POWER NETWORK OPERATION, COMMUNICATION OR INFORMATION TECHNOLOGIES FOR IMPROVING THE ELECTRICAL POWER GENERATION, TRANSMISSION, DISTRIBUTION, MANAGEMENT OR USAGE, i.e. SMART GRIDS
- Y04S40/00—Systems for electrical power generation, transmission, distribution or end-user application management characterised by the use of communication or information technologies, or communication or information technology specific aspects supporting them
- Y04S40/20—Information technology specific aspects, e.g. CAD, simulation, modelling, system security
Definitions
- the present invention relates generally to the field of smart grid power management and control. Technical and non-technical losses are detected and used to update the metering and billing systems.
- Electrical power grids are interconnected networks for delivering electricity from suppliers to consumers. They include generating stations that produce electrical power, high-voltage transmission lines that carry power from sources to demand centers, and distribution lines that connect individual customers. Smart grids are electrical power grids that use information and communications technology to gather and act on information, such as information about the behaviors and consumers, in an automated fashion to improve the efficiency, economics, and sustainability of the production and distribution of electricity.
- a smart grid employs advanced sensing, computation, and communications mechanisms to enable more efficient and flexible generation, transmission, and distribution of power through the grid. By facilitating bidirectional information and energy flow through the overall network, a smart grid promises energy savings, reduced operational and consumption costs, improved reliability, and great customer-centricity.
- a smart grid is shown in FIG. 1 .
- Smart grids may use smart meters, which are electrical meters that record consumption of electric energy and communicates that information for monitoring and billing. Smart meters can provide information of when energy was consumed at each metered site.
- Smart meters are essential components in developing smart grids with advanced metering and billing systems. Although smart metering helps in reducing the operating costs and network losses, it adds software and communication layers to the metering infrastructure, which renders it vulnerable to tampering. Tampering could occur in the data, firmware, or hardware of the smart meters.
- the electric power utility must install a smart meter at the physical location of a consumer.
- the meter provides real-time pricing information to the customer while tracking in quasi-real time (typically once every 15 minutes) the customer's energy consumption. This higher granularity of information enables a customer to make more optimal decisions on energy usage, helps utilities in grid monitoring and planning through mechanisms such as demand response, and creates a culture of conservation.
- Cyber attacks are a form a power loss in a smart grid.
- power losses in a smart grid can be divided into two categories; technical losses equation (TL) and non-technical losses (NTL).
- the technical losses occur due to heat losses in transmission and distribution systems.
- Non-technical losses are commercial losses that cannot be attributed to energy being lost through the network of internal consumption. These are losses due to electricity thefts by registered/unregistered users through tampering or tapping, inaccurate readings of meters, inaccurate billing by the utility company and cyber attacks.
- FIG. 2 shows the total electricity losses (both TL and NTL) for some countries in 2014. It is based on data published by International Energy Agency (IEA). See International Energy Agency, 2014. [Online]. Available: https://www.iea.org/topics/electricity/. [Accessed 28 05 2018], incorporated herein by reference in its entirety.
- IEEEA International Energy Agency
- Classification-based techniques cannot determine the actual energy lost during the period of attack.
- advanced attackers can provide demand profiles that are difficult to detect by detection systems.
- the supervised training needed for classification requires a large number of predetermined load profiles, both regular and fraudulent, which need to be verified by many expert inspectors.
- future attacks might have different characteristics from the data used for training.
- classification-based techniques cannot detect service cable tapping since it mainly depends on the data received from the subscribed customers.
- the methods presented above depend on estimations and do not guarantee accurate detection and correction of technical losses, thus consequently result in inaccurate detection and correction of non-technical losses.
- the measurements are usually in RMS, e.g. the sum of RMS values of load currents in a cable does not equal to the RMS of the sum (i.e. I 1 rms +I 2 rms + . . . +I n rms ⁇ (I 1 ⁇ 1 +I 2 ⁇ 2 + . . . +I n ⁇ n ) rms ), resulting in an inaccurate estimation of currents passing in the conductors between the loads, and consequently an inaccurate estimation of technical losses, which will result in an inaccurate estimation of non-technical losses.
- accurately characterizing and calculating the technical and non-technical losses uses only RMS measurements.
- the present disclosure remotely characterizes and updates the cables impedances, detects and classifies the types of losses, calculates the technical and nontechnical power losses when a smart meter is in error, calculates these losses due to tapping a power cable by a registered or an unregistered user or due to a cyber-attack. Both real and reactive powers are considered.
- detection of technical power loss requires knowledge of cable impedances. Determining accurate technical power loss from the cable impedances permits determination of non-technical power loss, and results in updated meter readings which reflect accurate information.
- a system, method, and a non-transitory computer readable medium having instructions stored therein that, when executed by one or more processors, cause the one or more processors to perform a method for determining the cable impedances, and to use these impedances to provide an improved estimation of the technical and non-technical power losses.
- the technical power losses are identified as cable impedance losses and reactance losses. Successive power readings are used to determine the parameters of the technical power losses; and a non-technical error detected is at least one of no error, check meter in error, smart meter in error, cable tapping, and cyberattack.
- a power distribution bus line distributes power to N power cables.
- Each power cable is connected to a smart meter which enters a building.
- Distinct, different combinations of power cables are connected to M check meters, where M is an integer greater than 1 and less than or equal to M max and N is an integer greater than 1 and less than 2 M ⁇ M ⁇ 1.
- the system includes a control center having circuitry configured to determine the different combination of power cables for each check meter, receive successive power readings from each of the N smart meters and each different combination of the M check meters at different time periods, wherein the number of successive power readings is 2 M ⁇ M ⁇ 1; correct for technical power losses in each of the successive power readings; detect at least one non-technical error in any one of the corrected successive power readings; and correct the at least one non-technical error in the one of the smart meter readings.
- a method for detecting and correcting technical and non-technical power losses in a smart grid includes determining, by a check meter configuration module of the control center circuitry, a different combination of power cables for each check meter, receiving, by a communications module of the control center circuitry, successive power readings from each of the N smart meters and each different combination of the M check meters at different time periods, wherein the number of successive power readings is 2 M ⁇ M ⁇ 1; and correcting, by a technical power loss correction module of the control center circuitry, impedance losses and reactance losses in each of the successive power readings.
- the method continues by detecting, by an analysis module of the control center circuitry, at least one non-technical error in any one of the corrected successive power readings; and correcting, by an error correction module of the control center circuitry, the at least one non-technical error in the one of the smart meter readings.
- the method includes determining the impedance and reactance losses of each of the different combinations of power cables by calculating the impedance power loss by summing the power readings from each different combination of power cables with a first equation representing the impedance power loss, P(R) i loss , of a power cable i, where i is an integer value greater than 1 and less than or equal to N, wherein the power loss, P(R) i loss equals R i I i 2 , wherein the resistance R i of each power cable i is an unknown and I is the RMS current measured by the smart meter for each power cable i, to form a second equation; summing the second equations for each different combination of power cables i to form a third equation; solving for the unknown resistances R i of each cable by applying each of the successive power readings to the third equation, where the number of successive power readings is 2 M ⁇ M ⁇ 1, and generating a set of known resistances Ri; calculating the impedance power
- a non-transitory computer readable medium having instructions stored therein that, when executed by one or more processors, causes the one or more processors to perform a method for detecting and correcting technical and non-technical power losses in a smart grid is described.
- the non-transitory computer readable medium method includes determining, by a check meter configuration module of the control center circuitry, a different combination of power cables for each check meter, receiving, by a communications module of the control center circuitry, successive power readings from each of the N smart meters and each different combination of the M check meters at different time periods, wherein the number of successive power readings is 2 M ⁇ M ⁇ 1; and correcting, by a technical power loss correction module of the control center circuitry, impedance losses and reactance losses in each of the successive power readings.
- the non-transitory computer readable medium method continues by detecting, by an analysis module of the control center circuitry, at least one non-technical error in any one of the corrected successive power readings; and correcting, by an error correction module of the control center circuitry, the at least one non-technical error in the one of the smart meter readings.
- the non-transitory computer readable medium method includes determining the impedance and reactance losses of each of the different combinations of power cables by calculating the impedance power loss by summing the power readings from each different combination of power cables with a first equation representing the impedance power loss, P(R) i loss , of a power cable i, where i is an integer value greater than 1 and less than or equal to N, wherein the power loss, P(R) i loss equals R i I i 2 , wherein the resistance R i of each power cable i is an unknown and I is the RMS current measured by the smart meter for each power cable i, to form a second equation; summing the second equations for each different combination of power cables i to form a third equation; solving for the unknown resistances R i of each cable by applying each of the successive power readings to the third equation, where the number of successive power readings is 2 M ⁇ M ⁇ 1, and generating a set of known resistances
- FIG. 1 is an illustration of a smart grid.
- FIG. 2 is a histogram illustrating electric energy losses in some countries, generated based on IEA data of 2014.
- FIG. 3A illustrates an exemplary smart meter.
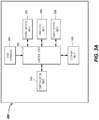
- FIG. 3B illustrates an exemplary control center of a utility company.
- FIG. 4 illustrates an exemplary system configuration
- FIG. 5A is a graph illustrating active power consumption of check meter no. 7 for one hour.
- FIG. 5B is a graph illustrating reactive power consumption of check meter no. 7 for one hour.
- FIG. 6A is a graph illustrating active power consumption of smart meter no. 4 for one hour.
- FIG. 6B is a graph illustrating the non-technical losses of active power related to cable no. 4 for one hour.
- FIG. 7 is an exemplary illustration of computing hardware used in the controllers of the exemplary embodiments.
- FIG. 8 is an exemplary schematic diagram of a data processing system used within the controller of the smart meter, according to certain embodiments.
- FIG. 9 is an exemplary schematic diagram of a CPU used in the controllers according to certain embodiments.
- FIG. 10 is an illustration of a non-limiting example of distributed components which may share processing with the controllers, according to certain embodiments.
- aspects of the disclosure provide a system, method, and computer readable medium for remotely characterizing the cable resistances and reactances in a smart grid.
- Embodiments describe accurately determining technical and non-technical power losses, classifying the types of losses, and correcting meter readings.
- the present invention describes correcting the technical and non-technical losses in situations such as: no error, check meter in error, smart meter in error, cable tapping, and cyberattacks.
- the present invention is demonstrated on a device and/or system having seven meters (i.e., four smart meters and three check meters).
- the invention is not limited to a seven meter system and applies to a system of N+M meters (i.e., N smart meters and M check meters) where the inequality (N ⁇ 2 M ⁇ M ⁇ 1) is satisfied.
- a power plant 110 transmits power to at least one transmission substation(s) 120 .
- the transmission substation sends the power to at least one distribution substation(s) 140 .
- the distribution substation 140 directs the power to one or more buildings ( 160 , 162 , 164 , 166 ), houses 168 or apartments 161 .
- the power may be distributed to a building or neighborhood power delivery network or utility before it enters the building, home or apartment.
- the smart and check meter measurements are received and analyzed at an device located at any of a utility company, the distribution substation 140 , a utility which receives power from the distribution substation or a monitoring center 130 .
- the Hamming code and its application to the smart metering system to detect and correct tampering are explained briefly; more details on this can be found in U.S. Pat. No. 9,747,790B1, incorporated herein by reference in its entirety.
- the Hamming code utilizes coding techniques that are initially used to detect and correct errors in the transmission of binary data. These coding techniques add redundant bits to the original message before transmission. These redundant bits are then analyzed by a receiver, such as the aforementioned utility company, distribution substation 140 , utility grid or monitoring center 130 .
- the redundant bits are designed as a linear combination of the original bits, and hence carry some of their characteristics.
- this minimum distance guarantees that if errors occur to a maximum of n bits in any code word, the resulting binary word will still lie within the Hamming sphere of the original code word and will not cross the Hamming sphere of another code word, and hence upon receiving the erroneous code word, it is possible to correct the code word to the original code word.
- the check bits can be used to detect errors in different bits by designing the code so that each single error would result in a different error shape in the check bits. For example, if M check bits are used, 2 M different binary combinations can be obtained which can be used to detect and correct single errors in 2 M ⁇ 1 positions. One is subtracted because one binary combination of the M check bits stands for the no error case. Therefore, for an information block of length N augmented by M check bits, the following condition needs to be satisfied, (1) N+M ⁇ 2 M ⁇ 1, or equivalently, (2) N ⁇ 2 M ⁇ M ⁇ 1 in order to be able to detect and correct a single error in the code word.
- the generated code word is sent by a transmitter from the source, such as a smart meter, to a receiver at the destination, such as the control center of a utility company, a distribution substation 140 , a controller at a utility grid or a monitoring center 130 through a communication channel.
- the receiver uses a parity-check matrix PCH to detect whether there is an error in the received vector and the location of that error. Once the location of the error is known, the error can be corrected by inverting the bit at that location.
- the parity-check matrix PCH is orthogonal to the generator matrix G, and therefore takes the form of,
- G-PCH 0, where 0 is a zero matrix of size 4 ⁇ 3.
- s is called a syndrome vector which indicates whether there is an error and the location of that error. It can be seen that in case of no error, the syndrome vector s is all zeros.
- a Hamming code is applied to a smart metering system where the data bits are replaced by smart meter readings (i.e. real numbers).
- loads having active powers ⁇ circumflex over (x) ⁇ p1 , ⁇ circumflex over (x) ⁇ p2 , ⁇ circumflex over (x) ⁇ p3 , ⁇ circumflex over (x) ⁇ p4 ) are connected to a single distribution bus 425 by individual cables ( 422 , 424 , 426 , 428 ).
- Each load has a smart meter 450 that reads the amount of power consumed.
- An additional three check meters 451 read the active powers ( ⁇ circumflex over (x) ⁇ p5 , ⁇ circumflex over (x) ⁇ p6 , ⁇ circumflex over (x) ⁇ p7 ) of the loads that are connected across the cables in a pre-designed manner that allows them to measure the delivered power by different combinations of received values.
- ⁇ circumflex over (x) ⁇ p [ ⁇ circumflex over (x) ⁇ p1 ⁇ circumflex over (x) ⁇ p2 ⁇ circumflex over (x) ⁇ p3 ⁇ circumflex over (x) ⁇ p4 ⁇ circumflex over (x) ⁇ p5 ⁇ circumflex over (x) ⁇ p6 ⁇ circumflex over (x) ⁇ p7 ], (1) where ⁇ circumflex over (x) ⁇ pi is the active power measured by meter i.
- the check meters are connected so that they measure a predesigned combination of power flows that are based on a generator matrix G, as shown in equation (3) and equation (4).
- x p ⁇ [ x p ⁇ ⁇ 1 x p ⁇ ⁇ 2 x p ⁇ ⁇ 3 x p ⁇ ⁇ 4 ]
- G ⁇ [ x p ⁇ ⁇ 1 x p ⁇ ⁇ 2 x p ⁇ ⁇ 3 x p ⁇ ⁇ 5 x p ⁇ ⁇ 5 x p ⁇ ⁇ 6 x p ⁇ ⁇ 7 ] . ( 3 )
- the generator matrix G is used to determine the configuration of cables passing through the check meters based on the Hamming code scheme as described above.
- D ( 1 1 0 1 0 1 0 1 1 1 1 1 1 - 1 0 0 0 - 1 0 0 0 - 1 ) .
- 6 ( 6 )
- s p will be one row of the decoding matrix D multiplied by a scalar that represents the magnitude of error.
- the location of error can be determined by comparing the form of the syndrome vector to the rows of the decoding matrix D, where the row of D that has a similar form to the syndrome vector represents an error in the meter corresponding to that row number in the decoding matrix D.
- the error vector e can be created based on the syndrome vector, where all the entries of e are zero except one entry, which corresponds to the meter in error.
- the smart meters are installed at the load side and the check meters are installed at the utility side.
- technical power losses in the cables must be accounted for. Otherwise, the coding scheme may fail.
- the readings of the smart meters need to be compensated to account for these losses in the coding scheme.
- Each smart meter 350 has a control unit 352 including communications circuitry, shown by Communicating Unit 353 , configured to receive and provide data communications from/to at least one of a utility company, a distribution substation 140 , a utility grid which receives power from the distribution substation or a monitoring center 130 .
- the circuitry of each smart meter includes program instructions configured to analyze the data communications (see Analyzing Unit 358 ), sense the power in Power Sensing Unit 357 and control the power in Power Control Unit 359 .
- the smart meter reports the sensed power levels to at least one of a utility company, a distribution substation 140 , a utility grid which receives power from the distribution substation or a monitoring center 130 .
- a smart meter is installed at each customer address on a power cable which enters the building as shown in FIG. 4 .
- a utility company receives the readings from the smart meters 352 , and also receives readings related to the power on the power cables from check meters 451 .
- FIG. 3B illustrates some components found in a control center 332 of a utility company.
- the control center may be found at a utility grid, a distribution substation, at a utility company or within a monitoring center, or any other facility capable of housing the control center.
- the control center has a CPU connected to a communications module 333 , a technical power loss correction module 335 a , a decoding module 335 b , an analysis module 336 , an error correction module 337 , a memory 331 , a customer records repository 338 and a check meter configuration module 339 .
- FIG. 4 depicts a typical utility distribution arrangement which includes a power distribution substation 440 which distributes power on a power transmission line 445 to a distribution bus line 447 .
- the power is stepped down by transformer 447 to a level suitable for providing power to homes or buildings 468 .
- transformer 447 For clarity, only four power cables ( 442 , 444 , 446 , 448 ) are shown. These power cables are connected on the utility side to the distribution bus line 447 .
- a smart meter 450 is connected between the power cable and the home or building to take readings of the voltage and current entering the building. These readings are coded with digits identifying the smart meter location and are wirelessly transmitted to the utility control center 432 for processing.
- the embodiments of the present invention are described with respect to the four power cable configuration shown in FIG. 4 .
- the present invention is not limited to four power cables.
- N is an integer greater than one and less than a design specified number determined by the power on the power distribution line and the number of buildings or houses in a network fed by the power distribution line.
- the maximum value of N may be 30, 100, 1000 or 10000, although practical considerations limit the value to about 1000.
- the maximum value of N is determined by 2 M ⁇ M ⁇ 1, where M is the number of check meters, as described in the embodiments below.
- M max The maximum value of M is referred to as M max .
- Check meters 451 are each connected to a different combination of power cables to measure power on each combination of power cables. These readings are coded with digits identifying the check meter locations and are wirelessly transmitted to the utility control center 432 for processing with the smart meter readings.
- FIG. 3B and FIG. 4 describe a first embodiment having a system for detecting and correcting technical and non-technical power losses in a smart grid, comprising: a power distribution bus line 447 which provides power to a power distribution node; N power cables ( 442 , 444 , 446 , 448 ), each having a first power cable end and a second power cable end, wherein each of the N power cables is connected at the first end to the power distribution node; M check meters 451 each connected near the first end to a different combination of the N power cables, where M is an integer greater than 1 and less than or equal to M max and N is an integer greater than 1 and less than 2 M ⁇ M ⁇ 1; and N smart meters and N active loads, wherein each smart meter is connected by a first smart meter connector to the first power cable end of one of the N power cables and by a second smart meter connector to one of the M active loads.
- the meters communicate wirelessly with control center 432 having circuitry (as shown in FIG. 3B ) configured to determine the different combination of power cables for each check meter, receive, at communications module 333 , successive power readings from each of the N smart meters 450 and each different combination of the M check meters 451 at different time periods, wherein the number of successive power readings is 2 M ⁇ M ⁇ 1; correct, by technical power loss correction module 335 a , for technical power losses in each of the successive power readings; detect, by decoding module 335 b and analysis module 336 , at least one non-technical error in any one of the corrected successive power readings; and correct, by error correction module 337 , the at least one non-technical error in the one of the smart meter readings.
- Technical power losses are cable impedance losses and reactance losses; the successive power readings are corrected to account for technical power losses; and the non-technical error detected is at least one of no error, check meter in error, smart meter in error, cable tapping, and cyberattack.
- the control center circuitry further comprises a check meter configuration module 339 to determine the different combinations of the N power cables; wherein the different combinations of the N power cables are formed based on a redundant matrix in a generator matrix of a linear systematic block code, the redundant matrix comprising at least one row and at least one column; wherein each of the different combinations of the N power cables corresponds to a column of the redundant matrix, each element in the column corresponding to one of the N power cables in the different combination.
- Each of the different combinations of cables includes cables corresponding to non-zero elements in the column of the redundant matrix.
- the power cable configuration is communicated to utility company personnel (not shown) to connect the check meters in the power cable configurations.
- the control center circuitry includes a communications unit 333 for receiving each of the successive power readings at different time periods; a technical power loss control module 335 a configured to determine the impedance and reactance losses of each of the combinations of power cables.
- FIG. 4 shows that a check meter 5 measures power ⁇ circumflex over (x) ⁇ p5 on the combination of power lines 442 , 444 , 446 .
- the technical power loss control module modifies each of the successive power readings by adding the impedance losses and reactance losses of the check meters to the successive power readings.
- a decoding module 335 b then decodes each of the modified successive power readings by multiplying by a decoding matrix to form a syndrome vector, wherein the decoding matrix is formed by modifying a parity-check matrix of the linear systematic block code, and wherein modifying the parity-check matrix includes multiplying elements of an identity matrix in the parity-check matrix with ⁇ 1.
- An analysis module 336 has circuitry including program instructions configured to detect the at least one error in the smart meter readings by comparing the syndrome vector with rows in the decoding matrix to determine a position and a value of the at least one error.
- An error correction module 337 is configured to correct the at least one error in the smart meter readings by adding the at least one error value to the smart meter reading and transmit the corrected readings to a customer records module 338 , which receives the corrected errors in the smart meter readings and updates the records of a registered customer.
- the technical power loss module 335 a is configured to determine the impedance and reactance losses of each of the combinations of power cables.
- the impedance power loss is determined by computing a sum of the power readings from each combination of power cables with a first equation representing the impedance power loss, P(R) i loss , of a power cable i, where i is an integer value greater than 1 and less than or equal to N, wherein power loss, P(R) i loss equals R i I i 2 , wherein the resistance R i of each power cable i is an unknown and I is the RMS current measured by the smart meter for each power cable i, to form a second equation; summing the second equations for each combination of power cables i to form a third equation; solving for the unknown resistances R i of each cable by applying each of the successive power readings to the third equation, where the number of successive power readings is 2 M ⁇ M ⁇ 1, and generating a set of known resistances Ri; calculating the impedance power loss
- the reactive power loss is determined by summing the power readings from each combination of power cables with a fourth equation representing the reactive power loss, P(X) i loss , of a cable i, where the reactive power loss, P(X) i loss equals X i I i 2 , wherein the reactance X i of each power cable i is an unknown, to form a fifth equation; summing the fifth equations for each combination of power cables to form a sixth equation; solving for the unknown reactances X i of each cable by applying each of the successive power readings to the sixth equation, and generating a set of known reactances Xi and calculating the reactive power loss i for each power cable i by applying the known impedance Xi to the power loss equation X i I i 2 .
- the analysis module 336 further includes circuitry configured to detect that the non-technical error is at least one of no error, check meter in error, smart meter in error, cable tapping, and cyberattack. The procedures for detecting each of the non-technical errors is presented below.
- the detection of no error comprises determining that the impedance and reactance losses equal zero and determining that the syndrome vector comprises all zeros.
- the detection that a check meter is in error comprises determining that the impedance and reactance losses are greater than zero; and comparing the syndrome vector with rows in the decoding matrix to determine a position and a value of the at least one error of the check meter.
- the detection that a smart meter i is in error comprises determining that the impedance and reactance power losses are greater than zero; modifying each successive power reading from smart meter i by adding the detected impedance losses and reactance losses to the received smart meter power readings to form a modified power vector; decoding each modified smart meter power reading from smart meter i to form a modified syndrome vector; adding the terms of the modified syndrome vector to form a modified error vector; subtracting the modified error vector from modified power vector; calculating a corrected RMS current value by dividing the square root of the sum of the squared reactance and the squared impedance by an RMS voltage measured by the smart meter i; calculating an actual active power value for smart meter i by subtracting the product of the square of the corrected RMS current by the resistance value of power cable i from the received smart meter power reading for power cable i; and calculating an actual reactive power value for smart meter i by subtracting the product of the square of the corrected RMS current by the resistance value of power cable i
- the detection of cable tapping on a smart meter i includes receiving power readings from smart meter i and determining that the impedance and reactance losses are greater than zero. Next, smart meter i is inspected to determine whether the smart meter is malfunctioning.
- the determination is made as to whether the smart meter is located at the premises of a registered customer or an unregistered consumer.
- the syndrome vector is compared with rows in the decoding matrix to determine a position and a value of the at least one error of the smart meter i; and the registered customer is notified of the detecting of the cable tapping.
- detection is determined by calculating the sum of the syndrome vectors of the N smart meters, the M check meters and a cable tapping vector formed from the power values of the impedances losses for each smart meter and each check meter, wherein the cable tapping vector for smart meter i includes non-zero terms related to the non-technical power loss at smart meter i, wherein the non-zero terms indicate the power losses due to cable tapping.
- the utility company is then notified that there is an unregistered consumer at the address associated with smart meter i.
- the detection of a cyber attack comprises physically inspecting, by personnel of the control center, the power cable i and the smart meter i suspected of being subject to a cyber attack. If either the power cable i or the smart meter i is malfunctioning, replacing the malfunctioning power cable i or smart meter i. If the power cable i and the smart meter i are not malfunctioning, comparing the successive power readings received at the control center with successive power readings transmitted by the smart meter i to determine whether the transmitted and received successive power readings match. If the transmitted and received successive power readings do not match, identifying a cyberattack on the communication channel between smart meter i and the control center. If the transmitted and received successive power readings match, identifying a cyberattack in the customer record related to smart meter i and notifying the utility company.
- FIG. 3A A second embodiment of the present invention is described with respect to FIG. 3A , FIG. 3B and FIG. 4 .
- the second embodiment describes a method for detecting and correcting technical and non-technical power losses in a smart grid, comprising: providing a smart grid including a power distribution bus line 447 which provides power to a power distribution node, N power cables ( 442 , 444 , 446 , 448 ), each having a first power cable end and a second power cable end, wherein each of the N power cables is connected at the first end to the power distribution node, M check meters 451 each connected near the first end to a different combination of the N power cables, where M is an integer greater than 1 and less than or equal to M max and N is an integer greater than 1 and less than 2 M ⁇ M ⁇ 1, N smart meters and N active loads, wherein each smart meter is connected by a first smart meter connector to the first power cable end of one of the N power cables and by a second smart meter connector to one of the M active loads.
- Control center circuitry having program instructions for correcting technical and non-technical errors in smart meter and check meter readings is
- the method includes determining, by a check meter configuration module 339 of the control center circuitry 432 , the different combination of power cables for each check meter.
- the method continues by receiving, by a communications module 333 of the control center circuitry, successive power readings from each of the N smart meters and each different combination of the M check meters at different time periods, wherein the number of successive power readings is 2 M ⁇ M ⁇ 1, and correcting, by a technical power loss correction module 335 a of the control center circuitry, impedance losses and reactance losses in each of the successive power readings.
- the received readings and the corrected readings are transmitted to the analysis module 336 , where the method continues by detecting at least one non-technical error in any one of the corrected successive power readings and correcting, by an error correction module 337 of the control center circuitry, the at least one non-technical error in the one of the smart meter readings.
- Correcting the impedance and reactance losses of each of the combinations of check meters by a technical power loss correction module of the control center circuitry comprises modifying each of the successive power readings by adding the impedance losses and reactance losses of the check meters to the successive power readings; decoding, by a decoding module of the control center circuitry, each of the modified successive power readings by multiplying by a decoding matrix to form a syndrome vector, wherein the decoding matrix is formed by modifying a parity-check matrix of the linear systematic block code, and wherein modifying the parity-check matrix includes multiplying elements of an identity matrix in the parity-check matrix with ⁇ 1; analyzing, by the analysis module configured to detect the at least one error in the smart meter readings, by comparing the syndrome vector with rows in the decoding matrix to determine a position and a value of the at least one error.
- the method continues by the error correction module 337 correcting the at least one error in the smart meter readings, by adding the at least
- the method further comprising calculating the impedance power loss by summing the power readings from each combination of power cables with a first equation representing the impedance power loss, P(R) i loss , of a power cable i, where i is an integer value greater than 1 and less than or equal to N, wherein the power loss, P(R) i loss equals R i I i 2 , wherein the resistance R i of each power cable i is an unknown and I is the RMS current measured by the smart meter for each power cable i, to form a second equation; summing the second equations for each combination of power cables i to form a third equation; solving for the unknown resistances R i of each cable by applying each of the successive power readings to the third equation, where the number of successive power readings is 2M ⁇ M ⁇ 1, and generating a set of known resistances Ri; calculating the impedance power loss i for each power cable i by applying the known resistance Ri to the power loss equation R i I i 2
- the non-technical error is at least one of no error, check meter in error, smart meter in error, cable tapping, and cyberattack. Detecting the non-technical errors is now described for each of the types of error.
- the method continues of detecting cable tapping by determining whether the smart meter is located at the premises of a registered customer or an unregistered consumer when smart meter i is not malfunctioning; determining that the impedance and reactance losses are greater than zero if smart meter i is located at the premises of a registered customer; comparing the syndrome vector with rows in the decoding matrix to determine a position and a value of the at least one error of the smart meter i; and notifying the registered customer of the detecting of the cable tapping.
- the smart meter If the smart meter is located at the premises of an unregistered consumer, summing the syndrome vector of smart meter i with the power due to the impedance losses on the power line connected to smart meter i detecting cable tapping by the unregistered consumer by summing the syndrome vectors of the N smart meters and the M check meters to a cable tapping vector formed from the power values of the impedances losses for each smart meter and each check meter, wherein the cable tapping vector for smart meter i includes non-zero terms related to the non-technical power loss at smart meter i, wherein the non-zero terms indicate the power losses due to cable tapping; and notifying the utility company that an unregistered consumer is cable tapping at the address associated with smart meter i.
- the third embodiment of the invention is described with respect to FIG. 3A , FIG. 3B and FIG. 4 .
- the third embodiment describes a non-transitory computer readable medium having instructions stored therein that, when executed by one or more processors, causes the one or more processors to perform for detecting and correcting technical and non-technical power losses in a smart grid, comprising: providing a smart grid including a power distribution bus line 447 which provides power to a power distribution node, N power cables ( 442 , 444 , 446 , 448 ), each having a first power cable end and a second power cable end, wherein each of the N power cables is connected at the first end to the power distribution node, M check meters 451 each connected near the first end to a different combination of the N power cables, where M is an integer greater than 1 and less than or equal to M max and N is an integer greater than 1 and less than 2 M ⁇ M ⁇ 1, N smart meters and N active loads, wherein each smart meter is connected by a first smart meter
- the non-transitory computer readable medium instructions include determining, by a check meter configuration module 339 of the control center circuitry 432 , the different combination of power cables for each check meter. The determining continues by receiving, by a communications module 333 of the control center circuitry, successive power readings from each of the N smart meters and each different combination of the M check meters at different time periods, wherein the number of successive power readings is 2 M ⁇ M ⁇ 1, and correcting, by a technical power loss correction module 335 a of the control center circuitry, impedance losses and reactance losses in each of the successive power readings.
- the received readings and the corrected readings are transmitted to the analysis module 336 , where the determining continues by detecting at least one non-technical error in any one of the corrected successive power readings and correcting, by an error correction module 337 of the control center circuitry, the at least one non-technical error in the one of the smart meter readings.
- Correcting the impedance and reactance losses of each of the combinations of check meters by a technical power loss correction module of the control center circuitry comprises modifying each of the successive power readings by adding the impedance losses and reactance losses of the check meters to the successive power readings; decoding, by a decoding module of the control center circuitry, each of the modified successive power readings by multiplying by a decoding matrix to form a syndrome vector, wherein the decoding matrix is formed by modifying a parity-check matrix of the linear systematic block code, and wherein modifying the parity-check matrix includes multiplying elements of an identity matrix in the parity-check matrix with ⁇ 1; analyzing, by the analysis module configured to detect the at least one error in the smart meter readings, by comparing the syndrome vector with rows in the decoding matrix to determine a position and a value of the at least one error.
- the correcting continues by the error correction module 337 correcting the at least one error in the smart meter readings, by adding the at least one error value to the smart meter reading; and transmitting these corrected readings to a customer records module which updates the records of a registered customer.
- the non-transitory computer readable medium instructions further include calculating the impedance power loss by summing the power readings from each combination of power cables with a first equation representing the impedance power loss, P(R) i loss , of a power cable i, where i is an integer value greater than 1 and less than or equal to N, wherein the power loss, P(R) i loss equals R i I i 2 , wherein the resistance R i of each power cable i is an unknown and I is the RMS current measured by the smart meter for each power cable i, to form a second equation; summing the second equations for each combination of power cables i to form a third equation; solving for the unknown resistances R i of each cable by applying each of the successive power readings to the third equation, where the number of successive power readings is 2 M ⁇ M ⁇ 1, and generating a set of known resistances Ri; calculating the impedance power loss i for each power cable i by applying the known resistance Ri to the power
- the non-technical error is at least one of no error, check meter in error, smart meter in error, cable tapping, and cyberattack. Detecting the non-technical errors is now described for each of the types of error.
- the detecting of cable tapping continues by determining whether the smart meter is located at the premises of a registered customer or an unregistered consumer when smart meter i is not malfunctioning; determining that the impedance and reactance losses are greater than zero if smart meter i is located at the premises of a registered customer; comparing the syndrome vector with rows in the decoding matrix to determine a position and a value of the at least one error of the smart meter i; and notifying the registered customer of the detecting of the cable tapping.
- the smart meter If the smart meter is located at the premises of an unregistered consumer, summing the syndrome vector of smart meter i with the power due to the impedance losses on the power line connected to smart meter i detecting cable tapping by the unregistered consumer by summing the syndrome vectors of the N smart meters and the M check meters to a cable tapping vector formed from the power values of the impedances losses for each smart meter and each check meter, wherein the cable tapping vector for smart meter i includes non-zero terms related to the non-technical power loss at smart meter i, wherein the non-zero terms indicate the power losses due to cable tapping; and notifying the utility company that an unregistered consumer is cable tapping at the address associated with smart meter i.
- the present invention is described with respect to a four power cable, three check meter, four smart meter configuration example to determine the power losses in each cable ( 442 , 444 , 446 , 448 ), which requires an accurate identification of the cable impedance.
- the cable impedances of the distribution secondary cables are not readily available to the utility company.
- P i losses R i I i 2 , (11) where R i is the resistance of cable i, and I i is the actual RMS current flowing in cable i.
- Equation (12) includes four unknowns equation (i.e. R 1 , R 2 , R 3 , and R 4 ) that are assumed to be fixed on the short term regardless of the operating point.
- the power and current quantities in equation (12) are continuously changing due to load variations.
- Equation (13) at four different time instants (i.e. t 1 , t 2 , t 3 , and t 4 ) will generate four independent equations with four unknowns. This solves the issue of the undetermined system of equations.
- measurements at 2 M ⁇ M ⁇ 1 different time instants are required to solve for R 1 , R 2 , . . . R 2 M ⁇ M ⁇ 1 .
- This proposed impedance calculation can be updated regularly to account for cable aging, among other factors.
- the present invention describes the identification of five possible scenarios: no meter in error, a check meter in error, a smart meter in error, cable tapping, and cyber attacks.
- a modified algorithm for each type is explained below.
- the syndrome vector will result in a vector that has a form similar to one of the rows of the decoding matrix multiplied by a scalar that is equal to the magnitude of the error. For example, assuming errors in the measurements of check meter 6, the syndrome vector will be:
- equation (24) and equation (27) do not depend on the RMS voltage nor the RMS current measured by the check meters. Therefore, this method can be used for any combination of errors in one of the check meter measurements equation (i.e. error in active power measurement, error in reactive power measurement, error in RMS current measurement, error in RMS voltage measurement, or any combination of these errors).
- the syndrome vector will result in a vector that has a form similar to one of the rows of the decoding matrix corresponding to the meter in error, multiplied by a scaler equal to the magnitude of error, in addition to other nonlinear terms.
- the active power syndrome vector will be:
- the syndrome vector includes the error in active and reactive power measurements equation (i.e., e x p3 , and e x q3 ), but it also includes additional terms that will affect the corrected values.
- the additional terms indicate the syndrome vector cannot be directly used to correct the erroneous measurements of the smart meter.
- x p sd3 is the actual active power at the sending end equation (utility side)
- x q sd3 is the actual reactive power at the sending end.
- control center can calculate the correct RMS current I 3 as:
- V sd rms is the RMS voltage at the sending end measured by any check meter.
- the method of the invention is capable of compensating for any potential error in the RMS current reading, power reading, or both, of the defective smart meter.
- equation (31) and equation (32) do not depend on the voltages measured by the smart meters. Therefore, this method can be used for any combination of errors in one of the smart meters measurements (i.e. error in active power measurement, error in reactive power measurement, error in RMS current measurement, error in RMS voltage measurement, or any combination of these errors).
- this method can be used to estimate any other type of non-technical losses caused by registered consumers, such as tapping current from the metering unit.
- D. Cable Tapping In case of a non-zero syndrome vector, the utility company will suspect a tampered/malfunctioning smart meter. However, if after inspection, the service provider finds that the suspected smart meter is not in error, then this indicates that the mismatch is due to other sources of NTL, such as cable tapping. In this case, further inspection will be required to determine whether the cable tapping is caused by the registered consumer or an unregistered consumer. If the cable tapping was caused by a registered consumer, then the method for correcting the measurements of an erroneous meter will be used as shown in equation 31. If this is not the case, the cable tapping is caused by an unregistered consumer. In this case, by using the readings of the smart and check meters stored in the database, the syndrome vector will be given by:
- e NTL p3 and e NTL q3 include the direct and indirect non-technical losses related to the tapping, that is, the value e NTL p3 (e NTL q3 ) represents the sum of the active equation (reactive) power tapped and the active equation (reactive) power technical losses caused by that tapping.
- E. Cyber Attack In the situation where the utility company has inspected the meter and the related service cable and found that neither is the source of the mismatch detected by the syndrome vector, then the source of error must be a cyberattack.
- the cyberattack can be either on the data during transmission or after transmission. If the utility company finds that the data received at the control center does not match the data sent by the smart meter, then the attack is on the communication channel. Otherwise, the attack is on the stored data in the information system. In both scenarios, the correct readings can be restored using equation 31.
- Results are shown for the exemplary system of FIG. 4 having four smart meters and three check meters.
- Four 1/0 AWG cables are considered in the simulations with the following lengths: 80, 100, 150, and 200 meters.
- the cables properties are shown in Table I.
- the shunt capacitance of the low voltage distribution secondary cables can be ignored because of their relatively short length and low operating voltage.
- the proposed solutions are examined for four cases; an error in a check meter, an error in a smart meter, cable tapping, and a cyberattack.
- the load profiles used in the simulation are based on actual house active power load data having a resolution of one measurement per minute, which represent the average power consumption during that minute. Therefore, the active power is assumed to be constant within each minute. Due to unavailability of actual reactive power data, random values of reactive power are assumed to represent the reactive power consumption of the house.
- the sending end bus voltage is assumed to be varying continuously, and the receiving end voltages are calculated accordingly.
- the cable impedances can be calculated when all meters are measuring correct values, and then can be used as a reference when calculating the power losses.
- Cables resistances and reactances are calculated by evaluating equation (13) and equation (14) at four different time instants when no meter is in error.
- the actual and calculated values of resistance and reactance of each cable are shown in Table II. It is shown that the method accurately calculates the values of the resistances and the reactances of all the cables.
- Equation 24 Those calculated values are used as shown by equation 24 for detecting and correcting an erroneous check meter, by equation 31 for detecting and correcting an erroneous smart meter, and by equation 42 for detecting and correcting an error due to tapping one of the service cables.
- a simulation for verifying the method was conducted for detecting and correcting tampering/malfunctioning of a check meter. Random errors were generated in the active and reactive power measurements of check meter number 7 . The measured power consumption deviated from the actual consumption, as shown in FIG. 5A and FIG. 5B .
- the syndrome vector elements are obtained and plotted in FIG. 5A , where it can be seen that the third element of the syndrome vector, i.e. s 2 , represents the error between the measured and actual consumptions.
- the active power consumption can be accurately corrected using equation (25). It can be seen from FIG. 3 that the corrected active power consumption is identical to the actual active power consumption. Similarly, FIG. 4 shows that the reactive power consumption can be corrected by using the same procedure.
- a simulation for verifying the method was conducted for detecting and correcting tampering/malfunctioning of a smart meter. Random errors were generated in active and reactive power measurements of smart meter number 4 . The measured power consumption deviated from the actual consumption as shown in FIG. 6A .
- the active syndrome vectors are obtained and plotted in FIG. 6A .
- all the three elements of each of the syndrome vectors are identical, as shown in FIG. 6A .
- the syndrome vector in this case does not equal the error between the measured consumption and the actual consumption as can be noticed from equation (31). Therefore, applying equation (36), the corrected power consumption profile is obtained with zero mismatch, as shown in FIG. 6A . Note that the reactive power plots are not shown.
- the tapped power consumption and its associated technical losses can be calculated by applying equation (43) and equation (44) on the measurements received from all meters, and are plotted in FIG. 6B . It can be seen from this figure that the calculated tapped power consumption is identical to the sum of the actual tapped power and its associated technical losses. The reactive power plots are not shown in FIG. 6B .
- an algorithm is described to remotely characterize and update the cables impedances in distribution secondaries using smart meter measurements. Furthermore, an improved NTL detection and correction algorithm was described.
- the algorithms presented in this work can detect and correct any type of attack on smart meters and/or any type of malfunctioning in the metering unit that affects the measurements of power consumption.
- the attack can be physical, such as connecting a jumper between the same phase terminals of a smart meter to force some current to bypass the current transformer (CT), connecting some loads directly to the incoming cable before going to the meter, or changing the CT of the meter with one having higher turns ratio.
- CT current transformer
- it can detect any type of cyber-attack on the meter and/or its data that is aiming to tamper with power measurements of smart meters, such as changing the firmware of a smart meter locally or remotely, or attacking the data during data transmission.
- the controller described is representative of the smart meter controller, a check meter controller or a control center controller 752 in which the controller is a computing device which includes a CPU 700 which performs the processes described above/below.
- the process data and instructions may be stored in memory 702 .
- These processes and instructions may also be stored on a storage medium disk 704 such as a hard drive (HDD) or portable storage medium or may be stored remotely.
- HDD hard drive
- the claimed advancements are not limited by the form of the computer-readable media on which the instructions of the inventive process are stored.
- the instructions may be stored on CDs, DVDs, in FLASH memory, RAM, ROM, PROM, EPROM, EEPROM, hard disk or any other information processing device with which the computing device communicates, such as a server or computer.
- claimed advancements may be provided as a utility application, background daemon, or component of an operating system, or combination thereof, executing in conjunction with CPU 700 and an operating system such as Microsoft Windows 7, UNI7, Solaris, LINU7, Apple MAC-OS and other systems known to those skilled in the art.
- an operating system such as Microsoft Windows 7, UNI7, Solaris, LINU7, Apple MAC-OS and other systems known to those skilled in the art.
- CPU 700 may be a Xenon or Core processor from Intel of America or an Opteron processor from AMD of America, or may be other processor types that would be recognized by one of ordinary skill in the art.
- the CPU 700 may be implemented on an FPGA, ASIC, PLD or using discrete logic circuits, as one of ordinary skill in the art would recognize.
- CPU 700 may be implemented as multiple processors cooperatively working in parallel to perform the instructions of the inventive processes described above.
- the computing device in FIG. 7 also includes a network controller 706 , such as an Intel Ethernet PRO network interface card from Intel Corporation of America, for interfacing with network 77 .
- the network 77 can be a public network, such as the Internet, or a private network such as an LAN or WAN network, or any combination thereof and can also include PSTN or ISDN sub-networks.
- the network 77 can also be wired, such as an Ethernet network, or can be wireless such as a cellular network including EDGE, 3G and 4G wireless cellular systems.
- the wireless network can also be WiFi, Bluetooth, or any other wireless form of communication that is known.
- the computing device further includes a display controller 708 , such as a NVIDIA GeForce GT7 or Quadro graphics adaptor from NVIDIA Corporation of America for interfacing with display 710 , such as a Hewlett Packard HPL2445w LCD monitor.
- a general purpose I/O interface 712 interfaces with a keyboard and/or mouse 714 as well as a touch screen panel 716 on or separate from display 710 .
- General purpose I/O interface also connects to a variety of peripherals 718 including printers and scanners, such as an OfficeJet or DeskJet from Hewlett Packard.
- a sound controller 720 is also provided in the computing device such as Sound Blaster 7 -Fi Titanium from Creative, to interface with speakers/microphone 722 thereby providing sounds and/or music.
- the general purpose storage controller 724 connects the storage medium disk 704 with communication bus 726 , which may be an ISA, EISA, VESA, PCI, or similar, for interconnecting all of the components of the computing device.
- communication bus 726 may be an ISA, EISA, VESA, PCI, or similar, for interconnecting all of the components of the computing device.
- a description of the general features and functionality of the display 710 , keyboard and/or mouse 714 , as well as the display controller 708 , storage controller 724 , network controller 706 , sound controller 720 , and general purpose I/O interface 712 is omitted herein for brevity as these features are known.
- circuitry configured to perform features described herein may be implemented in multiple circuit units (e.g., chips), or the features may be combined in circuitry on a single chipset, as shown on FIG. 8 .
- FIG. 8 shows a schematic diagram of a data processing system, according to certain embodiments, for performing the functions of the exemplary embodiments.
- the data processing system is an example of a computer in which code or instructions implementing the processes of the illustrative embodiments may be located.
- data processing system 800 employs a hub architecture including a north bridge and memory controller hub (NB/MCH) 825 and a south bridge and input/output (I/O) controller hub (SB/ICH) 820 .
- the central processing unit (CPU) 830 is connected to NB/MCH 825 .
- the NB/MCH 825 also connects to the memory 845 via a memory bus, and connects to the graphics processor 850 via an accelerated graphics port (AGP).
- AGP accelerated graphics port
- the NB/MCH 825 also connects to the SB/ICH 820 via an internal bus (e.g., a unified media interface or a direct media interface).
- the CPU Processing unit 830 may contain one or more processors and even may be implemented using one or more heterogeneous processor systems.
- FIG. 9 shows one implementation of CPU 830 .
- the instruction register 938 retrieves instructions from the fast memory 940 . At least part of these instructions are fetched from the instruction register 938 by the control logic 936 and interpreted according to the instruction set architecture of the CPU 830 . Part of the instructions can also be directed to the register 932 .
- the instructions are decoded according to a hardwired method, and in another implementation the instructions are decoded according a microprogram that translates instructions into sets of CPU configuration signals that are applied sequentially over multiple clock pulses.
- the instructions are executed using the arithmetic logic unit (ALU) 934 that loads values from the register 932 and performs logical and mathematical operations on the loaded values according to the instructions.
- the results from these operations can be feedback into the register and/or stored in the fast memory 940 .
- the instruction set architecture of the CPU 830 can use a reduced instruction set architecture, a complex instruction set architecture, a vector processor architecture, a very large instruction word architecture.
- the CPU 830 can be based on the Von Neuman model or the Harvard model.
- the CPU 830 can be a digital signal processor, an FPGA, an ASIC, a PLA, a PLD, or a CPLD.
- the CPU 830 can be an x86 processor by Intel or by AMD; an ARM processor, a Power architecture processor by, e.g., IBM; a SPARC architecture processor by Sun Microsystems or by Oracle; or other known CPU architecture.
- the data processing system 800 can include that the SB/ICH 820 is coupled through a system bus to an I/O Bus, a read only memory (ROM) 856 , universal serial bus (USB) port 864 , a flash binary input/output system (BIOS) 868 , and a graphics controller 858 .
- PCI/PCIe devices can also be coupled to SB/ICH 888 through a PCI bus 862 .
- the PCI devices may include, for example, Ethernet adapters, add-in cards, and PC cards for notebook computers.
- the Hard disk drive 860 and CD-ROM 866 can use, for example, an integrated drive electronics (IDE) or serial advanced technology attachment (SATA) interface.
- the I/O bus can include a super I/O (SIO) device.
- the hard disk drive (HDD) 860 and optical drive 866 can also be coupled to the SB/ICH 820 through a system bus.
- a keyboard 870 , a mouse 872 , a parallel port 878 , and a serial port 876 can be connected to the system bus through the I/O bus.
- Other peripherals and devices that can be connected to the SB/ICH 820 using a mass storage controller such as SATA or PATA, an Ethernet port, an ISA bus, a LPC bridge, SMBus, a DMA controller, and an Audio Codec.
- circuitry described herein may be adapted based on changes on battery sizing and chemistry, or based on the requirements of the intended back-up load to be powered.
- the functions and features described herein may also be executed by various distributed components of a system.
- one or more processors may execute these system functions, wherein the processors are distributed across multiple components communicating in a network.
- the distributed components may include one or more client and server machines, which may share processing, as shown on FIG. 10 , in addition to various human interface and communication devices (e.g., display monitors, smart phones, tablets, personal digital assistants (PDAs)).
- the network may be a private network, such as a LAN or WAN, or may be a public network, such as the Internet. Input to the system may be received via direct user input and received remotely either in real-time or as a batch process. Additionally, some implementations may be performed on modules or hardware not identical to those described. Accordingly, other implementations are within the scope that may be claimed.
Landscapes
- Engineering & Computer Science (AREA)
- Physics & Mathematics (AREA)
- Computer Security & Cryptography (AREA)
- Theoretical Computer Science (AREA)
- Business, Economics & Management (AREA)
- General Physics & Mathematics (AREA)
- Probability & Statistics with Applications (AREA)
- Economics (AREA)
- Signal Processing (AREA)
- Computer Networks & Wireless Communication (AREA)
- General Engineering & Computer Science (AREA)
- Computing Systems (AREA)
- Computer Hardware Design (AREA)
- Health & Medical Sciences (AREA)
- Power Engineering (AREA)
- Human Resources & Organizations (AREA)
- Water Supply & Treatment (AREA)
- General Health & Medical Sciences (AREA)
- Public Health (AREA)
- Marketing (AREA)
- Primary Health Care (AREA)
- Strategic Management (AREA)
- Tourism & Hospitality (AREA)
- General Business, Economics & Management (AREA)
- Algebra (AREA)
- Mathematical Physics (AREA)
- Pure & Applied Mathematics (AREA)
- Remote Monitoring And Control Of Power-Distribution Networks (AREA)
Abstract
Description
where I4×4 is the identity matrix of size 4, and H4×3 is a matrix of size 4×3. Each information block generated from a source includes four information bits which can be represented as a vector u=[u1 u2 u3 u3], and each code word to be transmitted from the source to a destination includes seven bits which can be represented as a vector v=[v1 v2 v3 v4 v5 v6 v7]. Accordingly, a code word can be generated using the following expression corresponding to an information block, v=u·G.
{circumflex over (x)} p=[{circumflex over (x)} p1 {circumflex over (x)} p2 {circumflex over (x)} p3 {circumflex over (x)} p4 {circumflex over (x)} p5 {circumflex over (x)} p6 {circumflex over (x)} p7], (1)
where {circumflex over (x)}pi is the active power measured by meter i.
x p=[x p1 x p2 x p3 x p4 x p5 x p6 x p7], (2)
where xp is the correct active power which is supposed to be measured by meter i. When the readings of all meters are correct, then {circumflex over (x)}p=xp. When some meters are in error, {circumflex over (x)}p=xp+e, where e is an error vector.
s p ={circumflex over (x)} p ·D=[s p1 s p2 s p3], (5)
{circumflex over (x)} p
where, in this case, {circumflex over (x)}p
x p5 =x p1 +x p2 +x p4 +P 1
x p6 =x p1 +x p3 +x p4 +P 1
x p7 =x p2 +x p3 +x p4 +P 2
where Pi
x p5 +x p6 +x p7−2x p1−2x p2−2x p3−3x p4=2P 1
P i
where Ri is the resistance of cable i, and Ii is the actual RMS current flowing in cable i.
x p5 +x p6 +x p7−2x p1−2x p2−2x p3−3x p4=2R 1 I 1 2+2R 2 I 2 2+2R 3 I 3 2+3R 4 I 4 2. (12)
x p5(t)+x p6(t)+x p7(t)−2x p1(t)−2x p2(t)−2x p3(t)−3x p4(t)=2R 1 I 1 2(t)+2R 2 I 2 2(t)+2R 3 I 3 2(t)+3R 4 I 4 2(t). (13)
where xpt (t) is the correct active power measured by meter i at time t, and Ii(t) is the correct RMS current measured by meter i at time t.
x q5(t)+x q6(t)+x q7(t)−2x q1(t)−2x q2(t)−2x q3(t)−3x q4(t)=2X 1 I 1 2(t)+2X 2 I 2 2(t)+2X 3 I 3 2(t)+3X 4 I 4 2(t), (14)
where xqi is the correct reactive power measured by meter i, xqi (t) is the reactive power measured by meter i at time t, and Xi is the series reactance of cable i.
{tilde over (s)} p=({circumflex over (x)} p +{circumflex over (P)} L)·D={circumflex over (x)} p ·D+{circumflex over (P)} L ·D, (15)
where
{circumflex over (P)} L=[R 1 Î 1 2 ,R 2 Î 2 2 ,R 3 Î 3 2 ,R 4 Î 4 2,0,0,0], (16)
{tilde over (s)}p is the modified active power syndrome vector, {circumflex over (P)}L is a vector of active power losses calculated based on the current measurements received from smart meters, and D is the decoding matrix shown in equation (6).
{tilde over (s)} q ={circumflex over (x)} q ·D+{circumflex over (Q)} L ·D, (17)
where
{circumflex over (Q)} L=[X 1 Î 1 2 ,X 2 Î 2 2 ,X 3 Î 3 2 ,X 4 Î 4 2,0,0,0], (18)
{tilde over (s)}q is the modified reactive power syndrome vector, and {circumflex over (Q)}L is the vector of reactive power losses calculated based on the current measurements received from the smart meters.
{circumflex over (x)} p =x p, and {circumflex over (x)} q =x q, (19)
and,
{circumflex over (P)} L =P L, and {circumflex over (Q)} L =Q L, (20)
where xp and xq are vectors of actual equation (correct) powers which are supposed to be measured by all meters, and, PL and QL are vectors of active and reactive power losses calculated based on the actual equation (correct) RMS current measurements received from the smart meters. Hence, from equation (9), equation (11) and equation (15), the active power syndrome vector will return zeros, as shown in equation (21).
{tilde over (s)} q =x q ·D+Q L ·D=[0 0 0]. (22)
{circumflex over (x)} p ≠x p, and {circumflex over (x)} p ≠x q. (23)
{circumflex over (x)} p
where
e x
ex
{tilde over (s)} q ={circumflex over (x)} q ·D+Q L ·D=[0−e x
{circumflex over (x)} q
e x
where ex
{circumflex over (P)} L ≠P L, and {circumflex over (Q)} L ≠Q L. (30)
where ex
where ex
x p
and
x q
where Vsd
x p3 =x p
and
x q3 =x q
Now, the magnitude of error can be calculated as:
e x
and the error vector of active power will be:
e x
Similarly, the reactive power error can be calculated as:
e x
and the error vector of reactive power will be:
e x
where the check meter readings xp5, xp6, and xp7 will include an additional term eNTL
{tilde over (s)} p ={circumflex over (x)} p ·D+P L ·D=[0−e NTL
{tilde over (s)} q ={circumflex over (x)} q ·D+Q L ·D=[0−e NTL
where eNTL
| TABLE I |
| PROPERTIES OF CABLES USED IN SIMULATION |
| Measure | Value | ||
| AWG | 1/0 | ||
| Stranding | 19 | ||
| Insulation Type | XLPE | ||
| Ampacity in Duct (A) | 140 | ||
| Operating Voltage (V) | 230 | ||
| Operating Temperature (° C.) | 50 | ||
| AC Resistance (mΩ/m) | 0.3821 | ||
| Series Reactance (mΩ/m) | 0.1605 | ||
| TABLE II |
| IDENTIFIED VALUES OF CABLE IMPEDANCE |
| Measure | Actual | Identified | |
| Resistance | R1 (Ω) | 0.030568 | 0.030568 | |
| R2 (Ω) | 0.038210 | 0.038210 | ||
| R3 (Ω) | 0.057315 | 0.057315 | ||
| R4 (Ω) | 0.076420 | 0.076420 | ||
| Reactance | X1 (Ω) | 0.012840 | 0.012840 | |
| X2 (Ω) | 0.016050 | 0.016050 | ||
| X3 (Ω) | 0.024075 | 0.024075 | ||
| X4 (Ω) | 0.032100 | 0.032100 | ||
Claims (20)
Priority Applications (1)
| Application Number | Priority Date | Filing Date | Title |
|---|---|---|---|
| US16/219,384 US10859622B2 (en) | 2018-12-13 | 2018-12-13 | Accurate detection and correction of technical and non-technical losses using smart metering |
Applications Claiming Priority (1)
| Application Number | Priority Date | Filing Date | Title |
|---|---|---|---|
| US16/219,384 US10859622B2 (en) | 2018-12-13 | 2018-12-13 | Accurate detection and correction of technical and non-technical losses using smart metering |
Publications (2)
| Publication Number | Publication Date |
|---|---|
| US20200191854A1 US20200191854A1 (en) | 2020-06-18 |
| US10859622B2 true US10859622B2 (en) | 2020-12-08 |
Family
ID=71073571
Family Applications (1)
| Application Number | Title | Priority Date | Filing Date |
|---|---|---|---|
| US16/219,384 Expired - Fee Related US10859622B2 (en) | 2018-12-13 | 2018-12-13 | Accurate detection and correction of technical and non-technical losses using smart metering |
Country Status (1)
| Country | Link |
|---|---|
| US (1) | US10859622B2 (en) |
Families Citing this family (6)
| Publication number | Priority date | Publication date | Assignee | Title |
|---|---|---|---|---|
| CN112464550A (en) * | 2020-08-31 | 2021-03-09 | 天津大学 | Intelligent ammeter error estimation method based on dimension reduction estimation and damped least square method |
| CN112698261A (en) * | 2020-11-25 | 2021-04-23 | 国网湖南省电力有限公司 | Fault early warning method and device for intelligent electric energy meter |
| CN112418701B (en) * | 2020-12-02 | 2022-10-25 | 广东电网有限责任公司广州供电局 | Power distribution network line equivalent resistance calculation method and device, terminal and storage medium |
| CN112558000A (en) * | 2020-12-05 | 2021-03-26 | 青岛鼎信通讯股份有限公司 | Correlation screening-based electric energy meter metering error analysis method |
| CN114441892B (en) * | 2021-12-27 | 2024-09-10 | 国网江西省电力有限公司电力科学研究院 | A method for locating distribution transformer with abnormal line loss on 10kV line |
| CN115201744B (en) * | 2022-09-16 | 2023-01-24 | 北京志翔科技股份有限公司 | Method and device for determining metering point error of low-voltage transformer area |
Citations (4)
| Publication number | Priority date | Publication date | Assignee | Title |
|---|---|---|---|---|
| US20150149396A1 (en) * | 2013-11-22 | 2015-05-28 | International Business Machines Corporation | Non-technical loss detection and localization |
| US9747790B1 (en) | 2016-02-12 | 2017-08-29 | King Fahd University Of Petroleum And Minerals | Method, device, and computer-readable medium for correcting at least one error in readings of electricity meters |
| US9945889B2 (en) | 2013-02-19 | 2018-04-17 | Mitsubishi Electric Research Laboratories, Inc. | Method for detecting power theft in a power distribution system |
| US20190137592A1 (en) * | 2016-04-20 | 2019-05-09 | HYDRO-QUéBEC | Online calibration of meters and detection of electrical non-compliances |
-
2018
- 2018-12-13 US US16/219,384 patent/US10859622B2/en not_active Expired - Fee Related
Patent Citations (5)
| Publication number | Priority date | Publication date | Assignee | Title |
|---|---|---|---|---|
| US9945889B2 (en) | 2013-02-19 | 2018-04-17 | Mitsubishi Electric Research Laboratories, Inc. | Method for detecting power theft in a power distribution system |
| US20150149396A1 (en) * | 2013-11-22 | 2015-05-28 | International Business Machines Corporation | Non-technical loss detection and localization |
| US9536198B2 (en) | 2013-11-22 | 2017-01-03 | International Business Machines Corporation | Non-technical loss detection and localization |
| US9747790B1 (en) | 2016-02-12 | 2017-08-29 | King Fahd University Of Petroleum And Minerals | Method, device, and computer-readable medium for correcting at least one error in readings of electricity meters |
| US20190137592A1 (en) * | 2016-04-20 | 2019-05-09 | HYDRO-QUéBEC | Online calibration of meters and detection of electrical non-compliances |
Non-Patent Citations (2)
| Title |
|---|
| S. Huang, et al. "Non-Technical Loss Detection Using State Estimation and Analysis of Variance" IEEE Transactions on Power Systems, vol. 28, Issue 3, Aug. 2013, pp. 2959-2966. |
| W. Mesbah, "Securing Smart Electricity Meters Against Customer Attacks" IEEE Transactions on Smart Grid, vol. 9, Issue 1, Jan. 2018, pp. 101-110. |
Also Published As
| Publication number | Publication date |
|---|---|
| US20200191854A1 (en) | 2020-06-18 |
Similar Documents
| Publication | Publication Date | Title |
|---|---|---|
| US10859622B2 (en) | Accurate detection and correction of technical and non-technical losses using smart metering | |
| US9792812B1 (en) | Method for correcting electricity meter readings | |
| CN117664281B (en) | Ultrasonic water meter fault detection and automatic calibration method and system based on Internet of Things | |
| US9536198B2 (en) | Non-technical loss detection and localization | |
| CN114331761A (en) | Equipment parameter analysis and adjustment method and system for special transformer acquisition terminal | |
| CN106803801A (en) | System and method for applying aggregated cable test result data | |
| CN112596018B (en) | High-frequency signal-based power consumer relative position identification device, method and equipment | |
| CN113077359B (en) | Line loss abnormity investigation method, device, equipment and storage medium | |
| CN114235108A (en) | Method and device for detecting abnormal state of gas flowmeter based on data analysis | |
| CN113792256B (en) | Metering performance evaluation method and device for low-voltage current transformer and electronic equipment | |
| Shakil et al. | An empirical evaluation of anomaly detection techniques in smart grid systems using real-time operational data | |
| CN112633692A (en) | Acquisition method and device for electricity stealing checking threshold value, and electricity stealing checking device and method | |
| Prasetyo et al. | Design of Power Monitoring System Based on Internet of Things (IoT) with Calibration Interface | |
| CN118536880A (en) | Singular value decomposition-based ammeter acquisition data quality evaluation method, system and medium | |
| CN116596336A (en) | State assessment method and device for electronic equipment, electronic equipment and storage medium | |
| CN116320824A (en) | An IoT watt-hour meter with a power quality module | |
| CN116359760A (en) | Confidence Calculation Method and Device for Electric Power State Estimation | |
| US20140028466A1 (en) | Method and server for monitoring energy source | |
| CN119760787B (en) | A method, system, and computer device for verifying electrical data. | |
| US20250103905A1 (en) | System and method for detecting abnormality | |
| Moghadam Banaem et al. | A new approach for the simultaneous identification of the location and individual contribution of multiple flicker sources using the least number of monitoring points | |
| US20250086038A1 (en) | Predictive network maintenance | |
| CN117614121A (en) | Power equipment information integration method and device | |
| US20220320869A1 (en) | Data Processing Device and Data Processing Method | |
| Song et al. | A Framework for Risk Modeling of Integrated Electricity and Gas Systems Utilizing Universal Generating Function Techniques |
Legal Events
| Date | Code | Title | Description |
|---|---|---|---|
| AS | Assignment |
Owner name: KING FAHD UNIVERSITY OF PETROLEUM AND MINERALS, SAUDI ARABIA Free format text: ASSIGNMENT OF ASSIGNORS INTEREST;ASSIGNORS:SHAH, ABDULLAH L.;MESBAH, WESSAM A.;AL-AWAMI, ALI T.;REEL/FRAME:047770/0815 Effective date: 20181004 |
|
| FEPP | Fee payment procedure |
Free format text: ENTITY STATUS SET TO UNDISCOUNTED (ORIGINAL EVENT CODE: BIG.); ENTITY STATUS OF PATENT OWNER: SMALL ENTITY |
|
| FEPP | Fee payment procedure |
Free format text: ENTITY STATUS SET TO SMALL (ORIGINAL EVENT CODE: SMAL); ENTITY STATUS OF PATENT OWNER: SMALL ENTITY |
|
| STPP | Information on status: patent application and granting procedure in general |
Free format text: NOTICE OF ALLOWANCE MAILED -- APPLICATION RECEIVED IN OFFICE OF PUBLICATIONS |
|
| STPP | Information on status: patent application and granting procedure in general |
Free format text: PUBLICATIONS -- ISSUE FEE PAYMENT VERIFIED |
|
| STCF | Information on status: patent grant |
Free format text: PATENTED CASE |
|
| FEPP | Fee payment procedure |
Free format text: MAINTENANCE FEE REMINDER MAILED (ORIGINAL EVENT CODE: REM.); ENTITY STATUS OF PATENT OWNER: SMALL ENTITY |
|
| LAPS | Lapse for failure to pay maintenance fees |
Free format text: PATENT EXPIRED FOR FAILURE TO PAY MAINTENANCE FEES (ORIGINAL EVENT CODE: EXP.); ENTITY STATUS OF PATENT OWNER: SMALL ENTITY |
|
| STCH | Information on status: patent discontinuation |
Free format text: PATENT EXPIRED DUE TO NONPAYMENT OF MAINTENANCE FEES UNDER 37 CFR 1.362 |
|
| FP | Lapsed due to failure to pay maintenance fee |
Effective date: 20241208 |