US10859576B2 - Method for diagnosing a brain tumour in a human - Google Patents
Method for diagnosing a brain tumour in a human Download PDFInfo
- Publication number
- US10859576B2 US10859576B2 US15/578,925 US201615578925A US10859576B2 US 10859576 B2 US10859576 B2 US 10859576B2 US 201615578925 A US201615578925 A US 201615578925A US 10859576 B2 US10859576 B2 US 10859576B2
- Authority
- US
- United States
- Prior art keywords
- concentration
- tumour
- metabolites
- subject
- reference standard
- Prior art date
- Legal status (The legal status is an assumption and is not a legal conclusion. Google has not performed a legal analysis and makes no representation as to the accuracy of the status listed.)
- Active, expires
Links
Images


Classifications
-
- G01N33/57407—
-
- G—PHYSICS
- G01—MEASURING; TESTING
- G01N—INVESTIGATING OR ANALYSING MATERIALS BY DETERMINING THEIR CHEMICAL OR PHYSICAL PROPERTIES
- G01N33/00—Investigating or analysing materials by specific methods not covered by groups G01N1/00 - G01N31/00
- G01N33/48—Biological material, e.g. blood, urine; Haemocytometers
- G01N33/50—Chemical analysis of biological material, e.g. blood, urine; Testing involving biospecific ligand binding methods; Immunological testing
- G01N33/53—Immunoassay; Biospecific binding assay; Materials therefor
- G01N33/575—Immunoassay; Biospecific binding assay; Materials therefor for cancer
- G01N33/57557—Immunoassay; Biospecific binding assay; Materials therefor for cancer of other specific parts of the body, e.g. brain
Definitions
- the present invention relates to an in vitro method for diagnosing a brain tumour in a human test subject as well as a data-storage medium comprising data obtained by a method of the invention.
- Metastasis the spread of a tumour from its primary site to a distant location, is a leading cause of cancer mortality and remains a significant hurdle. Approximately 20-40% of cancer patients will develop brain metastases. Lung cancer, breast cancer and melanoma are the most common primary tumours in patients with brain metastasis and between them they account for 67 to 80% of all cases. Critically, brain metastases present a particularly tough clinical challenge owing to the nature of the blood-brain barrier (BBB) which thwarts attempts to diagnose tumours and also inhibits their treatment with most systemically active therapeutic agents.
- BBB blood-brain barrier
- biofluids biological fluids
- 1 H NMR nuclear magnetic resonance
- Spectroscopic analysis of biological fluids has become increasingly common in drug safety assessment as a method for identifying target organ toxicity.
- This approach involves the acquisition of a 1 H NMR spectrum from biofluid samples, e.g. urine or serum, followed by analysis of these data using a multivariate statistical pattern recognition technique.
- This approach is powerful because it requires no a priori knowledge, but rather identifies metabolites solely based on their correlated variation between treatment groups.
- these techniques such as orthogonal partial least squares discriminant analysis (OPLS-DA), are able to identify distinct patterns of metabolites whose variation as a whole is characteristic of the disease, rather than requiring identification of a single unique biomarker.
- OPLS-DA orthogonal partial least squares discriminant analysis
- the present invention meets one or more of the above needs by providing an in vitro method for diagnosing a brain tumour in a human test subject comprising:
- the present invention further provides an in vitro method for differentiating between a primary and a secondary brain tumour in a human test subject comprising:
- the invention also provides a data-storage medium comprising data obtained by a method of the invention.
- the present invention also provides an in vitro method for diagnosing a brain tumour in a human test subject comprising:
- the data set may be a trace obtainable from a spectroscopic method, suitably a trace obtainable from NMR spectroscopy.
- the methods of the present invention achieve a number of advantages.
- the present invention provides an effective and/or reliable method for diagnosing the presence of a brain tumour in a human test subject.
- the methods of the invention allow for the distinction between primary and/or secondary brain tumours and/or systemic metastases and/or allow the stage of the tumour to be determined.
- comparing and identifying differences in the concentration of at least two metabolites comprised in a sample from a human test subject and at least one reference standard early diagnosis of a brain tumour can be achieved.
- the early diagnosis of a primary brain tumour, secondary brain tumour e.g. a micrometastatic secondary brain tumour
- secondary brain tumour e.g. a micrometastatic secondary brain tumour
- the present invention therefore provides new and sensitive methods for earlier detection of brain metastases.
- Earlier detection of brain metastases means that treatments could be better directed and prognosis improved, whilst harmful and unnecessary treatment of at-risk cancer patients that do not have brain metastases could be avoided.
- the methods of the invention comprise obtaining a sample from a human test subject.
- the present invention allows the concentration of at least two metabolites to be determined with only minimal processing of the sample obtained from the human test subject.
- the present invention allows for a simple and/or non-invasive (e.g. not requiring any surgery or biopsy) and/or quick and/or inexpensive and/or safe processing of a sample from a human test subject.
- the minimal processing of the sample helps prevent the introduction of false positives and/or the provision of false negatives, especially when compared to other methods which may require purification of a metabolite, for example.
- Additional advantages arising from the use of the present invention is that it does not require a highly trained individual to obtain the sample from the human test subject and/or does not require significant training of the operator.
- a seminal finding of the present invention is that a brain tumour in a test subject can be diagnosed and/or a primary and a secondary brain tumour in a human test subject can be differentiated between by carrying out the methods described herein.
- the data presented herein relate to use of a mouse as cancer cell host, however the model employed is believed to have high predictive accuracy for diagnosis of human brain tumours and/or differentiation between human brain tumour types.
- Metabolite concentration data obtained and presented herein for metastatic human breast carcinoma cells (MDA-231-BR-GFP) was similar to that obtained using mouse tumour cells, thus validating the present model for human diagnostic purposes.
- the invention provides an in vitro method for diagnosing a brain tumour in a human test subject comprising:
- the invention provides an in vitro method for differentiating between a primary and a secondary brain tumour in a human test subject comprising:
- brain tumour refers to an abnormal growth of tissue present in the brain and encompasses both malignant tumours as well as benign tumours.
- the brain tumour may be a malignant tumour.
- Brain tumours in accordance with the invention may be primary brain tumours or secondary brain tumours.
- primary brain tumour refers to a brain tumour that originated in the brain.
- a “primary brain tumour” is a tumour that has developed in situ in the brain where tumour progression began and proceeded to yield a cancerous mass.
- a primary brain tumour may be comprised of cells that form up the tissue of, or surrounding, the brain.
- a primary brain tumour differs from a secondary brain tumour which has not originated in the brain.
- the method according to the invention may diagnose (or may be for diagnosing) a primary brain tumour.
- second brain tumour refers to a tumour in the brain that did not originate in the brain.
- a “secondary brain tumour” is a tumour that derives from a tumour that has developed ex situ to the brain in another tissue of the body and from which one or more cells have been transported to the brain, at which site they then form a secondary brain tumour.
- One or more tumour cells from which a secondary brain tumour forms may be transported to the brain by any known means. Suitably by the process of metastasis.
- the method according to the invention may diagnose (or may be for diagnosing) a secondary brain tumour.
- the secondary brain tumour may be at a micrometastatic stage.
- micrometastatic stage means that a secondary tumour (e.g. a secondary brain tumour) which has metastasised from another tissue of the body is too miniscule to be detected by conventional techniques.
- a micrometastatic tumour may be a tumour that is too miniscule to be visualised using an imaging technique known in the art.
- test subject refers to a subject that is the subject of the brain tumour diagnosis and/or method for differentiating between a primary and a secondary brain tumour.
- test subject refers to a human test subject.
- the concentration of at least two metabolites comprised in a sample obtained from a test subject may be determined by any suitable method known to one skilled in the art.
- the concentration of the at least two metabolites may be determined by one or more method selected from the group consisting of nuclear magnetic resonance (NMR) spectroscopy, mass spectrometry, HPLC-UV, infrared spectrometry and a biochemical assay.
- NMR nuclear magnetic resonance
- the biochemical assay may be an enzymatic assay.
- an assay may be useful when detecting the concentration of the metabolite uric acid and/or allantoin.
- One suitable enzymatic assay for determining the presence of the metabolite uric acid may be the Amplex® Red Uric Acid/Uricase Assay Kit (commercially available from Life Technologies Ltd. Product code A22181 (https://www.lifetechnologies.com/order/catalog/product/A22181)).
- the concentration of the at least two metabolites may be determined using NMR spectroscopy, more suitably, H-NMR spectroscopy.
- the “at least two metabolites” may be any two or more metabolites identified that differ between a sample obtained from a test subject and a sample obtained from a non-tumour bearing subject, a tumour bearing subject, a subject having a primary brain tumour, a subject having a secondary brain tumour or combinations thereof.
- One or more of the at least two metabolites may be selected from the group consisting of: uric acid, allantoin, citrate, trimethylamine (TMA), trimethylamine-N-oxide (TMAO), 2-oxoglutarate, creatinine, taurine, creatine and phosphocreatine.
- TMA trimethylamine
- TMAO trimethylamine-N-oxide
- 2-oxoglutarate creatinine, taurine, creatine and phosphocreatine.
- One or more of the at least two metabolites may be selected from citrate and/or 2-oxoglutarate.
- One or more of the at least two metabolites may be selected from creatinine, uric acid and/or allantoin.
- One or more of the at least two metabolites may be selected from TMAO, TMA, creatine, phosphocreatine, taurine or combinations thereof.
- the at least two metabolites for use in a method of the present invention may comprise (or consist of) one or more of creatinine, creatine and/or phosphocreatine (suitably wherein the at least one reference standard is a reference standard from a non-tumour bearing subject).
- At least two metabolites for use in the method of the invention may be selected from the group consisting of: uric acid, allantoin, citrate, trimethylamine (TMA), trimethylamine-N-oxide (TMAO), 2-oxoglutarate, creatinine, taurine, creatine and phosphocreatine.
- TMA trimethylamine
- TMAO trimethylamine-N-oxide
- 2-oxoglutarate creatinine, taurine, creatine and phosphocreatine.
- At least two metabolites for use in the method of the invention may be selected from the group consisting of: allantoin, citrate, trimethylamine (TMA), trimethylamine-N-oxide (TMAO), 2-oxoglutarate, creatinine, taurine, creatine and phosphocreatine.
- TMA trimethylamine
- TMAO trimethylamine-N-oxide
- 2-oxoglutarate creatinine, taurine, creatine and phosphocreatine.
- At least three metabolites for use in the method of the invention may be selected from the group consisting of: uric acid, allantoin, citrate, trimethylamine (TMA), trimethylamine-N-oxide (TMAO), 2-oxoglutarate, creatinine, taurine, creatine and phosphocreatine.
- TMA trimethylamine
- TMAO trimethylamine-N-oxide
- 2-oxoglutarate creatinine, taurine, creatine and phosphocreatine.
- At least three metabolites for use in the method of the invention may be selected from the group consisting of: uric acid, citrate, trimethylamine (TMA), trimethylamine-N-oxide (TMAO), 2-oxoglutarate, creatinine, taurine, creatine and phosphocreatine.
- TMA trimethylamine
- TMAO trimethylamine-N-oxide
- 2-oxoglutarate creatinine, taurine, creatine and phosphocreatine.
- At least four metabolites for use in the method of the invention may be selected from the group consisting of: uric acid, allantoin, citrate, trimethylamine (TMA), trimethylamine-N-oxide (TMAO), 2-oxoglutarate, creatinine, taurine, creatine and phosphocreatine.
- TMA trimethylamine
- TMAO trimethylamine-N-oxide
- 2-oxoglutarate creatinine, taurine, creatine and phosphocreatine.
- At least four metabolites for use in the method of the invention may be selected from the group consisting of: uric acid, citrate, trimethylamine (TMA), trimethylamine-N-oxide (TMAO), 2-oxoglutarate, creatinine, taurine, creatine and phosphocreatine.
- TMA trimethylamine
- TMAO trimethylamine-N-oxide
- 2-oxoglutarate creatinine, taurine, creatine and phosphocreatine.
- At least five metabolites for use in the method of the invention may be selected from the group consisting of: uric acid, allantoin, citrate, trimethylamine (TMA), trimethylamine-N-oxide (TMAO), 2-oxoglutarate, creatinine, taurine, creatine and phosphocreatine.
- TMA trimethylamine
- TMAO trimethylamine-N-oxide
- 2-oxoglutarate creatinine, taurine, creatine and phosphocreatine.
- At least five metabolites for use in the method of the invention may be selected from the group consisting of: uric acid, citrate, trimethylamine (TMA), trimethylamine-N-oxide (TMAO), 2-oxoglutarate, creatinine, taurine, creatine and phosphocreatine.
- TMA trimethylamine
- TMAO trimethylamine-N-oxide
- 2-oxoglutarate creatinine, taurine, creatine and phosphocreatine.
- At least six metabolites for use in the method of the invention may be selected from the group consisting of: uric acid, allantoin, citrate, trimethylamine (TMA), trimethylamine-N-oxide (TMAO), 2-oxoglutarate, creatinine, taurine, creatine and phosphocreatine.
- TMA trimethylamine
- TMAO trimethylamine-N-oxide
- 2-oxoglutarate creatinine, taurine, creatine and phosphocreatine.
- At least six metabolites for use in the method of the invention may be selected from the group consisting of: uric acid, citrate, trimethylamine (TMA), trimethylamine-N-oxide (TMAO), 2-oxoglutarate, creatinine, taurine, creatine and phosphocreatine.
- TMA trimethylamine
- TMAO trimethylamine-N-oxide
- 2-oxoglutarate creatinine, taurine, creatine and phosphocreatine.
- At least seven metabolites for use in the method of the invention may be selected from the group consisting of: uric acid, allantoin, citrate, trimethylamine (TMA), trimethylamine-N-oxide (TMAO), 2-oxoglutarate, creatinine, taurine, creatine and phosphocreatine.
- TMA trimethylamine
- TMAO trimethylamine-N-oxide
- 2-oxoglutarate creatinine, taurine, creatine and phosphocreatine.
- At least seven metabolites for use in the method of the invention may be selected from the group consisting of: uric acid, citrate, trimethylamine (TMA), trimethylamine-N-oxide (TMAO), 2-oxoglutarate, creatinine, taurine, creatine and phosphocreatine.
- TMA trimethylamine
- TMAO trimethylamine-N-oxide
- 2-oxoglutarate creatinine, taurine, creatine and phosphocreatine.
- At least eight metabolites for use in the method of the invention may be selected from the group consisting of: uric acid, allantoin, citrate, trimethylamine (TMA), trimethylamine-N-oxide (TMAO), 2-oxoglutarate, creatinine, taurine, creatine and phosphocreatine.
- TMA trimethylamine
- TMAO trimethylamine-N-oxide
- 2-oxoglutarate creatinine, taurine, creatine and phosphocreatine.
- At least eight metabolites for use in the method of the invention may be selected from the group consisting of: uric acid, citrate, trimethylamine (TMA), trimethylamine-N-oxide (TMAO), 2-oxoglutarate, creatinine, taurine, creatine and phosphocreatine.
- TMA trimethylamine
- TMAO trimethylamine-N-oxide
- 2-oxoglutarate creatinine, taurine, creatine and phosphocreatine.
- At least nine metabolites for use in the method of the invention may be selected from the group consisting of: uric acid, allantoin, citrate, trimethylamine (TMA), trimethylamine-N-oxide (TMAO), 2-oxoglutarate, creatinine, taurine, creatine and phosphocreatine.
- TMA trimethylamine
- TMAO trimethylamine-N-oxide
- 2-oxoglutarate creatinine, taurine, creatine and phosphocreatine.
- At least nine metabolites for use in the method of the invention may be selected from the group consisting of: uric acid, citrate, trimethylamine (TMA), trimethylamine-N-oxide (TMAO), 2-oxoglutarate, creatinine, taurine, creatine and phosphocreatine.
- TMA trimethylamine
- TMAO trimethylamine-N-oxide
- 2-oxoglutarate creatinine, taurine, creatine and phosphocreatine.
- At least ten metabolites for use in the method of the invention may be selected from the group consisting of: uric acid, allantoin, citrate, trimethylamine (TMA), trimethylamine-N-oxide (TMAO), 2-oxoglutarate, creatinine, taurine, creatine and phosphocreatine.
- TMA trimethylamine
- TMAO trimethylamine-N-oxide
- 2-oxoglutarate creatinine, taurine, creatine and phosphocreatine.
- At least ten metabolites for use in the method of the invention may be selected from the group consisting of: uric acid, citrate, trimethylamine (TMA), trimethylamine-N-oxide (TMAO), 2-oxoglutarate, creatinine, taurine, creatine and phosphocreatine.
- TMA trimethylamine
- TMAO trimethylamine-N-oxide
- 2-oxoglutarate creatinine, taurine, creatine and phosphocreatine.
- the metabolite may be one or more selected from the following Table (Table A):
- a metabolite for use in the present invention may be any one (suitably two or more) of the metabolites indicated in Table A above.
- the metabolite may have an NMR (e.g. 1 H-NMR) profile having one or more of the buckets indicated in Table A.
- the metabolite may be any one of the metabolites indicated in the table above other than allantoin.
- uric acid as used herein is synonymous with 7,9-Dihydro-1H-purine-2,6,8(3H)-trione and refers to a chemical compound with formula C 5 H 4 N 4 O 3 .
- allantoin as used herein is synonymous with 1-(2,5-Dioxo-4-imidazolidinyl) urea and refers to a chemical compound with formula C 4 H 6 N 4 O 3 .
- the terms “5-ureidohydantoin” or “glyoxyldiureide” may also be used synonymously.
- allantoin may have a 1 H-NMR profile of a singlet at 5.38 ppm.
- citrate as used herein is synonymous with 2-hydroxypropane-1,2,3-tricarboxylate and refers to a chemical compound having the formula C 6 H 5 O 7 3 ⁇ .
- citrate may have a 1 H-NMR profile of a doublet at 2.67 ppm and 2.64 ppm; doublet at 2.54 ppm and 2.51 ppm.
- trimethylamine is used herein synonymously with “TMA” and refers to a chemical compound with the formula N(CH 3 ) 3 .
- TMA trimethylamine
- trimethylamine may have a singlet at 2.89 ppm.
- trimethylamine-N-oxide is used herein synonymously with “TMAO” and refers to a chemical compound with the formula (CH 3 ) 3 NO.
- TMAO may have a singlet at 3.25 ppm.
- 2-oxoglutarate is synonymous with “ ⁇ -ketoglutarate” and 2-Oxopentanedioic acid and has the formula C 5 H 6 O 5 .
- 2-oxoglutarate may have a triplet at 3.01, 3.00 and 2.98 ppm; triplet at 2.44, 2.43 and 2.42 ppm.
- creatinine as used herein is synonymous with 2-Amino-1-methyl-5H-imidazol-4-one and/or 2-Amino-1-methyl-1H-imidazol-4-ol and refers to a compound having the formula C 4 H 7 N 3 O.
- creatinine may have a singlet at 4.05 ppm; larger singlet at 3.03 ppm.
- taurine refers to a chemical compound having the formula C 2 H 7 NO 3 S.
- taurine may have a triplet at 3.43, 3.42 and 3.40 ppm; larger triplet at 3.26, 3.25 and 3.24 ppm.
- creatine as used herein is synonymous with 2-[Carbamimidoyl(methyl)amino]acetic acid and refers to a chemical compound having the formula C 4 H 9 N 3 O 2 .
- creatine may have a singlet at 3.92 ppm and larger singlet at 3.02 ppm.
- phosphocreatine as used herein is synonymous with N-Methyl-N-(phosphonocarbamimidoyl)glycine and refers to a chemical compound having the formula C 4 H 10 N 3 O 5 P.
- phosphocreatine may have a singlet at 3.93 ppm and larger singlet at 3.03 ppm.
- the 1 H-NMR profile values referred to for the metabolites above may be obtained using any technique known in the art. Suitably one or more of the data acquisition and/or analysis techniques discussed below may be used.
- the 1 H-NMR spectroscopy may be carried out by any method known in the art. The skilled person will be aware that performing 1 H-NMR spectroscopy under different conditions may provide different 1 H-NMR spectroscopy data for the metabolites.
- the 1 H-NMR profiles detailed and used herein may be obtained using the preferred data acquisition and analysis methods above.
- the sample obtained from a human test subject or at least one standard obtained from a non-tumour bearing subject, a tumour bearing subject, a subject having a primary brain tumour, a subject having a secondary brain tumour or combinations thereof may suitably be a biological fluid (biofluid) sample or a fraction thereof.
- the biofluid sample may be obtained using any suitable techniques known to the skilled person including inter alia venepuncture, lumbar puncture (synonymous with spinal tap), catheter extraction and/or urination.
- the biofluid sample may be a urine sample, a blood sample, a cerebrospinal fluid sample, a lymph sample, combinations thereof or a fraction thereof.
- the biofluid sample may be a urine sample.
- the biofluid sample may be a blood sample.
- blood as used herein comprises whole blood, blood serum (henceforth “serum”) and blood plasma (henceforth “plasma”). Serum and plasma are derived from blood and thus may be considered as specific subtypes within the broader genus “blood”. Processes for obtaining serum or plasma from blood are known in the art. For example, it is known in the art that blood can be subjected to centrifugation in order to separate red blood cells, white blood cells, and plasma. Serum is defined as plasma that lacks clotting factors. Serum can be obtained by centrifugation of blood in which the clotting process has been triggered. Optionally, this can be carried out using specialised centrifuge tubes designed for this purpose.
- the biofluid sample for use in the present invention may not have undergone any processing or may have only undergone minimal processing after being obtained from a human test subject.
- biofluid fractions refers to a portion of a biofluid fraction obtainable or obtained following processing of a biofluid.
- a biofluid fraction refers to one or more constituent(s) of a biofluid that has been separated from one or more further biofluid constituent(s).
- a fraction of a blood sample may be blood plasma fraction.
- the methods of the present invention are in vitro methods. Thus, they can be carried out in vitro on an isolated sample that has been obtained from a test subject.
- the concentration of at least two metabolites comprised in a sample obtained from a human test subject is compared with the concentration of the same at least two metabolites in at least one reference standard. Such a comparison may therefore give rise to a relative concentration of the at least two metabolites comprised in the sample obtained from a human test subject.
- the term “reference standard” refers to data on metabolic concentrations obtained from a subject (preferably a human subject) of a known diagnostic status.
- the known diagnostic status may indicate that a subject (preferably a human subject) has no brain tumours, a primary brain tumour and/or a secondary brain tumour.
- the data on metabolic concentrations obtained from the subject for the at least one reference standard are obtained using similar (preferably identical) techniques to the human test subject.
- the “reference standard” sample is obtained from the same type of biofluid sample as the sample obtained from the human test subject.
- the reference standard may comprise (or consist of) a set of data relating to the concentration of said two or more metabolites in a sample or samples derived from a single reference subject, wherein the reference subject is a subject other than the human test subject.
- the reference standard may comprise (or consist of) a set of data relating to the concentration of said two or more metabolites in a sample derived from a plurality of (i.e. two or more) reference subjects.
- the reference standard may be derived by pooling data obtained from two or more (e.g. three, four, five, 10, 15, 20 or 25, suitably at least 5, preferably 10) reference subjects and calculating an average concentration for each metabolite.
- the reference standard may reflect average concentrations of said two or more metabolites in a biofluid in a given population of reference subjects. Said concentrations may be expressed in absolute or relative terms, in the same manner as described above in relation to the sample that is to be tested using a method of the invention.
- the reference standard may be obtainable (e.g. obtained) from a non-tumour-bearing subject (e.g. a healthy subject).
- the at least one reference standard may be obtained from a tumour bearing subject (preferably a human subject).
- the tumour bearing subject may have one or more selected from the group consisting of: a primary brain tumour, a secondary brain tumour, systemic metastases, no metastatic disease, micrometastatic secondary brain tumour and combinations thereof.
- the tumour bearing subject may have a primary brain tumour.
- a primary brain tumour may have a primary brain tumour.
- the tumour bearing subject may have a secondary brain tumour.
- the secondary brain tumour may be a micrometastatic secondary brain tumour.
- the tumour bearing subject may have no metastatic disease.
- the subject may have a primary brain tumour that has not metastasised.
- the tumour bearing subject may have systemic metastases.
- the tumour bearing subject may have systemic metastases.
- systemic metastases refers to a subject (preferably a human subject) having secondary tumours in one or more tissues of the body.
- the secondary tumours are not and have not been derived from a brain tumour.
- the at least one reference standard may be obtained from a non-tumour bearing subject (preferably a human subject).
- a non-tumour bearing subject preferably a human subject.
- substantially no concentration difference may mean a concentration difference that is not statistically significantly different.
- the at least one reference standard may be obtained from a subject (preferably a human subject) having a primary brain tumour and/or a secondary brain tumour.
- the at least one reference standard may be obtained from a subject (preferably a human subject) having a primary brain tumour.
- a subject preferably a human subject
- the at least two metabolite concentrations between the reference standard obtained from a subject having a primary brain tumour and the human test subject that a diagnosis of a primary brain tumour can be made. If there are differences (suitably substantial differences) in the at least two metabolite concentrations between the samples then a diagnosis of a secondary brain tumour can be made.
- the at least one reference standard may be obtained from a subject (preferably a human subject) having a secondary brain tumour (suitably the secondary brain tumour may be a micrometastatic secondary brain tumour).
- a subject preferably a human subject
- the secondary brain tumour may be a micrometastatic secondary brain tumour.
- the concentration of a metabolite in the diagnostic sample can be expressed in a number of different ways, for example as molar concentration (number of moles of metabolite per unit volume of diagnostic sample) or mass concentration (mass of metabolite per unit volume of diagnostic sample).
- concentration of a metabolite can be expressed as parts per million (ppm) or parts per billion (ppb).
- ppm parts per million
- ppb parts per billion
- the concentration of a metabolite in the diagnostic sample may be the molar concentration of said metabolite.
- concentration of a metabolite in the diagnostic sample may be the mass concentration of said metabolite.
- the concentration of a metabolite in the diagnostic sample can be expressed in absolute terms, for example as absolute molar concentration or absolute mass concentration.
- the concentration of a metabolite in the diagnostic sample can be expressed by comparison to the concentration of a different metabolite in the same sample (i.e. in relative terms).
- the concentration of a metabolite in the diagnostic sample can be normalised by comparison to the concentration of a different reference metabolite within the same diagnostic sample.
- the method of the present invention may be carried out by comparing relative concentrations of the at least two metabolites.
- test sample refers to a sample that is obtained from a human test subject.
- an absolute concentration can be compared with an absolute concentration
- a relative concentration can be compared with a relative concentration
- the comparison and/or identification may be carried out using any suitable method known in the art. Any data obtained using the methods of the present invention may be subjected to further analysis such as statistical analysis.
- the comparison and/or identification may be carried out using multivariate statistical analysis.
- the multivariate statistical analysis may be selected from orthogonal partial least squares discriminant analysis (OPLS-DA) as described in the Examples herein or partial least square discriminant analysis (PLS-DA).
- OPLS-DA orthogonal partial least squares discriminant analysis
- PLS-DA partial least square discriminant analysis
- the multivariate statistical analysis may be orthogonal partial least squares discriminant analysis (OPLS-DA) as described in the Examples herein
- the concentration difference for each of the at least two metabolites in the sample may correlate with the presence of a brain tumour.
- a brain tumour Suitably with the presence of a primary brain tumour.
- a secondary brain tumour Suitably with the presence of a secondary brain tumour. More suitably, a secondary brain tumour at a micrometastatic stage.
- the concentration difference for each of the at least two metabolites in the sample may allow differentiation between a primary and a secondary brain tumour.
- the secondary brain tumour may be a micrometastatic secondary brain tumour.
- concentration difference embraces both positive and negative differences.
- a concentration difference can mean that the concentration of a metabolite is higher in the sample being tested than in the reference standard.
- a concentration difference can mean that the concentration of a metabolite is lower in the sample than in the reference standard.
- the identification of a concentration difference can be achieved using methods of statistical analysis.
- NMR spectroscopy can be used to obtain an NMR spectrum for a sample.
- Methods of statistical analysis for example, orthogonal partial least squares discriminate analysis [OPLS-DA]
- OPLS-DA orthogonal partial least squares discriminate analysis
- the metabolite for use in the present invention may change in concentration over time when compared to at least one reference standard. Without wishing to be bound by theory it is believed that the change in concentration over time may be associated with cancer progression and/or stage.
- the skilled person can determine the concentration of one or more metabolite(s) in a sample obtained from a human test subject and compare it to the concentration of one or more metabolite(s) in at least one reference standard in order to identify one or more metabolite(s) of interest. Performing this determination will allow the skilled person to determine which of the one or more metabolite(s) has a higher and/or lower concentration with respect to at least one reference standard for each possible diagnosis. For example the skilled person can determine the one or more metabolite(s) has a higher and/or lower concentration in a human test subject with a primary brain tumour, a secondary brain tumour and/or systemic metastasis.
- the levels of metabolites discussed below are accurate for a murine model of brain tumour diagnosis, however these values may provide the skilled person with an indication of relevant metabolites for analysing in a sample obtained from a human test subject.
- One or more (suitably two or more) of the metabolite(s) creatinine, uric acid, allantoin, 2-oxoglutarate, creatine, phosphocreatine or combinations thereof may be lower in concentration in the human test subject when compared to at least one reference standard.
- one or more (suitably two or more) of the metabolite(s) creatinine, uric acid, 2-oxoglutarate, creatine, phosphocreatine or combinations thereof may be lower in concentration in the human test subject when compared to at least one reference standard.
- One or more (suitably two or more or three) of the metabolite(s) uric acid, allantoin and/or creatinine may be lower in concentration in the human test subject when compared to at least one reference standard.
- one or more of the metabolite(s) uric acid and/or creatinine may be lower in concentration in the human test subject when compared to at least one reference standard.
- One or more (suitably two or more) of the metabolite(s) trimethylamine, creatine, phosphocreatine, TMAO, taurine, citrate, 2-oxoglutarate or combinations thereof may be higher in concentration in the human test subject when compared to at least one reference standard.
- one or more (suitably two or more) of the metabolite(s) trimethylamine, creatine, phosphocreatine, TMAO, taurine or combinations thereof may be higher in concentration in the human test subject when compared to at least one reference standard.
- Three or more (suitably four or more or five or more) of the metabolites creatinine, uric acid, allantoin, 2-oxoglutarate, creatine, phosphocreatine or combinations thereof may be lower in concentration in the human test subject when compared to at least one reference standard.
- three or more (suitably four or more, e.g. five) of the metabolites creatinine, uric acid, 2-oxoglutarate, creatine, phosphocreatine or combinations thereof may be lower in concentration in the human test subject when compared to at least one reference standard.
- the metabolites uric acid, allantoin and/or creatinine may be lower in concentration in the human test subject when compared to at least one reference standard.
- the metabolites uric acid, and/or creatinine may be lower in concentration in the human test subject when compared to at least one reference standard.
- creatinine may be lower in concentration in a human test subject when compared to at least one reference standard (e.g. from a non-tumour bearing subject).
- Three or more (suitably four or more or five or more) of the metabolites trimethylamine, creatine, phosphocreatine, TMAO, taurine, citrate, 2-oxoglutarate or combinations thereof may be at a higher concentration in the human test subject when compared to at least one reference standard.
- metabolite(s) trimethylamine, creatine, phosphocreatine, TMAO, taurine or combinations thereof may be higher in concentration in the human test subject when compared to at least one reference standard.
- the at least one reference standard may be obtained from a non-tumour bearing subject.
- the at least one reference standard may be obtained from a non-tumour bearing subject.
- the concentration of the metabolites citrate and/or 2-oxoglutarate may be higher when compared to the at least one reference standard at the later stages of tumour development.
- the at least one reference standard may be obtained from a non-tumour bearing subject.
- the metabolite 2-oxoglutarate may be lower in the early stages of tumour development and then higher when compared to the at least one reference standard in later stages of tumour development.
- the at least one reference standard may be obtained from a non-tumour bearing subject.
- the concentration of the metabolites citrate and/or 2-oxoglutarate may remain substantially unchanged when compared to the at least one reference standard at the early stages of tumour development.
- the at least one reference standard may be obtained from a non-tumour bearing subject.
- the concentration of the metabolites TMA, TMAO, creatine, phosphocreatine, taurine or combinations thereof may be higher when compared to the at least one reference standard at the early stages of tumour development.
- the at least one reference standard may be obtained from a non-tumour bearing subject.
- the metabolites TMA, TMAO, taurine or combinations thereof may be higher in concentration when compared to the at least one reference standard at the early stages of tumour development.
- the at least one reference standard may be obtained from a non-tumour bearing subject.
- the concentration of metabolites TMA, TMAO, creatine, phosphocreatine, taurine or combinations thereof may later return to baseline values when compared to at least one reference standard at the later stages of tumour development.
- the at least one reference standard may be obtained from a non-tumour bearing subject.
- the concentration of the metabolites creatinine, uric acid and/or allantoin may be lower at the later stages of tumour development when compared to at least one reference standard.
- the at least one reference standard may be obtained from a non-tumour bearing subject.
- the at least one reference standard may be obtained from a non-tumour bearing subject.
- the at least one reference standard may be obtained from a non-tumour bearing subject.
- the at least one reference standard may be obtained from a non-tumour bearing subject.
- the at least one reference standard may be obtained from a non-tumour bearing subject.
- the at least one reference standard may be obtained from a non-tumour bearing subject.
- the at least one reference standard may be obtained from a non-tumour bearing subject.
- the at least one reference standard may be obtained from a non-tumour bearing subject.
- the at least one reference standard may be obtained from a non-tumour bearing subject.
- early stages of tumour development means a stage at which the tumour is less than about 1.3 mm in size, suitably less than about 1.0 mm in size.
- the detection of metabolites that have a concentration that is higher or lower at the early stages of tumour development may be indicative of an early stage brain tumour, suitably an early stage secondary brain tumour, preferably a micrometastatic secondary brain tumour.
- analysis of such metabolites may allow for early-stage diagnosis and/or differentiation between a primary or secondary brain tumour in a human test subject.
- late stages of tumour development means more than about 1.0 mm in size, suitably more than about 1.3 mm, 1.5 mm or 2 mm in size.
- the detection of metabolites that have a concentration that is higher or lower at the later stages of tumour development may be indicative of a late stage brain tumour, suitably a late stage primary brain tumour or secondary brain tumour.
- the concentration of uric acid and/or allantoin may be lower by at least about 1%, 5% or 10% (preferably at least about 20%) when compared to the concentration of uric acid and/or allantoin comprised in a sample obtained from at least one reference standard from a non-tumour bearing subject.
- the concentration may be lower after the beginning of tumour development.
- the concentration of citrate may be higher by at least about 1%, 5% or 15% (preferably at least about 30%) when compared to the concentration of citrate comprised in a sample obtained from at least one reference standard from a non-tumour bearing subject.
- the concentration may be higher after the beginning of tumour development.
- the concentration of TMAO may be higher by at least about 5% or 10% (preferably at least about 15%) when compared to the concentration of TMAO comprised in a sample obtained from at least one reference standard from a non-tumour bearing subject.
- the concentration may be higher when the tumour is between about 0.1 mm to about 1.5 mm (suitably when the tumour is between about 0.5 mm to about 1.25 mm in size).
- the concentration of 2-oxoglutarate may be higher by at least about 1%, 5% or 15% (preferably at least about 30% or 40%) when compared to the concentration of citrate comprised in a sample obtained from at least one reference standard from a non-tumour bearing subject.
- concentration may be higher at the beginning of tumour development.
- the concentration of creatinine may be lower by at least about 5%, 15% or 20% (preferably at least about 30%) when compared to the concentration of creatinine comprised in a sample obtained from at least one reference standard from a non-tumour bearing subject.
- the concentration may be higher after the beginning of tumour development.
- the concentration of TMA may be higher by at least about 5%, 15% or 30% (preferably at least about 40%) when compared to the concentration of TMA comprised in a sample obtained from at least one reference standard from a non-tumour bearing subject.
- the concentration may be higher when the size of the tumour is between about 0.1 mm to about 1.7 mm (suitably between about 0.5 mm to about 1.5 mm in size).
- the concentration of creatine may be higher by at least about 5%, 15% or 30% (preferably at least about 40%) when compared to the concentration of creatine comprised in a sample obtained from at least one reference standard from a non-tumour bearing subject.
- the concentration may be higher when the size of the tumour is between about 0.1 mm to about 1.7 mm (suitably between about 0.5 mm to about 1.5 mm in size).
- the concentration of phosphocreatine may be higher by at least about 5%, 15% or 30% (preferably at least about 40%) when compared to the concentration of creatine comprised in a sample obtained from at least one reference standard from a non-tumour bearing subject.
- the concentration may be higher when the size of the tumour is between about 0.1 mm to about 1.7 mm (suitably between about 0.5 mm to about 1.5 mm in size).
- the concentration of taurine may be higher by at least about 1%, 5% or 10% (preferably at least about 20%) when compared to the concentration of creatine comprised in a sample obtained from at least one reference standard from a non-tumour bearing subject.
- the concentration may be higher when the size of the tumour is between about 0.1 mm to about 1.9 mm (suitably between about 0.5 mm to about 1.7 mm in size).
- stage and/or size of tumours are based on a murine model. These values may be similar for a one or more metabolite(s) analysed in a sample obtained from a human test subject.
- the skilled person will appreciate that by comparing a sample obtained from a human test subject with at least one reference standard obtained from a subject with a tumour of known progression/stage that the equivalent metabolite concentrations in respect of tumour size and/or stage can be determined.
- Comparing and identifying a difference in concentration of at least two metabolites comprised in the sample obtained from a human test subject with at least one reference standard may allow the diagnosis of a brain tumour or a secondary brain tumour or the distinction between a brain tumour or a secondary brain tumour compared to systemic metastases or an absence of a brain tumour.
- the skilled person can determine the concentration of one or more metabolite(s) in a sample obtained from a human test subject and compare it to the concentration of one or more metabolite(s) in at least one reference standard in order to identify one or more metabolite(s) of interest. Performing this determination will allow the skilled person to determine which of the one or more metabolite(s) has a higher and/or lower concentration with respect to at least one reference standard for each possible diagnosis. For example the skilled person can determine the one or more metabolite(s) has a higher and/or lower concentration in a human test subject with a primary brain tumour, a secondary brain tumour and/or systemic metastasis. Additionally, the skilled person may be able to determine the absolute and/or relative differences in concentration of one or more metabolite(s) based on a comparison of the differences between the sample obtained from a human test subject and the at least one reference standard.
- the diagnosis of a secondary brain tumour may be made if the concentration of one or more of TMAO, taurine, creatine, phosphocreatine or TMA is higher; when compared to at least one reference standard obtained from a subject with systemic metastases.
- the concentration of uric acid and/or allantoin may be lower when compared to at least one reference standard obtained from a subject with systemic metastases.
- concentration changes indicated above may be indicative of a measurement at the beginning of tumour development.
- the concentration of TMAO may be higher in a sample obtained from a human test subject having a secondary brain tumour by at least about 5% or 10% (preferably at least about 20%) when compared to at least one reference standard obtained from a subject having systemic metastases.
- the concentration of taurine may be higher in a sample obtained from a human test subject having a secondary brain tumour by at least about 5%, 10% or 20% (preferably at least 30%) when compared to at least one reference standard obtained from a subject having systemic metastases.
- the concentration of taurine may be lower in a sample obtained from a human test subject having a secondary brain tumour by at least about 5%, 10% or 20% (preferably at least 30%) when compared to at least one reference standard obtained from a subject having systemic metastases.
- the concentration of creatine may be higher in a sample obtained from a human test subject having a secondary brain tumour by at least about 5%, 10% or 20% (preferably at least 30%) when compared to at least one reference standard obtained from a subject having systemic metastases.
- the concentration of phosphocreatine may be higher in a sample obtained from a human test subject having a secondary brain tumour by at least about 5%, 10% or 20% (preferably at least 30%) when compared to at least one reference standard obtained from a subject having systemic metastases.
- the concentration of TMA may be higher in a sample obtained from a human test subject having a secondary brain tumour by at least about 5%, 10% or 20% (preferably at least 30%) when compared to at least one reference standard obtained from a subject having systemic metastases.
- the concentration of uric acid and/or allantoin may be lower in a sample obtained from a human test subject having a secondary brain tumour by at least about 1%, 5% or 10% (preferably at least 20%) when compared to at least one reference standard obtained from a subject having systemic metastases.
- phosphocreatine may be higher in concentration in a sample obtained from a human test subject having a secondary brain tumour by at least about 5%, 10% or 20% (preferably at least 30%) when compared to at least one reference standard obtained from a subject having systemic metastases, then a lower phosphocreatine concentration when compared to at least one reference standard obtained from a subject having a secondary brain tumour will allow the diagnosis of systemic metastases.
- concentrations of metabolites in the sample obtained from a human test subject are similar or the same as those for at least one reference sample obtained from a subject having a primary brain tumour then a diagnosis of a primary brain tumour can be made, or if similar or the same as at least one reference sample obtained from a subject having a secondary brain tumour then a diagnosis of a secondary brain tumour can be made or if similar or the same as at least one reference sample obtained from a subject having systemic metastases then a diagnosis of a secondary brain tumour can be made.
- a diagnosis that a human test subject has a brain tumour may be determined by comparing the concentration of: (i) TMAO, creatine, phosphocreatine or combinations thereof; and (ii) uric acid, allantoin, creatinine or combinations thereof.
- concentration of TMAO, creatine, phosphocreatine or combinations thereof may be higher, whilst the concentration of uric acid, allantoin, creatinine or combinations thereof may be lower.
- the reference standard used in such a diagnosis may be a reference standard from a non-tumour bearing subject.
- a diagnosis that a human test subject has a brain tumour may be determined by comparing the concentration of: (i) TMAO, creatine, phosphocreatine or combinations thereof; and (ii) uric acid, creatinine or combinations thereof.
- concentration of TMAO, creatine, phosphocreatine or combinations thereof may be higher, whilst the concentration of uric acid, creatinine or combinations thereof may be lower.
- the reference standard used in such a diagnosis may be a reference standard from a non-tumour bearing subject.
- the concentration of TMAO may be higher by at least about 5% or 10% (more suitably at least about 15%) when compared to at least one reference standard having systemic metastases or no brain tumour.
- the concentration of creatine may be higher by at least about 10% or 20% (more suitably at least about 30%) when compared to at least one reference standard having systemic metastases or no brain tumour.
- the concentration of phosphocreatine may be higher by at least about 10% or 20% (more suitably at least about 30%) when compared to at least one reference standard having systemic metastases or no brain tumour.
- the concentration of uric acid and/or allantoin may be lower by at least about 5% or 10% (more suitably at least about 15%) when compared to at least one reference standard having systemic metastases or no brain tumour.
- a diagnosis that a human test subject has a brain tumour may be determined by comparing the concentration of: (i) TMAO, creatine and phosphocreatine; and (ii) uric acid, allantoin and creatinine.
- a diagnosis that a human test subject has a brain tumour may be determined by comparing the concentration of: (i) TMAO, creatine and phosphocreatine; and (ii) uric acid, and creatinine.
- the concentration of TMAO, creatine and phosphocreatine may be higher whilst the concentration of uric acid and/or allantoin and creatinine may be lower.
- the concentration of TMAO may be higher by at least about 5% or 10% (more suitably at least about 15%) when compared to at least one reference standard having systemic metastases or no brain tumour.
- the concentration of creatine may be higher by at least about 10% or 20% (more suitably at least about 30%) when compared to at least one reference standard having systemic metastases or no brain tumour.
- the concentration of phosphocreatine may be higher by at least about 10% or 20% (more suitably at least about 30%) when compared to at least one reference standard having systemic metastases or no brain tumour.
- the concentration of uric acid and/or allantoin may be lower by at least about 5% or 10% (more suitably at least about 15%) when compared to at least one reference standard having systemic metastases or no brain tumour.
- the ratio of creatine and/or phosphocreatine to uric acid and/or allantoin may allow the diagnosis of a brain tumour (e.g. a secondary brain tumour) or the distinction between a brain tumour compared to non-brain tumours or systemic metastases.
- a high concentration of TMA in a sample obtained from a human test subject may be indicative of a secondary brain tumour when compared to at least one reference standard obtained from a subject having systemic metastases.
- the concentration of TMA in a sample obtained from a human test subject may be higher by at least about 10%, 30% or 50% (more suitably at least about 70%) when compared to at least one reference standard obtained from a subject having systemic metastases.
- the method of the invention may further comprise recording the output of at least one step on a data-storage medium.
- the method of the present invention can generate data relating to the human test subject and/or at least one reference standard obtained from a subject, such data being recordable on a data-storage medium (for example, a form of computer memory such as a hard disk, compact disc, floppy disk, or solid state drive).
- a data-storage medium for example, a form of computer memory such as a hard disk, compact disc, floppy disk, or solid state drive.
- Such data may comprise (or consist of) data relating to the concentration in a sample (from said human test subject or subject from which the at least one reference standard is obtained) of any of said two or more metabolites (as described) above.
- the invention provides a data-storage medium comprising data obtained by any of the methods of the invention.
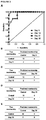
- FIG. 1 shows a flowchart of study design for the intracerebral brain metastasis model.
- Both 4T1-GFP cell-injected and PBS-injected cohorts were split into two groups, one for model building and one reserved as a blinded testing set.
- Each model is then constructed comparing 4T1-GFP animals from a particular day with the control set comprising PBS-injected animals from the same day as well as the na ⁇ ve 4T1-GFP animal samples from before injection.
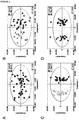
- FIG. 2 shows OPLS-DA scores scatter plots for models constructed to separate urine samples from animals in control cohorts from animals at day 5 (A), 10 (B), 21 (C) and 35 (D) after intracerebral injection of 4T1-GFP cells.
- FIG. 3 shows prediction results from OPLS-DA models separating animals at different time points after intracerebral injection of 4T1-GFP cells represented as (A) ROC curves and (B to E) 2 ⁇ 2 contingency tables for days 5, 10, 21 and 35.
- FIG. 5 shows OPLS-DA scores scatter plots for models constructed to separate urine samples from animals in control cohorts from animals at day 10 after injection of 4T1-GFP tumour cells either (A) intravenously or (B) intracardially.
- FIG. 6 shows proposed mechanism for increased citrate and 2-oxoglutarate. Pathways with increased activity in cancer are shown in bold and pathways with decreased activity are shown in feint. Enzyme names are shown in italicised text. GOT: glutamate oxaloacetate transaminase.
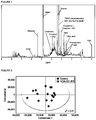
- FIG. 7 shows example urine NMR spectrum with peaks of interest annotated.
- PCr Phosphocreatine.
- TSP 3-trimethylsilyl-1-[2,2,3,3,- 2 H 4 ] propionate.
- FIG. 8 shows an OPLS-DA plot of MDA-231-BR-GFP cell cohort vs. control in SCID mice.
- FIG. 9 shows an OPLS-DA plot of B16F10 cell cohort vs. control in C57/BL6 mice.
- FIG. 10 shows cohort B 4T1-GFP intracerebral OPLS-DA model built using important Cohort A buckets.
- mice Female BALB/c mice (6-7 weeks) were housed under a standard 12 h light 12 h dark cycle and with access to standard chow and water ad libitum.
- the skull was exposed and a burr-hole drilled above the injection site.
- a finely drawn glass microcannula, tip diameter ca. 75 ⁇ m was inserted into the left striatum (coordinates relative to bregma: +0.5 mm; left 1.9 mm; depth 2.9 mm).
- Cell-injected animals received 5000 4T1-GFP cells (a metastasising murine mammary carcinoma cell line) in 0.5 ⁇ L phosphate-buffered saline (PBS) vehicle.
- PBS phosphate-buffered saline
- the microcannula was left in place for 5 minutes, raised by 0.5 mm and left for a further 2 minutes before complete removal.
- the scalp wound was closed and the animals were assessed daily for weight and clinical score.
- Urine samples were collected by handling the mice over a clean impermeable surface, both before tumour induction and at days 5, 10, 21 and 35 post-tumour induction. Samples contaminated with faecal material were not used. Urine samples were frozen on dry ice and stored at ⁇ 80° C. until NMR spectroscopy was performed.
- tumour burden is found in the lungs, the site of the first capillary bed after the injection point.
- tumours are found systemically including in the brain.
- intracardiac group female BALB/c mice (6-7 weeks) were anaesthetised as described above.
- the hair covering the thoracic cavity on the left side of the heart was removed by clipping followed by application of depilatory cream (Veet, Boots, UK).
- the depilated area was coated with ultrasound gel and the left ventricle of the heart located with the aid of ultrasound imaging.
- a 27 gauge needle was used to inject 1 ⁇ 10 5 4T1 cells into the left ventricle of the heart in 100 ⁇ L sterile PBS.
- the animals were allowed to recover in a heated chamber and were assessed daily for weight and clinical score.
- Sections were incubated with primary chicken anti-GFP antibody (Abcam, UK; 1:1000, 4° C., overnight), washed using PBS+0.01% (v/v) Tween-20 (Sigma Aldrich, UK), then incubated with a biotinylated polyclonal rabbit anti-chicken IgY secondary antibody (Abcam, UK; 1:1000, 1 h). Slides were washed then incubated with VECTASTAIN Elite ABC kit (Vector labs, UK; 1:1:100, 45 min). The peroxidase was visualized using 3,3′-diaminobenzidine (DAB; Sigma Aldrich, UK). Sections were counterstained with cresyl violet (Sigma Aldrich, UK), dehydrated and mounted. All incubations were performed at room temperature, unless otherwise stated. Slides were scanned using a ScanScope slide scanner at 200 ⁇ magnification and tumours and brain sections were manually delineated to quantify area and number.
- Urine samples were defrosted on ice and 50 ⁇ L from each was placed in a 5 mm NMR tube and diluted to a final volume of 600 ⁇ L with phosphate buffer (0.24M sodium phosphate, pH 7.4, 0.1% sodium azide, 0.8% sodium chloride) in D 2 O containing 1 mM TSP (3-trimethylsilyl-1-[2,2,3,3,- 2 H 4 ] propionate) as an internal standard.
- 1 H NMR spectra were acquired for each sample at 700 MHz (Bruker Avance III spectrometer equipped with a 1 H TCI cryoprobe, Bruker, Coventry, UK).
- the 1D 1 H plasma spectra were imported into Matlab (MathWorks, Nantick, USA) using the RBNMR script then automatically phased using a method optimised for signal-dense spectra (Bao et al. 2013). Spectra with gross distortions or phasing anomalies were excluded at this stage. Spectra were baseline corrected using a 3 rd order polynomial fitted to regions without peaks (Beek 2007) then aligned to the TSP peak at 0 ppm. Spectra were unit-scaled to the summed spectrum integral, excluding the water and TSP peak regions.
- OPLS-DA modelling was conducted using SIMCA 13.0 (Umetrics, Sweden) to produce models which maximally separated groups of spectra.
- 4T1-GFP cell timecourse four models were constructed to separate samples from mice at day 5, 10, 21 or 35 from their respective control cohorts.
- the control cohorts included samples from the 4T1-GFP injected mice before they were injected with cells on day 0, as well as samples from age- and timepoint-matched mice injected with PBS alone (see study schematic in FIG. 1 ).
- the inclusion of these two groups in the control cohort allows adequate control of both differences between batches of mice as well as the effect of the injection procedure itself. Any remaining differences are thus attributable to the presence of the tumour alone.
- the q 2 value for each model was calculated.
- the q 2 of a model is derived from a step-wise removal of a fraction of samples and a prediction of the group membership of the removed samples using a model built with the remaining samples.
- a q 2 >0 means that the model is predictive and a q 2 >0.4 is considered statistically significant (Waterman et al. 2010).
- Cross-validation (CV)-ANOVA p-values for each model were determined with p-values ⁇ 0.05 being considered significant.
- Quantification of specific metabolites of interest was performed by summing the integral regions of each metabolite as they contributed to the models. This yields a relative quantification which allows comparison to be made across the time course and relative to control but without yielding absolute concentrations. Significance of relative changes in metabolite concentration were determined by 1-way ANOVA followed by Dunnet's multiple comparison post-hoc test comparing each timepoint to the control group. p values ⁇ 0.05 were considered significant.
- a focal area of metastatic colonies was induced in the striatum of mice injected intracerebrally with the 4T1-GFP cells. Tumours initially grew very focally before beginning to disseminate from the injection site, by days 21 and 35, by growing adjacent to vessels along the perivascular niche, as described previously (Serres et al. 2012). Mice showed no significant clinical signs or weight loss throughout the experimental time course.
- OPLS-DA Orthogonal Partial Least Squares Discriminant Analysis
- the subset of samples withheld from the modelling procedure was used as a testing set ( FIG. 1 ).
- the unknown samples were assigned to either control or 4T1-GFP injected groups by the relevant model, and contingency tables and ROC curves constructed ( FIG. 3 ).
- Each model was highly sensitive and specific in separating the disease and control groups; sensitivity and specificity was 0.78 and 0.76 at day 5, 0.78 and 0.75 at day 10, 0.89 and 1.00 at day 21, and 1.00 and 1.00 at day 35.
- TMA, TMAO, Cr+PCr and taurine were all more abundant in the early stages of tumour development with their importance for model separation decreasing by day 21. Creatinine and allantoin both decreased in abundance as tumours developed from day 0 to day 10 (creatinine p ⁇ 0.001 by day 5, allantoin p ⁇ 0.001 by day 10). From day 10 to day 35, their relative abundance remained unchanged at around 63% of control for creatinine and 82% of control for allantoin. Citrate and 2-oxoglutarate both underwent no change in the early time points (days 5 and 10), but then increased in abundance continuously throughout the remainder of the timecourse to reach significance by day 35 (p ⁇ 0.001).
- Two OPLS-DA models were built to compare animals injected with 4T1-GFP cells via either the intravenous or intracardiac route with their respective control cohorts 10 days after tumour induction.
- Creatinine abundance was significantly decreased to almost the same extent in models induced by all three routes of induction (0.59, 0.65 and 0.63 ⁇ control in the intracerebral, intracardiac and intravenous models respectively; p ⁇ 0.001). Allantoin, TMA and TMAO were all unchanged in the intravenous model but in the intracardiac model allantoin was decreased (0.79 ⁇ control, p ⁇ 0.001) whilst TMA and TMAO were increased (2.03 and 1.23 ⁇ control; p ⁇ 0.001 and p ⁇ 0.01 respectively), in line with the changes seen in the intracerebral model. Creatine+phosphocreatine was only significantly increased in the intracerebral model (1.42 ⁇ control; p ⁇ 0.001).
- Cohort B This second cohort of animals, hereafter referred to as Cohort B, was prepared by an independent researcher (AMD) and is thus distinct from the cohort used for the main study, hereafter referred to as Cohort A.
- Cohort B is independent to cohort A in four important ways: (i) the independent researcher performed all scientific steps including cell culture, animal handling, solution preparation and sample analysis; (ii) cohorts A and B were temporally separated by >6 months; (iii) separate batches of animals were used; and (iv) urine NMR spectra were acquired on different days in different batches of buffer.
- Cohort B model generated in this validation study is very strongly predictive. Since Cohort B is a completely independent set of animals to Cohort A, these data demonstrate the reproducibility and robustness of the separation, and confirm that the findings are not a chance occurrence from a single batch of animals or the result of systematic bias on the part of a single operator.
- the metabolite changes present in the urine during the timecourse can be broadly divided into three groups: (i) those metabolites that didn't change significantly in the initial stages of tumour growth, bit which changed progressively across the timecourse (citrate and 2-oxoglutarate); (ii) those metabolites that were stably altered throughout the timecourse (creatinine and allantoin) and (iii) those metabolites that changed at earlier time points, but later returned to baseline values (TMAO, TMA, Cr+PCr and taurine).
- TMAO, TMA, Cr+PCr and taurine baseline values
- citrate and 2-oxoglutarate are both intermediates in the ticarboxylic acid (TCA) cycle.
- TCA ticarboxylic acid
- Normal metabolic flux in healthy cells converts citrate to 2-oxoglutarate after the reversible isomerisation of citrate to isocitrate by the enzyme aconitase ( FIG. 6 ).
- aconitase FIG. 6
- Glutamine enters the TCA cycle after conversion to glutamate by glutaminase and subsequent conversion to 2-oxoglutarate by glutamate oxaloacetate transaminase.
- High activity of glutaminase is associated with increased proliferation of breast cancer cells (Qie et al. 2014).
- the enzyme aconitase is often inhibited in tumour cells owing to the high abundance of reactive oxygen species (ROS) in these cells (Kim et al. 2001).
- ROS reactive oxygen species
- 2-oxoglutarate and citrate concentrations are likely to be elevated owing to enhanced glutaminolysis and aconitase inhibition, respectively ( FIG. 6 ). Since the increase in flux through these reactions is proportional to the mass of tumour cells, it is logical that these abundances increases as the tumours grow.
- Allanotin is the end product of purine catabolism in mice.
- the pathway for synthesis of allantoin is absent so the breakdown of purines stops at uric acid with allantoin being formed in only small quantities by the non-enzymatic oxidation of uric acid (Il'yasova et al. 2012).
- tumour cells are highly proliferative, they have a high demand for purines for synthesis of new DNA. As such, it is possible that the decreased allantoin excretion observed is simply a function of increased demand for purines and a greater need to metabolically salvage purine breakdown products.
- TMA and TMAO are dietary choline which is converted to TMA by the action of gut flora before being taken into circulation and oxidised to TMAO, likely by one of a number of members of the flavin monooxygenase family e.g. FMO3 (Zeisel et al. 1989, Bennett et al. 2013). TMA can then be re-formed by non-enzymatic degradation of TMAO. Since TMA and TMAO are closely metabolically linked, it is not surprising that their abundance profiles are broadly similar to each other. The more surprising aspect is that their profile shows a dramatic increase at very early time points before returning to baseline values at later time points.
- intravenous tumour cell injections give rise to metastatic nodules primarily in the lungs, as this is the first capillary bed encountered.
- intracardiac injections put tumour cells directly into the arterial circulation which gives rise to metastases in a wider range of locations including brain, bone and adrenal glands (Saxena and Christofori 2013).
- a fingerprint for brain metastasis specifically.
- the pattern of key metabolite abundance changes for the differing routes of 4T1-GFP cell injection indicates that systemic and CNS metastases may give rise to different urinary metabolic profiles, which may be super-imposable where metastases exist in both locations.
- the decrease in allantoin observed at the day 10 time point for both the intracerebral and intracardiac injections is of particular note, since it remained changed significantly in abundance in the intravenous model.
- the patterns observed for creatinine, Cr+PCr and the unidentified doublet at 3.12 ppm are of interest in that the intracerebral and intravenous models appear to show opposite responses in these metabolites, whilst the intracardiac model lies between those two extremes. This arrangement may reflect a combination of systemic and intracerebral metastatic phenotypes in the intracardiac model.
- Urine samples are easy and cheap to collect and the NMR analysis itself is inexpensive.
- a series of samples could be taken routinely from patients as they come in for their standard follow up clinics. These would be analysed and could be plotted in a dynamic fashion, giving an overview of patient progression over time. Appropriate cut-off values could be determined to allow physicians to classify patients as potentially having clinically occult brain metastases.
Landscapes
- Health & Medical Sciences (AREA)
- Life Sciences & Earth Sciences (AREA)
- Immunology (AREA)
- Engineering & Computer Science (AREA)
- Molecular Biology (AREA)
- Biomedical Technology (AREA)
- Chemical & Material Sciences (AREA)
- Hematology (AREA)
- Urology & Nephrology (AREA)
- Biotechnology (AREA)
- Microbiology (AREA)
- Cell Biology (AREA)
- Food Science & Technology (AREA)
- Medicinal Chemistry (AREA)
- Physics & Mathematics (AREA)
- Analytical Chemistry (AREA)
- Biochemistry (AREA)
- General Health & Medical Sciences (AREA)
- General Physics & Mathematics (AREA)
- Pathology (AREA)
- Other Investigation Or Analysis Of Materials By Electrical Means (AREA)
- Investigating Or Analysing Biological Materials (AREA)
Abstract
Description
- a. Determining the concentration of at least two metabolites comprised in a biofluid sample obtained from the human test subject;
- b. Comparing the concentration of the at least two metabolites in the biofluid sample with the concentration of the same at least two metabolites in at least one reference standard obtained from a non-tumour bearing subject and/or a tumour bearing subject; and
- c. Identifying a concentration difference for each of the at least two metabolites in the biofluid sample relative to the reference standard;
wherein the concentration difference for each of the at least two metabolites in the biofluid sample correlates with the presence of a brain tumour.
- a. Determining the concentration of at least two metabolites comprised in a biofluid sample obtained from the human test subject;
- b. Comparing the concentration of the at least two metabolites in the biofluid sample with the concentration of the same at least two metabolites in at least one reference standard obtained from a subject having a primary brain tumour and/or a subject having a secondary brain tumour; and
- c. Identifying a concentration difference for each of the at least two metabolites in the biofluid sample relative to the reference standard;
wherein the concentration difference for each of the at least two metabolites in the biofluid sample allows differentiation between a primary and a secondary brain tumour.
- a. obtaining a data set showing data for at least two metabolites comprised in a biofluid sample obtained from the human test subject using a method selected from nuclear magnetic resonance (NMR) spectroscopy, mass spectrometry, HPLC-UV and infrared spectrometry (preferably NMR spectroscopy);
- b. Comparing the data set showing data for the at least two metabolites for the biofluid sample with a data set for the same at least two metabolites in at least one reference standard obtained from a non-tumour bearing subject and/or a tumour bearing subject; and
- c. Identifying a difference in the data set obtained for each of the at least two metabolites in the biofluid sample relative to the reference standard;
wherein the difference in the data set for each of the at least two metabolites in the biofluid sample correlates with the presence of a brain tumour.
-
- a. Determining the concentration of at least two metabolites comprised in a biofluid sample obtained from the human test subject;
- b. Comparing the concentration of the at least two metabolites in the biofluid sample with the concentration of the same at least two metabolites in at least one reference standard obtained from a non-tumour bearing subject and/or a tumour bearing subject; and
- c. Identifying a concentration difference for each of the at least two metabolites in the biofluid sample relative to the reference standard;
wherein the concentration difference for each of the at least two metabolites in the sample correlates with the presence of a brain tumour.
-
- a. Determining the concentration of at least two metabolites comprised in a biofluid sample obtained from the human test subject;
- b. Comparing the concentration of the at least two metabolites in the biofluid sample with the concentration of the same at least two metabolites in at least one reference standard obtained from a subject having a primary brain tumour and/or a subject having a secondary brain tumour; and
- c. Identifying a concentration difference for each of the at least two metabolites in the biofluid sample relative to the reference standard;
wherein the concentration difference for each of the at least two metabolites in the biofluid sample allows differentiation between a primary and a secondary brain tumour.
| Complete range | |||
| of possible | |||
| buckets which | |||
| NMR | include portions | ||
| IUPAC systematic name | identification | of a metabolite | |
| Trivial name | from chemspider | (HMDB) | peak ( ppm) |
| Allantoin | 1-(2,5-Dioxo-4- | Singlet at 5.38 ppm | 5.37-5.38, 5.38- |
| imidazolidinyl)urea | 5.39, 5.39-5.40 | ||
| Citrate | 2-hydroxypropane-1,2,3- | Doublet at | 2.52-2.53, 2.53- |
| tricarboxylate | 2.67 ppm and | 2.54, 2.54-2.55, | |
| 2.64 ppm; doublet | 2.55-2.56, 2.66- | ||
| at 2.54 ppm and | 2.67, 2.67-2.68, | ||
| 2.51 ppm | 2.68-2.69, 2.69- | ||
| 2.70 | |||
| Trimethylamine | N,N-Dimethylmethanamine | Singlet at 2.89 ppm | 2.88-2.89, 2.89- |
| 2.90 | |||
| Trimethylamine- | Trimethylamine oxide | Singlet at 3.25 ppm | 3.26-3.27, 3.27- |
| N-oxide | 3.28 | ||
| 2-oxoglutarate | 2-Oxopentanedioate | Triplet at 3.01, 3.00 | 2.41-2.42, 2.42- |
| and 2.98 ppm; | 2.43, 2.43-2.44, | ||
| triplet at 2.44, 2.43 | 2.44-2.45, 2.97 | ||
| and 2.42 ppm | 2.98, 2.98-2.99, | ||
| 2.99-3.00, 3.00- | |||
| 3.01, 3.01-3.02 | |||
| Creatinine | 2-Imino-1-methyl-2,5-dihydro- | Singlet at 4.05 ppm; | 3.03-3.04, 3.04- |
| 1H-imidazol-4-ol | larger singlet at | 3.05, 4.06-4.07 | |
| 3.03 ppm | |||
| Taurine | 2-Aminoethanesulfonic acid | Triplet at 3.43, 3.42 | 3.23-3.24, 3.24- |
| and 3.40 ppm; | 3.25, 3.25-3.26, | ||
| larger triplet at | 3.26-3.27, 3.39- | ||
| 3.26, 3.25 and | 3.40, 3.40-3.41, | ||
| 3.24 ppm | 3.41-3.42, 3.42- | ||
| 3.43, 3.43-3.44 | |||
| Creatine | N-Carbamimidoyl-N- | Singlet at 3.92 ppm | 3.01-3.02, 3.02- |
| methylglycine | and larger singlet | 3.03, 3.91-3.92, | |
| at 3.02 ppm | 3.92-3.93 | ||
| Phosphocreatine* | N-Methyl-N-(N- | Singlet at 3.93 ppm | 3.02-3.03, 3.03- |
| phosphonocarbamimidoyl) | and larger singlet | 3.04, 3.92-3.93, | |
| glycine | at 3.03 ppm | 3.93-3.94 | |
| *The closeness between creatine and phosphocreatine explains why they are indistinguishable here. | |||
-
- a) Samples are defrosted on ice and 50 μL from each are placed in a 5 mm NMR tube and diluted to a final volume of 600 μL with phosphate buffer (0.24M sodium phosphate, pH 7.4, 0.1% sodium azide, 0.8% sodium chloride) in D2O containing 1 mM TSP (3-trimethylsilyl-1-[2,2,3,3,-2H4] propionate) as an internal standard;
- b) 1H NMR spectra are acquired for each sample at 700 MHz (Bruker Avance III spectrometer equipped with a 1H TCI cryoprobe, Bruker, Coventry, UK);
- c) For all samples a 1D NOESY pre-saturation sequence, with solvent pre-saturation during the relaxation delay (2 s) and mixing time (10 ms) is used;
- d) Two dimensional 1H NMR spectra is acquired from a single sample within each group to assist with metabolite identification;
- e) The 2D correlation spectroscopy (COSY) spectra are acquired on the same spectrometer as the 1D NMR spectra;
- f) The COSY spectra are acquired with 1.5 s solvent presaturation, a spectral width of 10 ppm (7002 Hz), and 16 or 32 transients pert, increment for 256 increments;
- g) All NMR experiments are conducted at 293K;
- h) The 1D 1H plasma spectra are imported into Matlab (MathWorks, Nantick, USA) using an RBNMR script (the RBNMR script is an open-source script published at Matlab Central which reads raw spectrometer data and imports into a Matlab-compatible form. It is published under the BSD licence and can be found at: http://uk.mathworks.com/matlabcentral/fileexchange/40332-rbnmr) then automatically phased using a method optimised for signal-dense spectra (Bao et al. 2013);
- i) Spectra with gross distortions or phasing anomalies are excluded at this stage;
- j) Spectra are baseline corrected using a 3rd order polynomial fitted to regions without peaks (Beek 2007) then aligned to the TSP peak at 0 ppm;
- k) (Optional step when the biofluid sample is a urine sample) Spectra are unit-scaled to the summed spectrum integral, excluding the water and TSP peak regions;
- l) Coarsely aligned spectra re then refined by non-linear warping to account for subtle peak shifts arising from differing sample pH, ionic strength etc. (Skov et al. 2006);
- m) Aligned spectra are sub-divided into 0.01 ppm regions (δ=start of integral region) from 0.2 to 9.6 ppm and integrated to yield 940 independent variables for each sample; and
- n) The regions covering the variable water peak (4.7 to 5.0 ppm) and urea peak (5.70 to 5.95 ppm) are excluded along with the region covering a contaminant methanol peak (3.35 to 3.38 ppm).
-
- a. Determining the concentration of at least two metabolites comprised in a biofluid sample obtained from the human test subject;
- b. Comparing the concentration of the at least two metabolites in the biofluid sample with the concentration of the same at least two metabolites in at least one reference standard obtained from a non-tumour bearing subject; and
- c. Identifying a concentration difference or no (or substantially no) concentration difference for each of the at least two metabolites in the biofluid sample relative to the reference standard;
wherein: (i) a concentration difference for each of the at least two metabolites in the biofluid sample correlates with the absence of a brain tumour correlates with the presence of a brain tumour; and/or (ii) no (or substantially no) concentration difference for each of the at least two metabolites in the biofluid sample correlates with the absence of a brain tumour.
-
- a. Determining the concentration of at least two metabolites comprised in a biofluid sample obtained from the human test subject;
- b. Comparing the concentration of the at least two metabolites in the biofluid sample with the concentration of the same at least two metabolites in at least one reference standard obtained from a tumour bearing subject; and
- c. Identifying no (or substantially no) concentration difference for each of the at least two metabolites in the biofluid sample relative to the reference standard;
wherein: (i) a concentration difference for each of the at least two metabolites in the biofluid sample correlates with the absence of a brain tumour correlates with the presence of a brain tumour; and/or (ii) no (or substantially no) concentration difference for each of the at least two metabolites in the biofluid sample correlates with the absence of a brain tumour.
- Aslakson, C. J., and F. R. Miller. 1992. Selective events in the metastatic process defined by analysis of the sequential dissemination of subpopulations of a mouse mammary tumor. Cancer Res 52:1399-1405.
- Bao, Q., J. Feng, L. Chen, F. Chen, Z. Liu, B. Jiang, and C. Liu. 2013. A robust automatic phase correction method for signal dense spectra. J Magn Reson 234:82-89.
- Beckonert, O., H. C. Keun, T. M. D. Ebbels, J. Bundy, E. Holmes, J. C. Lindon, and J. K. Nicholson. 2007. Metabolic profiling, metabolomic and metabonomic procedures for NMR spectroscopy of urine, plasma, serum and tissue extracts. Nat Protoc 2:2692-2703.
- Beek, J. D. van. 2007. matNMR: a flexible toolbox for processing, analyzing and visualizing magnetic resonance data in Matlab. J Magn Reson 187:19-26.
- Bennett, B. J., T. Q. de Aguiar Vallim, Z. Wang, D. M. Shih, Y. Meng, J. Gregory, H. Allayee, R. Lee, M. Graham, R. Crooke, P. A. Edwards, S. L. Hazen, and A. J. Lusis. 2013. Trimethylamine-N-oxide, a metabolite associated with atherosclerosis, exhibits complex genetic and dietary regulation. Cell Metab 17:49-60.
- Davis, V. W., D. E. Schiller, D. Eurich, and M. B. Sawyer. 2012. Urinary metabolomic signature of esophageal cancer and Barrett's esophagus. World J Surg Oncol 10:271.
- Fan, T. W.-M. 1996. Metabolite profiling by one- and two-dimensional NMR analysis of complex mixtures. Progress in Nuclear Magnetic Resonance Spectroscopy 28:161-219.
- Goto, M., H. Miwa, M. Shikami, N. Tsunekawa-Imai, K. Suganuma, S. Mizuno, M. Takahashi, M. Mizutani, I. Hanamura, and M. Nitta. 2014. Importance of glutamine metabolism in leukemia cells by energy production through TCA cycle and by redox homeostasis. Cancer Invest 32:241-247.
- Graesslin, O., B. S. Abdulkarim, C. Coutant, F. Huguet, Z. Gabos, L. Hsu, O. Marpeau, S. Uzan, L. Pusztai, E. A. Strom, G. N. Hortobagyi, R. Rouzier, and N. K. Ibrahim. 2010. Nomogram to predict subsequent brain metastasis in patients with metastatic breast cancer. J Clin Oncol 28:2032-2037.
- Gronwald, W., M. S. Klein, R. Zeltner, B.-D. Schulze, S. W. Reinhold, M. Deutschmann, A.-K. Immervoll, C. A. Böger, B. Banas, K.-U. Eckardt, and P. J. Oefner. 2011. Detection of autosomal dominant polycystic kidney disease by NMR spectroscopic fingerprinting of urine. Kidney Int 79:1244-1253.
- Il'yasova, D., P. Scarbrough, and I. Spasojevic. 2012. Urinary biomarkers of oxidative status. Clin Chim Acta 413:1446-1453.
- Kim, K. H., A. M. Rodriguez, P. M. Carrico, and J. A. Melendez. 2001. Potential mechanisms for the inhibition of tumor cell growth by manganese superoxide dismutase. Antioxid Redox Signal 3:361-373.
- Kim, M.-J., D.-H. Kim, W.-H. Jung, and J.-S. Koo. 2014. Expression of metabolism-related proteins in triple-negative breast cancer. Int J Clin Exp Pathol 7:301-312.
- Qie, S., C. Chu, W. Li, C. Wang, and N. Sang. 2014. ErbB2 activation upregulates
glutaminase 1 expression which promotes breast cancer cell proliferation. J Cell Biochem 115:498-509. - Saxena, M., and G. Christofori. 2013. Rebuilding cancer metastasis in the mouse. Mol Oncol 7:283-296.
- Serres, S., M. S. Soto, A. Hamilton, M. A. McAteer, W. S. Carbonell, M. D. Robson, O. Ansorge, A. Khrapitchev, C. Bristow, L. Balathasan, T. Weissensteiner, D. C. Anthony, R. P. Choudhury, R. J. Muschel, and N. R. Sibson. 2012. Molecular MRI enables early and sensitive detection of brain metastases. Proc Natl Acad Sci USA 109:6674-6679.
- Shields, J. A., C. L. Shields, H. K. Brotman, C. Carvalho, N. Perez, and R. Jr Eagle. 2001. Cancer metastatic to the orbit: the 2000 Robert M. Curts Lecture. Ophthal Plast Reconstr Surg 17:346-354.
- Skov, T., F. van den Berg, G. Tomasi, and R. Bro. 2006. Automated alignment of chromatographic data. Journal of Chemometrics 20:487-497.
- Waterman, C. L., R. A. Currie, L. A. Cottrell, J. Dow, J. Wright, C. J. Waterfield, and J. L. Griffin. 2010. An integrated functional genomic study of acute phenobarbital exposure in the rat. BMC Genomics 11:9.
- Weigelt, B., J. L. Peterse, and L. J. van t Veer. 2005. Breast cancer metastasis: markers and models. Nat Rev Cancer 5:591-602.
- Wevers, R. A., U. F. Engelke, S. H. Moolenaar, C. Bräutigam, J. G. de Jong, R. Duran, R. A. de Abreu, and A. H. van Gennip. 1999. 1H-NMR spectroscopy of body fluids: inborn errors of purine and pyrimidine metabolism. Clin Chem 45:539-548.
- Wishart, D. S., T. Jewison, A. C. Guo, M. Wilson, C. Knox, Y. Liu, Y. Djoumbou, R. Mandal, F. Aziat, E. Dong, S. Bouatra, I. Sinelnikov, D. Arndt, J. Xia, P. Liu, F. Yallou, T. Bjorndahl, R. Perez-Pineiro, R. Eisner, F. Allen, V. Neveu, R. Greiner, and A. Scalbert. 2013. HMDB 3.0—The Human Metabolome Database in 2013. Nucleic Acids Res 41:D801-D807.
- Xie, G. X., T. L. Chen, Y. P. Qiu, P. Shi, X. J. Zheng, M. M. Su, A. H. Zhao, Z. T. Zhou, and W. Jia. 2012. Urine metabolite profiling offers potential early diagnosis of oral cancer. Metabolomics 8:220-231.
- Yang, L., T. Moss, L. S. Mangala, J. Marini, H. Zhao, S. Wahlig, G. Armaiz-Pena, D. Jiang, A. Achreja, J. Win, R. Roopaimoole, C. Rodriguez-Aguayo, I. Mercado-Uribe, G. Lopez-Berestein, J. Liu, T. Tsukamoto, A. K. Sood, P. T. Ram, and D. Nagrath. 2014. Metabolic shifts toward glutamine regulate tumor growth, invasion and bioenergetics in ovarian cancer. Mol Syst Biol 10:728.
- Zeisel, S. H., K. A. daCosta, M. Youssef, and S. Hensey. 1989. Conversion of dietary choline to trimethylamine and dimethylamine in rats: dose-response relationship. J Nutr 119:800-804.
Claims (11)
Applications Claiming Priority (3)
| Application Number | Priority Date | Filing Date | Title |
|---|---|---|---|
| GBGB1509658.9A GB201509658D0 (en) | 2015-06-03 | 2015-06-03 | Method of diagnosis |
| GB1509658.9 | 2015-06-03 | ||
| PCT/GB2016/051653 WO2016193757A1 (en) | 2015-06-03 | 2016-06-03 | Method for diagnosing a brain tumour in a human |
Publications (2)
| Publication Number | Publication Date |
|---|---|
| US20180172688A1 US20180172688A1 (en) | 2018-06-21 |
| US10859576B2 true US10859576B2 (en) | 2020-12-08 |
Family
ID=53677738
Family Applications (1)
| Application Number | Title | Priority Date | Filing Date |
|---|---|---|---|
| US15/578,925 Active 2036-12-20 US10859576B2 (en) | 2015-06-03 | 2016-06-03 | Method for diagnosing a brain tumour in a human |
Country Status (5)
| Country | Link |
|---|---|
| US (1) | US10859576B2 (en) |
| EP (1) | EP3304083B1 (en) |
| ES (1) | ES2902881T3 (en) |
| GB (1) | GB201509658D0 (en) |
| WO (1) | WO2016193757A1 (en) |
Families Citing this family (2)
| Publication number | Priority date | Publication date | Assignee | Title |
|---|---|---|---|---|
| CN106556656B (en) * | 2016-10-26 | 2019-05-14 | 南京医科大学 | A plasma metabolic small molecule marker associated with cholelithiasis and its application |
| US20240077439A1 (en) * | 2022-08-31 | 2024-03-07 | Laboratory Corporation Of America Holdings | Methods and Systems for Measuring Citrate and Creatinine Levels by NMR Spectroscopy |
Citations (8)
| Publication number | Priority date | Publication date | Assignee | Title |
|---|---|---|---|---|
| US20040224337A1 (en) | 2003-03-04 | 2004-11-11 | Erik Foehr | Use of biomolecular targets in the treatment and visualization of tumors |
| WO2006047298A2 (en) | 2004-10-21 | 2006-05-04 | The Penn State Research Foundation | Eph receptor tumor biomarkers |
| WO2009087689A2 (en) | 2008-01-07 | 2009-07-16 | Council Of Scientific & Industrial Research | Novel primers for identification of astrocytoma, it's grades and glioblastoma prognosis |
| CN103033580A (en) | 2013-01-06 | 2013-04-10 | 浙江中烟工业有限责任公司 | Detecting method for lung cancer characteristic metabolite fingerprint spectrum in urine |
| WO2013099827A1 (en) | 2011-12-28 | 2013-07-04 | 国立大学法人山口大学 | Diagnostic method and prognosis prediction method for brain disorders and kit for use in said methods |
| WO2013117930A2 (en) | 2012-02-07 | 2013-08-15 | Isis Innovation Limited | Diagnosing multiple sclerosis |
| WO2013163431A1 (en) | 2012-04-25 | 2013-10-31 | Sanford-Burnham Medical Research Institute | Diagnosis and treatment of brain tumor |
| US20140193920A1 (en) | 2013-01-10 | 2014-07-10 | Beth Israel Deaconess Medical Center, Inc. | Metabolomics of human biological fluids identify signatures of malignant glioma |
-
2015
- 2015-06-03 GB GBGB1509658.9A patent/GB201509658D0/en not_active Ceased
-
2016
- 2016-06-03 EP EP16728085.8A patent/EP3304083B1/en active Active
- 2016-06-03 WO PCT/GB2016/051653 patent/WO2016193757A1/en not_active Ceased
- 2016-06-03 ES ES16728085T patent/ES2902881T3/en active Active
- 2016-06-03 US US15/578,925 patent/US10859576B2/en active Active
Patent Citations (8)
| Publication number | Priority date | Publication date | Assignee | Title |
|---|---|---|---|---|
| US20040224337A1 (en) | 2003-03-04 | 2004-11-11 | Erik Foehr | Use of biomolecular targets in the treatment and visualization of tumors |
| WO2006047298A2 (en) | 2004-10-21 | 2006-05-04 | The Penn State Research Foundation | Eph receptor tumor biomarkers |
| WO2009087689A2 (en) | 2008-01-07 | 2009-07-16 | Council Of Scientific & Industrial Research | Novel primers for identification of astrocytoma, it's grades and glioblastoma prognosis |
| WO2013099827A1 (en) | 2011-12-28 | 2013-07-04 | 国立大学法人山口大学 | Diagnostic method and prognosis prediction method for brain disorders and kit for use in said methods |
| WO2013117930A2 (en) | 2012-02-07 | 2013-08-15 | Isis Innovation Limited | Diagnosing multiple sclerosis |
| WO2013163431A1 (en) | 2012-04-25 | 2013-10-31 | Sanford-Burnham Medical Research Institute | Diagnosis and treatment of brain tumor |
| CN103033580A (en) | 2013-01-06 | 2013-04-10 | 浙江中烟工业有限责任公司 | Detecting method for lung cancer characteristic metabolite fingerprint spectrum in urine |
| US20140193920A1 (en) | 2013-01-10 | 2014-07-10 | Beth Israel Deaconess Medical Center, Inc. | Metabolomics of human biological fluids identify signatures of malignant glioma |
Non-Patent Citations (16)
| Title |
|---|
| An, Y.J., et al., "An NMR Metabolomics Approach for the Diagonosis of Leptomeningeal Carcinomatosis in Lung Adenocarcinoma Cancer Patients," International Journal of Cancer 136(1):162-171, Jan. 2015. |
| Hattingen, E., et al., "Evaluation of Optimal Echo Time for 1H-Spectroscopic Imaging of Brain Tumors at 3 Tesla," Journal of Magnetic Resonance Imaging 26(2):427-431, Aug. 2007. |
| Hattingen, E., et al., "Myo-Inositol: A Marker of Reactive Astrogliosis in Glial Tumors?" NMR in Biomedicine 21(3):233-241,Mar. 2008. |
| Hwang, Y.-F., et al., "Differentiation Among Metastatic Brain Tumors, Radiation Necroses, and Brain Abscesses Using Proton Magnetic Resonance Spectroscopy," Kaohsiung Journal of Medical Sciences 20(9):437-442, Sep. 2004. |
| International Preliminary Report on Patentability dated Dec. 6, 2017, issued in International Application No. PCT/GB2016/051653, filed Jun. 3, 2016, 8 pages. |
| International Search Report and Written Opinion dated Sep. 8, 2016, issued in International Application No. PCT/GB2016/051653, filed Jun. 3, 2016, 13 pages. |
| Kanno, H., et al., "Transforming Growth Factors in Urine From Patients With Primary Brain Tumors," Journal of Neurosurgery 68:775-780, May 1988. |
| Kinoshita, Y., et al., "Proton Magnetic Resonance Spectroscopy of Brain Tumors: An In Vitro Study," Neurosurgery 35(4):606-614, Oct. 1994. |
| Manton, D.J., et al., "Determination of Proton Metabolite Concentrations and Relaxation Parameters in Normal Human Brain and Intracranial Tumours," NMR in Biomedicine 8(3):104-112, May 1995. |
| Petrik, Vladimir et al. "OMICS and brain tumour biomarkers." British Journal of Neurosurgery (2006) 20 275-280. (Year: 2006). * |
| Rezvanizadeh, A., et al., "The Effects of Voxel Localization and Time of Echo on the Diagnostic Accuracy of Cystic Brain Tumors in 3 Tesla Magnetic Resonance Spectroscopy," Iranian Journal of Radiology 9(4):195-201, Nov. 2012. |
| Search Report dated Feb. 29, 2016, issued in Application No. GB 1509658.9, filed Jun. 3, 2015, 6 pages. |
| Smith, E.R., et al., "Urinary Biomarkers Predict Brain Tumor Presence and Response to Therapy," Clinical Cancer Research 14(8):2378-2386, Apr. 2008. |
| Ueda, T., et al., "Clinical Value of the Sequential Study of the Uric Acid in CSF in Patients With Cerebral Diseases: Part 1. Brain Tumor and the Effect of Irradiation," No to Shinkei = Brain and Nerve 36(3):255-260, Mar. 1984. |
| Wilson, M., et al., "High Resolution Magic Angle Spinning 1H NMR of Childhood Brain and Nervous System Tumours," Molecular Cancer 8(6):11 pages, Feb. 2009. |
| Wright, Alan J. et al. "Ex-vivo HRMAS of adult brain tumours: metabolite quantification and assignment of tumour biomarkers." Molecular Cancer (2010) 9 66. (Year: 2010). * |
Also Published As
| Publication number | Publication date |
|---|---|
| EP3304083B1 (en) | 2021-09-08 |
| GB201509658D0 (en) | 2015-07-15 |
| US20180172688A1 (en) | 2018-06-21 |
| EP3304083A1 (en) | 2018-04-11 |
| ES2902881T3 (en) | 2022-03-30 |
| WO2016193757A1 (en) | 2016-12-08 |
Similar Documents
| Publication | Publication Date | Title |
|---|---|---|
| Wang et al. | 1H-NMR based metabonomic profiling of human esophageal cancer tissue | |
| Lutz et al. | Inflammatory multiple-sclerosis plaques generate characteristic metabolic profiles in cerebrospinal fluid | |
| Zheng et al. | NMR-based metabolomics analysis identifies discriminatory metabolic disturbances in tissue and biofluid samples for progressive prostate cancer | |
| Vermathen et al. | 1H HR-MAS NMR based metabolic profiling of cells in response to treatment with a hexacationic ruthenium metallaprism as potential anticancer drug | |
| Eisner et al. | Learning to predict cancer-associated skeletal muscle wasting from 1H-NMR profiles of urinary metabolites | |
| Michálková et al. | Diagnosis of pancreatic cancer via 1 H NMR metabolomics of human plasma | |
| CN101806805A (en) | Blood serum metabolism biological marker for lung cancer patients | |
| Fujii et al. | Metabolic profile alterations in the postmortem brains of patients with schizophrenia using capillary electrophoresis-mass spectrometry | |
| Fujimura et al. | Mass spectrometry-based metabolic profiling of gemcitabine-sensitive and gemcitabine-resistant pancreatic cancer cells | |
| Kim et al. | Metabolomic screening and star pattern recognition by urinary amino acid profile analysis from bladder cancer patients | |
| Gui et al. | Identification and validation of volatile organic compounds in bile for differential diagnosis of perihilar cholangiocarcinoma | |
| Chen et al. | Study on metabonomic characteristics of human lung cancer using high resolution magic‐angle spinning 1H NMR spectroscopy and multivariate data analysis | |
| Larkin et al. | Early diagnosis of brain metastases using a biofluids-metabolomics approach in mice | |
| US20180372716A1 (en) | Diagnosing multiple sclerosis | |
| JP2017520774A (en) | L-2-Hydroxyglutaric acid and stress-induced metabolism | |
| Wang et al. | Nesfatin-1 is a potential diagnostic biomarker for gastric cancer | |
| US10859576B2 (en) | Method for diagnosing a brain tumour in a human | |
| EP4414709A1 (en) | Diagnostic biomarker for cancer and use thereof | |
| Liu et al. | An integrating strategy for serum metabolomics and microarray analysis to expand the understanding of diet-induced obesity | |
| KR20240025222A (en) | Protein biomarker panel for early detection of hepatocellular carcinoma based on mass spectrometry | |
| US20140162903A1 (en) | Metabolite Biomarkers For Forecasting The Outcome of Preoperative Chemotherapy For Breast Cancer Treatment | |
| Imperiale et al. | Metabolomic pattern of childhood neuroblastoma obtained by 1H‐high‐resolution magic angle spinning (HRMAS) NMR spectroscopy | |
| CN110214272B (en) | Aerobic glycolysis determination by positional isotope discrimination | |
| Amigó-Correig et al. | Anti-obesity sodium tungstate treatment triggers axonal and glial plasticity in hypothalamic feeding centers | |
| Jirásko et al. | Pola nski |
Legal Events
| Date | Code | Title | Description |
|---|---|---|---|
| FEPP | Fee payment procedure |
Free format text: ENTITY STATUS SET TO UNDISCOUNTED (ORIGINAL EVENT CODE: BIG.); ENTITY STATUS OF PATENT OWNER: LARGE ENTITY |
|
| AS | Assignment |
Owner name: OXFORD UNIVERSITY INNOVATION LIMITED, UNITED KINGDOM Free format text: ASSIGNMENT OF ASSIGNORS INTEREST;ASSIGNORS:SIBSON, NICOLA R.;ANTHONY, DANIEL C.;DICKENS, ALEX M.;AND OTHERS;SIGNING DATES FROM 20171211 TO 20180122;REEL/FRAME:046137/0444 Owner name: OXFORD UNIVERSITY INNOVATION LIMITED, UNITED KINGD Free format text: ASSIGNMENT OF ASSIGNORS INTEREST;ASSIGNORS:SIBSON, NICOLA R.;ANTHONY, DANIEL C.;DICKENS, ALEX M.;AND OTHERS;SIGNING DATES FROM 20171211 TO 20180122;REEL/FRAME:046137/0444 |
|
| STPP | Information on status: patent application and granting procedure in general |
Free format text: DOCKETED NEW CASE - READY FOR EXAMINATION |
|
| STPP | Information on status: patent application and granting procedure in general |
Free format text: NON FINAL ACTION MAILED |
|
| STPP | Information on status: patent application and granting procedure in general |
Free format text: RESPONSE TO NON-FINAL OFFICE ACTION ENTERED AND FORWARDED TO EXAMINER |
|
| STPP | Information on status: patent application and granting procedure in general |
Free format text: FINAL REJECTION MAILED |
|
| STPP | Information on status: patent application and granting procedure in general |
Free format text: PUBLICATIONS -- ISSUE FEE PAYMENT VERIFIED |
|
| STCF | Information on status: patent grant |
Free format text: PATENTED CASE |
|
| CC | Certificate of correction | ||
| MAFP | Maintenance fee payment |
Free format text: PAYMENT OF MAINTENANCE FEE, 4TH YEAR, LARGE ENTITY (ORIGINAL EVENT CODE: M1551); ENTITY STATUS OF PATENT OWNER: LARGE ENTITY Year of fee payment: 4 |