US10761052B2 - Method of recalibrating a device for assessing concentration of at least one analyte ion in a liquid - Google Patents
Method of recalibrating a device for assessing concentration of at least one analyte ion in a liquid Download PDFInfo
- Publication number
- US10761052B2 US10761052B2 US15/558,982 US201615558982A US10761052B2 US 10761052 B2 US10761052 B2 US 10761052B2 US 201615558982 A US201615558982 A US 201615558982A US 10761052 B2 US10761052 B2 US 10761052B2
- Authority
- US
- United States
- Prior art keywords
- ion
- calibration
- ions
- interference
- recalibration
- Prior art date
- Legal status (The legal status is an assumption and is not a legal conclusion. Google has not performed a legal analysis and makes no representation as to the accuracy of the status listed.)
- Active, expires
Links
Images


Classifications
-
- G—PHYSICS
- G01—MEASURING; TESTING
- G01N—INVESTIGATING OR ANALYSING MATERIALS BY DETERMINING THEIR CHEMICAL OR PHYSICAL PROPERTIES
- G01N27/00—Investigating or analysing materials by the use of electric, electrochemical, or magnetic means
- G01N27/26—Investigating or analysing materials by the use of electric, electrochemical, or magnetic means by investigating electrochemical variables; by using electrolysis or electrophoresis
- G01N27/416—Systems
- G01N27/4163—Systems checking the operation of, or calibrating, the measuring apparatus
-
- G—PHYSICS
- G01—MEASURING; TESTING
- G01N—INVESTIGATING OR ANALYSING MATERIALS BY DETERMINING THEIR CHEMICAL OR PHYSICAL PROPERTIES
- G01N27/00—Investigating or analysing materials by the use of electric, electrochemical, or magnetic means
- G01N27/26—Investigating or analysing materials by the use of electric, electrochemical, or magnetic means by investigating electrochemical variables; by using electrolysis or electrophoresis
- G01N27/28—Electrolytic cell components
- G01N27/30—Electrodes, e.g. test electrodes; Half-cells
- G01N27/333—Ion-selective electrodes or membranes
-
- G—PHYSICS
- G06—COMPUTING OR CALCULATING; COUNTING
- G06N—COMPUTING ARRANGEMENTS BASED ON SPECIFIC COMPUTATIONAL MODELS
- G06N3/00—Computing arrangements based on biological models
- G06N3/02—Neural networks
- G06N3/08—Learning methods
- G06N3/086—Learning methods using evolutionary algorithms, e.g. genetic algorithms or genetic programming
Definitions
- the present invention relates to a method of recalibrating a device for assessing concentration of at least one analyte ion in a liquid.
- Ion Selective Electrodes are normally based on ionophores designed for complexing, interacting, and holding an analyte in a molecular cavity. These interactions are actually non-specific so that interference from other undesired analytes of a similar size and charge commonly appear.
- approaches using an ISE array with neural network algorithms, such as Back-Propagation Neural Network (BPNNs), to solve the problem of cross-interference between ISEs have been implemented.
- BPNNs Back-Propagation Neural Network
- a device as described in the applicant's prior application PCT/AU2011/001663, for assessing concentration of analyte ions has been employed to attempt to simultaneously determine the major ions in environmental samples.
- PCT/AU2011/001663 both the sensitivity and selectivity of the ISEs to the major selected ions gradually degrade over time.
- the entire content of PCT/AU2011/001663 is incorporated herein by way of reference.
- sensitivity of the ISEs refers to each of the ISEs' sensitivity to the selected analyte ion in the sample and “selectivity” refers to the ability to determine the selected analyte ion in the sample when taking into consideration interference from the interfering ions in the sample.
- one aspect of the present invention provides a method of recalibrating a device for assessing concentration of at least one analyte ion in a liquid, the device having: a plurality of ion selective electrodes (ISEs) each of which generate a signal in response to sensing a selected ion in the liquid; and a data processing unit implementing a neural network algorithm that has been trained to calculate ion interference between the selected ion and other ions in the liquid sensed at one of the electrodes and/or electrode interference between ones of the electrodes sensing a same selected ion based on a result of a comparison of training data indicative of known ionic concentrations applied to the neural network algorithm and the known ionic concentrations, the method includes: contacting, with the plurality of electrodes, more than one recalibrating sample having a first selected calibration ion and a first interference calibration ion of known ionic concentrations, respectively, for a first one of the plurality of electrodes and having a second selected calibration
- the recalibration algorithm is a Genetic Algorithm (GA).
- GA Genetic Algorithm
- the GAs' optimization principle relies on the biological theory of survival of the fittest that explains how genes on the chromosome vary by several biological means, such as chromosome encoding and decoding, selection for offspring, crossover and mutation to adapt to the particular environment etc.
- the method further includes simulating the response of the first electrode by simulating a first selected calibration ion potential response value of the first electrode caused by the first selected calibration ion and simulating an first interference calibration ion potential response difference value of the first electrode caused by the first interference calibration ion.
- the embodiment further includes simulating the first selected calibration ion potential response value includes determining a concentration of the first selected calibration ion in the more than one recalibration sample.
- simulating the first interference calibration ion potential response value includes determining a concentration of the first interference calibration ion in the more than one recalibration sample.
- simulating the first selected calibration ion potential response value and simulating the first interference calibration ion potential response value includes determining said concentration of the first selected calibration ion and said concentration of the first interference calibration ion in four of said recalibration samples. That is, the recalibration algorithm simulates the response of the first electrode based on a comparison of the recalibration training data generated from measuring four standard samples and the known ionic concentration of the first and second selected calibration ions and the first and second interference calibration ions in the four standard samples. It will be appreciated by those persons skilled in the art that other number of samples can be used to simulate the response, such as 6.
- each of the four recalibrating samples have known ionic concentrations of the first and second selected calibration ions and the first and second interference calibration ions, respectively. For example, see table 1 below.
- the method further includes simulating the response of the second electrode by simulating a second selected calibration ion potential response value of the second electrode caused by the second calibration ion and simulating a second interference calibration ion potential response difference value of the second electrode caused by the second interference calibration ion.
- the embodiment further includes simulating the second selected calibration ion potential response value includes determining a concentration of the second selected calibration ion in the more than one recalibration sample.
- simulating the second interference calibration ion potential response value includes determining a concentration of the second interference calibration ion in the more than one recalibration sample.
- simulating the second selected calibration ion potential response value and simulating the second interference calibration ion potential response value includes determining said concentration of the second selected calibration ion and said concentration of the second interference calibration ion in four of said recalibration samples. That is, the recalibration algorithm simulates the response of the second electrode based on a comparison of the recalibration training data generated from measuring four standard samples and the known ionic concentration of the first and second selected calibration ions and the first and second interference calibration ions in the four standard samples. It will be appreciated by those persons skilled in the art that other number of samples can be used to simulate the response, such as 6.
- the more than one recalibrating sample is four recalibrating samples, each having known ionic concentrations of the first and second selected calibration ions and the first and second interference calibration ions, respectively.
- the first selected calibration ion is the second interference calibration ion and the second selected calibration ion is the first interference calibration ion.
- the first selected calibration ion and the second interference calibration ion are NO3 ions and the second selected calibration ion and the first interference calibration ion are Cl ions.
- V ISE SEL the potential response value of the first electrode for sensing the first or the second selected calibration ion
- V pC SEL the potential value of the first electrode caused by the first or the second selected calibration ion
- ⁇ V pC INT the potential difference value of the first electrode caused by the first or the second interference calibration ion
- pSEL the concentration of the first or the second selected calibration ion (unit: ⁇ Ig M)
- pINT the concentration of the first or the second interference calibration ion (unit: ⁇ Ig M)
- P 1 , P 2 , P 3 and P 4 parameters to be determined
- the method includes recalibration algorithm determining and optimising the parameters P 1 , P 2 , P 3 and P 4 based on the known ionic concentrations of the first and/or the second selected calibration ion and the first and/or the second interference calibration ion in the more than one recalibration sample.
- the parameters P 1 and P 2 are determined based on various ionic concentrations of the first or the second interference ions in the more than one recalibration sample with a constant ionic concentration of the first or the selected calibration ions, respectively.
- the parameters P 3 and P 4 are determined based on the known ionic concentrations of the first or the second selected ions in the more than one recalibration sample.
- the method further includes determining and optimising the parameters P 1 , P 2 , P 3 and P 4 by applying the above mentioned Genetic Algorithm to the parameters P 1 , P 2 , P 3 and P 4 .
- simulating the response at the first electrode for NO 3 ions can be expressed as:
- V ISE NO 3 the ⁇ ⁇ potential ⁇ ⁇ response ⁇ ⁇ value ⁇ ⁇ of ⁇ ⁇ the ⁇ ⁇ first ⁇ ⁇ electrode ⁇ ⁇ for ⁇ ⁇ sensing ⁇ ⁇ the ⁇ ⁇ NO 3 ⁇ ⁇ ion ;
- V pC NO 3 the ⁇ ⁇ potential ⁇ ⁇ value ⁇ ⁇ of ⁇ ⁇ the ⁇ ⁇ first ⁇ ⁇ electrode ⁇ ⁇ caused ⁇ ⁇ by ⁇ ⁇ the ⁇ ⁇ NO 3 ⁇ ⁇ ion ;
- ⁇ V pC Cl the potential difference value of the first electrode caused by the Cl ion;
- pNO 3 the concentration of the NO 3 ion (unit: ⁇ Ig M);
- pCl the concentration of the Cl ion (unit: ⁇ Ig M); and
- P 1 , P 2 , P 3 and P 4 parameters to be determined
- simulating the response at the first electrode for NO 3 ions can be expressed as:
- V ISE NO 3 35.7 * p ⁇ NO 3 + 246.8 + 0.16 * e 1.35 * ( pNO 3 - pCl )
- simulating the response at the second electrode for Cl ions can be expressed as:
- V ISE Cl the potential response value of the second electrode for sensing the Cl ion
- V pC Cl the potential value of the second electrode caused by the Cl ion
- pC NO 3 the ⁇ ⁇ potential ⁇ ⁇ difference ⁇ ⁇ value ⁇ ⁇ of ⁇ ⁇ the ⁇ ⁇ second ⁇ ⁇ electrode ⁇ ⁇ caused ⁇ ⁇ by ⁇ ⁇ the ⁇ ⁇ NO 3 ⁇ ⁇ ion ;
- pNO 3 the concentration of the NO 3 ion (unit: ⁇ Ig M);
- the mathematical equations are developed to describe the characteristics of the ISE's response, which are not only based on the response of the ISE to their related ion, but also to that of the interfering ion.
- the developed mathematical equations can be used to simulate the response values of the array of ISEs, and to determine the concentrations of analyte ions from unknown samples.
- the parameters in the equations are optimized using a Genetic Algorithm (GA).
- GA Genetic Algorithm
- the parameters are optimised to match the response characteristics of the ISE array.
- the parameters' values in the equations are adjustable following the degradation of the sensitivity and selectivity of the ISEs.
- the equations it is possible to measure only a couple of selected standard solutions to calculate the parameters in order to recalibrate the ISE array system for determination. That is, instead of using the neural network algorithm, such as the exemplary BPNN, the mathematical equations of the recalibration algorithm are used to simulate the characteristics of the ISE array's response, including the sensitivity and selectivity.
- the mathematical equations of the recalibration algorithm can be used to simulate the response values of ISE array, and to determine the analyte ions' concentrations from unknown samples.
- the ISE array can be automatically recalibrated using the recalibration algorithm implementing Genetic Algorithm (GA).
- the ISEs are an array of Prussian blue modified Carbon Paste Electrodes (PB-CPE).
- PB-CPE Prussian blue modified Carbon Paste Electrodes
- E Electronic Tongue
- the above neural network algorithm is an example of a pattern recognition algorithm or technique which, in this case, is used to improve prediction accuracy in, for example, the foodstuff industry and for environmental assessments.
- the pattern recognition technique has been developed to improve the pattern recognition accuracy of Electronic Tongue (ET) systems.
- the above device Using input data from the ISE array, the above device is able to avoid interference from undesired ions to offer high prediction accuracy and simultaneously determine multiple free ions in water samples.
- the Electronic Tongue system can be used for online in situ assessment of water quality and can be employed as a real time nutrient monitoring system for analysis of irrigation water quality for agronomy and horticulture. As described, however, ET systems for agronomy and horticulture may not be used for a significant period of time which degrades the sensitivity and selectivity of the ISE array.
- the sensor electrode arrays in an ET system contain a variety of different working and reference electrodes and either the differences in potential or current between reference and working electrodes are utilized as data for the pattern recognition techniques.
- the device is particularly suitable for assessing the concentration of at least one analyte ion in a liquid including a mixture of ions.
- the neural network compensates for ion interference and/or electrode interference, the, device allows one or more ions to be accurately assessed even in the presence of other ions.
- a method of recalibrating a device for assessing concentration of at least one analyte ion in a liquid having: a plurality of ion selective electrodes (ISEs) each of which generate a signal in response to sensing a selected ion in the liquid; and a data processing unit implementing a neural network algorithm that has been trained to calculate ion interference between the selected ion and other ions in the liquid sensed at one of the electrodes and/or electrode interference between ones of the electrodes sensing a same selected ion based on a result of a comparison of training data indicative of known ionic concentrations applied to the neural network algorithm and the known ionic concentrations, the method includes: contacting, with the plurality of electrodes, more than one recalibrating sample having n selected calibration ions and a plurality of interference calibration ions of known ionic concentrations, respectively, whereby each of the n selected calibration ions correspond to ones of the plurality
- the method further includes simulating the response of a first electrode in the plurality of electrodes by simulating a first selected calibration ion potential response value of the first electrode caused by the first selected calibration ion and simulating a first interference calibration ion potential response difference value of the first electrode caused by the plurality of interference calibration ions. Furthermore, in the embodiment, simulating the first selected calibration ion potential response value includes determining a concentration of the first selected calibration ion in the more than one recalibration sample and simulating the first interference calibration ion potential response value includes determining a concentration of each of the plurality of interference calibration ions in the more than one recalibration sample.
- simulating the first selected calibration ion potential response value and simulating the first interference calibration ion potential response value includes determining the concentration of the first selected calibration ion and the concentration of the plurality of interference calibration ions in five recalibration samples.
- the method further includes simulating the response of a second electrode in the plurality of electrodes by simulating a second selected calibration ion potential response value of the second electrode caused by the second calibration ion and simulating a second interference calibration ion potential response difference value of the second electrode caused by the plurality of interference calibration ions. Furthermore, in the embodiment, simulating the second selected calibration ion potential response value includes determining a concentration of the second selected calibration ion in the more than one recalibration sample and simulating the second interference calibration ion potential response value includes determining a concentration of the plurality of interference calibration ions in the more than one recalibration sample.
- simulating the second selected calibration ion potential response value and simulating the second interference calibration ion potential response value includes determining the concentration of the second selected calibration ion and the concentration of the plurality of interference calibration ions in five recalibration samples.
- the n selected calibration ions of known ionic concentration are four selected calibration ions which correspond to four of the plurality of electrodes.
- the plurality of interference calibration ions includes the four selected calibration ions, which include: Sodium (Na), Potassium (K), Calcium (Ca) and Magnesium (Mg) ions. It will be appreciated by those persons skilled in the art that other calibration ions are envisaged for use in the recalibration of the device.
- simulating the response at each of the plurality of electrodes can be expressed as:
- V ISE the potential response value of the first electrode (ISE) (Unit: mV)
- VpC Selected the potential value caused by the first selected calibration ion (Unit: mV)
- ⁇ V the potential difference of each one of the plurality of electrodes ISE's response caused by each of the plurality of interference calibration ions (Unit: mV)
- pC selected the concentration of the first selected calibration ion (Unit: ⁇ Ig M)
- pC Interferon i the concentration of the i th one of the interference calibration ions (Unit: ⁇
- the method further includes the recalibration algorithm determining and optimising the parameters a, b, c i and d i based on the known ionic concentrations of the n selected calibration ions and the plurality of interference calibration ions in the more than one recalibration sample.
- the parameters a and b are determined based on various ionic concentrations of the n selected calibration ions and the plurality of interference ions in the more than one recalibration sample, respectively
- the parameters c i and d i are determined based on various ionic concentrations of the plurality of interference ions in the more than one recalibration sample with constant ionic concentrations of the n selected calibration ions, respectively.
- the parameters in the latter equations are also optimized using a Genetic Algorithm (GA) and the recalibration algorithm is a Genetic Algorithm.
- GA Genetic Algorithm
- FIG. 1 shows a block diagram of a method of recalibrating a device for assessing concentration of at least one analyte ion in a liquid, according to an embodiment of the invention
- FIG. 2A shows interference characteristics of an ISE of the device configured to simulate a response value to sensing a NO 3 ion in a recalibration sample, according to an embodiment of the invention
- FIG. 2B shows interference characteristics of an ISE of the device configured to simulate a response value to sensing a Cl ion in a recalibration sample, according to an embodiment of the invention
- FIG. 3A shows the potential difference value in the NO 3 ISEs' response based on the sensed concentration of Cl and NO 3 ions, according to an embodiment of the invention
- FIG. 3B shows the potential difference value in the Cl ISEs' response based on the sensed concentration of Cl and NO 3 ions, according to an embodiment of the invention
- FIG. 4 shows calibration and recalibration results of the device, according to an embodiment of the invention
- FIG. 5 shows further calibration and recalibration results of the device, according to an embodiment of the invention.
- FIG. 6 is a flow chart of a method of recalibrating a device for assessing concentration of at least one analyte ion in a liquid, according to an embodiment of the invention
- FIG. 7 is a flow chart of a method of recalibrating a device for assessing concentration of at least one analyte ion in a liquid, according to another embodiment of the invention.
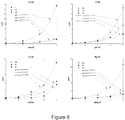
- FIG. 8 shows interference characteristics of ISEs of the device configured to simulate a response value to sensing a ions in a recalibration sample, according to an embodiment of the invention
- FIG. 9 shows the simulated potential difference value in the ISEs' response according to an embodiment of the invention.
- FIG. 10 shows calibration and recalibration results of the device, according to an embodiment of the invention.
- FIG. 11 shows further calibration and recalibration results of the device, according to an embodiment of the invention.
- FIG. 12 shows further calibration and recalibration results of the device, according to an embodiment of the invention.
- FIG. 1 shows a block diagram 10 of the device for assessing the concentration of at least one analyte ion in a liquid in more detail.
- the device includes a plurality of ion selective electrodes (ISEs) each of which generate a signal in response to sensing a selected ion in a liquid, and a multi-channel signal recorder that send signals to a data processing unit.
- ISEs ion selective electrodes
- the data processing unit implements a neural network algorithm that has been trained to calculate ion interference between the selected ion and other ions in the liquid sensed at one of the electrodes and/or electrode interference between ones of the electrodes sensing a same selected ion based on a result of a comparison of training data indicative of known ionic concentrations applied to the neural network algorithm and the known ionic concentrations.
- the device compensates for ion interference and/or electrode interference and assesses the concentration of the analyte ions in the liquid on the basis of a compensated output from the neural network algorithm
- the method 12 shown in FIG. 6 for recalibrating the device includes the steps of: contacting 14 , with the plurality of electrodes, more than one recalibrating sample having a first selected calibration ion and a first interference calibration ion of known ionic concentrations, respectively, for a first one of the plurality of electrodes and having a second selected calibration ion and a second interference calibration ion of known ionic concentrations, respectively, for a second one of the plurality of electrodes.
- the data processing unit of the embodiment is further configured for: receiving 16 a signal from each of the electrodes in response to sensing an ionic concentration of the first and second selected calibration ions and the first and second interference calibration ions in the more than one recalibrating sample; simulating 18 a response of each of the plurality of electrodes by applying the signal as recalibration training data to a recalibration algorithm that has been trained to simulate the response based on a comparison of the recalibration training data and the known ionic concentration of the first and second selected calibration ions and the first and second interference calibration ions; and recalibrating 20 the device using output data from the recalibration algorithm as the training data of the neural network algorithm.
- the ISEs of the device of FIG. 1 are an array of solid state electrodes comprising Prussian Blue modified Carbon Paste Electrodes (PB-CPE).
- PB-CPE Prussian Blue modified Carbon Paste Electrodes
- the recalibrating samples contacted against the PB-CPEs have NO 3 and Cl ions of known ionic concentrations.
- FIG. 2A shows the plurality of electrodes being applied to determine NO 3 concentrations in the presence of Cl and
- FIG. 2B shows the plurality of electrodes being applied to determine Cl concentrations in the presence of NO 3 . That is, the ISEs of the embodiment are used to sense Cl and NO 3 concentrations in the presence of cross-interference to perform the method of recalibration. Table 1 below shows the known concentration of four recalibration samples.
- Prussian blue (PB) electrodes or, alternatively, iron (III) hexacyanoferrate (II) electrodes are an inorganic polycrystal with well-known electrochromic and electrocatalytical capabilities.
- Mixing PB with graphite powder to prepare Carbon Paste (CP) is a cheap, simple and effective mixing technique to create the electrode body.
- NO 3 ions are found in common nitrogenous compounds that result from the natural processes of the nitrogen cycle.
- anthropogenic sources, such as fertilizers and detergents have greatly increased their nitrate concentrations in potable water supplies, particularly groundwater.
- Chloride (Cl) is a major anionic constituent of surface and groundwater, and concentrations vary widely between water. Therefore, in an example, understanding the co-relationship between the ISEs and ions of Cl and NO 3 can improve the accuracy of predicting these two ions for monitoring water quality.
- Iron (III) ferrocyanide powder e.g. Sigma-Aldrich
- Graphite powder e.g. Aldrich
- This powder mixture was transferred to an agate mortar and mixed thoroughly for 5 minutes with 20 wt. % mineral oil (e.g. Sigma-Aldrich).
- the homogeneous paste was placed in the electrode holders, which were made from 10-100 ⁇ L pipette tips (e.g. Sigma-Aldrich), connected with a copper cable and sealed with epoxy (e.g. Araldite).
- the electrode paste surface was smoothed onto a glass plate. The geometric diameter of the electrode surface was 5 mm.
- the ISE array contained an Ag/AgCl reference electrode and 2 PB-CPEs.
- the ion-sensitive membranes were prepared by adding a solution (30 ⁇ L) drop-wise of the formulation which consisted of: chloride-selective membrane: 2.0 wt. % of chloride ionophore (ETH 9009, Fluka), 0.05 wt. % of ionic additive (TDMACl, Fluka), 64.95 wt. % of plasticizer (Bis(2-ethylhexyl) sebacate, Fluka) and 33 wt. % of PVC (Fluka); nitrate-selective membrane: 1.0 wt.
- nitrate ionophore Naitrate Ionophore V, Fluka
- TDMACl 0.6 wt. % of ionic additive
- oNOPE 65.6 wt. % of plasticizer
- PVC 32.8 wt. % of PVC [25]. 400 mg of these chemicals were mixed into 3 mL of tetrahydrofuran (THF, from Fluka).
- the NO 3 ISE experiences significant interference from Cl, HCO 3 and CO 3 .
- the Cl ISE experiences significant interference only from NO 3 .
- the interfering ions HCO 3 and CO 3 can be reduced by lowering the pH to under 4. Therefore, background buffer solution, 0.1M sodium sulfate and 1.25 mM sulfuric acid, where pH was adjusted to 3.2 (measured by an Orion pH electrode), was used to eliminate the interference from hydrogen carbonate and carbonate. There is no significant interference from sulfate to either of the two ISEs tested. All working standard solutions were prepared daily and stored in polyethylene containers. The laboratory-based instrument IC served to confirm the concentrations of these two ions for each solution.
- the potentiometric system consisted of 4 pH amplifiers (ADInstruments Co.) applied as signal amplifiers while the PowerLab (ADInstruments Co.) served to interface the computer with the amplifiers.
- Chart5 for Windows software was used for the data acquisition and filtering phases. Data processing and analysis was undertaken in Matlab R2012b using the Statistical Analysis and neural network toolboxes. Microsoft Excel 2010 was applied for data recording and searching the regression lines.
- SPSS 20 for Windows generated the Orthogonal Experimental Design and Pearson correlation coefficients for interference analysis.
- the electrodes were connected to electronic amplifiers, sharing the same measuring conditions that included: the reference electrode and grounded earth.
- a 10 Hz low-pass digital filter eliminated the noise caused by signal granularity generated by electrodes.
- One Magnetic Stirrer IEC, C876083V
- spin bar and several beakers (Schott Duran 250 mL) were used for sample and standard preparation.
- the detection limit and linear detection range were estimated for each ISE in the array of electrodes using single ion standard solutions (NaCl and KNO 3 ) and each solution was measured in triplicate.
- the detection limit and linear response range were calculated according to the IUPAC recommendations. Both the Cl ISE and NO 3 ISE have a detection limit of 10 ⁇ M, and a linear response range of 0.1 mM to 0.1M.
- the slopes of the calibration curves for Cl-ISE and NO 3 -ISE were 37.8 and 35.7, respectively.
- Both NO 3 and Cl ISEs' responses can be expressed using the Nikolsky-Eisenmann equation. Therefore, the response of these two ISEs to the major selected ions can be expressed as (1) and (2):
- FIGS. 2A and 2B For the interference study, the cross-interference phenomena for these two ions and their ISEs are illustrated in FIGS. 2A and 2B . It can be seen that both ISEs suffered from interference. If a calibration method were to be implemented for predicting a desired ion's concentration without considering the interferences, the higher the interfering ion concentration, the larger the prediction errors would be. However, it is also evident that the impacts of interference were weakened as the concentration of the target analyte increased. As illustrated in FIG.
- ⁇ V represents the potential difference value of the nitrate ISE's response value caused by an interfering ion.
- Cl interfering ion
- FIG. 2A it can be seen in FIG. 2A that for constant values of KNO 3 , and as the NaCl concentration is increased logarithmically, the nitrate ISEs' response to Cl increases exponentially. Similar behaviour is observed with the Cl ISE's response to KNO 3 in FIG. 2B .
- V ISE the potential response value of ISE
- V pC Selected the potential value caused by the major selected ion
- ⁇ V the potential difference of each ISE's response caused by an interfering ion
- pC Selected the concentration of the major selected ion (Unit: ⁇ Ig M);
- pC Interfering the concentration of the interfering ion (Unit: ⁇ Ig M);
- P 1 , P 2 , P 3 , P 4 are the parameters that should be configured and optimized using the recalibration algorithm, which is the embodiment is a Genetic Algorithm.
- P 1 , P 2 , P 3 , P 4 are the parameters that should be configured and optimized by the GA.
- the genetic algorithm was applied to optimize the parameters P 1 to P 4 .
- the parameters of each ISE were determined using two steps: firstly, P 3 and P 4 were determined using data for the pure major selected ion solutions; and secondly, P 1 and P 2 were optimized using various interfering ion solutions with constant concentrations of the major ion. Therefore, in configuring the regression equation of each ISE, GA would be applied twice to determine P 3 and P 4 then P 1 and P 2 .
- the fitness function was based on the mathematical formula (5) and (6). The fewer errors in the calculated values against the real measurement values, the better fitness of the chromosome.
- For the fitness function for each chromosome, firstly, the two binary numbers were converted back to decimal integers and scaled to the ranges as 0 to 50 for parameter ‘P 1 ’, 0 to 400 for ‘P 2 ’, 0 to 1 for ‘P3’ and 0 to 10 for ‘P4’, respectively. In every GA generation, the fitness value of each chromosome was calculated and checked. The GA continued until a proper chromosome was found, whose fitness value satisfied the accuracy (with the sum of absolute errors less than 0.1) or terminated when the maximum number of generations (set at 1000) was reached.
- the chromosomes with better fitness values are more likely to be selected as the parents and breed the offspring for next generations.
- the optimized parameters for the NO 3 ISE and Cl ISE are shown in FIGS. 3A and 3B .
- the response equations for the ISEs can thus be expressed as (7) and (8), respectively:
- V ISE NO 3 35.7 ⁇ p ⁇ NO 3 + 0.16 ⁇ e 1.35 ⁇ ( pNO 3 - pCl ) + 246.8 ( 7 )
- V ISE Cl 37.8 ⁇ p ⁇ Cl + 0.2 ⁇ e 2.3 ⁇ ( pCl - pNO 3 ) + 274.2 ( 8 )
- the ISE array in the embodiment was stored in a mixture solution, containing 1.0 mM KNO 3 and 10 mM NaCl with the same background solution for 4 weeks.
- the sensitivity and selectivity of each ISE was measured once in triplicate in each one week period using the same calibration standard solutions. After 4 weeks, the response of the ISEs can be expressed as the equations (9) and (10):
- V ISE NO 3 27.1 ⁇ p ⁇ NO 3 + 0.1 ⁇ e 1.4 ⁇ ( pNO 3 - pCl ) + 227 ( 9 )
- V ISE Cl 30.3 ⁇ p ⁇ Cl + 0.12 ⁇ e 2.4 ⁇ ( pCl - pNO 3 ) + 251.8 ( 10 )
- the re-calibration can be performed simply by using only four standard solutions, as illustrated in Table 1. This combination allows the parameters of the ISEs to be determined using GA, as described.
- the R&R results represented by Percentage of Gauge R&R of total variations (PRR), are also shown below in Table 2 with the relative variances.
- the PPR values evaluated these candidates based on the results of measurements over four weeks. Based on our ISE temporal stability experiment, it can be concluded that both the sensitivity and selectivity of ISEs became impaired over time. In this situation the cross-interference characteristics should be considered in the recalibration of the device.
- V ISE NO 3 34.8 ⁇ p ⁇ NO 3 + 0.13 ⁇ e 1.4 ⁇ ( pNO 3 - pCl ) + 247.4 ( 11 )
- V ISE Cl 38.3 ⁇ p ⁇ Cl + 0.19 ⁇ e 2.3 ⁇ ( pCl - pNO 3 ) + 276.8 ( 12 )
- the MAEs were 2.9 and 3.0 for NO 3 ISE and Cl ISE, respectively. It can be concluded that compared to the original calibration model, it is possible to successfully re-build the mathematical model for the ISEs' response characteristics using only four standard solutions without a significant difference in results.
- the samples were pre-treated by adding sodium sulfate and sulfuric acid to resemble a background condition similar to that of the training samples, in order to maintain the same ionic strength and lower the pH to almost 3 to eliminate any interference from HCO 3 and CO 3 .
- Recalibration, as per the invention, for the ISE array was performed twice a day during the measurement. Each sample was measured in triplicate by ISE array and in duplicate by ICs and the average values recorded.
- the prediction results compared to IC for Cl and NO 3 are shown in FIG. 5 . Compared to the 1:1 line, it is clearly evident that by using the simulation data, the prediction results for NO 3 and Cl were similar to those obtained using IC, with MRE of 6.2% and 5.4% for NO 3 and Cl, respectively.
- the developed mathematical equations of the recalibration algorithm can be used to simulate the response values of ISE array, and to determine the analytes' concentrations from unknown samples with relatively few samples (e.g. 4 samples). As described, these mathematical equations were developed based not only on each ISE's response to their major selected ion, but also to the interfering ion. Furthermore, the ISE array system can be recalibrated by measuring only a couple of selected standard solutions.
- FIGS. 1 and 7 there is provided a method of recalibrating a device for assessing concentration of at least one analyte ion in a liquid, as shown in FIGS. 1 and 7 .
- 6 for recalibrating the device includes the steps of: contacting 24 , with the plurality of electrodes, more than one recalibrating sample having n selected calibration ions and a plurality of interference calibration ions of known ionic concentrations, respectively, whereby each of the n selected calibration ions correspond to ones of the plurality of electrodes; receiving 26 a signal from each of the electrodes in response to sensing an ionic concentration of a corresponding one of the n selected calibration ions and the plurality of interference calibration ions in the recalibrating samples; simulating 28 a response of each of the plurality of electrodes by applying the signal as recalibration training data to a recalibration algorithm that has been trained to simulate the response based on a comparison of the recalibration training data and the known ionic concentration of the n selected calibration ions and the plurality of interference calibration ions; and recalibrating 30 the device using output data from the recalibration algorithm as the training data of the neural network algorithm.
- the ISEs of the device of FIG. 1 are also employed and are an array of solid state electrodes comprising Prussian Blue modified Carbon Paste Electrodes (PB-CPE).
- PB-CPE Prussian blue modified Carbon Paste Electrodes
- the Prussian blue modified Carbon Paste Electrodes (PB-CPE) were applied to determine the four exchangeable cations.
- Prussian blue (PB) or iron (III) hexacyanoferrate (II) is an inorganic polycrystal with well-known electrochromic and electrocatalytical capabilities.
- Mixing PB with graphite powder to prepare Carbon Paste (CP) is a cheap, simple and effective mixing technique to create the electrode body.
- the PB-CPE body Iron (III) ferrocyanide powder was mixed with Graphite powder in a 1:9 ratio by weight. This powder mixture was transferred to an agate mortar and mixed thoroughly for 5 minutes with 20 wt % mineral oil. The homogeneous paste was placed in the electrode holders, which were made from 10-100 ⁇ L pipette tips, connected with a copper cable and sealed with epoxy. The electrode paste surface was smoothed onto a glass plate. The geometric diameter of the electrode surface was 5 mm.
- the ISE array contained an Ag/AgCl reference electrode and 4 PB-GCE working electrodes.
- the ion-sensitive membranes were prepared by adding a solution drop-wise and the formulation included: the ionophore, an ionic additive (K + TpClPB ⁇ ), the plasticizer and PVC in tetrahydrofuran (THF). Membrane’ details are available in Table 3.
- the potentiometric system of this embodiment consisted of 4 pH amplifiers applied as signal amplifiers. Software was used for the data acquisition and filtering phases. Data processing and analysis was undertaken in MatlabTM using the Statistical Analysis and neural network toolboxes. Microsoft ExcelTM was applied for data recording and searching the regression lines. The electrodes were connected to electronic amplifiers, sharing the same measuring conditions that included the reference electrode and grounded earth. A 10 Hz low-pass digital filter eliminated the noise caused by signal granularity generated by electrodes.
- One Magnetic Stirrer with a spin bar and several beakers (e.g. 250 mL) were used for sample and standard preparation.
- the initial detection limit and linear detection range for each ISE was estimated using their single ion standard solutions.
- the detection limit and linear response range were calculated according to the IUPAC recommendations. Except for sodium, whose detection limit was around 0.05 mmol/L and linear response ranged from 1.0 to 100 mmol/L, the remaining ions could be detected under 0.01 mmol/L and linear response ranged from 0.1 to 10 mmol/L.
- sodium and potassium which are monovalent ions
- the calibration curves' slopes were 45.1 and 46.8, respectively.
- divalent ions were 27.3 and 26.9 for calcium and magnesium, respectively.
- FIG. 8 For the interference study, the cross-interference phenomena for the four exchangeable cations and their ISEs are illustrated in FIG. 8 .
- the y axis represents the potential difference ( ⁇ mV) of each of the ISE's response caused by an interferon.
- the x axis represents the concentration differences between the major selected ion and the interferon.
- V ISE V pC Selected + ⁇ V pC Selected -pC Interferon (14) ⁇ V pC Selected -pC Interferon ⁇ c ⁇ e d ⁇ (pC Selected -pC Interferon )
- V ISE the potential response value of ISE (Unit: mV)
- V pC Selected the potential value caused by the major selected ion (Unit: mV)
- ⁇ V the potential difference of each ISE's response caused by an interferon (Unit: mV)
- pC Selected the concentration of the major selected
- the response of the ISEs to a mixture solution with the selected ion and only one interferon presented can be expressed as (16): V ISE ⁇ a ⁇ pC Selected +b+c ⁇ e d ⁇ (pC Selected -pC Interferon ) (16) Where ‘a’, ‘c’ and ‘d’ are the parameters that should be configured and optimized.
- V ISE ⁇ a ⁇ pC Selected + b + ⁇ i 1 n ⁇ c i ⁇ e d i ⁇ ( pC Selected - pC Interferon i ) ( 18 )
- V ISE the potential response value of ISE (Unit: mV)
- V pC Selected the potential value caused by the major selected ion (Unit: mV)
- ⁇ V the potential difference of each ISE's response caused by each interferon (Unit: mV)
- pC Selected the concentration of the major selected ion (Unit: ⁇ Ig M)
- pC Interferon i the concentration of the i th interferon (Unit: ⁇ Ig M); ‘c i ’ and ‘
- the five rows for each of the standard solutions represent standard solutions #1-#5.
- all the standard solutions #1-#5 are mixtures with the interferons present.
- the solution #1 for instance, which contains 1 mM of sodium and 0.1 mM of other cations.
- the concentration of all its interferons are lower than the selected ion; for the other three ISEs, their interferons' concentration are either ten-fold higher or equal.
- none of these interferons could cause higher than 1 mV potential variation to their related ISEs; hence the interfering impacts were negligible.
- the rest of the standard solutions #2 to #5, are dominated by one of the cations and the interferences from other ions are also negligible.
- GA Genetic Algorithm
- the two binary numbers were converted back to decimal integers and scaled to the ranges as 0 to ⁇ 50 for parameter ‘a’, 0 to 400 for ‘p’, 0 to 3 for ‘c i ’ and ‘d i ’, respectively.
- the fitness value of each chromosome was calculated and checked. The GA continued until a proper chromosome was found, whose fitness value satisfied the accuracy (with the sum of absolute errors less than 0.1) or terminated when the maximum number of generations (set at 1000) was reached.
- the concentrations of the four ions were encoded into one chromosome (vector), 40 chromosomes (vectors) were initialized with four unit norm random values and converted into decimal integers (0 to 1000). Then these decimal integers were converted into ten digit binary numbers. Every vector, which has four values representing four parameters, will therefore contain forty digit binary numbers that represent one chromosome.
- the fitness function was based on equation (18) for the ISE array. The fewer errors in the calculated values against the real measurement values, the better fitness of the chromosome.
- the fitness value of each chromosome was calculated and checked in each GA generation and the algorithm continued until a proper chromosome was found, whose fitness value satisfied the accuracy (with the sum of absolute errors less than 0.1) or terminated when the maximum number of generations (set at 1000) was reached.
- the architecture of the BPNN model for determination was 4 by N by 4: one input layer with four neurons (one ISE each); one hidden layer whereby the number of hidden neurons was determined by optimization; and one output layer with four output neurons, corresponding to the predicted concentrations of the four cations, respectively.
- the training parameters were set to a maximum of 300 epochs, with a fixed error goal for the training subset of 0.001 of the Root Mean Square Error (RMSE).
- RMSE Root Mean Square Error
- the robustness and appropriateness of the approach was assessed using the mean of the Relative Error (MRE) of the testing set (20 synthetic samples), between the predicted and the known concentrations. All neuron numbers of the hidden layer from 2 to 12 were parallel trained and their performance was compared.
- the prediction results were compared to ICP-OES for the four exchangeable cations and shown in FIG. 11 . It can be seen that the best prediction was belong to Ca and Na. This is because the Ca ISE has less interfering impact from other cations in overall; the concentrations of Na in the solutions were relatively higher than other interfering cations, and the interfering impact to Na ISE were negligible.
- the prediction accuracies for K and Mg were relatively weak, this is because the K ISE was severe interfered by Na ion; and Mg ISE is sensitive to Ca ion. Compared to the 1:1 line, it is clearly evident that Na and K were closer to 1:1 rather than Ca and Mg, which were underneath.
- ICP-OES calculates the total ion concentrations including free ions and their complex species, but ISEs are responsive to ion activities only. Meanwhile, it is illustrated from the figure that there were no significant difference between the prediction results using GA or BPNN for the four exchangeable cations, since both were employed the same recalibration procedures. Furthermore, the SPAR values were also calculated based on the predicted results and illustrated in FIG. 12 . With the reasonable prediction accuracy for Na and Ca, which are the dominated monovalent cations and bivalent cations, respectively, the predicted SPAR values were close to the 1:1 line against to the results from ICP-OES.
Landscapes
- Health & Medical Sciences (AREA)
- Life Sciences & Earth Sciences (AREA)
- Physics & Mathematics (AREA)
- Chemical & Material Sciences (AREA)
- Engineering & Computer Science (AREA)
- General Health & Medical Sciences (AREA)
- General Physics & Mathematics (AREA)
- Molecular Biology (AREA)
- Chemical Kinetics & Catalysis (AREA)
- Electrochemistry (AREA)
- Theoretical Computer Science (AREA)
- Analytical Chemistry (AREA)
- Biochemistry (AREA)
- Immunology (AREA)
- Pathology (AREA)
- Bioinformatics & Cheminformatics (AREA)
- Data Mining & Analysis (AREA)
- Physiology (AREA)
- Artificial Intelligence (AREA)
- Biomedical Technology (AREA)
- Biophysics (AREA)
- Computational Linguistics (AREA)
- Evolutionary Biology (AREA)
- Evolutionary Computation (AREA)
- Computing Systems (AREA)
- General Engineering & Computer Science (AREA)
- Mathematical Physics (AREA)
- Software Systems (AREA)
- Bioinformatics & Computational Biology (AREA)
- Investigating Or Analysing Biological Materials (AREA)
- Other Investigation Or Analysis Of Materials By Electrical Means (AREA)
Abstract
Description
V ISE
where:
VISE
VpC
ΔVpC
pSEL=the concentration of the first or the second selected calibration ion (unit: −Ig M);
pINT=the concentration of the first or the second interference calibration ion (unit: −Ig M); and
P1, P2, P3 and P4=parameters to be determined
where:
ΔVpC
pNO3=the concentration of the NO3 ion (unit: −Ig M);
pCl=the concentration of the Cl ion (unit: −Ig M); and
P1, P2, P3 and P4=parameters to be determined
where:
VISE
VpC
pNO3=the concentration of the NO3 ion (unit: −Ig M);
pCl=the concentration of the Cl ion (unit: −Ig M); and
P1, P2, P3 and P4=parameters to be determined
V ISE
Where:
VISE—the potential response value of the first electrode (ISE) (Unit: mV);
VpCSelected—the potential value caused by the first selected calibration ion (Unit: mV);
ΔV—the potential difference of each one of the plurality of electrodes ISE's response caused by each of the plurality of interference calibration ions (Unit: mV);
pCselected—the concentration of the first selected calibration ion (Unit: −Ig M);
pCInterferon
a, b, ci and di—the parameters for the ith one of the interference calibration ions to be determined.
| TABLE 1 |
| Four standard solutions for re-calibration |
| NO3 ISE | Cl ISE |
| KNO3 | NaCl | P1 & P2 | P3 & P4 | P1 & P2 | P3 & P4 | |
| Solution | (mM) | (mM) | Eq. (1) | Eq. (2) | Eq. (1) | Eq. (3) |
| 1 | 0 | 0 | ✓ | |||
| 2 | 0 | 100 | ✓ | ✓ | ||
| 3 | 0.1 | 0.1 | ✓ | ✓ | ✓ | |
| 4 | 10 | 0.1 | ✓ | ✓ | ||
V ISE =V pC
ΔV=P 1 ×e P
Where:
Where P1, P2, P3, P4 are the parameters that should be configured and optimized using the recalibration algorithm, which is the embodiment is a Genetic Algorithm.
Where P1, P2, P3, P4 are the parameters that should be configured and optimized by the GA.
| TABLE 2 |
| Characteristics for the ISEs |
| Repro- | |||||
| ISE | Sensitivity1 | Stability2 | Repeatability3 | ducibility3 | PRR4 |
| NO3 | 35.7 | 8.3 | 0.18 | 2.67 | 18.61 |
| Cl | 37.8 | 7.5 | 0.17 | 3.35 | 16.23 |
| 1Unit: mV/dec; | |||||
| 2% of the decrease of sensitivity; | |||||
| 3% of Variance based on ANOVA Gauge R&R analysis; | |||||
| 4% of Gauge R&R of total variations | |||||
| TABLE 3 |
| PVC membranes for four exchangeable ions |
| Plasticizer | PVC | |||
| ISE | Ionophore (w.t. %) | Additive (w.t. %) | (w.t. %) | (w.t. %) |
| Na+ | Ionophore VI (1.0) | K+TpCIPB− (0.1) | DOS (65.9) | 33.0 |
| K+ | Valinomycin (1.0) | K+TpCIPB− (0.5) | DOS (65.5) | 33.0 |
| Ca2+ | ETH5234 (1.0) | K+TpCIPB− (0.3) | oNPOE (66.0) | 32.9 |
| Mg2+ | ETH5506 (1.0) | K+TpCIPB− (0.7) | oNPOE (66.3) | 32.0 |
V pC
Where ‘a’ to ‘b’ are the parameters to be configured for each ISE, provided the concentrations of pCselected are in the calibration range.
V ISE =V pC
ΔV pC
Where:
VISE—the potential response value of ISE (Unit: mV);
V pCSelected—the potential value caused by the major selected ion (Unit: mV);
ΔV—the potential difference of each ISE's response caused by an interferon (Unit: mV);
pCSelected—the concentration of the major selected ion (Unit: −Ig M);
pCInterferon—the concentration of the interferon (Unit: −Ig M);
‘c’ and ‘d’—the parameters to be determined.
V ISE ≈a×pC Selected +b+c×e d×(pC
Where ‘a’, ‘c’ and ‘d’ are the parameters that should be configured and optimized.
| TABLE 4 |
| The initial characteristics for the ISEs |
| ISE | a | b | cNa | cK | cCa | cMg | dNa | dK | dCa | dMg |
| Na+ | −45.1 | 276.5 | — | 0.97 | 0.28 | 0.25 | — | 1.4 | 0.89 | 0.99 |
| K+ | −46.8 | 278 | 0.25 | — | 0.22 | 0.26 | 1.12 | — | 0.95 | 0.68 |
| Ca2+ | −27.3 | 235.6 | 0.16 | 0.03 | — | 0.21 | 0.9 | 1.42 | — | 0.98 |
| Mg2+ | −26.9 | 157.9 | 0.2 | 0.23 | 0.85 | — | 1.07 | 0.83 | 1.06 | — |
| TABLE 5 |
| Orthogonal experimental design for interference study |
| No. | ΔpCInterferon |
ΔpCInterferon |
ΔpCInterferon |
||
| C1 | 0 | 0 | 2 | ||
| |
0 | −1 | 0 | ||
| |
2 | −1 | 2 | ||
| |
1 | 0 | −1 | ||
| |
1 | −1 | 1 | ||
| C6 | −1 | 1 | 2 | ||
| C7 | −1 | −1 | −1 | ||
| C8 | −1 | 2 | 0 | ||
| |
1 | 2 | 2 | ||
| C10 | −1 | 0 | 1 | ||
| |
2 | 0 | 0 | ||
| |
2 | 2 | 1 | ||
| |
0 | 2 | −1 | ||
| |
1 | 1 | 0 | ||
| |
2 | 1 | −1 | ||
| |
0 | 1 | 1 | ||
| *ΔpCInterferon |
|||||
| pC = −lg M; | |||||
| Na ISE: |
|||||
| K ISE: |
|||||
| Ca ISE: |
|||||
| Mg ISE: |
|||||
Where:
VISE—the potential response value of ISE (Unit: mV);
V pCSelected—the potential value caused by the major selected ion (Unit: mV);
ΔV—the potential difference of each ISE's response caused by each interferon (Unit: mV);
pCSelected—the concentration of the major selected ion (Unit: −Ig M);
pCInterferon
‘ci’ and ‘di’—the parameters for the ith interferon to be determined.
| TABLE 6 |
| Standard calibration solutions |
| Na ISE | K ISE | Ca ISE | Mg ISE |
| Mmol/L | a, | cK, | cCa, | cMg, | a, | cNa, | cCa, | cMg, | a, | cNa, | cK, | cMg, | a, | cNa, | cK, | cCa, |
| Na | K | Ca | Mg | b | dK | dCa | dMg | b | dNa | dCa | dMg | b | dNa | dK | dMg | b | dNa | dK | dCa |
| 1.0 | 0.1 | 0.1 | 0.1 | ✓ | ✓ | ✓ | ✓ | ✓ | ✓ | ✓ | ✓ | ✓ | ✓ | ✓ | ✓ | ✓ | ✓ | ✓ | ✓ |
| 100 | 0.1 | 0.1 | 0.1 | ✓ | ✓ | ✓ | ✓ | ||||||||||||
| 1.0 | 10 | 0.1 | 0.1 | ✓ | ✓ | ✓ | ✓ | ||||||||||||
| 1.0 | 0.1 | 10 | 0.1 | ✓ | ✓ | ✓ | ✓ | ||||||||||||
| 1.0 | 0.1 | 0.1 | 10 | ✓ | ✓ | ✓ | ✓ | ||||||||||||
Claims (11)
Applications Claiming Priority (5)
| Application Number | Priority Date | Filing Date | Title |
|---|---|---|---|
| AU2015900933 | 2015-03-16 | ||
| AU2015900933A AU2015900933A0 (en) | 2015-03-16 | Method of recalibrating a device for assessing concentration of at least one analyte ion in a liquid | |
| AU2015903799 | 2015-09-17 | ||
| AU2015903799A AU2015903799A0 (en) | 2015-09-17 | Method of recalibrating a device for assessing concentration of at least one analyte ion in a liquid | |
| PCT/AU2016/050165 WO2016145481A1 (en) | 2015-03-16 | 2016-03-09 | A method of recalibrating a device for assessing concentration of at least one analyte ion in a liquid |
Publications (2)
| Publication Number | Publication Date |
|---|---|
| US20180246055A1 US20180246055A1 (en) | 2018-08-30 |
| US10761052B2 true US10761052B2 (en) | 2020-09-01 |
Family
ID=56918150
Family Applications (1)
| Application Number | Title | Priority Date | Filing Date |
|---|---|---|---|
| US15/558,982 Active 2036-09-25 US10761052B2 (en) | 2015-03-16 | 2016-03-09 | Method of recalibrating a device for assessing concentration of at least one analyte ion in a liquid |
Country Status (3)
| Country | Link |
|---|---|
| US (1) | US10761052B2 (en) |
| EP (1) | EP3271712B1 (en) |
| WO (1) | WO2016145481A1 (en) |
Families Citing this family (8)
| Publication number | Priority date | Publication date | Assignee | Title |
|---|---|---|---|---|
| CA3027849C (en) * | 2016-06-17 | 2021-06-22 | Jay Li | Fluid analyzer for measuring a target analyte and method of calibrating an amperometric sensor |
| CN108896629B (en) * | 2018-03-22 | 2020-06-23 | 吉林光大电力设备股份有限公司 | Three-point flow type calibration device and method for sodium ion concentration meter |
| CN113924481A (en) * | 2019-06-14 | 2022-01-11 | 罗伯特·博世有限公司 | Metal ferrocyanide-doped carbon as ion-selective electrode converter |
| TWI704346B (en) * | 2019-08-02 | 2020-09-11 | 財團法人工業技術研究院 | Smart concentration measuring system, method and smart concentration analyzing module |
| CN111400832B (en) * | 2020-03-11 | 2021-07-20 | 广州博依特智能信息科技有限公司 | Hybrid modeling method for predicting key operation parameters of drying part of toilet paper machine |
| JPWO2023157421A1 (en) * | 2022-02-18 | 2023-08-24 | ||
| US20240219344A1 (en) * | 2022-12-29 | 2024-07-04 | Purdue Research Foundation | System and method for self-calibrating of ion selective electrodes based on differential voltage measurement |
| CN117195973B (en) * | 2023-09-20 | 2026-01-02 | 常州大学 | An Improved Method and System for Predicting Aquatic Water Quality Parameters Based on PSO |
Citations (2)
| Publication number | Priority date | Publication date | Assignee | Title |
|---|---|---|---|---|
| US5554273A (en) | 1995-07-26 | 1996-09-10 | Praxair Technology, Inc. | Neural network compensation for sensors |
| WO2012083371A1 (en) | 2010-12-23 | 2012-06-28 | Crc Care Pty Ltd | Analyte ion detection method and device |
-
2016
- 2016-03-09 EP EP16764057.2A patent/EP3271712B1/en not_active Not-in-force
- 2016-03-09 US US15/558,982 patent/US10761052B2/en active Active
- 2016-03-09 WO PCT/AU2016/050165 patent/WO2016145481A1/en not_active Ceased
Patent Citations (3)
| Publication number | Priority date | Publication date | Assignee | Title |
|---|---|---|---|---|
| US5554273A (en) | 1995-07-26 | 1996-09-10 | Praxair Technology, Inc. | Neural network compensation for sensors |
| WO2012083371A1 (en) | 2010-12-23 | 2012-06-28 | Crc Care Pty Ltd | Analyte ion detection method and device |
| US20130304395A1 (en) | 2010-12-23 | 2013-11-14 | Ravendra Naidu | Analyte ion detection method and device |
Non-Patent Citations (10)
| Title |
|---|
| Hartnett, Margaret, et al., "Potentiometric Nonlinear Multivariate Calibration with Genetic Algorithm and Simplex Optimization", Analytical Chemistry, American Chemical Society, May 15, 1997, vol. 69, No. 10, pp. 1909-1918. |
| International Search Report issued in International Application No. PCT/AU2016/050165, dated Jun. 15, 2016. 3 pages. |
| Martinus, Bos, et al. "Data Processing by Neural Networks in Quantitative Chemical Analysis", ANALYST, vol. 118, Apr. 2, 1993 (Apr. 2, 1993), pp. 323-328. |
| Mueller, Amy V., et al. "Extended artificial neural networks: Incorporation of a priori chemical knowledge enables use of ion selective electrodes for in-situ measurement of ions at environmentally relevant levels", TALANTA, vol. 117, Sep. 4, 2013 (Sep. 4, 2013), pp. 112-118. |
| Supplementary European Search Report and European Search Opinion issued in European application No. EP 16764057.2, dated Sep. 26, 2018. 12 pages. |
| Wang et al., "Application of mathematical models and genetic algorithm to simulate the response characteristics of an ion selective electrode array for system recalibration", Chemometrics and Intelligent Laboratory System 144 (2015) 24-30. (Year: 2015). * |
| Wang, Liang et. al. "Application of Mathematical Models and Genetic Algorithm to Simulate the Response Characteristics of an Ion Selective Electrode Array for System Recalibration." Chemometrics and Intelligent Laboratory Systems, vol. 144, 2015, pp. 1-28. |
| Wang, Liang et. al. "Application of Neural Networks with Novel Independent Component Analysis Methodologies for the Simultaneous Determination of Cadmium, Copper, and Lead Using an ISE Array." Journal of Chemometrics, vol. 28, 2014, pp. 1-8. |
| Wang, Liang et. al. "Application of Neural Networks with Novel Independent Component Analysis Methodologies to a Prussian Blue Modified Glassy Carbon Electrode Array." Talanta, vol. 131, 2015, pp. 395-403. |
| Written Opinion of the International Searching Authority issued in International Application No. PCT/AU2016/050165, completed Jun. 15, 2016. 8 pages. |
Also Published As
| Publication number | Publication date |
|---|---|
| EP3271712A4 (en) | 2018-11-07 |
| US20180246055A1 (en) | 2018-08-30 |
| EP3271712B1 (en) | 2020-05-06 |
| WO2016145481A1 (en) | 2016-09-22 |
| EP3271712A1 (en) | 2018-01-24 |
Similar Documents
| Publication | Publication Date | Title |
|---|---|---|
| US10761052B2 (en) | Method of recalibrating a device for assessing concentration of at least one analyte ion in a liquid | |
| US10119927B2 (en) | Analyte ion detection method and device | |
| Saurina et al. | Determination of calcium and total hardness in natural waters using a potentiometric sensor array | |
| Adamchuk et al. | Direct measurement of soil chemical properties on-the-go using ion-selective electrodes | |
| US7189314B1 (en) | Method and apparatus for quantitative analysis | |
| Sethuramasamyraja et al. | Agitated soil measurement method for integrated on-the-go mapping of soil pH, potassium and nitrate contents | |
| Kim et al. | PVC membrane-based portable ion analyzer for hydroponic and water monitoring | |
| Wang et al. | Application of ion selective electrode array to simultaneously determinate multi-free ions in solution | |
| Kirsanov et al. | Mimicking Daphnia magna bioassay performance by an electronic tongue for urban water quality control | |
| Gallardo et al. | Use of an electronic tongue based on all‐solid‐state potentiometric sensors for the quantitation of alkaline ions | |
| Cortina-Puig et al. | EIS multianalyte sensing with an automated SIA system—An electronic tongue employing the impedimetric signal | |
| Wang et al. | Simultaneously determining multi-metal ions using an ion selective electrode array system | |
| Wang et al. | Application of neural networks with novel independent component analysis methodologies to a Prussian blue modified glassy carbon electrode array | |
| Laguarda-Miro et al. | Glyphosate detection by voltammetric techniques. A comparison between statistical methods and an artificial neural network | |
| CN114819407A (en) | Dynamic prediction method and device for lake blue algae bloom | |
| Amngostar et al. | LoRaStat: A low-cost portable LoRaWAN potentiostat for wireless and real-time monitoring of water quality and pollution | |
| Wang et al. | Application of mathematical models and genetic algorithm to simulate the response characteristics of an ion selective electrode array for system recalibration | |
| Baret et al. | Application of neural network calibrations to an halide ISE array | |
| Vogel et al. | The effect of soil moisture content and soil texture on fast in situ pH measurements with two types of robust ion-selective electrodes | |
| Wang et al. | Application of neural networks with novel independent component analysis methodologies for the simultaneous determination of cadmium, copper, and lead using an ISE array | |
| Sales et al. | Multivariate standardization for correcting the ionic strength variation on potentiometric sensor arrays | |
| RU2084006C1 (en) | Device for analysis of waters in boreholes | |
| Sethuramasamyraja et al. | Analysis of an ion-selective electrode based methodology for integrated on-the-go mapping of soil pH, potassium, and nitrate contents | |
| Mimendia et al. | SIA System employing the transient response from a potentiometric sensor array—Correction of a saline matrix effect | |
| Wang et al. | Novel recalibration methodologies for ion‐selective electrode arrays in the multi‐ion interference scenario |
Legal Events
| Date | Code | Title | Description |
|---|---|---|---|
| FEPP | Fee payment procedure |
Free format text: ENTITY STATUS SET TO UNDISCOUNTED (ORIGINAL EVENT CODE: BIG.); ENTITY STATUS OF PATENT OWNER: LARGE ENTITY |
|
| AS | Assignment |
Owner name: CRC CARE PTY LTD., AUSTRALIA Free format text: ASSIGNMENT OF ASSIGNORS INTEREST;ASSIGNORS:NAIDU, RAVENDRA;WANG, LIANG;CHEN, ZULIANG;AND OTHERS;SIGNING DATES FROM 20180222 TO 20180316;REEL/FRAME:045402/0102 |
|
| STPP | Information on status: patent application and granting procedure in general |
Free format text: DOCKETED NEW CASE - READY FOR EXAMINATION |
|
| STPP | Information on status: patent application and granting procedure in general |
Free format text: NON FINAL ACTION MAILED |
|
| STPP | Information on status: patent application and granting procedure in general |
Free format text: RESPONSE TO NON-FINAL OFFICE ACTION ENTERED AND FORWARDED TO EXAMINER |
|
| STPP | Information on status: patent application and granting procedure in general |
Free format text: NOTICE OF ALLOWANCE MAILED -- APPLICATION RECEIVED IN OFFICE OF PUBLICATIONS |
|
| STCF | Information on status: patent grant |
Free format text: PATENTED CASE |
|
| MAFP | Maintenance fee payment |
Free format text: PAYMENT OF MAINTENANCE FEE, 4TH YEAR, LARGE ENTITY (ORIGINAL EVENT CODE: M1551); ENTITY STATUS OF PATENT OWNER: LARGE ENTITY Year of fee payment: 4 |