US10687781B2 - Hemodynamic monitoring device and methods of using same - Google Patents
Hemodynamic monitoring device and methods of using same Download PDFInfo
- Publication number
- US10687781B2 US10687781B2 US14/776,577 US201414776577A US10687781B2 US 10687781 B2 US10687781 B2 US 10687781B2 US 201414776577 A US201414776577 A US 201414776577A US 10687781 B2 US10687781 B2 US 10687781B2
- Authority
- US
- United States
- Prior art keywords
- velocity
- blood flow
- mammalian patient
- sensor
- respiratory cycle
- Prior art date
- Legal status (The legal status is an assumption and is not a legal conclusion. Google has not performed a legal analysis and makes no representation as to the accuracy of the status listed.)
- Active, expires
Links
- 230000000004 hemodynamic effect Effects 0.000 title claims abstract description 76
- 238000000034 method Methods 0.000 title claims abstract description 39
- 238000012806 monitoring device Methods 0.000 title claims description 33
- 230000000241 respiratory effect Effects 0.000 claims abstract description 93
- 230000017531 blood circulation Effects 0.000 claims abstract description 71
- 238000002604 ultrasonography Methods 0.000 claims abstract description 59
- 210000002620 vena cava superior Anatomy 0.000 claims abstract description 53
- 230000008569 process Effects 0.000 claims abstract description 11
- 239000012530 fluid Substances 0.000 claims description 79
- 238000005259 measurement Methods 0.000 claims description 36
- 210000005241 right ventricle Anatomy 0.000 claims description 31
- 239000000523 sample Substances 0.000 claims description 30
- 201000001943 Tricuspid Valve Insufficiency Diseases 0.000 claims description 27
- 206010044640 Tricuspid valve incompetence Diseases 0.000 claims description 26
- 230000003205 diastolic effect Effects 0.000 claims description 20
- 238000004891 communication Methods 0.000 claims description 11
- 238000012545 processing Methods 0.000 claims description 11
- 230000000007 visual effect Effects 0.000 claims description 10
- 210000000779 thoracic wall Anatomy 0.000 claims description 2
- 238000012544 monitoring process Methods 0.000 abstract description 33
- 230000036316 preload Effects 0.000 description 39
- 230000029058 respiratory gaseous exchange Effects 0.000 description 38
- 230000004043 responsiveness Effects 0.000 description 32
- 230000004872 arterial blood pressure Effects 0.000 description 31
- 208000002815 pulmonary hypertension Diseases 0.000 description 27
- 230000015654 memory Effects 0.000 description 26
- 230000002861 ventricular Effects 0.000 description 26
- 230000001154 acute effect Effects 0.000 description 24
- 230000000747 cardiac effect Effects 0.000 description 18
- 230000004064 dysfunction Effects 0.000 description 18
- 238000004364 calculation method Methods 0.000 description 17
- 230000004044 response Effects 0.000 description 15
- 210000004369 blood Anatomy 0.000 description 13
- 239000008280 blood Substances 0.000 description 13
- 210000001147 pulmonary artery Anatomy 0.000 description 12
- 210000003462 vein Anatomy 0.000 description 10
- 230000036772 blood pressure Effects 0.000 description 9
- 230000002596 correlated effect Effects 0.000 description 9
- 230000007423 decrease Effects 0.000 description 9
- 210000005245 right atrium Anatomy 0.000 description 9
- 239000013078 crystal Substances 0.000 description 7
- 230000035485 pulse pressure Effects 0.000 description 7
- 230000009467 reduction Effects 0.000 description 7
- 230000003068 static effect Effects 0.000 description 7
- 230000009885 systemic effect Effects 0.000 description 7
- 230000035488 systolic blood pressure Effects 0.000 description 7
- 230000002792 vascular Effects 0.000 description 7
- 238000004458 analytical method Methods 0.000 description 6
- 230000035487 diastolic blood pressure Effects 0.000 description 6
- 238000005516 engineering process Methods 0.000 description 6
- 230000006870 function Effects 0.000 description 6
- 230000003434 inspiratory effect Effects 0.000 description 6
- 230000002093 peripheral effect Effects 0.000 description 6
- 210000000038 chest Anatomy 0.000 description 5
- 239000003814 drug Substances 0.000 description 5
- 229940079593 drug Drugs 0.000 description 5
- 230000005986 heart dysfunction Effects 0.000 description 5
- 238000009423 ventilation Methods 0.000 description 5
- 230000008859 change Effects 0.000 description 4
- 238000010586 diagram Methods 0.000 description 4
- 230000000670 limiting effect Effects 0.000 description 4
- 230000003287 optical effect Effects 0.000 description 4
- 230000002685 pulmonary effect Effects 0.000 description 4
- 238000013175 transesophageal echocardiography Methods 0.000 description 4
- 208000032843 Hemorrhage Diseases 0.000 description 3
- 206010021137 Hypovolaemia Diseases 0.000 description 3
- 206010003119 arrhythmia Diseases 0.000 description 3
- 230000006793 arrhythmia Effects 0.000 description 3
- 210000001367 artery Anatomy 0.000 description 3
- 230000009286 beneficial effect Effects 0.000 description 3
- 238000009530 blood pressure measurement Methods 0.000 description 3
- 239000003086 colorant Substances 0.000 description 3
- 230000008602 contraction Effects 0.000 description 3
- 230000000875 corresponding effect Effects 0.000 description 3
- 125000004122 cyclic group Chemical group 0.000 description 3
- 230000010339 dilation Effects 0.000 description 3
- 230000002526 effect on cardiovascular system Effects 0.000 description 3
- 230000000694 effects Effects 0.000 description 3
- 238000004599 local-density approximation Methods 0.000 description 3
- 230000007246 mechanism Effects 0.000 description 3
- 210000000056 organ Anatomy 0.000 description 3
- 230000010412 perfusion Effects 0.000 description 3
- 230000036581 peripheral resistance Effects 0.000 description 3
- 230000002829 reductive effect Effects 0.000 description 3
- 230000002441 reversible effect Effects 0.000 description 3
- 230000035882 stress Effects 0.000 description 3
- 230000009897 systematic effect Effects 0.000 description 3
- 230000001225 therapeutic effect Effects 0.000 description 3
- 210000000591 tricuspid valve Anatomy 0.000 description 3
- 208000028399 Critical Illness Diseases 0.000 description 2
- 206010016803 Fluid overload Diseases 0.000 description 2
- 206010039163 Right ventricular failure Diseases 0.000 description 2
- 208000007536 Thrombosis Diseases 0.000 description 2
- 230000003213 activating effect Effects 0.000 description 2
- 210000003484 anatomy Anatomy 0.000 description 2
- 230000000740 bleeding effect Effects 0.000 description 2
- 210000004204 blood vessel Anatomy 0.000 description 2
- 238000012790 confirmation Methods 0.000 description 2
- 230000003247 decreasing effect Effects 0.000 description 2
- 230000001419 dependent effect Effects 0.000 description 2
- 238000001514 detection method Methods 0.000 description 2
- 208000037265 diseases, disorders, signs and symptoms Diseases 0.000 description 2
- 230000009977 dual effect Effects 0.000 description 2
- 238000002847 impedance measurement Methods 0.000 description 2
- 208000015181 infectious disease Diseases 0.000 description 2
- 230000003993 interaction Effects 0.000 description 2
- 238000005399 mechanical ventilation Methods 0.000 description 2
- 238000012986 modification Methods 0.000 description 2
- 230000004048 modification Effects 0.000 description 2
- 238000001356 surgical procedure Methods 0.000 description 2
- 210000000115 thoracic cavity Anatomy 0.000 description 2
- 206010001052 Acute respiratory distress syndrome Diseases 0.000 description 1
- 102100034112 Alkyldihydroxyacetonephosphate synthase, peroxisomal Human genes 0.000 description 1
- 238000012935 Averaging Methods 0.000 description 1
- 206010015856 Extrasystoles Diseases 0.000 description 1
- 206010015866 Extravasation Diseases 0.000 description 1
- 241000282412 Homo Species 0.000 description 1
- 101000799143 Homo sapiens Alkyldihydroxyacetonephosphate synthase, peroxisomal Proteins 0.000 description 1
- 206010020919 Hypervolaemia Diseases 0.000 description 1
- 208000001953 Hypotension Diseases 0.000 description 1
- 206010021143 Hypoxia Diseases 0.000 description 1
- 206010073708 Obstructive shock Diseases 0.000 description 1
- 206010030113 Oedema Diseases 0.000 description 1
- 208000000418 Premature Cardiac Complexes Diseases 0.000 description 1
- 208000013616 Respiratory Distress Syndrome Diseases 0.000 description 1
- 206010040070 Septic Shock Diseases 0.000 description 1
- 241001325280 Tricardia watsonii Species 0.000 description 1
- 206010047139 Vasoconstriction Diseases 0.000 description 1
- 210000001015 abdomen Anatomy 0.000 description 1
- 230000002159 abnormal effect Effects 0.000 description 1
- 230000005856 abnormality Effects 0.000 description 1
- 230000037328 acute stress Effects 0.000 description 1
- 201000000028 adult respiratory distress syndrome Diseases 0.000 description 1
- 230000004075 alteration Effects 0.000 description 1
- 230000003321 amplification Effects 0.000 description 1
- 238000000848 angular dependent Auger electron spectroscopy Methods 0.000 description 1
- 230000001174 ascending effect Effects 0.000 description 1
- 230000001746 atrial effect Effects 0.000 description 1
- 230000003190 augmentative effect Effects 0.000 description 1
- 230000001042 autoregulative effect Effects 0.000 description 1
- 230000008901 benefit Effects 0.000 description 1
- 230000005540 biological transmission Effects 0.000 description 1
- 208000034158 bleeding Diseases 0.000 description 1
- 210000002302 brachial artery Anatomy 0.000 description 1
- 230000001269 cardiogenic effect Effects 0.000 description 1
- 206010007625 cardiogenic shock Diseases 0.000 description 1
- 210000004027 cell Anatomy 0.000 description 1
- 230000001413 cellular effect Effects 0.000 description 1
- 239000013043 chemical agent Substances 0.000 description 1
- 238000006243 chemical reaction Methods 0.000 description 1
- 230000005796 circulatory shock Effects 0.000 description 1
- 230000001447 compensatory effect Effects 0.000 description 1
- 230000003750 conditioning effect Effects 0.000 description 1
- 238000010276 construction Methods 0.000 description 1
- 230000001351 cycling effect Effects 0.000 description 1
- 230000006378 damage Effects 0.000 description 1
- 238000007405 data analysis Methods 0.000 description 1
- 238000003745 diagnosis Methods 0.000 description 1
- 230000004882 diastolic arterial blood pressure Effects 0.000 description 1
- 230000004069 differentiation Effects 0.000 description 1
- 238000010790 dilution Methods 0.000 description 1
- 239000012895 dilution Substances 0.000 description 1
- 201000010099 disease Diseases 0.000 description 1
- 208000035475 disorder Diseases 0.000 description 1
- 238000006073 displacement reaction Methods 0.000 description 1
- 238000002592 echocardiography Methods 0.000 description 1
- 229940124645 emergency medicine Drugs 0.000 description 1
- 210000003743 erythrocyte Anatomy 0.000 description 1
- 210000003238 esophagus Anatomy 0.000 description 1
- 238000000605 extraction Methods 0.000 description 1
- 230000036251 extravasation Effects 0.000 description 1
- 210000003191 femoral vein Anatomy 0.000 description 1
- 210000002683 foot Anatomy 0.000 description 1
- 208000018875 hypoxemia Diseases 0.000 description 1
- 238000001727 in vivo Methods 0.000 description 1
- 238000010348 incorporation Methods 0.000 description 1
- 238000002347 injection Methods 0.000 description 1
- 239000007924 injection Substances 0.000 description 1
- 238000011835 investigation Methods 0.000 description 1
- 238000002955 isolation Methods 0.000 description 1
- 210000004731 jugular vein Anatomy 0.000 description 1
- 238000002357 laparoscopic surgery Methods 0.000 description 1
- 210000005246 left atrium Anatomy 0.000 description 1
- 210000005240 left ventricle Anatomy 0.000 description 1
- 210000004072 lung Anatomy 0.000 description 1
- 238000012423 maintenance Methods 0.000 description 1
- 230000002107 myocardial effect Effects 0.000 description 1
- 238000003199 nucleic acid amplification method Methods 0.000 description 1
- 238000001615 p wave Methods 0.000 description 1
- 230000001991 pathophysiological effect Effects 0.000 description 1
- 230000035479 physiological effects, processes and functions Effects 0.000 description 1
- 201000003144 pneumothorax Diseases 0.000 description 1
- 230000000750 progressive effect Effects 0.000 description 1
- 230000002035 prolonged effect Effects 0.000 description 1
- 230000004088 pulmonary circulation Effects 0.000 description 1
- 230000000541 pulsatile effect Effects 0.000 description 1
- 238000002601 radiography Methods 0.000 description 1
- 230000033764 rhythmic process Effects 0.000 description 1
- 230000035945 sensitivity Effects 0.000 description 1
- 230000036303 septic shock Effects 0.000 description 1
- 230000035939 shock Effects 0.000 description 1
- 239000007787 solid Substances 0.000 description 1
- 230000002269 spontaneous effect Effects 0.000 description 1
- 210000001321 subclavian vein Anatomy 0.000 description 1
- 230000004873 systolic arterial blood pressure Effects 0.000 description 1
- 238000012360 testing method Methods 0.000 description 1
- 238000002560 therapeutic procedure Methods 0.000 description 1
- 238000004448 titration Methods 0.000 description 1
- 231100000331 toxic Toxicity 0.000 description 1
- 230000002588 toxic effect Effects 0.000 description 1
- 210000003437 trachea Anatomy 0.000 description 1
- 238000012549 training Methods 0.000 description 1
- 230000001131 transforming effect Effects 0.000 description 1
- 230000006438 vascular health Effects 0.000 description 1
- 230000002227 vasoactive effect Effects 0.000 description 1
- 230000025033 vasoconstriction Effects 0.000 description 1
- 230000024883 vasodilation Effects 0.000 description 1
- 238000012800 visualization Methods 0.000 description 1
Images


Classifications
-
- A—HUMAN NECESSITIES
- A61—MEDICAL OR VETERINARY SCIENCE; HYGIENE
- A61B—DIAGNOSIS; SURGERY; IDENTIFICATION
- A61B8/00—Diagnosis using ultrasonic, sonic or infrasonic waves
- A61B8/06—Measuring blood flow
-
- A—HUMAN NECESSITIES
- A61—MEDICAL OR VETERINARY SCIENCE; HYGIENE
- A61B—DIAGNOSIS; SURGERY; IDENTIFICATION
- A61B5/00—Measuring for diagnostic purposes; Identification of persons
- A61B5/02—Detecting, measuring or recording for evaluating the cardiovascular system, e.g. pulse, heart rate, blood pressure or blood flow
- A61B5/02028—Determining haemodynamic parameters not otherwise provided for, e.g. cardiac contractility or left ventricular ejection fraction
-
- A61B5/0402—
-
- A—HUMAN NECESSITIES
- A61—MEDICAL OR VETERINARY SCIENCE; HYGIENE
- A61B—DIAGNOSIS; SURGERY; IDENTIFICATION
- A61B5/00—Measuring for diagnostic purposes; Identification of persons
- A61B5/08—Measuring devices for evaluating the respiratory organs
-
- A—HUMAN NECESSITIES
- A61—MEDICAL OR VETERINARY SCIENCE; HYGIENE
- A61B—DIAGNOSIS; SURGERY; IDENTIFICATION
- A61B5/00—Measuring for diagnostic purposes; Identification of persons
- A61B5/08—Measuring devices for evaluating the respiratory organs
- A61B5/0803—Recording apparatus specially adapted therefor
-
- A61B5/0809—
-
- A—HUMAN NECESSITIES
- A61—MEDICAL OR VETERINARY SCIENCE; HYGIENE
- A61B—DIAGNOSIS; SURGERY; IDENTIFICATION
- A61B5/00—Measuring for diagnostic purposes; Identification of persons
- A61B5/08—Measuring devices for evaluating the respiratory organs
- A61B5/0816—Measuring devices for examining respiratory frequency
-
- A—HUMAN NECESSITIES
- A61—MEDICAL OR VETERINARY SCIENCE; HYGIENE
- A61B—DIAGNOSIS; SURGERY; IDENTIFICATION
- A61B5/00—Measuring for diagnostic purposes; Identification of persons
- A61B5/08—Measuring devices for evaluating the respiratory organs
- A61B5/085—Measuring impedance of respiratory organs or lung elasticity
- A61B5/086—Measuring impedance of respiratory organs or lung elasticity by impedance pneumography
-
- A—HUMAN NECESSITIES
- A61—MEDICAL OR VETERINARY SCIENCE; HYGIENE
- A61B—DIAGNOSIS; SURGERY; IDENTIFICATION
- A61B5/00—Measuring for diagnostic purposes; Identification of persons
- A61B5/72—Signal processing specially adapted for physiological signals or for diagnostic purposes
- A61B5/7271—Specific aspects of physiological measurement analysis
- A61B5/7278—Artificial waveform generation or derivation, e.g. synthesizing signals from measured signals
-
- A—HUMAN NECESSITIES
- A61—MEDICAL OR VETERINARY SCIENCE; HYGIENE
- A61B—DIAGNOSIS; SURGERY; IDENTIFICATION
- A61B5/00—Measuring for diagnostic purposes; Identification of persons
- A61B5/74—Details of notification to user or communication with user or patient; User input means
- A61B5/7405—Details of notification to user or communication with user or patient; User input means using sound
-
- A—HUMAN NECESSITIES
- A61—MEDICAL OR VETERINARY SCIENCE; HYGIENE
- A61B—DIAGNOSIS; SURGERY; IDENTIFICATION
- A61B5/00—Measuring for diagnostic purposes; Identification of persons
- A61B5/74—Details of notification to user or communication with user or patient; User input means
- A61B5/742—Details of notification to user or communication with user or patient; User input means using visual displays
- A61B5/7425—Displaying combinations of multiple images regardless of image source, e.g. displaying a reference anatomical image with a live image
-
- A—HUMAN NECESSITIES
- A61—MEDICAL OR VETERINARY SCIENCE; HYGIENE
- A61B—DIAGNOSIS; SURGERY; IDENTIFICATION
- A61B8/00—Diagnosis using ultrasonic, sonic or infrasonic waves
- A61B8/08—Clinical applications
- A61B8/0891—Clinical applications for diagnosis of blood vessels
-
- A—HUMAN NECESSITIES
- A61—MEDICAL OR VETERINARY SCIENCE; HYGIENE
- A61B—DIAGNOSIS; SURGERY; IDENTIFICATION
- A61B8/00—Diagnosis using ultrasonic, sonic or infrasonic waves
- A61B8/12—Diagnosis using ultrasonic, sonic or infrasonic waves in body cavities or body tracts, e.g. by using catheters
-
- A—HUMAN NECESSITIES
- A61—MEDICAL OR VETERINARY SCIENCE; HYGIENE
- A61B—DIAGNOSIS; SURGERY; IDENTIFICATION
- A61B8/00—Diagnosis using ultrasonic, sonic or infrasonic waves
- A61B8/46—Ultrasonic, sonic or infrasonic diagnostic devices with special arrangements for interfacing with the operator or the patient
- A61B8/461—Displaying means of special interest
- A61B8/463—Displaying means of special interest characterised by displaying multiple images or images and diagnostic data on one display
-
- A—HUMAN NECESSITIES
- A61—MEDICAL OR VETERINARY SCIENCE; HYGIENE
- A61B—DIAGNOSIS; SURGERY; IDENTIFICATION
- A61B8/00—Diagnosis using ultrasonic, sonic or infrasonic waves
- A61B8/48—Diagnostic techniques
- A61B8/488—Diagnostic techniques involving Doppler signals
-
- A—HUMAN NECESSITIES
- A61—MEDICAL OR VETERINARY SCIENCE; HYGIENE
- A61B—DIAGNOSIS; SURGERY; IDENTIFICATION
- A61B8/00—Diagnosis using ultrasonic, sonic or infrasonic waves
- A61B8/52—Devices using data or image processing specially adapted for diagnosis using ultrasonic, sonic or infrasonic waves
- A61B8/5207—Devices using data or image processing specially adapted for diagnosis using ultrasonic, sonic or infrasonic waves involving processing of raw data to produce diagnostic data, e.g. for generating an image
-
- A—HUMAN NECESSITIES
- A61—MEDICAL OR VETERINARY SCIENCE; HYGIENE
- A61B—DIAGNOSIS; SURGERY; IDENTIFICATION
- A61B8/00—Diagnosis using ultrasonic, sonic or infrasonic waves
- A61B8/52—Devices using data or image processing specially adapted for diagnosis using ultrasonic, sonic or infrasonic waves
- A61B8/5215—Devices using data or image processing specially adapted for diagnosis using ultrasonic, sonic or infrasonic waves involving processing of medical diagnostic data
- A61B8/5223—Devices using data or image processing specially adapted for diagnosis using ultrasonic, sonic or infrasonic waves involving processing of medical diagnostic data for extracting a diagnostic or physiological parameter from medical diagnostic data
-
- A—HUMAN NECESSITIES
- A61—MEDICAL OR VETERINARY SCIENCE; HYGIENE
- A61B—DIAGNOSIS; SURGERY; IDENTIFICATION
- A61B8/00—Diagnosis using ultrasonic, sonic or infrasonic waves
- A61B8/54—Control of the diagnostic device
-
- G—PHYSICS
- G16—INFORMATION AND COMMUNICATION TECHNOLOGY [ICT] SPECIALLY ADAPTED FOR SPECIFIC APPLICATION FIELDS
- G16H—HEALTHCARE INFORMATICS, i.e. INFORMATION AND COMMUNICATION TECHNOLOGY [ICT] SPECIALLY ADAPTED FOR THE HANDLING OR PROCESSING OF MEDICAL OR HEALTHCARE DATA
- G16H50/00—ICT specially adapted for medical diagnosis, medical simulation or medical data mining; ICT specially adapted for detecting, monitoring or modelling epidemics or pandemics
- G16H50/30—ICT specially adapted for medical diagnosis, medical simulation or medical data mining; ICT specially adapted for detecting, monitoring or modelling epidemics or pandemics for calculating health indices; for individual health risk assessment
-
- A—HUMAN NECESSITIES
- A61—MEDICAL OR VETERINARY SCIENCE; HYGIENE
- A61B—DIAGNOSIS; SURGERY; IDENTIFICATION
- A61B2562/00—Details of sensors; Constructional details of sensor housings or probes; Accessories for sensors
- A61B2562/02—Details of sensors specially adapted for in-vivo measurements
- A61B2562/0247—Pressure sensors
-
- A—HUMAN NECESSITIES
- A61—MEDICAL OR VETERINARY SCIENCE; HYGIENE
- A61B—DIAGNOSIS; SURGERY; IDENTIFICATION
- A61B5/00—Measuring for diagnostic purposes; Identification of persons
- A61B5/02—Detecting, measuring or recording for evaluating the cardiovascular system, e.g. pulse, heart rate, blood pressure or blood flow
- A61B5/026—Measuring blood flow
- A61B5/0261—Measuring blood flow using optical means, e.g. infrared light
-
- A61B5/0452—
-
- A—HUMAN NECESSITIES
- A61—MEDICAL OR VETERINARY SCIENCE; HYGIENE
- A61B—DIAGNOSIS; SURGERY; IDENTIFICATION
- A61B5/00—Measuring for diagnostic purposes; Identification of persons
- A61B5/24—Detecting, measuring or recording bioelectric or biomagnetic signals of the body or parts thereof
- A61B5/316—Modalities, i.e. specific diagnostic methods
- A61B5/318—Heart-related electrical modalities, e.g. electrocardiography [ECG]
- A61B5/346—Analysis of electrocardiograms
- A61B5/349—Detecting specific parameters of the electrocardiograph cycle
-
- A—HUMAN NECESSITIES
- A61—MEDICAL OR VETERINARY SCIENCE; HYGIENE
- A61B—DIAGNOSIS; SURGERY; IDENTIFICATION
- A61B8/00—Diagnosis using ultrasonic, sonic or infrasonic waves
- A61B8/52—Devices using data or image processing specially adapted for diagnosis using ultrasonic, sonic or infrasonic waves
- A61B8/5284—Devices using data or image processing specially adapted for diagnosis using ultrasonic, sonic or infrasonic waves involving retrospective matching to a physiological signal
Definitions
- the presently disclosed and/or claimed inventive concept(s) relates generally to a hemodynamic monitoring device and methods of making and using same.
- the hemodynamic monitoring device and its use are particularly well-suited for the measurement of respiratory cycle data simultaneously with at least one of central venous blood pressure and intravascular blood flow velocity and thereafter correlating these measurements to monitor mammalian patients such as humans.
- the hemodynamic monitoring device is capable of providing data and information correlating to a fluid responsiveness of the mammalian patient on a continuing basis and in real-time.
- the respiratory cycle data of the mammalian patient is correlated with at least one of velocity of blood flow in the superior vena cava and central venous blood pressure in order to provide data and information that is thereby calculated and correlated with the fluid responsive state of the patient.
- the respiratory cycle data of the mammalian patient is correlated with at least one of velocity of blood flow in the superior vena cava in order to provide data and information that is thereby calculated and correlated with the level of right ventricle dysfunction and/or acute pulmonary hypertension in the patient.
- the hemodynamic device includes sensors to minimally invasively measure the velocity of blood flow in the superior vena cava, central venous blood pressures, and the respiratory cycle data of the patient.
- Hemodynamic monitoring is a central aspect of cardiovascular diagnosis and titration of care.
- circulatory shock results primarily in inadequate tissue blood flow.
- most forms of shock may show some increase in cardiac output initially in response to fluid loading, it has been estimated that at least fully one-half of all hemodynamically unstable intensive care unit patients are not preload responsive. See, e.g., Michael, F. et al., “Predicting fluid responsiveness in ICU patients: a critical analysis of the evidence,” Chest 2002; 121:2000-2008, the entire contents of which are hereby incorporated by reference in their entirety.
- a reduction in intravascular volume results in a fall in stroke volume, which is initially compensated for by an increase in heart rate thereby maintaining cardiac output. However, with further volume depletion cardiac output and then blood pressure falls. This is associated with a reduction in organ perfusion. At the organ level, the local autoregulatory mechanism attempts to maintain tissue perfusion.
- the patient's hemodynamic state can oftentimes rapidly change as it is influenced by a host of intertwined and interdependent factors.
- CVP central venous pressure
- PAOP pulmonary artery occlusion pressure
- Dynamic indices provide for a higher degree of accuracy in fluid responsiveness determinations with significantly reduced invasiveness.
- Preload of the heart is defined as the wall stress at the end of diastole, i.e., left ventricular end-diastolic volume (LVEDV).
- LVEEDV left ventricular end-diastolic volume
- Direct measurement of wall stress in vivo is difficult if not impossible within an emergency medicine department, surgical theater, and/or intensive care environment.
- end diastolic volumes or pressures have been used as proxies of wall stress, both have significant limitations.
- an accurate measure of preload at a point in time does not necessarily reflect fluid-responsiveness.
- An understanding of the Frank-Starling curve (an example of which is shown in FIG. 1 ) is fundamental to understanding the concept of fluid-responsiveness.
- the slope of the relationship between ventricular preload and stroke volume (SV) depends on ventricular contractility.
- preload In critically ill patients it is therefore important not only to determine the patients' preload (LVEDV) but their fluid responsiveness, i.e., to whether the patient will increase their stroke volume or cardiac output with fluid loading. Therefore, even a precise measurement of left ventricular preload does not determine if that left ventricle is fluid-responsive (i.e., if it will increase cardiac output in response to increased volume). Additionally, the relationship between preload and stroke volume is curvilinear rather than linear as can be seen in FIG. 1 .
- CVP central venous pressure
- the basis for using CVP to guide fluid management comes from the dogma that CVP reflects intravascular volume; specifically, it is widely believed that patients with a low CVP are volume depleted while patients with a high CVP are volume overloaded.
- a change in CVP following a fluid challenge is thereby used to guide subsequent fluid management decisions.
- CVP describes the pressure of blood in the thoracic vena cava near the right atrium of the heart.
- CVP is a good approximation of right atrial pressure, which is a major determinant of right ventricular filling.
- CVP cardiac pressure
- right ventricular stroke volume determines left ventricular filling
- the CVP is assumed to be an indirect measure of left ventricular preload.
- intrathoracic pressures positive end expiratory pressure, etc.
- left and right ventricular compliance and geometry that occurs in critically ill patients
- the right ventricular end-diastolic volume may not accurately reflect the patient's position on the Frank-Starling curve and, therefore, their preload reserve.
- pulmonary artery catheter This device is highly invasive and requires a catheter to be introduced through a large vein such as the jugular, subclavian, or femoral vein.
- the catheter is threaded through the right atrium and ventricle of the heart and into the pulmonary artery.
- the standard pulmonary artery catheter also known as a “Swan-Ganz” catheter
- the balloon when inflated, causes the catheter to “wedge” in a small pulmonary blood vessel.
- the catheter can provide a measurement of the blood pressure in the left atrium of the heart, termed Left Ventricular End Diastolic Pressure or LVEDP.
- LVEDP Left Ventricular End Diastolic Pressure
- Modern catheters have multiple lumens (multiple tubes) and have openings along the length to allow administration of inotropes and other drugs directly into the right atrium of the heart.
- the addition of a small thermistor temperature probe about 3 centimeters behind the tip allows the measurement of blood flow following calibration by means of the injection of a known volume and known temperature of cold fluid. As this cooler fluid passes the thermistor, a brief drop in the blood temperature is recorded. The resulting information can be used to compute and plot a thermodilution curve.
- a blood flow and pressure map can be calculated.
- the procedure is not without risk, and complications can be life threatening. It can lead to arrhythmias, rupture of the pulmonary artery, thrombosis, infection, pneumothorax, bleeding, and other life-threatening complications.
- PAOP pulmonary artery occlusion pressure
- PAOP suffers many of the limitations of CVP: (i) PAOP is a measure of left ventricular end-diastolic pressure and not LVEDV or LV preload; (ii) use of PAOP to measure left ventricular preload assumes a direct relationship between the left ventricular end-diastolic pressure and LVEDV while the Frank-Starling principle shows that the pressure-volume curve describing left ventricular compliance is curvilinear; and (iii) alterations in left ventricular compliance shift the pressure-volume curve, for example.
- Transesophageal echocardiography has also been used to assess left ventricular dimensions in patients undergoing mechanical ventilation.
- the left ventricular end-diastolic area has been shown to correlate with the intrathoracic blood volume (ITBV) and global end-diastolic volume (GEDV), as well as with LVEDV as measured by scintography.
- IBV intrathoracic blood volume
- GEDV global end-diastolic volume
- an end-diastolic diameter of ⁇ 25 mm and a LVEDA of ⁇ 55 cm2 have been used to diagnose hypovolemia. While a number of studies have found the LVEDA to be a good predictor of fluid responsiveness, other studies have failed to replicate such findings.
- a major limitation of echocardiography is that it provides a snapshot of ventricular function at a single period in time.
- Dynamic indices such as pulse pressure variation (PPV) and stroke volume variation (SVV) have traditionally applied a controlled and reversible preload variation and thereafter measured the hemodynamic response. This can be done by observing the cardiovascular response to positive pressure ventilation, or to reversible preload-increasing maneuvers, such as passive leg raising.
- One such prior art dynamic indices is a measurement of stroke volume variation which examines the differences between the stroke volume during the inspiratory and expiratory phases of ventilation and requires a means to directly or indirectly assess stroke volume. Stroke volume variation processes have traditionally required invasive monitoring such as aortic flow probes.
- the principles underlying both PPV and SVV are based on the concept that intermittent positive pressure ventilation induces cyclic changes in the loading conditions of the left (LV) and right (RV) ventricles.
- Mechanical insufflation decreases preload and increases afterload of the RV.
- the RV preload reduction is due to the decrease in the venous return pressure gradient that is related in the inspiratory increase in pleural pressure.
- the increase in RV afterload is related to the inspiratory increase in transpulmonary pressure.
- the reduction in RV preload and increase in RV afterload both lead to a decrease in RV stroke volume, which is at a minimum at the end of the inspiratory period.
- the inspiratory reduction in RV ejection leads to a decrease in LV filling after a phase lag of two or three heart beats because of the long blood pulmonary transit time.
- the LV preload reduction may induce a decrease in LV stroke volume, which is at its minimum during the expiratory period.
- the cyclic changes in RV and LV stroke volume are greater when the ventricles operate on the steep rather than the flat portion of the Frank-Starling curve (see FIG. 1 ). Therefore, the magnitude of the respiratory changes in LV stroke volume is an indicator of biventricular preload dependence. It should be noted that arrhythmias and spontaneous breathing activity may lead to misinterpretations of the respiratory variations in PPV and SVV.
- artery such as the radial, femoral, dorsalis pedis, or brachial artery
- PPV monitoring measures arterial blood pressure measured invasively through an arterial cannula placed in an artery, such as the radial, femoral, dorsalis pedis, or brachial artery.
- the arterial cannula is connected to a sterile, fluid-filled system, which is attached to an electronic pressure transducer.
- Pressure is constantly monitored beat-by-beat, and a waveform (a graph of pressure against time) can be displayed.
- Vascular pressure parameters such as systolic, diastolic, and mean arterial pressure, are derived and displayed simultaneously for pulsatile waveforms.
- Such devices utilize pulse contour or pulse pressure wave analysis where the area under the systolic pressure wave curve is integrated, or wave characteristics are analyzed, and, when calibrated against either dye dilution or thermodilution, provide estimates of blood flow volume.
- Cannulation for invasive vascular pressure monitoring is, however, associated with complications such as extravasation, thrombosis, and infection among other life threatening conditions. Patients with invasive arterial monitoring require very close supervision, as there is a danger of severe bleeding if the arterial line becomes disconnected.
- Peripheral vascular pressure monitoring devices are also known to be problematic in monitoring rapid changes in patients who are hemodynamically unstable. As such, these devices may and do lead to erroneous cardiac output measurements during the administration of vasoactive drugs, during loss of circulating volume, e.g., hemorrhage, insufflation of the abdomen for laparoscopic surgery, pathophysiological diseases resulting in abnormal arterial pressure waves, and positional changes during surgery.
- drugs which create vasoconstriction result in an increase in systemic resistance and thus an increase in pressure which is interpreted as an increase in flow, whereas blood flow typically decreases as systemic resistance increases as the heart is acting to pump against increased resistance.
- drugs which have a vasodilation effect result in a decrease in resistance to blood flow and typically blood pressure falls which is interpreted as a reduction in flow, whereas blood flow typically increases as systemic resistance decreases as the heart is acting to pump against a reduced resistance.
- Calibration is essential for absolute value accuracy and, in operating room conditions such calibration is complex to perform, is time consuming, needs to be repeated frequently, introduces chemical agents which may be toxic, and may be of limited accuracy in the presence of other drugs administered during patient treatment.
- extravascular ultrasound technologies discussed further below
- arterial blood pressure monitoring also requires the presence of a trained and experienced operator.
- SVC superior vena cava
- a disadvantage in monitoring SVC diameter variation as a dynamic indices of fluid responsiveness is that it requires transesophageal echocardiography which has all of the same disadvantages and limitations of other types of extravascular ultrasound—sensitivity to movement, user training and maintenance, and oftentimes difficult to visualize anatomical structures.
- Extravascular Doppler measurements of variations of stroke volume have been used as an ultrasound technique for assessing dynamic indices of volume responsiveness. Fluctuations in stroke volume associated with ventilator cycling are greater in the hypovolemic patient than in the completely resuscitated patient. See, e.g., Feissel M. et al., “Respiratory changes in aortic blood velocity as an indicator of fluid responsiveness in ventilated patients with septic shock,” Chest 2001; 119:867-73, the entire contents of which are hereby incorporated by reference in their entirety.
- the extravascular measurement of stroke volume by use of ultrasound and the Doppler principle relies upon the use of a probe containing piezoelectric crystals that are caused to emit either continuous wave or pulse wave ultrasound extravascularly into an adjacent arterial blood vessel.
- the probe may be located either in the esophagus, trachea, or is placed on the body surface in a position where an artery can be monitored.
- Such extravascular flow based measurements are, however, difficult to perform and require the presence of an operator that is capable of maintaining properly placement, alignment, and calibration of the ultrasound probe.
- the ultrasound beam is directional and is sensitive to movement, which requires the operator to check the beam's focus and thus the device cannot be considered to be providing continuous monitoring without operator attendance.
- PAP pulmonary arterial pressure
- ICU intensive care units
- PAP pulmonary arterial pressure
- severe acute pulmonary hypertension leading to life threatening complications including, but not limited to, refractory systemic arterial hypotension, severe hypoxemia, right ventricular (RV) dysfunction and failure, and ultimately resulting in cardiogenic and/or obstructive shock and death.
- Clinical presentation, physical exam, electrocardiogram, ultrasound, and chest radiography can suggest pulmonary circulation abnormality.
- those data are not either specific enough or continuous to be useful in early diagnoses of acute pulmonary hypertension in intensive care units, nor for determining whether signs of acute pulmonary hypertension are hemodynamically significant.
- Pulmonary Artery Catheter capable of PAP monitoring has been significantly reduced due to its invasiveness and related safety concerns. Pulmonary hypertension is usually recognized when the patient develops obvious signs of progressive right ventricular failure, and during hemodynamic monitoring by echocardiogram or a pulmonary artery catheterization. Unfortunately, in most cases acute pulmonary hypertension remains under diagnosed or undiagnosed and treatment begins only after serious complications have developed. See, for example, Tsapenko et al., “Arterial pulmonary hypertension in noncardiac intensive care unit,” Vascular Health and Risk Management 2008:4(5) 1043-1060, the entire contents of which are hereby incorporated by reference in their entirety.
- the stronger the leak means the stronger the dilation of the right ventricle and the higher the level of right heart dysfunction caused by acute pulmonary hypertension onset.
- Current systems may monitor TR at the tricuspid valve using non-invasive TTE or TEE probes, producing data interpreted by sono specialists.
- the presently disclosed and/or claimed inventive concept(s) disclose a method and apparatus that combines measurement of intravascular blood flow velocities simultaneously with respiratory cycle data to provide monitoring of a patient's fluid-responsive state and/or level of right ventricle dysfunction and/or acute pulmonary hypertension in a minimally invasive and operator independent process, thereby overcoming one or more of the aforementioned drawbacks found in the prior art apparatuses and techniques.
- FIG. 1 depicts an exemplary Frank-Starling curve.
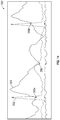
- FIG. 2 depicts a screenshot of an exemplary display of waveforms in accordance with the present disclosure.
- FIG. 3 is a perspective view of an exemplary hemodynamic monitoring device constructed in accordance with the present disclosure.
- FIG. 4 is a block diagram of a computer, a display and a patient interface unit of the hemodynamic monitoring device depicted in FIG. 3 .
- FIG. 5 is an exemplary block diagram of the patient interface unit depicted in FIG. 3 .
- FIG. 6 depicts a screenshot of VRV Index data in accordance with the present disclosure.
- FIG. 7 depicts a screenshot of PPV Index data in accordance with the present disclosure.
- FIG. 8 depicts a screenshot of an exemplary display of a respiration waveform in accordance with the present disclosure.
- FIG. 9 depicts a screenshot of an exemplary display of waveforms in accordance with the present disclosure.
- FIG. 10 depicts yet another screenshot of an exemplary display of waveforms in accordance with the present disclosure.
- FIG. 11 depicts a screenshot of an exemplary display of a Doppler velocity waveform in accordance with the present disclosure.
- FIG. 12 depicts another screenshot of an exemplary display of a Doppler velocity waveform in accordance with the present disclosure.
- FIG. 13 depicts an example of a screenshot in accordance with the present disclosure displaying waveforms.
- FIG. 14 depicts an example of a screenshot displaying waveform with point analysis in accordance with the present disclosure.
- FIG. 15 depicts a screenshot of an exemplary display of trend data in accordance with the present disclosure.
- FIG. 16 depicts a screenshot of an exemplary display of Frank-Starling curves in accordance with the present disclosure.
- a hemodynamic monitoring device may include a first sensor configured to measure a velocity of blood flow in an adjacently-located portion of a superior vena cava of a mammalian patient using ultrasound waves; a second sensor configured to measure respiratory cycle data of the mammalian patient; an input for receiving the measured velocity of blood flow and the measured respiratory cycle data; and a computer configured to process the measured velocity of blood flow and the measured respiratory cycle data to provide hemodynamic parameters corresponding to the mammalian patient.
- a hemodynamic monitoring device may comprise one or more processors executing logic to cause the hemodynamic monitoring device to receive one or more first electrical signals indicative of a fluid flow rate within an interior portion of a venous structure of a mammalian patient; receive one or more second electrical signals indicative of a respiratory cycle of the mammalian patient; analyze data indicative of the one or more first and second electrical signals to determine a fluid responsive state of the mammalian patient; and output at least one of visual indicia and audio communications representing the fluid responsive state of the mammalian patient to a user.
- a system for assessing hemodynamic parameters in a venous structure of a mammalian patient may comprise a catheter assembly having a distal end, a proximal end, and at least one lumen extending therebetween, the distal end of the catheter assembly capable of being advanced into an interior portion of the venous structure, wherein the distal end of the catheter assembly further comprises a first sensor configured to measure a fluid flow rate in the interior portion of the venous structure using ultrasound waves; a second sensor configured to measure respiratory cycle data of the mammalian patient; and a control unit configured to (i) cause the first sensor to emit an ultrasound wave and sense a response to the ultrasound wave, (ii) determine a flow rate of fluid passing through the venous structure using the sensed response to the ultrasound wave, and (iii) communicate to a user at least one of visual indicia and audio communications representing the fluid flow rate through the venous structure and the respiratory cycle data.
- a system for assessing hemodynamic parameters in a venous structure of a mammalian patient may comprise an elongate member deliverable to a venous structure of the mammalian patient such that a distal end of the elongate member penetrates the venous structure and is thereafter positioned within an interior portion of the venous structure, the distal end of the elongate member including a Doppler ultrasound sensor; a second sensor configured to measure respiratory cycle data of the mammalian patient; and a control unit configured to (i) cause the Doppler ultrasound sensor to emit an ultrasound wave, (ii) cause the Doppler ultrasound sensor to sense a response of the emitted ultrasound wave, (iii) determine a fluid flow rate through the venous structure and a respiratory cycle waveform of the mammalian patient, and (iv) communicate to a user at least one of visual indicia and audio communications representing the fluid flow rate through the venous structure and the respiratory cycle waveform of the ma
- a method for assessing hemodynamic parameters in a venous structure of a mammalian patient may comprise the steps of receiving by a control unit one or more velocity input electrical signals, wherein the one or more input electrical signals are indicative of a velocity of fluid flow through the venous structure during a predetermined period of time; receiving by the control unit one or more respiratory input electrical signals, wherein the one or more respiratory electrical signals are indicative of a respiratory cycle waveform of a mammalian patient during the predetermined period of time, the respiratory cycle waveform comprising an inspiration time period and an expiration time period; analyzing by the control unit the one or more velocity input electrical signals and the one or more respiratory input electrical signals to determine changes in the velocity of fluid flow during the inspiration time period; and outputting by the control unit at least one output electrical signal responsive to the one or more velocity input electrical signals and the one or more respiratory input electrical signals to indicate at least one hemodynamic parameter of the mammalian patient.
- a method of assessing hemodynamic parameters in a venous structure of a mammalian patient may comprise the steps of inserting a distal end of a catheter through a tissue of the mammalian patient such that the distal end of the catheter is substantially adjacent an interior portion of the venous structure and a proximal end of the catheter is outside the mammalian patient and connected to a control unit, wherein the distal end of the catheter contains a Doppler ultrasound sensor; placing a respiratory sensor configured to measure respiratory cycle data on the mammalian patient; and activating a control unit configured to: (i) cause the Doppler ultrasound sensor to emit an ultrasound wave and sense a response to the ultrasound wave, (ii) determine a flow rate of fluid passing through the venous structure using the sensed response to the ultrasound wave, and (iii) communicate to a user at least one of visual indicia and audio communications representing the fluid flow rate through the venous structure and the respiratory cycle data.
- a hemodynamic monitoring device may comprise one or more processors executing logic to cause the hemodynamic monitoring device to receive one or more first electrical signals indicative of a fluid flow rate within an interior portion of a venous structure of a mammalian patient; receive one or more second electrical signals indicative of a respiratory cycle of the mammalian patient; analyze the one or more first and second electrical signals to determine a right ventricle dysfunctional state of the mammalian patient; and output at least one of visual indicia and audio communications representing the right ventricle dysfunctional state of the mammalian patient to a user.
- a system for assessing hemodynamic parameters in a venous structure of a mammalian patient may comprise a catheter assembly having a distal end, a proximal end, and at least one lumen extending therebetween, the distal end of the catheter assembly capable of being advanced into an interior portion of the venous structure, wherein the distal end of the catheter assembly further comprises a first sensor configured to measure a fluid flow rate in the interior portion of the venous structure using ultrasound waves; a second sensor configured to measure respiratory cycle data of the mammalian patient; and a control unit configured to (i) cause the first sensor to emit an ultrasound wave and sense a response to the ultrasound wave, (ii) determine a flow rate of fluid passing through the venous structure using the sensed response to the ultrasound wave, and (iii) communicate to a user at least one of visual indicia and audio communications representing the fluid flow rate through the venous structure and the respiratory cycle data.
- a system for assessing hemodynamic parameters in a venous structure of a mammalian patient may comprise an elongate member deliverable to a venous structure of the mammalian patient such that a distal end of the elongate member penetrates the venous structure and is thereafter positioned within an interior portion of the venous structure, the distal end of the elongate member including a Doppler ultrasound sensor; a second sensor configured to measure respiratory cycle data of the mammalian patient; and a control unit configured to (i) cause the Doppler ultrasound sensor to emit an ultrasound wave, (ii) cause the Doppler ultrasound sensor to sense a response of the emitted ultrasound wave, (iii) determine a fluid flow rate through the venous structure and a respiratory cycle waveform of the mammalian patient, and (iv) communicate to a user at least one of visual indicia and audio communications representing the fluid flow rate through the venous structure and the respiratory cycle waveform of the ma
- a method for assessing hemodynamic parameters in a venous structure of a mammalian patient may comprise the steps of receiving by a control unit one or more velocity input electrical signals, wherein the one or more input electrical signals are indicative of a velocity of fluid flow through the venous structure during a predetermined period of time; receiving by the control unit one or more respiratory input electrical signals, wherein the one or more respiratory electrical signals are indicative of a respiratory cycle waveform of a mammalian patient during the predetermined period of time, the respiratory cycle waveform comprising an inspiration time period and an expiration time period; analyzing by the control unit the one or more velocity input electrical signals and the one or more respiratory input electrical signals to determine changes in the velocity of fluid flow during the inspiration time period; and outputting by the control unit at least one output electrical signal responsive to the one or more velocity input electrical signals and the one or more respiratory input electrical signals to indicate at least one hemodynamic parameter of the mammalian patient.
- a method of assessing hemodynamic parameters in a venous structure of a mammalian patient may comprise the steps of inserting a distal end of a catheter through a tissue of the mammalian patient such that the distal end of the catheter is substantially adjacent an interior portion of the venous structure and a proximal end of the catheter is outside the mammalian patient and connected to a control unit, wherein the distal end of the catheter contains a Doppler ultrasound sensor; placing a respiratory sensor configured to measure respiratory cycle data on the mammalian patient; and activating a control unit configured to: (i) cause the Doppler ultrasound sensor to emit an ultrasound wave and sense a response to the ultrasound wave, (ii) determine a flow rate of fluid passing through the venous structure using the sensed response to the ultrasound wave, and (iii) communicate to a user at least one of visual indicia and audio communications representing the fluid flow rate through the venous structure and the respiratory cycle data.
- one or more velocity input electrical signals may be produced by an intravascular Doppler ultrasound probe sensor and/or a Laser Doppler Velocimetry sensor and/or an ultrasound M-Mode sensor.
- a sensor may also measure the diameter of a vein in substantially the same location where the blood velocity is monitored.
- the designated value may vary by plus or minus twelve percent, or eleven percent, or ten percent, or nine percent, or eight percent, or seven percent, or six percent, or five percent, or four percent, or three percent, or two percent, or one percent.
- the use of the term “at least one” will be understood to include one as well as any quantity more than one, including but not limited to, 2, 3, 4, 5, 10, 15, 20, 30, 40, 50, 100, etc.
- the term “at least one” may extend up to 100 or 1000 or more, depending on the term to which it is attached; in addition, the quantities of 100/1000 are not to be considered limiting, as higher limits may also produce satisfactory results.
- the words “comprising” (and any form of comprising, such as “comprise” and “comprises”), “having” (and any form of having, such as “have” and “has”), “including” (and any form of including, such as “includes” and “include”) or “containing” (and any form of containing, such as “contains” and “contain”) are inclusive or open-ended and do not exclude additional, unrecited elements or method steps.
- A, B, C, or combinations thereof refers to all permutations and combinations of the listed items preceding the term.
- “A, B, C, or combinations thereof” is intended to include at least one of: A, B, C, AB, AC, BC, or ABC and, if order is important in a particular context, also BA, CA, CB, CBA, BCA, ACB, BAC, or CAB.
- expressly included are combinations that contain repeats of one or more item or term, such as BB, AAA, AAB, BBC, AAABCCCC, CBBAAA, CABABB, and so forth.
- BB BB
- AAA AAA
- AAB BBC
- AAABCCCCCC CBBAAA
- CABABB CABABB
- the terms “provide,” “providing” and variations thereof as used herein comprise displaying, or providing for display, a screen either by one or more monitors (hereinafter referred to as a monitor) via a computer located locally with respect to the monitor or by a host computer located remotely from the monitor.
- the computer or host computer may interface with a computer network and/or allow the one or more computer to obtain information from a host computer by sending and/or receiving digital and/or optical signals via a computer network interface (e.g., an Ethernet port, a TC/IP port, an optical port, a cable modem, and combinations thereof), for example.
- a computer network interface e.g., an Ethernet port, a TC/IP port, an optical port, a cable modem, and combinations thereof
- any reference to “one embodiment” or “an embodiment” means that a particular element, feature, structure, or characteristic described in connection with the embodiment is included in at least one embodiment.
- the appearances of the phrase “in one embodiment” in various places in the specification are not necessarily all referring to the same embodiment.
- the hemodynamic monitoring device is capable of collecting data from a mammalian patient (such as a human), transforming the collected data into information correlated with a fluid responsiveness and/or level of right ventricle dysfunction and/or acute pulmonary hypertension of the mammalian patient, and providing the information in a format capable of being perceived by a healthcare provider such as a doctor or a nurse.
- a healthcare provider such as a doctor or a nurse.
- Such data is collected, transformed and provided on a continuing basis and in real-time (i.e., in a dynamic manner).
- the data collected from the mammalian patient may include respiratory cycle data and at least one of a velocity of blood flow in the superior vena cava, central venous pressure, and combinations thereof.
- the respiratory cycle data of the mammalian patient may be correlated with at least one of the velocity of blood flow in the superior vena cava, the central venous pressure, the diameter of the superior vena cava, and combinations thereof in order to provide information that is thereby calculated and correlated with the fluid responsive state and/or level of right ventricle dysfunction and/or acute pulmonary hypertension of the patient.
- the hemodynamic monitoring device includes sensors to minimally invasively measure the velocity of blood flow in the superior vena cava, central venous blood pressure, diameter of the superior vena cava, and/or the respiratory cycle data of the patient.
- changes in the superior vena cava diameter as well as changes in the velocities of blood flow in the superior vena cava and in the central venous pressure occurring throughout the respiratory cycle data are sensed by the sensors and provided to a patient device and a computer in a continuing and real-time manner.
- the computer transforms the data into information correlated with the fluid responsiveness and/or level of right ventricle dysfunction and/or acute pulmonary hypertension of the mammalian patient, and provides the information to a display in order to provide an observer of the data, e.g., a surgeon, nurse or anesthesiologist, with a dynamic indicator of the fluid responsive state and/or level of right ventricle dysfunction and/or acute pulmonary hypertension of the patient.
- the hemodynamic monitoring device includes suitable hardware and software to obtain measurements of the respiratory cycle data of the patient and correlate this information with at least one of (1) velocity of blood flow in the patient's superior vena cava, (2) the patient's central venous blood pressure, (3) the diameter of the superior vena cava, and (4) combinations thereof.
- One aspect of the presently disclosed and/or claimed inventive concept(s) is to combine the beneficial attributes of blood flow within the superior vena cava, as measured by a Doppler ultrasound sensor and/or a Laser Doppler Velocimetry sensor and/or an ultrasound M-Mode sensor, with data representing the respiratory cycle of the patient as measured by an airway pressure transducer assembly, for example.
- Another aspect of the presently disclosed and/or claimed inventive concept(s) is to combine the beneficial attributes of central venous pressure within the superior vena cava, as measured by way of venous pressure sensor technologies, with data representing the respiratory cycle of the patient as measured by an airway pressure transducer assembly, for example.
- Yet another aspect of the presently disclosed and/or claimed inventive concept(s) is the combination of the beneficial attributes of central venous pressure and blood flow within the superior vena cava, as measured by way of Doppler ultrasound sensor, and/or Laser Doppler Velocimetry sensor, and venous pressure sensor technologies, with data representing the respiratory cycle of the patient as measured by an airway pressure transducer assembly, for example.
- the data collected by the Doppler ultrasound sensor, the airway pressure transducer assembly (for example), and the venous pressure sensor technologies may be provided to a patient interface unit in an analog format.
- the patient interface unit may transform the data in the analog format into digital data which can be transferred to the computer by way of a data bus.
- the patient interface unit may transform the analog data into a USB 2.0 format, or the like.
- the hemodynamic monitoring device includes a first sensor configured to measure a velocity of blood flow in an adjacently located portion of the superior vena cava of a patient; a second sensor configured to measure respiratory cycle data of the patient; and the patient device for receiving the data indicative of measured velocity of blood flow and the measured respiratory cycle data.
- the hemodynamic monitoring device receives signals from each of the first and second sensors (which may be in digital and/or analog format) representing the measured velocity of blood flow and the measured respiratory cycle data and thereafter processes and transforms the measured velocity of blood flow and the measured respiratory cycle data to provide hemodynamic parameters corresponding to the mammalian patient.
- Velocity of blood flow measurements (“blood flow measurements”) within the superior vena cava may be made by the first sensor simultaneously with measurements of the respiratory cycle data of the patient by the second sensor and then correlated and transformed into information for monitoring the patient's fluid responsive state and/or level of right ventricle dysfunction and/or acute pulmonary hypertension.
- the first sensor configured to measure velocity of blood flow measurements may include an intravascular Doppler probe placed within a central venous catheter of the mammalian patient.
- the intravascular Doppler probe may utilize a continuous wave or pulse wave ultrasound beam or laser beam for the measurement of blood flow in the superior vena cava to thereby generate analog and/or digital signals indicative of the measurements of the blood flow.
- the signals obtained from the intravascular Doppler are interpreted to thereby provide an instant peak velocity of blood flow at one or more discrete measurement times.
- the intravascular Doppler probe provides signals correlating to or representing a series of instant peak velocities over a predefined period of time.
- the intravascular Doppler probe may provide signals correlating to or representing a series of instant peak velocities for 5, 10, 20, 30, 40, 50, 60 seconds and/or 1, 5, and/or 10 minutes—that is, the instant peak velocities may be obtained for any time period desired by the practitioner or clinician.
- the series of instant peak velocities obtained through the signals provided by the intravascular Doppler probe may provide, over time, a waveform representing the instant peak velocity of the blood flow as encountered by the patient over predefined period of time (as shown in FIG. 2 ).
- the respiratory cycle data measurements are made by the second sensor.
- the second sensor may include a monitoring sensor placed adjacent to an appropriate anatomical structure wherein the monitoring sensor is capable of acquiring data indicative of respiratory cycle data of the patient.
- the second sensor may include ECG sensors attached to the mammalian patient for acquiring the respiratory cycle data (in analog and/or digital format) utilizing impedance measurements.
- ECG data may include such data as Heart Rate (HR) (number of R-R wave intervals per minute), Heart Rhythm, Extrasystoles, and/or P-wave detection data.
- the second sensor may include an airway pressure transducer attached or operatively coupled with a ventilation assembly artificially ventilating the patient to acquire the respiratory cycle data (in analog and/or digital format).
- the hemodynamic monitoring device 10 is provided with a patient interface unit 14 , a display 18 , a computer 22 , a first sensor 26 , a second sensor 30 , and an optional third sensor 34 .
- Additional sensors can also be configured and used with the hemodynamic monitoring device 10 , e.g., sensors for central venous pressure measurement, arterial pressure measurement, and airway pressure measurement.
- the patient interface unit 14 , the display 18 , the computer 22 , the first sensor 26 , the second sensor 30 and the optional third sensor 34 are all adapted and configured to communicate with one another utilizing any suitable technology such as cables and/or wireless communication systems.
- the first sensor 26 , the second sensor 30 and the optional third sensor 34 collect multiple different types of data simultaneously from the mammalian patient and then provide the collected data to the patient interface unit 14 via signal paths 36 , 38 and 40 .
- the signal paths 36 , 38 and 40 may be cables which convey the data in electronic form.
- the data collected from the mammalian patient is in an analog format.
- the patient interface unit 14 transforms the data from the analog format into a digital format suitable for use and interpretation by the computer 22 .
- the patient interface unit 14 outputs the data, which is normally in the digital format, to the computer 22 via signal path 42 .
- the signal path 42 may be a data bus, for example.
- the computer 22 receives the data, normally in the digital format, and correlates the various different types of data into information indicative of hemodynamic parameters corresponding to the mammalian patient, and then generates and provides output signals to a signal path 44 (shown in FIG. 4 ) connected to the display 18 .
- the signal path 44 can be a data bus or a video cable connecting the computer 22 to the display 18 .
- the display 18 receives the output signals from the second path 44 and then generates and displays a screen of the hemodynamic parameters such that an observer such as a doctor, anesthesiologist or a nurse may observe the hemodynamic parameters and proceed accordingly based upon their own expertise.
- FIG. 4 Shown in FIG. 4 is a block diagram of the computer 22 , which is connected to the patient interface unit 14 and the display 18 by way of the signal paths 42 and 44 .
- the computer 22 is provided with one or more power sources 50 , one or more input ports 52 , one or more memories 54 , one or more input devices 56 and one more processors 58 all of which will be referred to hereinafter in the singular for purposes of clarity.
- the input port 52 , the memory 54 , the input device 56 and the processor 58 can be stand-alone, partially or completely network-based or cloud-based, and may be located in a single physical location or not necessarily located in a single physical location.
- a portion of the memory 54 may be a cloud-based memory.
- the processor 58 of the computer 22 is capable of executing processor executable code stored on the memory 54 .
- the processor 58 can be implemented as a single processor 58 or multiple processors 58 working together to execute the logic described herein.
- Exemplary embodiments of the processor 58 include a digital signal processor (DSP), a central processing unit (CPU), a field programmable gate array (FPGA), a microprocessor, a multi-core processor, and combinations thereof.
- the processor 58 is capable of communicating with the memory 54 via a signal path 68 which can be implemented as a data bus or a network, for example.
- the processor 58 is capable of communicating with the input device 56 via a signal path 70 which may be a data bus or a network, for example.
- the processor 58 is further capable of interfacing and/or communicating with the patient interface unit 14 via the input port 52 and signal paths 72 and 42 , such as by exchanging electronic, digital and/or optical signals via one or more physical or virtual ports using a network protocol such as TCP/IP, for example.
- the signal path 42 can also be implemented with a serial and/or parallel cable utilizing any suitable protocol. It is to be understood that in certain embodiments using more than one processor 58 , the one or more processor 58 may be located remotely from one another, located in the same location, or comprising a unitary multi-core processor (not shown).
- the processor 58 is capable of reading and/or executing processor executable code and/or or creating, manipulating, altering, and storing computer data structures into the memory 54 .
- the memory 54 stores processor executable code for causing the processor 58 to implement the functions described herein.
- the memory 54 may be implemented as any conventional non-transitory memory, such as random access memory (RAM), a CD-ROM, a hard drive, a solid state drive, a flash drive, a memory card, a DVD-ROM, a floppy disk, an optical drive, a compact flash drive, holographic drives, and combinations thereof, for example. It is to be understood that the memory 54 can be located in the same physical location as the processor 58 , the memory 54 may be located remotely from the processor 58 and may communicate with the processor 58 via a network.
- the multiple memories 54 may be located in the same physical location as the processor 58 , and one or more of the multiple memories 54 may be located in a remote physical location from the processor 58 .
- the physical location(s) of the one or more memory 54 can be varied, and the memory 54 may be implemented as a “cloud memory”, i.e., one or more memory which is partially or completely based on or accessed using a network.
- the input device 56 transmits data to the processor 58 via a signal path 74 and can be implemented as a keyboard, a mouse, a touch-screen, a camera, a cellular phone, a tablet, a smart phone, a PDA, a microphone, a network adapter, a probe having a sensor therein, and combinations thereof, for example but not by way of limitation.
- the signal path 74 may include a cable, a data bus, a wireless link, a network and combinations thereof. Any device capable of functionally transmitting data to the processor 58 can be used as the input device 56 .
- the input device 56 may be located in the same physical location as the processor 58 or may be remotely located and/or partially or completely network-based.
- the display 18 transmits information from the processor 58 to an observer, such that the information can be perceived by the observer.
- the display 18 can be implemented as a computer monitor, a cell phone display, a tablet display, a website, a projector, a laptop monitor, and combinations thereof.
- the computer 22 can be integrated with the display 18 .
- the computer 22 and the display 18 can be components of a tablet or laptop computer.
- the display 18 can be physically co-located with the processor 58 , or can be located remotely from the processor 58 , and may be partially or completely network based (e.g., a website).
- the display 18 communicates with the processor 58 via the signal path 44 .
- the term “user” is not limited to a human, and may comprise a human using a computer, a host system, a smartphone, a tablet, a computerized pen or writing device, and combinations thereof, for example but not by way of limitation.
- the display 18 is a touch screen display.
- the touch screen display forms the input device 56 and the display 18 .
- the touch screen display is preferably equipped with a graphical user interface (GUI) capable of communicating information to the user and receiving instructions from the user.
- GUI graphical user interface
- the computer 22 may also include a housing containing computer hardware and software implementing the processor 58 , the input port 52 , and the memory 54 to control the first sensor 26 , second sensor 30 , and third sensor 34 via the patient interface unit 14 , receive digitized signals and other information from the patient interface unit 14 , and process the data, such as the Doppler data indicative of blood flow velocity in the superior vena cava, and the respiratory data, to correlate the blood flow velocity data with the respiratory data as discussed above.
- the processor 58 correlates the data indicative of blood velocity waveform changes within central veins, such as the superior vena cava, against various phases of respiratory cycle to provide a set of to be monitored values indicative of the mammalian patient's fluid responsiveness status and/or level of right ventricle dysfunction and/or acute pulmonary hypertension.
- Various hemodynamic parameters such as venous flow, peak velocities, and S/D/VR and AR wave changes can be observed and monitored by the observer.
- absolute values of these parameters may be calculated and displayed to allow for calculation of indexes indicative of the patient's hemodynamic status and fluid responsiveness, which may be known as volume responsiveness, and/or calculation of indexes indicative of the patient's level of right ventricle dysfunction and/or acute pulmonary hypertension.
- a central vein such as the superior vena cava may be hard to collect data from with traditional Doppler probes used externally on the chest or through transesophageal access.
- the first sensor 26 may be implemented with an intravascular Doppler probe for monitoring of velocity of the blood flow within the central vein, such as the superior vena cava.
- the first sensor 26 may monitor antegrade and/or retrograde flow.
- the first sensor 26 can also be made capable of measuring the diameter of the central vein in substantially the same location where the blood velocity is monitored.
- a simple m-mode ultrasound transducer may be placed near the Doppler probe.
- miniature crystals may be built into the first sensor 26 in addition to a Doppler crystal.
- the miniature crystals are adapted to emit ultrasound waves in a direction of a wall and receive ultrasound reflections detecting distance of venous walls from the sensor 26 . At least two such crystals emitting waves in opposite directions would provide information indicative of the diameter of the vein in the same location where the velocity is measured. The first sensor 26 could thereby continuously monitor changes in venous diameter.
- the monitoring of fluid responsiveness provides the observer with independent, continuous, real time or near real time monitoring of central hemodynamics of the mammalian patient. Further, monitoring of fluid responsiveness in central veins avoids some limitations pertaining to other methods because the superior vena cava, for example, is not subject to single location change in vascular tonus as in the case of peripheral arteries. Cardiovascular compensatory mechanisms are more obscure on a venous side. Some arrhythmias do not influence monitoring as in the case of arterial pressure waveforms.
- the first sensor 26 may be positioned in front of the right atrium in the superior vena cava such that the first sensor may detect a backwards leak from tricuspid regurgitation (TR), such as that caused by dilation of the right ventricle in acute pulmonary hypertension.
- TR tricuspid regurgitation
- blood flow in the superior vena cava is dominantly antegrade by nature with small retrograde pulses caused physiologically by contraction of the right atrium.
- the antegrade flow may decrease and the retrograde flow may increase during systole, because of the backward leakage of the tricuspid valve.
- Retrograde flow in diastole may also increase as a result of the blood congestion in front of the right heart, either due to right heart failure or simply due to increased preload.
- the effect of the tricuspid regurgitation might be more pronounced during the inspiration phase than during the expiration phase, as inspiration increases pulmonary hypertension.
- the first sensor 26 implemented as an intravascular Doppler probe allows for continuous dynamic assessment of right heart dysfunction through monitoring the flow patterns. These data may be presented as antegrade systolic waveforms, retrograde systolic waveforms, antegrade diastolic waveforms, and/or retrograde diastolic waveforms on a pulsed Doppler velocity flow chart, for example, as discussed in conjunction with FIGS. 11 and 12 .
- the primary functions of the software stored on the memory 54 of the computer 22 may be receiving user commands via the input device 56 , activate collection of the data discussed above utilizing the first sensor 26 , the second sensor 30 and the other sensors 34 , processing the data received from the first sensor 26 , the second sensor 30 and the other sensors 34 into the information indicative of the patient's hemodynamic status, fluid responsiveness and/or level of right ventricle dysfunction and/or acute pulmonary hypertension, according to defined algorithms stored on the memory 54 , displaying received parameters and processed data, and monitoring system status and reporting fault conditions.
- the patient interface unit 14 is connected to the computer 22 via the signal path 42 which may be a parallel or serial cable and contains the electrical connections to all electrodes, signal conditioning circuitry, stimulator drive if used by the first sensor 26 , the second sensor 30 and/or the other sensors 34 , and a digital communications interface to the computer 22 .
- the computer 22 may be situated outside but close to the surgical field (such as on a cart adjacent the operating table) such that the display 18 is directed towards the surgeon for easy visualization.
- the patient interface unit 14 may be located on the patient's bed, or may be affixed to the end of the operating table at mid-leg level using a bedrail clamp, or may be affixed to a bedside pole. The position selected should be such that the leads can reach their farthest desired location without tension during the surgical procedure.
- the patient interface unit 14 is provided with one or more interface devices such as a first interface device 80 , a second interface device 82 , and a third interface device 84 .
- the first interface device 80 is a five channel electrocardiograph and respiration device having a plurality of input ports for receiving up to five electrocardiograph signals from the second sensor 30 .
- the first interface device 80 may use a dedicated chip having an ECG front-end with 5 channels ECG+respiration measurements.
- Airway Pressure may be acquired via pressure transducer connected to open vent of patient's airways (possible through use of the third interface device analog channels).
- Respiration may be based on impedance measurement to measure changes of thoracic volume based on electrode displacement.
- Respiration data may be acquired through bioimpedance measurement of chest wall movement during inspiration and expiration, or acquired by other methods. Measurement may be accomplished via ECG leads placed on the patient's chest, with one lead being active and a second lead being passive.
- the first interface device 80 may use Analog Devices chip ADAS 1000 . This chip features ECG+respiration+leads-off detection and digital interface—SPI bus.
- the second interface device 82 may be a single channel pulse Doppler device that transmits signals to the first sensor 26 to cause the first sensor 26 to emit radiofrequency signals and also receive reflections from the ultrasonic signals into transmit Doppler radar signals to the second interface device 82 .
- Single channel pulse Doppler includes a switcher, a transmitter and a receiver of Doppler signal.
- the second interface device 82 may use a single crystal probe in which the crystal acts as an emitter and a receiver.
- the second interface device 82 includes a switcher for switching between the receiving and transmitting of signals.
- the transmitter sends pulses of RF (radiofrequency) signal to a probe of the first sensor 26 in order for the probe to act as a receiver for signals between pulses.
- the receiver may use a suitable integrated circuit, such as an analog devices chips—AD 8332 (dual channel ultra-low noise variable gain amplifier, dedicated for ultrasound systems) and AD 8333 (dual phase shifter and I-Q demodulator for ultrasound systems).
- AD 8332 dual channel ultra-low noise variable gain amplifier, dedicated for ultrasound systems
- AD 8333 dual phase shifter and I-Q demodulator for ultrasound systems
- the third interface device 84 can include any suitable type of circuitry for causing the third sensor 34 to collect data from the mammalian patient.
- the information displayed to the user on touch screen display 18 may include, but is not necessarily limited to, alpha-numeric and/or graphical information regarding invasive pressure monitoring, such as arterial pressure, central venous pressure, and so on. Also airway pressure signal for respiration cycle monitoring may be channeled in through this device.
- the third interface device 84 is a four channel analog preamplifier device having a plurality of input ports for receiving up to four signals from the third sensor 34 .
- the first, second, and third interface devices 80 , 82 , and 84 may transmit signals to an Analog-Digital (A-D) converter 86 .
- the A-D converter 86 may be, for example, an A-D converter chip from Analog Devices—AD7656-1—which features a six channel A-D converter with maximum sample rate 250 kSPS (kilo-samples per second) and sixteen bit resolution. As shown in the example illustrated in FIG. 5 , two channels of the A-D converter 86 may be used for processing of a raw Doppler signal from the second interface device—I and Q phase quadrature outputs raw signal which gives after processing forward and reverse components of blood flow signal and after another processing (complex Fourier transform) direct values of blood flow velocities. Another four channels of the A-D converter 86 may be used for optional analog inputs A 1 , A 2 , A 3 , and A 4 from the third interface device 84 .
- the A-D converter 86 may have digital output to parallel or serial interface—SPI bus.
- the digital signals from the A-D converter 86 may be sent over a Serial Peripheral Interface (SPI) bus 88 , which is generally not suitable for direct interfacing to the computer 22 .
- SPI Serial Peripheral Interface
- a SPI-to-USB converter 90 may be used between the A-D converter 86 and the computer 22 , as well as between the first interface device 80 and the computer 22 .
- the SPI-to-USB converter 90 may send digital signals over USB 2 (full speed) to the computer 22 .
- Data transmission to the computer 22 may be wireless.
- the computer 22 may be equipped with a driver for interfacing with the SPI-to-USB converter 90 and transmitting data.
- the SPI-to-USB converter 90 may be equipped with a USB digital isolator for ensuring electric isolation between the patient interface unit 14 and the computer 22 , thus ensuring patient safety.
- the patient interface unit 14 may also be provided with a power source 92 .
- the power source 92 may be internal to, or external to, the patient interface unit 14 .
- the computer 22 may execute software to process the data received from the patient interface unit 14 and store the data in memory 54 and/or display the data on the display 18 .
- the computer 22 may scale the data, that is, convert the raw digital input to a representation with a desired physical unit.
- One example of scaled data is the conversion of Volts to mmHg.
- the computer 22 may add channel attributes to the scaled data, for example, calibration constants.
- the computer 22 may execute software to perform real-time calculations on the incoming data and then may display results on the display 18 .
- the computer 22 may calculate data trends and display the data trends on the display 18 .
- the data trends and calculation results may be stored in memory 54 .
- the computer 22 receives from the first and second sensors 26 , 30 , through the patient interface unit 14 , Doppler sensor input, Respiration input, and ECG input.
- the computer 22 may also receive from the first and/or second sensors 26 , 30 superior vena cava diameter input.
- the computer 22 may receive from the third sensor(s) 34 Central Venous Pressure Input (CVP) and/or Arterial Pressure Input (AP).
- CVP Central Venous Pressure Input
- AP Arterial Pressure Input
- the computer 22 may display real-time waveforms of the inputs on the display 18 and/or may calculate additional data from the inputs.
- Calculations may include hemodynamic parameters such as Average Peak Velocity, Venous Return Variation (VRV) Index, Venous Return (VR), Preload, Stroke Volume, Cardiac Index, Stroke Index, Systemic Vascular Resistance, Systemic Arterial Compliance, and/or Central Venous Pressure, Central Venous Pressure Variation Index and Arterial Pressure (which may include Pulse Pressure Variation).
- the computer 22 may calculate Average Peak Velocity (APV) during inspiration and/or expiration. APV may be calculated as an average value of all instant peak velocity samples within a defined calculation time frame.
- VRV index may be used as an indicator correlating with fluid responsiveness of the mammalian patient.
- the computer 22 may output the monitored input hemodynamic data and calculated hemodynamic data in a format readable by the user on the display 18 .
- the data may be displayed in real-time or as historical data.
- Data may be displayed in the form of charts and/or figures. Color may be used to illustrate the data in the charts and/or figures.
- a user may zoom and pan within the displayed charts and figures.
- FIG. 6 depicts a screenshot 250 of data for a calculated VRV Index.
- a first chart 252 depicts a Doppler flow velocity envelope 254 and a respiration waveform 256 .
- Cross “+” marks indicate the start of inspiration 258 and the start of expiration 260 , with the period between a first inspiration start 258 a and a next respiration start 258 b being one respiration cycle 262 .
- a second chart 264 depicts the Doppler flow velocity envelope 254 and the respiration waveform 256 with “x” marks indicating the mammalian patient's heart beats that have minimal and maximal average flow velocities.
- the minimal and maximal average flow velocities may be used to calculate the VRV Index for a respiration cycle 262 and/or for multiple respiration cycles 262 .
- an average VRV Index may be displayed on the screen 18 .
- the computer 22 may calculate Venous Return (VR).
- SVC VTI stands for Superior Vena Cava Velocity Time Integral, which may be measured from Instant Peak Velocity over a defined calculation time frame, where the computed value may be normalized to one minute.
- VTI may be an integral of a peak velocity waveform.
- SVC Cross section may be calculated from the patient's Body Mass Index Surface Area and height, or manually inputted. SVC Flow contribution to the total Venous Return is typically defined by the patient's age, or manually inputted.
- Heart Rate is defined as the number of heart beats per minute (number of RR intervals on ECG or number of AP amplitudes/minute).
- SV is defined as Cardiac Output (CO) divided by Heart Rate (HR), where VR in steady state equals Cardiac Output.
- the computer 22 may calculate a preload surrogate.
- the preload surrogate may be derived from the Venous Return (VR) during inspiration. Venous Return per minute is equivalent to Cardiac Output (CO). Venous Return is driven by pressure gradient between peripheral veins and the right atrium of the heart. Stressed (hemodynamically active) volume of the blood in peripheral veins is the main driver of the preload and drives Peripheral Venous Pressure. Right Atrium Pressure is on the central (lower) side of the gradient.
- artificial inspiration momentarily increases intrathoracic pressure which results in a short increase of CVP. Inspiration for a short time changes the pressure gradient and the level of remaining flow is driven mainly by the level of stressed volume alone.
- Flow measured during inspirium is therefore a dynamic indicator of stressed volume level, the primary driver of preload.
- APVmin is an algorithmic alternative to APVinsp, where APVmin represents heart beat with minimal average peak velocity within respiratory cycle, while APVinsp averaging period is based on length of inspiration.
- Surrogate preload may also be determined using total retrograde flow (Retrograde VTI/sec), Systolic Wave Peak Velocity, Systolic Wave VTI, and/or AR Wave Peak Velocity, AR Wave VTI.
- the computer 22 may calculate a variety of Arterial Pressure (AP) data.
- AP Arterial Pressure
- Systolic Arterial Pressure may be calculated as an average (max amplitude) over a calculation time period.
- Diastolic Arterial Pressure may be calculated as an average (min amplitude).
- Mean Arterial Pressure may also be calculated as a true Mean of multiple arterial pressure waveform samples acquired during individual heart beat. Pulse Pressure may be calculated by subtracting the Diastolic AP from the Systolic AP.
- FIG. 7 depicts a screenshot 270 of the arterial waveform data for calculation of a Pulse Pressure Variation (PPV) Index.
- the screenshot 270 again depicts the Doppler flow velocity envelope 254 and the respiration waveform 256 .
- crosses “+” on the waveforms 254 , 256 mark the diastolic pressure 272 and the systolic pressure 274 .
- the diastolic pressure 272 and the systolic pressure 274 are marked with different color crosses.
- the diastolic pressure 272 is marked with blue color crosses while the systolic pressure 274 is marked with red color crosses. It will be understood that any color or marking may be used so long as the diastolic pressure 272 and systolic pressure 274 are communicated to the user.
- the computer 22 may calculate the value of peaks of systolic waves including systolic retrograde (VR) and systolic antegrade (S) peaks (maximums), the value of individual envelopes (that is, the square size under the contour of the wave) of the systolic waves, the ratio of VR peak to S peak, the ratio of VR envelope to S envelope, indexes based on the ratios such as a Tricuspid Regurgitation Index, and the like.
- VR systolic retrograde
- S systolic antegrade
- the computer 22 may output the monitored input hemodynamic data and calculated hemodynamic data in a format to be rendered by the display 18 into indicia that is readable by the user on the display 18 .
- the data may be displayed in real-time or as historical data.
- Real-time calculations may include, for example, Venous Return Variation Index, Cardiac Output, Preload, Central Venous Pressure, Arterial Pressure, Tricuspid Regurgitation Index, and/or Systemic Vascular Resistance.
- Data may be displayed in the form of charts and/or figures. In one embodiment, a user may zoom and pan within the displayed charts and figures.
- FIG. 8 depicts a screenshot 100 of an exemplary display in accordance with the present disclosure.
- the computer 22 may display a respiration waveform 102 representative of the respiration data.
- the computer 22 may calculate and/or compare measured values between phases of inspiration in the respiration waveform 102 .
- the computer 22 may utilize processing of the respiration waveform 102 for calculation timing purposes.
- the example of FIG. 8 represents a respiration waveform of a patient on a respirator, as can be inferred from the regular pattern of inspiration and expiration.
- the start of the inspiration phase is indicated by bottom point 104 of the wave.
- the inspiration phase ends at the start of the expiration phase, indicated by top point 106 of the wave.
- the computer 22 may isolate two phases out of one respiratory cycle—an inspiration time period (Insp) 108 (between the start of the inspiration phase and the end of inspiration phase) and an expiration time period (Exp) 110 (between the start of the expiration phase and the end of the expiration phase).
- an inspiration time period (Insp) 108 between the start of the inspiration phase and the end of inspiration phase
- an expiration time period (Exp) 110 between the start of the expiration phase and the end of the expiration phase
- the Doppler data may be displayed as a Doppler velocity waveform representative of velocity over time (cm/s).
- FIG. 9 depicts a screenshot 150 of another exemplary display in accordance with the present disclosure displaying both an exemplary respiration waveform 102 and an exemplary Doppler velocity waveform 152 .
- the venous system waveform consists of a number of pulse waves occurring within one heartbeat.
- the most prominent Doppler velocity waveforms 152 are the S-wave (systolic), D-wave (diastolic), and AR wave (right atrium contraction).
- the computer 22 may isolate the contour of the Doppler velocity waveform, where each sample represents Instant Peak Velocity (IPV) 154 .
- IPV 154 may be used for Doppler algorithmic calculations.
- the display of the combination of the respiration waveform 102 and Doppler velocity waveform 152 may provide insight into the patient's fluid responsiveness status. For example, in the screenshot 150 depicted in FIG. 9 , the IPVs 154 remain relatively consistent and high compared to the respiration waveform 102 throughout the timeframe. This may indicate that the patient is not fluid responsive. In this example, the fluid responsiveness is +500 mL.
- FIG. 10 is an exemplary screenshot 150 a of a display of the respiration waveform 102 and Doppler velocity waveform 152 after the same patient lost 30% of the patient's blood.
- the overall flow is smaller.
- the peak velocities are half the velocities of FIG. 9 and the fluid responsiveness is ⁇ 180 mL.
- Variation in the Doppler velocity waveform 152 is large between inspiration and expiration in the respiration waveform 102 .
- the Doppler velocity waveform 152 indicates small flow during the first inspiration time period 108 a and third inspiration time period 108 c .
- the Venous Return Variation Index calculated by the computer 22 would be very high.
- an ECG waveform 156 representative of the ECG data may be displayed on display 18 .
- FIG. 2 depicts a screenshot 160 of an exemplary display in accordance with the present disclosure displaying an exemplary ECG waveform 156 as well as an exemplary respiration waveform 102 and an exemplary Doppler velocity waveform 152 .
- the screenshot 160 also depicts a Central Venous Pressure waveform 162 .
- One or more of the waveforms 102 , 152 , 156 , 162 may be depicted in different colors for ease of differentiation. Waveforms may be displayed together or in a dedicated chart or any subcombination thereof. Of course, other waveforms may be displayed.
- FIG. 11 depicts a screenshot 200 of an exemplary display of a Doppler velocity waveform 202 in accordance with the present disclosure.
- the Doppler velocity waveform may be indicative of the level of right ventricle dysfunction and/or acute pulmonary hypertension in the patient.
- the first sensor 26 implemented as an intravascular Doppler probe allows for continuous dynamic assessment of right heart dysfunction through monitoring the flow patterns.
- a baseline 204 is established comparatively with the velocity waveform 202 across a timeline (x-axis).
- the peaks and valleys of the waveform represent antegrade and retrograde waves.
- the waveform above the baseline 204 is indicative of antegrade flow.
- the waveform below the baseline 204 is indicative of retrograde flow.
- Cursor line 206 on the screenshot 200 marks the beginning of Systole. Normally, the antegrade systolic wave should rise to the right from line 206 . Instead, a negative wave is shown, and even the positive wave is smaller than would be shown in a normal pattern. Instead, the diastolic antegrade wave dominates the pattern.
- the data indicates an altered flow pattern in the superior vena cava of the mammalian patient due to right heart dysfunction.
- An ECG waveform 156 representative of the ECG data may be utilized in conjunction with the velocity waveform 202 .
- the ECG waveform may be indicative of which waves are systolic waves.
- a respiration waveform 102 may also be utilized in conjunction with the velocity waveform 202 , however, inspiration and expiration may be estimated based on the velocity waveform 202 pattern.
- FIG. 12 depicts an example of data waveforms which may be displayed on a screenshot 300 in accordance with the present disclosure.
- the screenshot 300 displays an ECG waveform 302 as well as a normal Doppler velocity waveform 304 .
- the ECG waveform 302 is indicative of which velocity waveforms 304 are systolic (S) and which waveforms 304 are diastolic (D).
- the velocity waveforms 304 include four types—S, D, VR, and AR.
- the S wave type is systolic antegrade and the VR wave type is systolic retrograde.
- the D wave type is diastolic antegrade and the AR wave type is diastolic retrograde.
- a respiration waveform 102 may also be utilized and/or displayed in conjunction with the velocity waveform 202 .
- the screenshot 300 depicts an example of a typical SVC flow velocity pattern. The individual last full heart beat of every respiration cycle is analyzed with the aid of ECG and Respiration waveforms 302 , 102 .
- dotted lines from the R-peak and T-wave of the ECG waveform 302 indicate systole and diastole, though it will be understood that there are other means through other waveforms (such as Doppler and Arterial Pressure) to indicate the start of systole and diastole.
- the flow within the analyzed heart beat may be divided into four sections: S (systolic antegrade flow), D (diastolic antegrade flow, VR (systolic retrograde flow), AR (diastolic retrograde flow).
- An algorithm calculates the flow pattern envelope (the blue waveform, that is, the waveform 306 bordering the Doppler waveform 304 ). Peak Velocity and Velocity time Integral Values may be calculated out of the Doppler flow envelope in each of the four sections.
- the computer 22 may calculate a variety of data indicative of the level of right ventricle dysfunction and/or acute pulmonary hypertension in the patient.
- the computer 22 may distinguish the systolic waves/data in the velocity waveforms 304 , 306 .
- ECG data and/or ECG waveforms 302 may be indicative of the systolic waves in the velocity waveforms 304 , 306 .
- the computer 22 may analyze the systolic waves/data to determine the level of right ventricle dysfunction and/or acute pulmonary hypertension in the patient.
- the computer 22 may determine and/or calculate the value of the peaks of the systolic waves including retrograde (VR) and antegrade (S) peaks (maximums), the value of the individual envelopes (that is, the square size under the contour of the wave) of the systolic waves, the ratio of a VR and an S peak, the ratio of a VR envelope and a S envelope, and the like.
- the ratios will be higher during the inspiration phase than during the expiration phase.
- the respiration waveform may be utilized to determine systolic wave pattern during inspiration and systolic wave pattern which occurs during expiration.
- FIG. 13 is a screenshot 320 of an Ultrasound Doppler envelope waveform 322 , a Respiration waveform 324 , and an ECG waveform 326 , for analysis in accordance with the inventive concepts disclosed herein. Points on the waveforms may be marked showing the beginning and end of individual respiration cycles, individual heart beat periods (that is, the last complete heartbeat of each expiration), the divide between expected systolic and diastolic Doppler waves, and so on.
- the Ultrasound Doppler envelope waveform 322 has segments S, D, VR, and AR (as previously described) which may be analyzed for Peaks and Velocity Time Integrals (VTI).
- a tricuspid regurgitation (TR) index may be determined as a percentage from the peak and/or envelope ratios from the systolic velocity waveform.
- the TR index may be determined for the inspiratory phase and the expiratory phase.
- the TR index may be calculated utilizing three monitoring modalities—the Doppler velocity waveform from data measured by the first sensor 26 positioned in the superior vena cava, the respiration waveform from data measured by the second sensor 30 , and the ECG waveform from data measured by the second sensor 30 .
- the TR index is indicative of the level of right ventricle dysfunction and/or acute pulmonary hypertension in the patient.
- the computer 22 may use the waveforms to calculate additional data. For example, the computer 22 may calculate averages by calculating the area under the waveform curve for different time periods.
- FIG. 14 is an exemplary screenshot 350 of data analysis of a single heart beat for calculation of an SD Index.
- the SD Index is the ratio between the peak velocity of systolic and diastolic waves.
- line 352 represents data derived from ECG data
- line 354 represents data derived from ECG and Doppler envelope data
- points 356 a and 356 b represent the beginning of the systolic period
- point 358 marks the beginning of the diastolic period.
- the systolic wave peak velocity is higher than the diastolic wave peak velocity in this example, as can be seen by the peaks of line 354 . Both waves are present.
- An optimal ratio for a normal SVC flow pattern may be approximately between 1.2 and 1.8. Typically, normal flow is present in the absence of right heart dysfunction and when venous return is optimal.
- FIG. 15 is an exemplary screenshot 380 of a trend chart in accordance with the present disclosure.
- the computer 22 may display data in one or more trend charts.
- Stroke Volume, Preload and Venous Return Variation Index are displayed.
- Data indicative of blood responsiveness may be overlaid on the trend charts, such as those shown in data 382 .
- any input data or calculated data may be displayed on trend charts.
- One example is a trend chart displaying SVC VTI/beat versus APVinsp.
- the trend lines may be in different colors.
- the VRV Index may be indicative of fluid responsiveness of the patient.
- the APVinsp alone may correlate well with other preload markers, for example, a lower APVinsp means lower preload.
- a user such as a Clinician, may look at both VRV index and APVinsp to assess the level of volemia.
- the APVinsp may also be examined in relationship with Stroke Volume. Additionally, or alternatively, a user may look at VTImin, VTI-R (retrograde), and/or Systolic Wave peak or VTI
- the user may select data options for trend chart creation.
- real-time or historic trend charts may be created by the computer 22 for the data.
- Exemplary data for trend charts includes, but is not limited to, Cardiac Output, Cardiac Index, Venous Return, SVCvti, APVinsp, VRV Index, MAP, and CVP.
- the user may be given the option to select between trend charts displayed for data in “per minute” values or “per beat” values, where applicable.
- Data may be combined to show multiple trends on one chart, with individual scales per data type indicated on the chart axes.
- the system may offer the option to smooth trends in trend charts by moving average value selection. Additionally, one or more timeline cursors and/or other cursors may be available for the user.
- the system may also provide the user the ability to display events on the timeline of the trend charts and/or input specific patient information into the charts.
- the user may be provided with the option to show data as per minute or per beat on the Frank-Starling charts.
- the user may utilize the Frank-Starling charts to help determine hemodynamic parameters and status of the mammalian patient.
- the Frank-Starling curve may flatten if too much fluid is administered to the patient.
- the computer 22 may alert the user, for example, audibly, when too much fluid is administered.
- the Frank-Starling curve may be represented by one or more colors. For example, a change in color may indicate VRV threshold of 13%.
- the display may be provided with an embedded Systematic Vascular Resistance chart such that a user may access the Systematic Vascular Resistance chart while viewing the Frank-Starling Chart.
- the Systematic Vascular Resistance chart may have MAP-CVP (or MAP) charted against CO.
- the computer 22 may display data as one or more Systemic Vascular Resistance chart (MAP-CVP . . . x axes, SVC vti . . . y axes).
- MAP-CVP Systemic Vascular Resistance chart
- the display 18 may be used to monitor patient status in real-time.
- a Live Screen mode may be used to display running real-time charts for data and calculations such as ECG lead II, ECG intravascular lead, Ultrasound Doppler with Respiration waveforms, Arterial Pressure, and/or Central Venous Pressure.
- the running charts may display a certain amount of past data, such as the latest 10 seconds of one or more of the waveforms.
- the Live Screen may also display charts of data and/or selected calculated parameters.
- the Live Screen may also contain an option to record ECG waveforms and Doppler waveforms 152 in a screenshot.
- the option may be in the form of a “button” for the user to select, such as a “Catheter Tip Position Confirmation” button.
- the Live Screen may also include a START/STOP button with which the user may trigger recording and displaying of trend calculation and waveforms.
- the computer 22 may alert the user when hemodynamic parameters reach a predetermined threshold.
- the computer 22 may cause the display 18 to alert the user visually and/or audibly when the TR index(es), or the peak ratio(s), or the envelope ratio(s), indicative of the level of right ventricle dysfunction and/or acute pulmonary hypertension in the patient, reach a predetermined threshold level.
- the threshold level may be determined by the user.
- Visual alerts may be, for example, a different color for the waveform/data and/or pop-up messages on the display.
- the computer 22 may execute software to create and export data files based on the data input and/or calculations.
- Some non-exclusive examples of data files include Clinical Procedure Reports, Trends, Charts, Events Data, Raw data, Screenshots (such as waveforms or charts), Video of recorded real-time data displays, and/or combinations thereof.
- the data files may be stored in memory 54 and/or exported, for example, using a network, external memory, and/or hard copy.
- the system may provide the user with options for monitoring data.
- a variety of different data charts and data charts in combination with waveforms may be available as options for hemodynamic monitoring on the display 18 and/or in reports.
- an “ECG lead II” option may be available with a chart showing the ECG waveform.
- the ECG waveform may have a color, for instance, green.
- the heart rate value may be displayed (“HR xx”) with the chart.
- the heart rate value may be displayed in the same color as the ECG waveform for ease of discernment.
- an “ECG intravascular lead” option may be available showing an intravascular ECG waveform.
- the p-wave may be highlighted, for example, in color, such as blue.
- the chart the “Catheter Tip Confirmation” button may be located next to the waveform chart.
- an “Ultrasound Doppler with Respiratory waveform” chart may be available, as previously described in conjunction with FIGS. 9 and 10 .
- the user may have the option to display parameters with the waveform chart, such as APVinsp (Average Peak Velocity during inspiration) and/or VRV (Venous Return Variation Index).
- the waveforms and parameters may be color coded.
- the system may allow a user to select options in a “setup” mode for which data is to be displayed. Some exemplary options include, but are not limited to, (SVCvti/min and SVCvti/beat); (VR and VR/beat), (CO and SV), and/or (CI and SI). The same options may be available for setup of the Frank-Starling charts previously described in conjunction with FIG. 16 .
- an “Arterial Pressure” chart may be available.
- the Arterial Pressure chart may display an Arterial pressure waveform.
- the waveform may be a color, such as red.
- Parameters may be displayed with the chart, such as Systolic/Diastolic Pressure (Mean Arterial Pressure) . . . 120/80 (95).
- a “Central Venous Pressure” chart may be available.
- the Central Venous Pressure chart may display a Central Venous Pressure waveform.
- the waveform may be a color, such as blue.
- Parameters may be displayed with the chart, such as CVP max/CVP min (CVP) . . . 10/2 (6).
- the computer 22 may display a combination of charts and “gauges” where the gauges are indicative of data for specific data inputs and/or calculated data.
- gauges may be indicative of Cardiac Output, Preload (APVinsp), VRV Index, MAP, CVP, SVR, TR Index, etc.
- the gauges may display optimal ranges for the data.
Landscapes
- Health & Medical Sciences (AREA)
- Life Sciences & Earth Sciences (AREA)
- Engineering & Computer Science (AREA)
- Public Health (AREA)
- Medical Informatics (AREA)
- Biomedical Technology (AREA)
- General Health & Medical Sciences (AREA)
- Pathology (AREA)
- Molecular Biology (AREA)
- Biophysics (AREA)
- Heart & Thoracic Surgery (AREA)
- Physics & Mathematics (AREA)
- Surgery (AREA)
- Animal Behavior & Ethology (AREA)
- Veterinary Medicine (AREA)
- Radiology & Medical Imaging (AREA)
- Nuclear Medicine, Radiotherapy & Molecular Imaging (AREA)
- Physiology (AREA)
- Pulmonology (AREA)
- Cardiology (AREA)
- Computer Vision & Pattern Recognition (AREA)
- Hematology (AREA)
- Vascular Medicine (AREA)
- Artificial Intelligence (AREA)
- Psychiatry (AREA)
- Signal Processing (AREA)
- Data Mining & Analysis (AREA)
- Databases & Information Systems (AREA)
- Epidemiology (AREA)
- Primary Health Care (AREA)
- Measuring Pulse, Heart Rate, Blood Pressure Or Blood Flow (AREA)
- Ultra Sonic Daignosis Equipment (AREA)
Abstract
Description
v=(c)(fD)/2(fT)Cos Θ
where v is the velocity of the red blood cells, c is the speed of the ultrasound waves through body tissues, fD is the Doppler frequency shift, fT is the transmitted frequency of the ultrasound and Cos Θ is the cosine of the angle of insonation between the sound beam axis and the direction of blood flow. Such extravascular flow based measurements are, however, difficult to perform and require the presence of an operator that is capable of maintaining properly placement, alignment, and calibration of the ultrasound probe. The ultrasound beam is directional and is sensitive to movement, which requires the operator to check the beam's focus and thus the device cannot be considered to be providing continuous monitoring without operator attendance.
Acute Pulmonary Hypertension
VRV=(APVexp−AVPinsp)/Average(APVexp:APVinsp)×100
VRV=(APVmax−APVmin)/Average(APVmax:APVmin)×100
Claims (15)
VRV=(APVmax−APVmin)/Average(APVmax:APVmin)×100.
Priority Applications (1)
| Application Number | Priority Date | Filing Date | Title |
|---|---|---|---|
| US14/776,577 US10687781B2 (en) | 2013-03-15 | 2014-03-14 | Hemodynamic monitoring device and methods of using same |
Applications Claiming Priority (5)
| Application Number | Priority Date | Filing Date | Title |
|---|---|---|---|
| US201361788883P | 2013-03-15 | 2013-03-15 | |
| US201361889442P | 2013-10-10 | 2013-10-10 | |
| US201461952679P | 2014-03-13 | 2014-03-13 | |
| PCT/US2014/027133 WO2014152260A1 (en) | 2013-03-15 | 2014-03-14 | Hemodynamic monitoring device and methods of using same |
| US14/776,577 US10687781B2 (en) | 2013-03-15 | 2014-03-14 | Hemodynamic monitoring device and methods of using same |
Publications (2)
| Publication Number | Publication Date |
|---|---|
| US20160029995A1 US20160029995A1 (en) | 2016-02-04 |
| US10687781B2 true US10687781B2 (en) | 2020-06-23 |
Family
ID=51581165
Family Applications (1)
| Application Number | Title | Priority Date | Filing Date |
|---|---|---|---|
| US14/776,577 Active 2036-06-07 US10687781B2 (en) | 2013-03-15 | 2014-03-14 | Hemodynamic monitoring device and methods of using same |
Country Status (3)
| Country | Link |
|---|---|
| US (1) | US10687781B2 (en) |
| EP (1) | EP2967492B1 (en) |
| WO (1) | WO2014152260A1 (en) |
Cited By (2)
| Publication number | Priority date | Publication date | Assignee | Title |
|---|---|---|---|---|
| CN106388808A (en) * | 2015-06-26 | 2017-02-15 | 席剑 | Novel multichannel electrocardiogram acquisition scheme |
| US11369274B2 (en) * | 2017-11-10 | 2022-06-28 | Becton, Dickinson And Company | Method and device for verification of intra-luminal placement and patency for vascular access devices |
Families Citing this family (51)
| Publication number | Priority date | Publication date | Assignee | Title |
|---|---|---|---|---|
| WO2015109539A1 (en) * | 2014-01-24 | 2015-07-30 | 深圳迈瑞生物医疗电子股份有限公司 | Ultrasonic medical monitoring device and method |
| BR112017012726A2 (en) | 2014-12-17 | 2018-03-13 | Koninklijke Philips Nv | system for assessing fluid responsiveness, system for assessing a patient's responsiveness associated with fluid resuscitation, and computer media |
| KR102358589B1 (en) | 2015-02-12 | 2022-02-03 | 파운드리 이노베이션 앤드 리서치 1 리미티드 | Implantable devices and related methods for monitoring heart failure |
| WO2018031714A1 (en) | 2016-08-11 | 2018-02-15 | Foundry Innovation & Research 1, Ltd. | Systems and methods for patient fluid management |
| US12465324B2 (en) | 2015-02-12 | 2025-11-11 | Foundry Innovation & Research 1, Ltd. | Patient fluid management systems and methods employing integrated fluid status sensing |
| WO2016156446A1 (en) | 2015-04-03 | 2016-10-06 | Koninklijke Philips N.V. | Ultrasound system and method of vessel identification |
| JP7004574B2 (en) * | 2015-06-12 | 2022-01-21 | コーニンクレッカ フィリップス エヌ ヴェ | Tracking electromagnetic devices |
| US11039813B2 (en) | 2015-08-03 | 2021-06-22 | Foundry Innovation & Research 1, Ltd. | Devices and methods for measurement of Vena Cava dimensions, pressure and oxygen saturation |
| JP6577821B2 (en) * | 2015-10-19 | 2019-09-18 | 日本光電工業株式会社 | Pulse wave analyzer |
| JP6671918B2 (en) * | 2015-10-19 | 2020-03-25 | 日本光電工業株式会社 | Electrocardiogram waveform display device, electrocardiogram waveform display method, program, and storage medium |
| EP3386398B1 (en) * | 2015-12-10 | 2024-01-10 | 1929803 Ontario Corp. D/b/a Ke2 Technologies | Systems for automated fluid response measurement |
| US10736604B2 (en) * | 2016-01-14 | 2020-08-11 | University Of Maryland, Baltimore | System and method for assessment of cardiac stroke volume and volume responsiveness |
| US11206992B2 (en) | 2016-08-11 | 2021-12-28 | Foundry Innovation & Research 1, Ltd. | Wireless resonant circuit and variable inductance vascular monitoring implants and anchoring structures therefore |
| US11701018B2 (en) | 2016-08-11 | 2023-07-18 | Foundry Innovation & Research 1, Ltd. | Wireless resonant circuit and variable inductance vascular monitoring implants and anchoring structures therefore |
| US11638576B2 (en) * | 2016-11-11 | 2023-05-02 | Philips Image Guided Therapy Corporation | Wireless intraluminal imaging device and associated devices, systems, and methods |
| EP3705031B1 (en) | 2016-11-29 | 2025-12-10 | Foundry Innovation & Research 1, Ltd. | Wireless resonant circuit and variable inductance vascular implants for monitoring patient vasculature system |
| CN110248596B (en) | 2016-12-15 | 2022-12-20 | 巴克斯特国际公司 | Systems and methods for monitoring and determining patient parameters from sensed venous waveforms |
| JP6928111B2 (en) | 2017-01-12 | 2021-09-01 | ザ リージェンツ オブ ザ ユニバーシティ オブ カリフォルニアThe Regents Of The University Of California | Increased intravascular perfusion for critical care center |
| DE102017000940A1 (en) * | 2017-02-02 | 2018-08-02 | Xenios Ag | Arrangement with a blood pump, a control unit and a device for transmitting the measured values |
| JP7660806B2 (en) | 2017-04-21 | 2025-04-14 | ザ リージェンツ オブ ザ ユニバーシティ オブ カリフォルニア | Aortic blood flow meter and pump for partial aortic occlusion |
| WO2018220146A1 (en) | 2017-05-31 | 2018-12-06 | Foundry Innovation & Research 1, Ltd. | Implantable sensors for vascular monitoring |
| EP3629937B1 (en) | 2017-05-31 | 2026-01-14 | Foundry Innovation & Research 1, Ltd. | Implantable ultrasonic vascular sensor |
| US11039754B2 (en) | 2018-05-14 | 2021-06-22 | Baxter International Inc. | System and method for monitoring and determining patient parameters from sensed venous waveform |
| CN213156021U (en) | 2019-09-20 | 2021-05-11 | 巴德阿克塞斯系统股份有限公司 | An ultrasound system for accessing a patient's vasculature |
| JP2023519191A (en) | 2020-03-16 | 2023-05-10 | サータス クリティカル ケア, インコーポレイテッド | BLOOD CONTROL DEVICES, SYSTEMS AND METHODS AND THEIR ERROR DETECTION |
| JP7701387B2 (en) * | 2020-06-11 | 2025-07-01 | コーニンクレッカ フィリップス エヌ ヴェ | Methods for estimating hemodynamic parameters |
| US11877810B2 (en) | 2020-07-21 | 2024-01-23 | Bard Access Systems, Inc. | System, method and apparatus for magnetic tracking of ultrasound probe and generation of 3D visualization thereof |
| CN217310576U (en) | 2020-08-04 | 2022-08-30 | 巴德阿克塞斯系统股份有限公司 | Guidance system for assisting the advancement of a medical component within a patient |
| CN217907826U (en) | 2020-08-10 | 2022-11-29 | 巴德阿克塞斯系统股份有限公司 | Medical analysis system |
| CN114129181A (en) | 2020-09-03 | 2022-03-04 | 巴德阿克塞斯系统股份有限公司 | Portable ultrasound probe, system and method |
| US11992363B2 (en) | 2020-09-08 | 2024-05-28 | Bard Access Systems, Inc. | Dynamically adjusting ultrasound-imaging systems and methods thereof |
| CN216257185U (en) | 2020-09-10 | 2022-04-12 | 巴德阿克塞斯系统股份有限公司 | Ultrasound Probes and Ultrasound Systems |
| CN114190975A (en) | 2020-09-18 | 2022-03-18 | 巴德阿克塞斯系统股份有限公司 | Ultrasound probe with indicator remote control capability |
| EP4213739A1 (en) | 2020-09-25 | 2023-07-26 | Bard Access Systems, Inc. | Minimum catheter length tool |
| CN114376613B (en) | 2020-10-02 | 2025-12-12 | 巴德阿克塞斯系统股份有限公司 | Ultrasonic detectors, ultrasonic systems and methods |
| CN216167530U (en) | 2020-10-15 | 2022-04-05 | 巴德阿克塞斯系统股份有限公司 | Ultrasound imaging system configured to generate three-dimensional ultrasound images of a target region |
| EP4247267A1 (en) | 2020-11-24 | 2023-09-27 | Bard Access Systems, Inc. | Ultrasound system with target and medical instrument awareness |
| EP4251063B1 (en) | 2020-12-01 | 2025-01-01 | Bard Access Systems, Inc. | Ultrasound probe with target tracking capability |
| US12165315B2 (en) | 2020-12-01 | 2024-12-10 | Bard Access Systems, Inc. | Ultrasound system with pressure and flow determination capability |
| US12324704B2 (en) | 2020-12-14 | 2025-06-10 | Bard Access Systems, Inc. | Securement of hands-free ultrasound probe |
| CN115281723A (en) | 2021-04-15 | 2022-11-04 | 巴德阿克塞斯系统股份有限公司 | Ultrasound imaging system and related method |
| EP4326175A1 (en) * | 2021-04-22 | 2024-02-28 | Sabra Medical, Inc. | Intraosseous catheter placement confirmation device and method |
| WO2023081223A1 (en) | 2021-11-03 | 2023-05-11 | Bard Access Systems, Inc. | Optimized functionality through interoperation of doppler and image based vessel differentiation |
| US12514532B2 (en) | 2022-03-01 | 2026-01-06 | Bard Access Systems, Inc. | Ultrasound imaging system |
| US12514533B2 (en) | 2022-03-01 | 2026-01-06 | Bard Access Systems, Inc. | Ultrasound imaging system |
| CN116763338A (en) | 2022-03-16 | 2023-09-19 | 巴德阿克塞斯系统股份有限公司 | Ultrasound imaging system |
| US12102481B2 (en) | 2022-06-03 | 2024-10-01 | Bard Access Systems, Inc. | Ultrasound probe with smart accessory |
| US12137989B2 (en) | 2022-07-08 | 2024-11-12 | Bard Access Systems, Inc. | Systems and methods for intelligent ultrasound probe guidance |
| EP4561673A1 (en) | 2022-07-29 | 2025-06-04 | Foundry Innovation & Research 1, Ltd. | Multistranded conductors adapted to dynamic in vivo environments |
| WO2024102967A2 (en) * | 2022-11-11 | 2024-05-16 | Nutech Ventures | Broad-field doppler ultrasound of cerebral blood flow to improve the administration of treatments |
| WO2025207571A1 (en) * | 2024-03-25 | 2025-10-02 | Becton, Dickinson And Company | Systems and methods for determining fluid responsiveness |
Citations (20)
| Publication number | Priority date | Publication date | Assignee | Title |
|---|---|---|---|---|
| US4319580A (en) | 1979-08-28 | 1982-03-16 | The Board Of Regents Of The University Of Washington | Method for detecting air emboli in the blood in an intracorporeal blood vessel |
| US5183040A (en) | 1991-03-08 | 1993-02-02 | Telectronics Pacing Systems, Inc. | Apparatus and method for detecting abnormal cardiac rhythms using an ultrasound sensor in an arrhythmia control system |
| US6612989B1 (en) | 2002-06-18 | 2003-09-02 | Koninklijke Philips Electronics N.V. | System and method for synchronized persistence with contrast agent imaging |
| US20030216621A1 (en) * | 2002-05-20 | 2003-11-20 | Jomed N.V. | Multipurpose host system for invasive cardiovascular diagnostic measurement acquisition and display |
| US20040127798A1 (en) * | 2002-07-22 | 2004-07-01 | Ep Medsystems, Inc. | Method and system for using ultrasound in cardiac diagnosis and therapy |
| US20090076345A1 (en) * | 2007-09-14 | 2009-03-19 | Corventis, Inc. | Adherent Device with Multiple Physiological Sensors |
| US20090099424A1 (en) | 2007-10-11 | 2009-04-16 | Lidco Group Plc | Patient Monitoring |
| US20090137917A1 (en) | 2007-11-23 | 2009-05-28 | Pulsion Medical Systems Ag | Central venous catheter assembly for measuring physiological data for cardiac output determination and method of determining cardiac output |
| US20090177090A1 (en) | 2005-05-06 | 2009-07-09 | Sorin Grunwald | Endovascular devices and methods of use |
| US20090216140A1 (en) * | 2005-10-21 | 2009-08-27 | Falko Skrabal | Device and method for the electrical measurement of body functions and conditions |
| US20100036253A1 (en) * | 2008-08-05 | 2010-02-11 | Daniel Vezina | System and method for managing a patient |
| US20110004099A1 (en) | 2008-03-07 | 2011-01-06 | Oregon Health & Science University | Method and apparatus using ultrasound for assessing intracardiac pressure |
| US20110144967A1 (en) | 2008-08-12 | 2011-06-16 | Lev Adirovich | System and method for dynamic cardiac analysis, detection, prediction, and response using cardio-physiological mathematical modeling |
| US20110270111A1 (en) * | 2010-04-28 | 2011-11-03 | Maxime Cannesson | Method and apparatus for assessment of fluid responsiveness |
| WO2012064769A2 (en) | 2010-11-08 | 2012-05-18 | Vasonova, Inc. | Endovascular navigation system |
| US20120179135A1 (en) | 2011-01-12 | 2012-07-12 | Rinehart Joseph B | System and method for closed-loop patient-adaptive hemodynamic management |
| US20120296216A1 (en) * | 2011-05-16 | 2012-11-22 | Cardiogal Ltd. | Methods and systems of aiming sensor(s) for measuring cardiac parameters |
| US20130137987A1 (en) * | 2011-11-30 | 2013-05-30 | Yasuhiko Abe | Ultrasound diagnostic apparatus and image processing method |
| US20130296693A1 (en) | 2012-05-07 | 2013-11-07 | Brian J. Wenzel | Right atrium indicator |
| US20130317322A1 (en) * | 2010-10-22 | 2013-11-28 | Meditasks, Llc | Method for evaluating and modifying the state of hydration of a subject |
-
2014
- 2014-03-14 US US14/776,577 patent/US10687781B2/en active Active
- 2014-03-14 WO PCT/US2014/027133 patent/WO2014152260A1/en not_active Ceased
- 2014-03-14 EP EP14767338.8A patent/EP2967492B1/en not_active Not-in-force
Patent Citations (21)
| Publication number | Priority date | Publication date | Assignee | Title |
|---|---|---|---|---|
| US4319580A (en) | 1979-08-28 | 1982-03-16 | The Board Of Regents Of The University Of Washington | Method for detecting air emboli in the blood in an intracorporeal blood vessel |
| US5183040A (en) | 1991-03-08 | 1993-02-02 | Telectronics Pacing Systems, Inc. | Apparatus and method for detecting abnormal cardiac rhythms using an ultrasound sensor in an arrhythmia control system |
| US20030216621A1 (en) * | 2002-05-20 | 2003-11-20 | Jomed N.V. | Multipurpose host system for invasive cardiovascular diagnostic measurement acquisition and display |
| US6612989B1 (en) | 2002-06-18 | 2003-09-02 | Koninklijke Philips Electronics N.V. | System and method for synchronized persistence with contrast agent imaging |
| US20040127798A1 (en) * | 2002-07-22 | 2004-07-01 | Ep Medsystems, Inc. | Method and system for using ultrasound in cardiac diagnosis and therapy |
| US20090177090A1 (en) | 2005-05-06 | 2009-07-09 | Sorin Grunwald | Endovascular devices and methods of use |
| US20090216140A1 (en) * | 2005-10-21 | 2009-08-27 | Falko Skrabal | Device and method for the electrical measurement of body functions and conditions |
| US20090076345A1 (en) * | 2007-09-14 | 2009-03-19 | Corventis, Inc. | Adherent Device with Multiple Physiological Sensors |
| US20090099424A1 (en) | 2007-10-11 | 2009-04-16 | Lidco Group Plc | Patient Monitoring |
| US20090137917A1 (en) | 2007-11-23 | 2009-05-28 | Pulsion Medical Systems Ag | Central venous catheter assembly for measuring physiological data for cardiac output determination and method of determining cardiac output |
| US20110004099A1 (en) | 2008-03-07 | 2011-01-06 | Oregon Health & Science University | Method and apparatus using ultrasound for assessing intracardiac pressure |
| US20100036253A1 (en) * | 2008-08-05 | 2010-02-11 | Daniel Vezina | System and method for managing a patient |
| US20110144967A1 (en) | 2008-08-12 | 2011-06-16 | Lev Adirovich | System and method for dynamic cardiac analysis, detection, prediction, and response using cardio-physiological mathematical modeling |
| US20110270111A1 (en) * | 2010-04-28 | 2011-11-03 | Maxime Cannesson | Method and apparatus for assessment of fluid responsiveness |
| US20130317322A1 (en) * | 2010-10-22 | 2013-11-28 | Meditasks, Llc | Method for evaluating and modifying the state of hydration of a subject |
| WO2012064769A2 (en) | 2010-11-08 | 2012-05-18 | Vasonova, Inc. | Endovascular navigation system |
| US20120136242A1 (en) * | 2010-11-08 | 2012-05-31 | Vasonova, Inc. | Endovascular navigation system and method |
| US20120179135A1 (en) | 2011-01-12 | 2012-07-12 | Rinehart Joseph B | System and method for closed-loop patient-adaptive hemodynamic management |
| US20120296216A1 (en) * | 2011-05-16 | 2012-11-22 | Cardiogal Ltd. | Methods and systems of aiming sensor(s) for measuring cardiac parameters |
| US20130137987A1 (en) * | 2011-11-30 | 2013-05-30 | Yasuhiko Abe | Ultrasound diagnostic apparatus and image processing method |
| US20130296693A1 (en) | 2012-05-07 | 2013-11-07 | Brian J. Wenzel | Right atrium indicator |
Non-Patent Citations (8)
| Title |
|---|
| Applicant, Reply to the European Patent Office Outstanding Office Letter for Application No. 14767338.8, dated Apr. 5, 2017. |
| Communication Pursuant to Article 94(3) EPC regarding Rejection from the European Patent Office for Patent Application No. 14767338.8, dated Nov. 19, 2018. |
| European Patent Office, European Search Opinion for Application No. 14767338.8, dated Sep. 21, 2016. |
| European Patent Office, Supplementary European Search Report for Application No. 14767338.8, dated Sep. 12, 2016. |
| International Search Report and Written Opinion for PCT Application No. PCT/US2014/027133, dated Aug. 22, 2014. |
| PCT/US2014/027133-WO/2014/152260-International Search Report and Written Opinion-dated Aug. 22, 2014. |
| PCT/US2014/027133—WO/2014/152260—International Search Report and Written Opinion—dated Aug. 22, 2014. |
| Response to Nov. 19, 2018 Communication Pursuant to Article 94(3) EPC for European Patent Application No. 14767338.8, dated Mar. 22, 2019. |
Cited By (4)
| Publication number | Priority date | Publication date | Assignee | Title |
|---|---|---|---|---|
| CN106388808A (en) * | 2015-06-26 | 2017-02-15 | 席剑 | Novel multichannel electrocardiogram acquisition scheme |
| CN106388808B (en) * | 2015-06-26 | 2021-05-25 | 席剑 | Novel multichannel electrocardiogram acquisition scheme |
| US11369274B2 (en) * | 2017-11-10 | 2022-06-28 | Becton, Dickinson And Company | Method and device for verification of intra-luminal placement and patency for vascular access devices |
| US12220209B2 (en) | 2017-11-10 | 2025-02-11 | Becton, Dickinson And Company | Method and device for verification of intra-luminal placement and patency for vascular access devices |
Also Published As
| Publication number | Publication date |
|---|---|
| WO2014152260A1 (en) | 2014-09-25 |
| US20160029995A1 (en) | 2016-02-04 |
| EP2967492B1 (en) | 2020-10-14 |
| EP2967492A4 (en) | 2016-10-19 |
| EP2967492A1 (en) | 2016-01-20 |
Similar Documents
| Publication | Publication Date | Title |
|---|---|---|
| US10687781B2 (en) | Hemodynamic monitoring device and methods of using same | |
| Kobe et al. | Cardiac output monitoring: technology and choice | |
| US11103211B2 (en) | Ultrasonic medical monitoring device and method | |
| Lee et al. | Cardiac output assessed by invasive and minimally invasive techniques | |
| Kalantari et al. | Assessment of intravascular volume status and volume responsiveness in critically ill patients | |
| ES2357740T3 (en) | METHOD AND NON-INVASIVE DEVICE FOR MONITORING CARDIAC PARAMETERS AND FOR CONVERSION IN INVASIVE CARDIAC EQUIVALENTS WITHOUT THE USE OF ELECTRICAL-MECHANICAL INTERVAL. | |
| Bernards et al. | Hemodynamic monitoring: To calibrate or not to calibrate? Part 2—Non-calibrated techniques | |
| JP6268275B2 (en) | Apparatus and method for calculating cardiac output of living subject by applanation pressure measurement method | |
| Hollenberg | Hemodynamic monitoring | |
| Malbrain et al. | Cost-effectiveness of minimally invasive hemodynamic monitoring | |
| Renner et al. | Monitoring high-risk patients: minimally invasive and non-invasive possibilities | |
| Armstrong et al. | Minimally-and non-invasive assessment of maternal cardiac output: go with the flow! | |
| de Oliveira et al. | Use of aortic flow indexes derived from transthoracic echocardiography to evaluate response to a fluid challenge in anesthetized dogs | |
| Critchley | Minimally invasive cardiac output monitoring in the year 2012 | |
| Jasińska-Gniadzik et al. | Haemodynamic monitoring in acute heart failure–what you need to know | |
| Betteridge et al. | Cardiac output monitoring | |
| Betteridge et al. | Cardiac output monitoring | |
| WO2017137983A1 (en) | System and method for non-invasively monitoring cardiac parameters | |
| Barie | Advances in critical care monitoring | |
| Buckley et al. | Cardiovascular assessment and monitoring | |
| Lin et al. | Cardiovascular assessment and monitoring | |
| Bennett | Arterial pressure: a personal view | |
| Hofer et al. | Monitoring the patient at risk of hemodynamic instability in remote locations | |
| Ferreira | Fluid Responsiveness | |
| Myatra et al. | Noninvasive Hemodynamic Monitoring as a Tool: Current Practice and Evidence |
Legal Events
| Date | Code | Title | Description |
|---|---|---|---|
| AS | Assignment |
Owner name: NILUS MEDICAL LLC, CALIFORNIA Free format text: ASSIGNMENT OF ASSIGNORS INTEREST;ASSIGNORS:NAVRATIL, MIROSLAV;ZADROBILEK, KAREL;BELOHLAVEK, JAN;AND OTHERS;REEL/FRAME:036560/0667 Effective date: 20150914 |
|
| STPP | Information on status: patent application and granting procedure in general |
Free format text: NON FINAL ACTION MAILED |
|
| STPP | Information on status: patent application and granting procedure in general |
Free format text: RESPONSE TO NON-FINAL OFFICE ACTION ENTERED AND FORWARDED TO EXAMINER |
|
| STPP | Information on status: patent application and granting procedure in general |
Free format text: FINAL REJECTION MAILED |
|
| STPP | Information on status: patent application and granting procedure in general |
Free format text: DOCKETED NEW CASE - READY FOR EXAMINATION |
|
| STPP | Information on status: patent application and granting procedure in general |
Free format text: NOTICE OF ALLOWANCE MAILED -- APPLICATION RECEIVED IN OFFICE OF PUBLICATIONS |
|
| STPP | Information on status: patent application and granting procedure in general |
Free format text: PUBLICATIONS -- ISSUE FEE PAYMENT VERIFIED |
|
| STCF | Information on status: patent grant |
Free format text: PATENTED CASE |
|
| FEPP | Fee payment procedure |
Free format text: SURCHARGE FOR LATE PAYMENT, SMALL ENTITY (ORIGINAL EVENT CODE: M2554); ENTITY STATUS OF PATENT OWNER: SMALL ENTITY |
|
| MAFP | Maintenance fee payment |
Free format text: PAYMENT OF MAINTENANCE FEE, 4TH YR, SMALL ENTITY (ORIGINAL EVENT CODE: M2551); ENTITY STATUS OF PATENT OWNER: SMALL ENTITY Year of fee payment: 4 |