US10660516B2 - System and method for measurement of contrast sensitivity - Google Patents
System and method for measurement of contrast sensitivity Download PDFInfo
- Publication number
- US10660516B2 US10660516B2 US15/925,254 US201815925254A US10660516B2 US 10660516 B2 US10660516 B2 US 10660516B2 US 201815925254 A US201815925254 A US 201815925254A US 10660516 B2 US10660516 B2 US 10660516B2
- Authority
- US
- United States
- Prior art keywords
- contrast
- shaded
- marks
- chart
- cells
- Prior art date
- Legal status (The legal status is an assumption and is not a legal conclusion. Google has not performed a legal analysis and makes no representation as to the accuracy of the status listed.)
- Active, expires
Links
- 230000035945 sensitivity Effects 0.000 title claims abstract description 62
- 238000000034 method Methods 0.000 title claims abstract description 36
- 238000005259 measurement Methods 0.000 title description 21
- 239000012780 transparent material Substances 0.000 claims description 7
- 230000011664 signaling Effects 0.000 claims 1
- 238000012360 testing method Methods 0.000 description 30
- 238000007639 printing Methods 0.000 description 19
- 239000000976 ink Substances 0.000 description 17
- 230000008569 process Effects 0.000 description 11
- 206010012601 diabetes mellitus Diseases 0.000 description 8
- 238000005286 illumination Methods 0.000 description 8
- 208000037265 diseases, disorders, signs and symptoms Diseases 0.000 description 7
- 201000010099 disease Diseases 0.000 description 6
- 230000004044 response Effects 0.000 description 6
- 230000004382 visual function Effects 0.000 description 6
- 206010064930 age-related macular degeneration Diseases 0.000 description 5
- 230000000694 effects Effects 0.000 description 5
- 230000004438 eyesight Effects 0.000 description 5
- 208000002780 macular degeneration Diseases 0.000 description 5
- 230000003595 spectral effect Effects 0.000 description 5
- 230000008901 benefit Effects 0.000 description 4
- 230000008859 change Effects 0.000 description 4
- 230000001419 dependent effect Effects 0.000 description 4
- 230000004304 visual acuity Effects 0.000 description 4
- 208000022873 Ocular disease Diseases 0.000 description 3
- 244000309464 bull Species 0.000 description 3
- 238000012937 correction Methods 0.000 description 3
- 230000003247 decreasing effect Effects 0.000 description 3
- 238000001514 detection method Methods 0.000 description 3
- 238000000926 separation method Methods 0.000 description 3
- 239000000758 substrate Substances 0.000 description 3
- 208000017442 Retinal disease Diseases 0.000 description 2
- 206010038923 Retinopathy Diseases 0.000 description 2
- 230000007423 decrease Effects 0.000 description 2
- 238000013461 design Methods 0.000 description 2
- 230000001771 impaired effect Effects 0.000 description 2
- 230000007774 longterm Effects 0.000 description 2
- 238000004519 manufacturing process Methods 0.000 description 2
- 239000000203 mixture Substances 0.000 description 2
- 201000006417 multiple sclerosis Diseases 0.000 description 2
- 230000007935 neutral effect Effects 0.000 description 2
- 230000003287 optical effect Effects 0.000 description 2
- 230000002250 progressing effect Effects 0.000 description 2
- 230000009467 reduction Effects 0.000 description 2
- 238000001228 spectrum Methods 0.000 description 2
- 230000000007 visual effect Effects 0.000 description 2
- 206010061818 Disease progression Diseases 0.000 description 1
- 208000010412 Glaucoma Diseases 0.000 description 1
- 208000010415 Low Vision Diseases 0.000 description 1
- XOJVVFBFDXDTEG-UHFFFAOYSA-N Norphytane Natural products CC(C)CCCC(C)CCCC(C)CCCC(C)C XOJVVFBFDXDTEG-UHFFFAOYSA-N 0.000 description 1
- 206010047571 Visual impairment Diseases 0.000 description 1
- 230000004308 accommodation Effects 0.000 description 1
- 230000009471 action Effects 0.000 description 1
- 230000003044 adaptive effect Effects 0.000 description 1
- 238000013459 approach Methods 0.000 description 1
- 238000003491 array Methods 0.000 description 1
- 238000005282 brightening Methods 0.000 description 1
- 239000003795 chemical substances by application Substances 0.000 description 1
- 239000011248 coating agent Substances 0.000 description 1
- 238000000576 coating method Methods 0.000 description 1
- 239000003086 colorant Substances 0.000 description 1
- 230000000295 complement effect Effects 0.000 description 1
- 150000001875 compounds Chemical class 0.000 description 1
- 230000001010 compromised effect Effects 0.000 description 1
- 238000012790 confirmation Methods 0.000 description 1
- 230000002950 deficient Effects 0.000 description 1
- 238000003748 differential diagnosis Methods 0.000 description 1
- 238000010790 dilution Methods 0.000 description 1
- 239000012895 dilution Substances 0.000 description 1
- 230000005750 disease progression Effects 0.000 description 1
- 208000035475 disorder Diseases 0.000 description 1
- 238000009826 distribution Methods 0.000 description 1
- 230000007613 environmental effect Effects 0.000 description 1
- 238000011156 evaluation Methods 0.000 description 1
- 238000002474 experimental method Methods 0.000 description 1
- 238000005562 fading Methods 0.000 description 1
- 238000007641 inkjet printing Methods 0.000 description 1
- 230000004303 low vision Effects 0.000 description 1
- 238000012423 maintenance Methods 0.000 description 1
- 238000007620 mathematical function Methods 0.000 description 1
- 238000000691 measurement method Methods 0.000 description 1
- 229910044991 metal oxide Inorganic materials 0.000 description 1
- 150000004706 metal oxides Chemical class 0.000 description 1
- 238000012544 monitoring process Methods 0.000 description 1
- 238000005375 photometry Methods 0.000 description 1
- 239000000049 pigment Substances 0.000 description 1
- 208000037821 progressive disease Diseases 0.000 description 1
- 230000005855 radiation Effects 0.000 description 1
- 208000014733 refractive error Diseases 0.000 description 1
- 238000012216 screening Methods 0.000 description 1
- 239000004065 semiconductor Substances 0.000 description 1
- 238000003860 storage Methods 0.000 description 1
- 208000029257 vision disease Diseases 0.000 description 1
- 230000004393 visual impairment Effects 0.000 description 1
Images


Classifications
-
- A—HUMAN NECESSITIES
- A61—MEDICAL OR VETERINARY SCIENCE; HYGIENE
- A61B—DIAGNOSIS; SURGERY; IDENTIFICATION
- A61B3/00—Apparatus for testing the eyes; Instruments for examining the eyes
- A61B3/02—Subjective types, i.e. testing apparatus requiring the active assistance of the patient
- A61B3/022—Subjective types, i.e. testing apparatus requiring the active assistance of the patient for testing contrast sensitivity
-
- A—HUMAN NECESSITIES
- A61—MEDICAL OR VETERINARY SCIENCE; HYGIENE
- A61B—DIAGNOSIS; SURGERY; IDENTIFICATION
- A61B3/00—Apparatus for testing the eyes; Instruments for examining the eyes
- A61B3/02—Subjective types, i.e. testing apparatus requiring the active assistance of the patient
- A61B3/028—Subjective types, i.e. testing apparatus requiring the active assistance of the patient for testing visual acuity; for determination of refraction, e.g. phoropters
- A61B3/032—Devices for presenting test symbols or characters, e.g. test chart projectors
-
- A—HUMAN NECESSITIES
- A61—MEDICAL OR VETERINARY SCIENCE; HYGIENE
- A61B—DIAGNOSIS; SURGERY; IDENTIFICATION
- A61B3/00—Apparatus for testing the eyes; Instruments for examining the eyes
- A61B3/02—Subjective types, i.e. testing apparatus requiring the active assistance of the patient
- A61B3/06—Subjective types, i.e. testing apparatus requiring the active assistance of the patient for testing light sensitivity, e.g. adaptation; for testing colour vision
- A61B3/063—Subjective types, i.e. testing apparatus requiring the active assistance of the patient for testing light sensitivity, e.g. adaptation; for testing colour vision for testing light sensitivity, i.e. adaptation
Definitions
- the invention relates to a system and method for measurement of a patient's contrast sensitivity.
- the system and method of this invention is particularly useful for differentiating diabetic patients with different levels of retinopathy.
- the system and method is also useful for detection or evaluation of other ocular diseases including, but not limited to, age-related macular degeneration, glaucoma, and multiple sclerosis.
- contrast threshold could be raised (i.e. contrast sensitivity reduced) in various ocular conditions in which visual acuity might be no more than slightly compromised and the potential clinical usefulness of contrast sensitivity measurements began to be appreciated and noted in the text books of that period.
- the clinical measurement of contrast sensitivity has to this day remained little more than a curiosity although various methods of measurement have been developed and described since that time.
- AMD age-related macular degeneration
- diabetes One known chart is the Amsler grid that is used for monitoring the progression of AMD and to provide information related to other diseases, such as diabetes.
- the present invention provides a device and method for measuring contrast sensitivity of patients with ocular disease.
- This invention is particularly useful for evaluating diabetic patients and patients with age-related macular degeneration, whose contrast sensitivity is known to be progressively reduced by these diseases.
- Multiple sclerosis is another disease where contrast sensitivity is used to measure the onset and progression of the disease.
- the apparatus comprises a table or chart with a plurality of cells arranged in rows and columns.
- the table includes twenty-five rows and four columns of elongated rectangles.
- the invention is not limited to twenty-five rows and four columns of elongated rectangles and may comprise any number and arrangement of cells.
- the chart may comprise a plurality of lattices, each of the lattices including a plurality of cells.
- each lattice may comprise a large square divided into a plurality of smaller squares, such as nine squares divided in a 3 ⁇ 3 arrangement.
- the chart is not limited to the described chart and may comprise other arrangements.
- a shaded mark is positioned in each of the elongated rectangles.
- the shaded mark is located in one of a plurality of positions within each of the elongated rectangles.
- the shaded mark is positioned in one of six locations along the elongated rectangle.
- the location is not limited to six positions and may comprise any plurality of positions.
- the shaded marks are located in one or more of the cells in each of the lattices and absent from the remaining cells.
- a 3 ⁇ 3 lattice may include two squares, each containing one of the shaded marks, and seven empty squares. It should be understood that this invention may include alternative positioning of the shaded marks.
- the shaded mark comprises a circular spot with a diameter of 9 mm.
- the shaded mark is not limited to this shape and diameter and may comprise other shapes and dimensions.
- the shade marks maintain the same shape for the entire chart.
- each of the shaded marks varies in a level of contrast with a log of Weber contrast ranging from ⁇ 0.05 to ⁇ 2.30.
- the log of Weber contrast ranges from ⁇ 0.20 to ⁇ 2.15.
- the log of Weber contrast ranges from ⁇ 0.85 to ⁇ 2.05.
- the plurality of shaded marks in each of the rows maintain a consistent contrast and the shaded marks become increasingly faint from the top of the chart to the bottom of the chart. For example, in an embodiment with twenty-five rows, the top row has a log of Weber contrast of ⁇ 0.85 and each subsequent row is 0.05 lower until the bottom row has a log of Weber contrast of ⁇ 2.05.
- the upper left lattice may include shaded marks with ⁇ 0.20 and ⁇ 0.25 log of Weber contrast and moving from left to right and down the page to the lower right lattice with a ⁇ 2.10 and ⁇ 2.15 log of Weber contrast. It should be understood that the layout of the shaded marks may vary without departing from teachings of this invention.
- the chart of this invention is printed on paper and preferably a single-use test.
- the test of this invention is relatively low cost which is particularly helpful to economically disadvantaged areas.
- the single-use nature of the test eliminates issues with long-term maintenance of the contrast of the shaded marks.
- the system further includes a key for checking an observed position of the shaded mark in comparison to an actual position of the shaded mark.
- the key comprises a generally translucent or transparent material with a plurality of indicators identifying locations of the plurality of shaded marks. The generally translucent or transparent material allows the key to be placed on top of the chart to locate the actual positions of the shaded marks.
- a patient views the table or chart and marks the center of each of the shaded marks with a writing utensil or another device, starting from an upper left corner moving from left to right and down the page to a lower right hand corner or until the patient can no longer see the shaded marks.
- the key is then overlaid on the chart and a comparison is made between the observed mark (or believed observed mark) and an actual position of the shaded mark.
- a faintest shaded mark that is correctly identified is the patient's threshold contrast.
- a criterion for determining the faintest shaded mark may be determined by the highest row in which the patient correctly identified the position of no more than two of the four shaded marks that is the highest row in which the position of two or more marks was incorrectly recorded.
- An alternative criterion may be a lattice with the darkest shaded marks in which neither shaded mark was correctly identified.
- Other alternative criteria may be used, especially if a structure of the chart varies from the embodiments described in this application.
- scoring of the chart may be accomplished using electronic means, such as photographing or scanning a completed test and a program would look for differences in the test page between marked and unmarked.
- the chart of this invention may be provided on a computer with a processor, such as a tablet computer, with a touch sensitive pad and/or a stylus-type marking device.
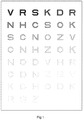
- FIG. 1 is a prior art example of a contrast sensitivity chart.
- FIG. 2A is a chart for measuring contrast sensitivity according to a preferred embodiment of this invention.
- FIG. 2B is a key for the contrast sensitivity chart of FIG. 2A .
- FIG. 3A-D is a sample test using the system of FIGS. 2A and 2B .
- FIG. 4A is a chart for measuring contrast sensitivity according to another preferred embodiment of this invention.
- FIG. 4B is a key for the contrast sensitivity chart of FIG. 4A .
- FIG. 5 shows result of a test measuring binocular contrast sensitivity.
- FIG. 6 shows results of a test measuring both monocular and binocular contrast sensitivity of normal adult subjects.
- This invention provides a system and method for determining contrast sensitivity of a patient or subject.
- FIG. 2A illustrates a chart 10 , arranged as a table, for determining contrast sensitivity according to one embodiment of this invention.
- FIG. 2B illustrates a key 12 for checking the table 10 .
- the table 10 comprises a grid 14 having twenty-five rows and four columns of cells 16 defined by thin black lines.
- the cells 16 comprise elongated rectangles.
- the table 10 of FIG. 2A further includes a plurality of shaded marks 18 positioned in each of the elongated rectangles 16 preferably including a single shaded mark 18 in each of the elongated rectangles 16 .
- the shaded mark 18 comprises a shaded circular spot having a 9 mm diameter.
- the shaded mark 18 may not comprise a circular spot with a 9 mm diameter and may comprise any shape and/or any dimensions.
- the plurality of shaded marks 18 comprise a consistent shape throughout the chart 10 .
- each of the shaded marks 18 has a defined contrast, where contrast is the difference in luminance or color that makes an object (or its representation in an image or display) distinguishable.
- the contrast of each of the plurality of shaded marks 18 varies and the contrast sensitivity of the patient is determined by evaluating the patient's ability to distinguish and identify a position of the various shaded marks 18 and the associated varying contrast.
- contrast for example Weber contrast, Michelson contrast, and Root mean square (RMS) contrast.
- RMS Root mean square
- each of the shaded marks 18 varies in a level of contrast with a log of Weber contrast ranging from ⁇ 0.05 to ⁇ 2.30.
- the log of Weber contrast ranges from ⁇ 0.20 to ⁇ 2.15.
- the log of Weber contrast ranges from ⁇ 0.85 to ⁇ 2.05.
- the shaded marks 18 are printed with a progressively decreasing contrast.
- the shaded marks 18 are dark grey relative to the background, while moving down the chart 10 the shaded marks 18 become progressively lighter and lighter relative to the background.
- the shaded marks 18 located in each row possess a consistent contrast and the contrast decreases for each subsequent row moving down the table 10 .
- a top row includes a log Weber contrast of ⁇ 0.85 (corresponding to a contrast of 14.1%).
- the Weber contrast of the shaded marks 18 on each successive row is 0.05 log units lower than the row above with a lowest row having a log of Weber contrast of ⁇ 2.05 (corresponding to a contrast of 0.78%).
- Charts according to this invention may vary from this standard table design with varying ranges of contrast and with or without consistent contrast on each of the rows. For example, a range of darker contrast ratios may be used to measure contrast sensitivity in patients with more severely impaired vision.
- a location of the shaded mark 18 is randomly placed within each of the plurality of elongated rectangles 16 .
- each of the shaded marks 18 randomly occupy one of six equally spaced positions within the elongated rectangle 16 .
- the shaded marks 18 may be positioned in one of any number of positions. It is the patient's task to identify the position of each spot within each of the elongated rectangles 16 and to indicate the center location by marking a small cross at the center of the shaded mark 18 with a writing utensil or otherwise marking the center.
- this invention is not limited to twelve variations and any number of charts may be designed.
- the system further includes the key 12 for checking an observed position 22 of the shaded marks 18 in comparison to an actual position 24 of the shaded marks 18 .
- the key 12 comprises layout corresponding to the table layout of the chart 10 shown in FIG. 2A .
- the key is preferably made of a generally translucent or transparent material and includes a plurality of indicators 26 identifying locations of the plurality of shaded marks 18 on the table 10 .
- the generally translucent or transparent material allows the key 12 to be placed on top of the chart to locate the actual positions 24 of the shaded marks 18 .
- FIG. 3A-D shows an example of the steps for testing a patient's contrast sensitivity according to an embodiment of this invention.
- a new, blank table 10 is provided to the patient in FIG. 3A .
- the patient using a reading spectacle correction if appropriate, holds the table 10 on a suitable board at a convenient distance in a light that would be good for reading, generally greater than 300 lux.
- FIG. 3B starting at any level of the table 10 at which the shaded marks 18 can be seen clearly, in this case the row labeled 0.95, the patient marks an observed location 22 (or a believed location) of the shaded marks 18 , progressing down the table 10 until it is necessary to guess the position of the shaded marks 18 even when the table 10 has been viewed for several seconds.
- the patent is permitted to move the table 10 or adjust its position or distance to make the fainter shaded marks 18 easier to see.
- the patient When the patient has finished marking the table 10 it is scored using a transparent overlay key 12 , shown in FIG. 3C , with positions of the shaded marks 18 indicated by open circles indicators 26 .
- FIG. 3D a number of correctly identified locations of each row is written in the right-hand margin of the table 10 .
- a threshold contrast sensitivity is reported as the contrast 20 of the highest row on which the patient has failed to identify the correct positions of two or more of the shaded marks 18 .
- the threshold contrast may also be defined as the contrast of the highest line on which the subject has correctly identified the positions of no more than two of the spots (i.e. has made two or more errors).
- the threshold contrast was determined to be 1.55. This test is particularly useful in assessing diabetic patients, as diabetic patients generally have lower contrast sensitivity that non-diabetic subjects. For example, it has been shown that while 95% of non-diabetic subjects have a log contrast sensitivity of greater than 1.80, 95% of diabetics with sight-threatening retinopathy have a log contrast sensitivity of lower than 1.85, in many cases much lower.
- scoring of the chart may be accomplished using electronic means, such as photographing and/or scanning a completed test and a program would look for differences in the test page between marked and unmarked.
- the chart of this invention may be provided on a computer with a processor, such as a tablet computer, with a touch sensitive pad and/or a stylus-type marking device.
- FIG. 4A illustrates a chart 110 for determining contrast sensitivity according to another embodiment of this invention.
- FIG. 4B illustrates a key 112 for checking the chart 110 .
- the chart 110 comprises a plurality of lattice 114 including a large square sub-divided into smaller cells 116 by thin black lines.
- the chart 110 includes twenty lattices 114 arranged in five rows and four column. However, any arrangement of the chart 110 with a different number of rows and columns or another arrangement may be used.
- Each lattice 114 is sub-divided into nine cells 116 in a 3 ⁇ 3 arrangement.
- the cells 116 comprise a square shape.
- the lattice may be divided into another arrangement such as a 2 ⁇ 2 arrangement, a 4 ⁇ 4 arrangement, a 3 ⁇ 5 arrangement, or any n ⁇ m arrangement, where n and m are integers that may or may not equal each other.
- the chart 110 further includes a plurality of shaded marks 118 positioned in some of the squares 116 .
- each lattice 114 includes two of the nine squares randomly filled with one of the shaded marks 118 .
- Alternative embodiments may use other ratios of shaded marks relative to squares.
- the shaded marks 118 comprise a shaded circular spot having a 9 mm diameter.
- the shaded marks 118 may not comprise a circular spot with a 9 mm diameter and may comprise any shape and/or any dimensions.
- the plurality of shaded marks 118 comprise a consistent shape throughout the chart 110 .
- each of the shaded marks 118 include a contrast that varies across the chart 110 .
- the log of Weber contrast ranges from ⁇ 0.20 to ⁇ 2.15 across the chart 110 .
- the shaded marks 118 include a progressively decreasing contrast.
- the lattice 114 includes two shaded marks 118 , one with a log Weber contrast of ⁇ 0.20 and a second with a log Weber contrast of ⁇ 0.25.
- the contrast moving from left to right and down become progressively lighter and lighter, by 0.05 log units lower, relative to the background until reaching the lower right corner with the lattice 114 including two shaded marks 118 , one with a log Weber contrast of ⁇ 2.10 and a second with a log Weber contrast of ⁇ 2.15.
- a log Weber contrast of ⁇ 2.10 a log Weber contrast of ⁇ 2.10
- other ranges of contrast and variation may be used. For example, darker contrast ratios may be used to measure contrast sensitivity in patients with more severely impaired vision.
- the system further includes the key 112 for checking an observed position of the shaded marks 18 in comparison to an actual position of the shaded marks 18 .
- the key 112 comprises a layout corresponding to the layout of the chart 110 shown in FIG. 4A .
- the key is preferably made of a generally translucent or transparent material and includes a plurality of indicators 126 identifying locations of the plurality of shaded marks 118 on the chart 110 .
- the indicators 126 comprise an absolute value of the Weber contrast for the shaded mark 118 located in the square 116 .
- the patient views the chart 110 and marks an observed location by marking the squares 116 of each lattice 114 that include one of the shaded marks 118 , progressing down the chart 110 until it is necessary to guess the position of the shaded marks 118 even when the chart 10 has been viewed for several seconds.
- the patient has finished marking the chart 110 it is scored using the transparent overlay key 112 with positions of the shaded marks 118 indicated by Weber contrast values as the indicators 126 .
- a threshold contrast sensitivity is determined by locating the lattice with the faintest shaded marks in which both shaded marks 118 were correctly identified.
- alternative means of determining threshold contrast sensitivity may be used.
- the charts 10 , 110 of this invention and the images appearing on the charts are generated using a program written in PostScript.
- a standard raster-image processor such as Colorburst Overdrive RIP, is used to interpret the PostScript program and drive a printer.
- the charts 10 , 110 are preferably printed on one side of a matte-surfaced heavy white paper, 160 or 200 gsm, using ink-jet printers filled with pigment-based black and two lighter “black” inks, such as Piezography® neutral black series. Calibration of the printing process has been achieved by measuring the contrast of the digital images of sets of special test patterns obtained with a 1.3 Megapixel machine-vision CMOS (complementary metal-oxide semiconductor) camera using an application written in ImageJ.
- CMOS complementary metal-oxide semiconductor
- the printing process is preferably calibrated just prior to a print run of the charts 10 , 110 and checked again after completion of the print run. Using this process, all contrast values of the shaded marks 18 , 118 on the printed charts have normally been found to be within 0.01 log units of their nominal values. Any charts 10 , 110 with any contrast value in error by as much as 0.02 log units are preferably discarded.
- the charts 10 , 110 of this invention differ from conventional printed contrast sensitivity charts in four main ways: 1) the shaded marks 18 , 118 that patients are required to detect are all uniform round spots of the same size; 2) patients are required to show that they have seen the shaded marks 18 , 118 by correctly reporting the position of the shaded mark rather than by identifying its shape; 3) at each contrast level, the patient is required to detect several of the shaded marks 18 , 118 and 4) the patients record the location of the shaded marks by marking the chart. As such, the charts can only be used once and a new, pristine chart must be used for each test.
- This invention preferably utilizes round shaded marks 18 , 118 .
- Round marks are preferred because round spots have the advantage that their visibility is, for a large range of sizes, essentially independent of their angular subtense at the eye. This was well established for round spots in a daunting study by Blackwell (1946) who demonstrated that the contrast threshold of normal young adults for detecting round spots at photopic levels of luminance (greater than about 40 cd m ⁇ 2 ) was effectively independent of the size of the round spots so long as the diameter subtended an angle greater than about 1 degree of arc.
- the diameter of the shaded marks 18 , 118 on the charts 10 , 110 has been set at 9 mm, the smallest size that ensures that at the distance at which the chart is viewed the contrast threshold is always close to its asymptotic minimum.
- Round spots that are 9 mm in diameter subtend an angle of more than 1 degree at any distance up to 52 cm and therefore have a threshold contrast that will not be significantly dependent upon the actual distance at which the charts 10 , 110 are held by the patient except in so far as the threshold contrast could be increased as a result of the chart not being in focus.
- targets are to be identified by their shape, by their orientation or by their position with respect to a visible reference (stimulus features that are used in other charts), the question arises of how many alternatives there should be.
- the compromise adopted is to define six equally-spaced positions within each of the horizontally-elongated rectangles 16 on the chart 10 of which one is randomly chosen to be the center of the shaded mark 18 (or target) displayed in the rectangle 16 . It has been found that with six defined positions subjects can unambiguously locate and mark the center of any visible spot.
- Detection of targets whose contrast (or size) is close to threshold is probabilistic. This inevitably limits the reproducibility of “threshold” determinations made with a single series of targets graded in contrast (or size). To improve the reproducibility of a threshold determination, it is necessary to have the subject make repeated observations of near-threshold stimuli. When the test system permits it, this is usually accomplished by using a staircase or other adaptive procedure but where such a procedure cannot be implemented (as with a simple printed chart), some advantage can be gained by making the decision about the threshold dependent on the subject's responses to several targets at each contrast.
- the variability of a threshold determination made using a criterion based on some combination of the subject's responses will be inversely related to their number. While increasing the number of targets of each contrast certainly does decrease the variability of repeated determinations of contrast sensitivity (as demonstrated by preliminary experiments), increasing the number of observations required necessarily increases the time to mark the chart. There is also, of course, a limit to the number of observations that the subject can be asked to make that is set by the number of rectangles that can be printed on a chart of fixed size, though this is inversely dependent upon the range of contrasts that a single chart can cover. The number of repeat observations required was set at four as a heuristic compromise taking all the relevant factors into account.
- charts 10 , 110 of the claimed invention are intended to be marked by the subject using a writing utensil. This marking serves the primary purpose of making it possible for the chart to be used without the need to have an examiner present to record the subject's responses while automatically providing a permanent record of those responses. Having a test based on charts that will only be used once overcomes many of the difficulties associated with conventional printed charts. Because the charts 10 , 110 will be used for only one test, the charts require very little handling and can easily be kept clean and unmarked until they are used. For the same reason, it is unnecessary for the surface of the charts to be laminated or otherwise coated to minimize the susceptibility of the charts to exposure to light or to dirt or to damage. Not requiring a coating makes the calibration of the printing process easier and simpler to implement. In all probability, the charts 10 , 110 will be used much sooner after they have been printed than conventional charts and this will itself remove residual worries about the long-term stability of the calibration.
- the charts 10 , 110 can be printed on much lighter paper stock than wall charts or other types of tests that will be repeatedly handled which must be printed, or subsequently mounted, on rigid board to ensure that they stay flat.
- the lighter stock paper also allows the charts 10 , 110 of this invention to more easily lie flat.
- the relatively small size of the charts 10 , 110 of this invention and the fact that the charts are printed on paper rather than board makes it possible to print them on simple small ink-jet printers. All these factors taken together greatly reduce the cost of producing the charts 10 , 110 as well as making it practicable to have many more than the three variants in which conventional charts are normally provided.
- half-tone printing with black ink is only an acceptable way to produce low contrast images if the separation and size of the dots is such as to render the individual dots invisible as a result of the eye being unable to resolve them. This places a strict limit on the use of this approach that is determined by the smallest size of the dots that can be reliably printed. In practice this means that while half-tone printing with black ink can be used for charts that are to be viewed at a distance of one meter or more, it is not an acceptable way to print charts for use at reading distance.
- a preferred way of printing the charts 10 , 110 of this invention, with monochrome targets whose Weber contrast can be as low as 0.7%, is to use half-tone images in combination with several inks having different dilutions. This is common practice in the production of high quality black and white photographic prints and neutral “black” inks in many shades of gray are available.
- the charts 10 , 110 of this invention are preferably printed with black ink and two lighter shades of gray ink.
- the charts 10 , 110 are preferably printed using “stochastic screening” techniques that have irregularly spaced dots to minimize the visibility of the regular arrays of dots used in conventional printing.
- the luminance contrast of the targets will potentially be dependent upon the spectral composition of the illuminating light. While this would be of no consequence if the spectral composition of the light illuminating the chart when it is being used to measure contrast sensitivity is the same as that used to calibrate the printing process, this will not necessarily be the case. Even if the apparent color of the light illuminating the chart is the same (white) as that of the calibrating light this does not guarantee that the luminance contrast of the targets will exactly correspond to the nominal value established by the calibration process because the apparent color of a light does not determine the exact form of its spectral distribution.
- LEDs light from “white” light-emitting diodes
- the contrast difference related to this spectral difference will be greatest in the case of the lightest grey ink that is used but with appropriate choice of ink this effect can be minimized and for the charts 10 , 110 of this invention is less than 0.02 log units at all levels for lights that are visibly white.
- the printed and unprinted areas of the chart 10 , 110 have different specular reflectance then there will generally be a change in the luminance contrast with changes in the angle of incidence of the illuminating light as well as with changes in the viewing angle.
- This effect, as well as the effect introduced by spectral differences between the illumination used for testing and calibration, is minimized by choosing both the paper and the ink to have matte surfaces with the lowest possible levels of specular reflectance. Even so, it is desirable that the illumination of the chart when it is in use should be arranged so as to reduce the contribution of specular reflections as far as possible. This means that the source of light should be diffuse, or, if the light is from focal sources, these should not be too close to the line of sight.
- UV radiation ultraviolet
- the charts 10 , 110 of this invention are preferably printed on paper that does not contain OBAs.
- the contrast that is achieved by printing a target depends upon a number of factors, but the only one that can be adjusted at the time a chart is being printed is the tonal value of the target areas (the tonal value can be thought of as the proportion of the area that has been inked).
- the required value must be ascertained by reference to measurements of the contrast achieved in preliminary prints of appropriate targets with a range of different tonal values. Having fitted a suitable mathematical function relating achieved contrast to tonal value, the tonal values to be used for the targets to be printed on the contrast sensitivity charts can readily be calculated. It is difficult to check directly that the contrast of the small targets on printed charts 10 , 110 , as such it is normally necessary to rely on the preliminary calibration of the printing process to ensure that the contrast is correct. However, it must be recognized that the ink-jet printing process is somewhat sensitive to environmental and other factors that cannot be completely controlled and that there may be slow changes in the precise relation between achieved contrast and the set tonal value. For this reason, a calibration procedure must be repeated at regular intervals during printing to make sure that there has been no significant change or, if there has been, to take appropriate action in rejecting charts which may possibly have the wrong contrast as well as to calculate revised tonal value settings.
- the contrast sensitivity charts 10 , 110 of this invention were designed to be used without a professional examiner and in less well controlled circumstances than would be found in a clinic. It is also expected that the charts 10 , 110 will be used without any facility to measure the exact light level and without precise control of the distance of the chart 10 , 110 from the subject. Thus, measurements made with the charts 10 , 110 must be essentially unaffected by the level of illumination and by the distance of the charts from the subject's eyes. While reference to previous studies suggested that these requirements would be adequately met by the design that has been described, it was felt to be desirable to examine just how nearly they had been met.
- the viewing distance of the chart changes the angular subtense of the target spots at the subject's eye and can potentially affect their focus. Since, as previously noted, it can be assumed that the subject will hold the chart at whatever distance brings the lines on the chart 10 , 110 into best focus, the primary question is whether the contrast threshold for the target spots 18 , 118 depends upon their angular subtense when this varies over the range set by the requirement that the chart is to be held and marked by the subject. This has been examined by measuring contrast sensitivity with specially printed charts 10 , 110 having spots with diameters 4, 6, 9 and 13 mm.
- the invention provides a chart and method for measuring contrast sensitivity in a variety of lighting situations and from a range of viewing distances.
Landscapes
- Life Sciences & Earth Sciences (AREA)
- Health & Medical Sciences (AREA)
- Medical Informatics (AREA)
- Biophysics (AREA)
- Ophthalmology & Optometry (AREA)
- Engineering & Computer Science (AREA)
- Biomedical Technology (AREA)
- Heart & Thoracic Surgery (AREA)
- Physics & Mathematics (AREA)
- Molecular Biology (AREA)
- Surgery (AREA)
- Animal Behavior & Ethology (AREA)
- General Health & Medical Sciences (AREA)
- Public Health (AREA)
- Veterinary Medicine (AREA)
- Eye Examination Apparatus (AREA)
- Investigating Or Analysing Biological Materials (AREA)
Abstract
Description
c) The contrast that is achieved by printing a target depends upon a number of factors, but the only one that can be adjusted at the time a chart is being printed is the tonal value of the target areas (the tonal value can be thought of as the proportion of the area that has been inked). The required value must be ascertained by reference to measurements of the contrast achieved in preliminary prints of appropriate targets with a range of different tonal values. Having fitted a suitable mathematical function relating achieved contrast to tonal value, the tonal values to be used for the targets to be printed on the contrast sensitivity charts can readily be calculated. It is difficult to check directly that the contrast of the small targets on printed
Claims (20)
Priority Applications (1)
| Application Number | Priority Date | Filing Date | Title |
|---|---|---|---|
| US15/925,254 US10660516B2 (en) | 2017-03-19 | 2018-03-19 | System and method for measurement of contrast sensitivity |
Applications Claiming Priority (2)
| Application Number | Priority Date | Filing Date | Title |
|---|---|---|---|
| US201762473416P | 2017-03-19 | 2017-03-19 | |
| US15/925,254 US10660516B2 (en) | 2017-03-19 | 2018-03-19 | System and method for measurement of contrast sensitivity |
Publications (2)
| Publication Number | Publication Date |
|---|---|
| US20180263487A1 US20180263487A1 (en) | 2018-09-20 |
| US10660516B2 true US10660516B2 (en) | 2020-05-26 |
Family
ID=63520803
Family Applications (1)
| Application Number | Title | Priority Date | Filing Date |
|---|---|---|---|
| US15/925,254 Active 2038-06-16 US10660516B2 (en) | 2017-03-19 | 2018-03-19 | System and method for measurement of contrast sensitivity |
Country Status (1)
| Country | Link |
|---|---|
| US (1) | US10660516B2 (en) |
Families Citing this family (1)
| Publication number | Priority date | Publication date | Assignee | Title |
|---|---|---|---|---|
| WO2022051710A1 (en) | 2020-09-04 | 2022-03-10 | Northeastern University | Method for visual function assessment |
Citations (1)
| Publication number | Priority date | Publication date | Assignee | Title |
|---|---|---|---|---|
| US20170273553A1 (en) * | 2016-03-23 | 2017-09-28 | Johnson & Johnson Vision Care, Inc. | System and method for the rapid measurement of the visual contrast sensitivity function |
-
2018
- 2018-03-19 US US15/925,254 patent/US10660516B2/en active Active
Patent Citations (1)
| Publication number | Priority date | Publication date | Assignee | Title |
|---|---|---|---|---|
| US20170273553A1 (en) * | 2016-03-23 | 2017-09-28 | Johnson & Johnson Vision Care, Inc. | System and method for the rapid measurement of the visual contrast sensitivity function |
Also Published As
| Publication number | Publication date |
|---|---|
| US20180263487A1 (en) | 2018-09-20 |
Similar Documents
| Publication | Publication Date | Title |
|---|---|---|
| US8272741B2 (en) | Cataract detection eye chart | |
| Universale | Visual acuity measurement standard | |
| US20120327369A1 (en) | Animated image vision test | |
| US12343080B2 (en) | Vision testing system and method | |
| Jackson et al. | Visual acuity | |
| US10660516B2 (en) | System and method for measurement of contrast sensitivity | |
| Elliott et al. | Assessment of visual function | |
| US20220304570A1 (en) | Method and Apparatus for Measuring Vision Function | |
| US10070781B2 (en) | Hand-held cyclodeviation measurement device | |
| JP3210575U (en) | Contrast chart | |
| US12471773B2 (en) | Sensory traits information collecting method and sensory traits information collecting device | |
| US5430510A (en) | Equipment for testing visual acuity and/or sensitivity to spatial contrasts in humans, and a corresponding device and manufacturing process | |
| US2835162A (en) | Apparatus for and method of examining eyes | |
| EP2873364A1 (en) | Multispectrally tested, printed colour vision test for the fine evaluation of the degree of deficiency | |
| WO2006088383A1 (en) | An ophthalmic device and a method of ophthalmic assessment | |
| US7407290B2 (en) | Method of inspecting monocular diplopia and eye mark pattern for use in the same | |
| RU2387414C1 (en) | Method of quantitative evaluation of colour sensitivity of photoreceptors of eye retina | |
| Metha et al. | The C‐100: a new dichotomiser of colour vision defectives | |
| Chen et al. | Contrast ratios, color elements, and polarities in visual acuity measurements | |
| US20200260950A1 (en) | AMD Diagnostic Multi Tester | |
| WO1999045836A1 (en) | A system for detecting and correcting color vision deficiencies based on critical fusion frequency spectral scanning | |
| Perez | Color Vision Testing with Readily Available Materials | |
| Khambhiphant et al. | The new numbers contrast sensitivity chart for contrast sensitivity measurement | |
| Doshi et al. | Assessment and investigative techniques | |
| TW201932067A (en) | Visual function examination and optical characteristic calculation system |
Legal Events
| Date | Code | Title | Description |
|---|---|---|---|
| FEPP | Fee payment procedure |
Free format text: ENTITY STATUS SET TO UNDISCOUNTED (ORIGINAL EVENT CODE: BIG.); ENTITY STATUS OF PATENT OWNER: SMALL ENTITY |
|
| FEPP | Fee payment procedure |
Free format text: ENTITY STATUS SET TO SMALL (ORIGINAL EVENT CODE: SMAL); ENTITY STATUS OF PATENT OWNER: SMALL ENTITY |
|
| STPP | Information on status: patent application and granting procedure in general |
Free format text: DOCKETED NEW CASE - READY FOR EXAMINATION |
|
| STPP | Information on status: patent application and granting procedure in general |
Free format text: NON FINAL ACTION MAILED |
|
| STPP | Information on status: patent application and granting procedure in general |
Free format text: RESPONSE TO NON-FINAL OFFICE ACTION ENTERED AND FORWARDED TO EXAMINER |
|
| STPP | Information on status: patent application and granting procedure in general |
Free format text: NOTICE OF ALLOWANCE MAILED -- APPLICATION RECEIVED IN OFFICE OF PUBLICATIONS |
|
| AS | Assignment |
Owner name: PRECISION VISION, INC., ILLINOIS Free format text: ASSIGNMENT OF ASSIGNORS INTEREST;ASSIGNOR:ROBSON, JOHN;REEL/FRAME:052149/0094 Effective date: 20200306 |
|
| STPP | Information on status: patent application and granting procedure in general |
Free format text: AWAITING TC RESP, ISSUE FEE PAYMENT RECEIVED |
|
| STCF | Information on status: patent grant |
Free format text: PATENTED CASE |
|
| MAFP | Maintenance fee payment |
Free format text: PAYMENT OF MAINTENANCE FEE, 4TH YR, SMALL ENTITY (ORIGINAL EVENT CODE: M2551); ENTITY STATUS OF PATENT OWNER: SMALL ENTITY Year of fee payment: 4 |