US10578592B2 - Method for estimating temperature variation in chromatography using thermodynamic plots and uses thereof - Google Patents
Method for estimating temperature variation in chromatography using thermodynamic plots and uses thereof Download PDFInfo
- Publication number
- US10578592B2 US10578592B2 US15/310,539 US201515310539A US10578592B2 US 10578592 B2 US10578592 B2 US 10578592B2 US 201515310539 A US201515310539 A US 201515310539A US 10578592 B2 US10578592 B2 US 10578592B2
- Authority
- US
- United States
- Prior art keywords
- mobile phase
- column
- temperature
- pressure
- temperature variation
- Prior art date
- Legal status (The legal status is an assumption and is not a legal conclusion. Google has not performed a legal analysis and makes no representation as to the accuracy of the status listed.)
- Expired - Fee Related, expires
Links
- 238000000034 method Methods 0.000 title claims abstract description 106
- 238000004587 chromatography analysis Methods 0.000 title claims abstract description 50
- 238000013375 chromatographic separation Methods 0.000 claims abstract description 50
- 239000000203 mixture Substances 0.000 claims description 62
- 238000010587 phase diagram Methods 0.000 claims description 49
- 230000008569 process Effects 0.000 claims description 32
- 238000001816 cooling Methods 0.000 claims description 26
- 239000012491 analyte Substances 0.000 claims description 25
- 238000001195 ultra high performance liquid chromatography Methods 0.000 claims description 20
- 238000010438 heat treatment Methods 0.000 claims description 19
- 238000000926 separation method Methods 0.000 claims description 19
- 239000012530 fluid Substances 0.000 claims description 16
- 238000004811 liquid chromatography Methods 0.000 claims description 14
- 239000002904 solvent Substances 0.000 claims description 4
- 230000009467 reduction Effects 0.000 claims description 3
- 238000011161 development Methods 0.000 abstract description 3
- OKKJLVBELUTLKV-UHFFFAOYSA-N Methanol Chemical compound OC OKKJLVBELUTLKV-UHFFFAOYSA-N 0.000 description 66
- CURLTUGMZLYLDI-UHFFFAOYSA-N Carbon dioxide Chemical compound O=C=O CURLTUGMZLYLDI-UHFFFAOYSA-N 0.000 description 64
- 238000010586 diagram Methods 0.000 description 62
- 229910002092 carbon dioxide Inorganic materials 0.000 description 56
- 230000008859 change Effects 0.000 description 27
- 230000000694 effects Effects 0.000 description 15
- 239000002245 particle Substances 0.000 description 12
- 238000005516 engineering process Methods 0.000 description 10
- 239000001569 carbon dioxide Substances 0.000 description 8
- 230000014759 maintenance of location Effects 0.000 description 6
- 238000012546 transfer Methods 0.000 description 5
- FNYLWPVRPXGIIP-UHFFFAOYSA-N Triamterene Chemical compound NC1=NC2=NC(N)=NC(N)=C2N=C1C1=CC=CC=C1 FNYLWPVRPXGIIP-UHFFFAOYSA-N 0.000 description 3
- 238000004458 analytical method Methods 0.000 description 3
- 238000004128 high performance liquid chromatography Methods 0.000 description 3
- 239000003607 modifier Substances 0.000 description 3
- 230000000704 physical effect Effects 0.000 description 3
- 238000010276 construction Methods 0.000 description 2
- 239000007788 liquid Substances 0.000 description 2
- 239000007787 solid Substances 0.000 description 2
- 239000012085 test solution Substances 0.000 description 2
- 239000003643 water by type Substances 0.000 description 2
- 238000007792 addition Methods 0.000 description 1
- 238000004364 calculation method Methods 0.000 description 1
- 238000013461 design Methods 0.000 description 1
- 238000001514 detection method Methods 0.000 description 1
- 238000010828 elution Methods 0.000 description 1
- 238000002474 experimental method Methods 0.000 description 1
- 230000006872 improvement Effects 0.000 description 1
- 239000000463 material Substances 0.000 description 1
- 230000000116 mitigating effect Effects 0.000 description 1
- 238000012986 modification Methods 0.000 description 1
- 230000004048 modification Effects 0.000 description 1
- 238000004007 reversed phase HPLC Methods 0.000 description 1
- 238000004088 simulation Methods 0.000 description 1
- 239000000126 substance Substances 0.000 description 1
- 238000004808 supercritical fluid chromatography Methods 0.000 description 1
- 230000002277 temperature effect Effects 0.000 description 1
Images


Classifications
-
- G—PHYSICS
- G01—MEASURING; TESTING
- G01N—INVESTIGATING OR ANALYSING MATERIALS BY DETERMINING THEIR CHEMICAL OR PHYSICAL PROPERTIES
- G01N30/00—Investigating or analysing materials by separation into components using adsorption, absorption or similar phenomena or using ion-exchange, e.g. chromatography or field flow fractionation
- G01N30/02—Column chromatography
- G01N30/26—Conditioning of the fluid carrier; Flow patterns
- G01N30/28—Control of physical parameters of the fluid carrier
- G01N30/30—Control of physical parameters of the fluid carrier of temperature
-
- G—PHYSICS
- G01—MEASURING; TESTING
- G01N—INVESTIGATING OR ANALYSING MATERIALS BY DETERMINING THEIR CHEMICAL OR PHYSICAL PROPERTIES
- G01N30/00—Investigating or analysing materials by separation into components using adsorption, absorption or similar phenomena or using ion-exchange, e.g. chromatography or field flow fractionation
- G01N30/02—Column chromatography
- G01N2030/022—Column chromatography characterised by the kind of separation mechanism
- G01N2030/025—Gas chromatography
-
- G—PHYSICS
- G01—MEASURING; TESTING
- G01N—INVESTIGATING OR ANALYSING MATERIALS BY DETERMINING THEIR CHEMICAL OR PHYSICAL PROPERTIES
- G01N30/00—Investigating or analysing materials by separation into components using adsorption, absorption or similar phenomena or using ion-exchange, e.g. chromatography or field flow fractionation
- G01N30/02—Column chromatography
- G01N2030/022—Column chromatography characterised by the kind of separation mechanism
- G01N2030/027—Liquid chromatography
Definitions
- the present disclosure relates to methods for rapidly estimating temperature variation in high-efficiency chromatography using thermodynamic parameters of the mobile phase.
- Pressure drop in the mobile phase is accompanied with a rise in the temperature of the mobile phase due to increased friction between the mobile phase and the particles of the chromatographic bed.
- the larger the pressure drop the greater the extent of temperature rise.
- neither the mobile phase nor the chromatographic bed is sufficiently thermally conductive to equilibrate the temperature rise uniformly from the interior of the column to the areas closest to the column wall.
- the mobile phase near the wall can dissipate the frictional heat more easily through the wall and therefore can maintain a temperature closer to the temperature set by a column oven. If the column is not in contact with a heater (i.e., it is kept in the open under ambient temperature), it maintains a temperature closer to the ambient temperature.
- the mobile phase along the column central axis fails to reach the temperature of the mobile phase near the wall.
- the temperature difference results in a radial thermal gradient.
- a thermal gradient in the radial direction in general, reduces column efficiency due to band broadening.
- Exemplary embodiments of the present technology are directed to methods for conveniently estimating the extent of temperature variation associated with pressure drop in a mobile phase during high-efficiency liquid chromatography (e.g., UHPLC at high pressures or CO 2 -based chromatography). Additional methods are described that utilize this information for developing chromatographic separation methods, or for improving the resolution of one or more analyte peaks in a chromatographic separation. These methods can involve selecting a mobile phase that exhibits lower temperature variation, or pre-heating or pre-cooling the mobile phase, or using heat exchangers at various positions in the chromatography column or combinations thereof. Further, methods are also provided that utilize the temperature variation information for determining a mobile phase composition which can maintain density and temperature at substantially constant levels as pressure varies.
- high-efficiency liquid chromatography e.g., UHPLC at high pressures or CO 2 -based chromatography
- a method for estimating temperature variation of a mobile phase passing through a column in a chromatographic separation system includes the steps of providing a pressure-temperature (P-T) phase diagram of the mobile phase, such that the phase diagram includes isenthalpic curves of the mobile phase; drawing a triangular figure by connecting a first, second, and a third point on the phase diagram, such that the first point corresponds to the temperature of the column T first , and the mobile phase pressure P first at a first position in the column; the second point corresponds to T first , and to the mobile phase pressure P second at a second position in the column; and the third point corresponds to P second , and T second , such that T second is the temperature of the mobile phase at the second position, such that the first and the third points lie on the same isenthalpic curve; and estimating the temperature variation by calculating the difference between T first and T second .
- the triangular figure is referred to as a temperature triangle.
- Embodiments of the above exemplary method can include one or more of the following features.
- the second position is downstream from the first position.
- P first and P second are the pressures of the mobile phase
- T first and T second are the temperatures of the mobile phase at the entry point and the exit point, respectively, of the column.
- the system includes an ultra-high performance liquid chromatography system, a CO 2 -based chromatography system, a high temperature liquid chromatography system, or a chromatography system that uses sub-critical or supercritical fluid as the mobile phase.
- a method of developing a chromatographic separation process includes the steps of selecting a column and a first mobile phase composition; estimating temperature variation in the first mobile phase composition between pressures P inlet and P outlet using the temperature triangle described above, such that P inlet and P outlet , respectively, are the pressures of the mobile phase at the entry point and at the exit point of the column; and determining a second mobile phase composition for the process, such that the estimated temperature variation in the second mobile phase composition between P inlet and P outlet is different from that in the first mobile phase composition.
- Embodiments of the above exemplary method of developing a chromatographic separation process can include one or more of the following features.
- the chromatographic separation process is performed using an ultra-high performance liquid chromatography system, or a CO 2 -based chromatography system, or a high temperature liquid chromatography system, or a chromatography system that uses sub-critical or supercritical fluid as the mobile phase.
- the estimated temperature variation for the second mobile phase is smaller than that in for the first mobile phase.
- a method for improving resolution of one or more analyte peaks in a chromatographic separation process includes the steps of estimating, using the temperature triangle above, temperature variation in the mobile phase, a first mobile phase, due to a pressure drop; and obtaining a reduction in width of at least one of the one or more analyte peaks by substituting the first mobile phase with a second mobile phase having a composition different from that of the first, such that temperature variation in the second mobile phase due to the pressure drop, estimated using the temperature triangle described above, is different compared to that estimated for the first mobile phase.
- the estimated temperature variation in the second mobile phase is smaller than that estimated for the first mobile phase.
- another method for improving resolution of one or more analyte peaks in a chromatographic separation process includes the steps of providing a column and a mobile phase for the process; estimating temperature variation due to pressure drop in the mobile phase between a first position and a second position in the column, such that the temperature variation is estimated using the temperature triangle described above; and pre-cooling or pre-heating the mobile phase by a temperature equal to or less than the temperature variation estimated using the temperature triangle described above.
- an additional method for improving resolution of one or more analyte peaks in a chromatographic separation process includes the steps of providing a column and a mobile phase; estimating temperature variation due to pressure drop in a first mobile phase between a first position and a second position in the column; and cooling or heating the column at one or more positions along the length of the column during the separation process, such that the cooling or heating results in a smaller temperature variation in the mobile phase due to the pressure drop between the first and the second positions than was originally estimated, such that the temperature variation between the two determination are estimated using the temperature triangle described above.
- Embodiments of the above exemplary method for improving resolution of one or more analyte peaks in a chromatographic separation process can include one or more of the following features.
- the first and the second positions are the inlet and the outlet, respectively, of the column.
- the chromatographic separation process is performed using ultra-high performance liquid chromatography, CO 2 -based chromatography, high temperature liquid chromatography, or chromatography that uses sub-critical or supercritical fluid as the mobile phase.
- a method for determining a mobile phase composition for a chromatographic separation process, such that the density and the temperature of the mobile phase remains substantially constant as the mobile phase pressure varies.
- the method including the steps of (a) providing a first P-T phase diagram having isopycnic curves corresponding to different mobile phase compositions; (b) selecting a range of mobile phase compositions bounded by a first isopycnic curve and a second isopycnic curve, such that, in a pressure interval defined by a first and a second mobile phase pressure, the maximum variation in density of any one of the mobile phase compositions in the range is less than about 0.5 g/L; (c) providing a second P-T phase diagram that includes isenthalpic curves corresponding to a mobile phase composition selected from the range of compositions defined in step (b); and, (c) identifying a mobile phase composition from the second P-T phase diagram, such that the estimated variation in temperature of the mobile phase composition in the
- an additional method for developing a chromatographic separation process includes the steps: (a) selecting a column and a mobile phase composition; (b) providing a pressure-temperature (P-T) phase diagram of the mobile phase, wherein the phase diagram comprises isopycnic curves of the mobile phase and the pressure values range from at least 1000 to at least 6000 psi and the temperature values range from at least 0° C. to at least 200° C.; and (c) operating the chromatographic separation process in a region in the diagram where the mobile phase has a delta density/delta pressure value less than about 80% of the diagram.
- the mobile phase of the operating chromatographic separation process can be in a supercritical or near supercritical state.
- the exemplary methods of the present disclosure provide numerous advantages.
- the method for estimating temperature variation associated with pressure drop in a mobile phase is highly convenient and requires neither complex calculations nor complex experiments. Because of the ease with which temperature variation may be estimated using the method, the results may be used for many applications, for example, selection of a suitable mobile phase during method development or improvement of resolution of analyte peaks during a chromatographic separation.
- temperature variation information obtained using the method disclosed can also be readily used for determining mobile phase compositions that can maintain density and temperature at substantially constant levels as mobile phase vary due to pressure drop, which is particularly advantageous in separations carried out using CO 2 -based chromatography.
- FIG. 1A is an exemplary diagram showing the effect of thermal heterogeneity in the radial and axial directions on the separation of analytes in liquid chromatography.
- FIG. 1B is an exemplary diagram illustrating energy flow at different boundaries of a chromatography column.
- FIG. 1C is an exemplary pressure-temperature phase diagram (P-T diagram) showing an isenthalpic curve for a mobile phase composition.
- the diagram can be used for estimating temperature difference of the mobile phase during a chromatographic separation process as is passes through a column due to pressure drop in a mobile phase under adiabatic conditions.
- FIG. 2 is an exemplary pressure-temperature phase diagram showing isenthalpic curves for a mobile phase having the composition of 95% CO 2 and 5% methanol (95/5 CO 2 /methanol).
- FIG. 3 is an exemplary liquid chromatography system (e.g., a CO 2 -based chromatography system) depicting different control modules, including a pressurization control module for forming a supercritical or near supercritical conditions of the mobile phase.
- a pressurization control module for forming a supercritical or near supercritical conditions of the mobile phase.
- FIG. 4 is an exemplary pressure-temperature phase diagram showing an exemplary “Point 1” corresponding to the mobile phase pressure and temperature of 4000 psi and 151° C., respectively, prior to pressure drop.
- FIG. 5 is an exemplary pressure-temperature phase diagram showing that in case the point representing a particular pressure and temperature coordinate is not located on an isenthalpic curve on the P-T diagram, an interpolated isenthalpic curve can be estimated by the two adjacent isenthalpic curves on the plot.
- the dashed curve ( 51 ) shows one such estimated isenthalpic curve.
- FIG. 6 is an exemplary pressure-temperature phase diagram showing an exemplary “Point 2” corresponding to mobile phase pressure and temperature of 2000 psi and 151° C., respectively, after pressure drop.
- FIG. 7 is an exemplary pressure-temperature phase diagram showing an exemplary “Point 3” in addition to Points 1 and 2.
- the coordinates of Point 3 correspond to a mobile phase pressure and temperature of 2000 psi and 120° C., respectively.
- Point 3 lies on the same isenthalpic curve as Point 1.
- FIG. 8 is an exemplary pressure-temperature phase diagram showing an exemplary triangular figure or “temperature triangle” ( 80 ) obtained by joining Points 1 and 2, Points 2 and 3, and Points 1 and 3. Points 1 and 2, and Points 2 and 3 are joined by straight lines. Points 1 and 3 are joined by a curve, i.e., the isenthalpic curve passing through Points 1 and 3.
- FIG. 9A (left) is an exemplary schematic diagram of a CO 2 -based chromatography column showing column inlet ( 91 ), column outlet ( 92 ), and the column central axis ( 93 ).
- FIG. 9B (right) is an exemplary schematic diagram showing a temperature triangle for quantitation of the maximum expected variation in temperature of the mobile phase in going from the entrance to the exit of the column shown in FIG. 9A .
- FIG. 10 is an exemplary pressure-temperature phase diagram showing an exemplary temperature triangle that is similar to that shown in FIG. 8 .
- the change for an isothermal condition ( 105 ) and the change for an adiabatic condition ( 106 ) are shown.
- FIG. 11 is an exemplary schematic diagram of the temperature and the pressure profiles represented by the line between Points 1 and 2 of FIG. 8 .
- the profiles are plotted as a function of column position in the axial direction from inlet to outlet.
- the solid horizontal line at 151° C. exemplifies an isothermal condition.
- FIG. 12 is an exemplary schematic diagram of the temperature and the pressure profiles represented by the curve joining Points 1 and 3 of FIG. 8 .
- the profiles are plotted as a function of the column position in the axial direction from inlet to outlet.
- the solid curve connecting the temperature points 151° C. and 120° C. exemplifies an adiabatic condition.
- FIG. 13 is an exemplary pressure-temperature phase diagram similar to that shown in FIG. 8 wherein the dashed horizontal lines within the temperature triangle represent temperature differences between the column center and the column wall at various points along the length of the column.
- FIG. 14 is an exemplary pressure-temperature phase diagram showing different estimated maximum temperature variations in the mobile phase in a CO 2 -based chromatography system corresponding to different inlet temperatures wherein the inlet and the outlet pressures remain constant (e.g., 1410 , 1420 and 1430 ). In each case the outlet temperature is determined by a different isenthalpic curve.
- FIG. 15 is an exemplary pressure-temperature phase diagram showing the effects of pre-cooling of the mobile phase to mitigate the effect of temperature rise due to the pressure drop.
- FIG. 16 is an exemplary pressure-temperature phase diagram showing the effects of cooling of the column different positions along the length of the column to mitigate the effect of temperature rise due to the pressure drop.
- FIG. 17 is an exemplary pressure-temperature phase diagram showing the use of heat exchangers for raising the temperature at different positions in the column to mitigate the effect of temperature variation in the mobile phase.
- FIG. 18 is an exemplary pressure-temperature phase diagram showing the effects of pre-heated mobile phase to mitigate the extent of temperature variation in the mobile phase.
- FIG. 19 is an exemplary pressure-temperature phase diagram showing isenthalpic curves for a mobile phase having the composition of 80% CO 2 and 20% methanol (80/20 CO 2 /methanol).
- the shaded region on the diagram shows isenthalpic curves substantially parallel to the isothermal lines.
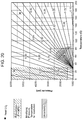
- FIG. 20 is an exemplary pressure-temperature phase diagram showing isopycnic curves for a 100% carbon dioxide mobile phase.
- the shaded region A is an area of the diagram where the mobile phase density does not vary significantly as a result of a pressure change.
- the shaded region B, and more particularly B′, is an area of the diagram where the mobile phase density does vary significantly as a result of a pressure change.
- FIG. 21 is an exemplary pressure-temperature phase diagram showing isopycnic curves for a mobile phase having the composition of 90% CO 2 and 10% methanol (90/10 CO 2 /methanol).
- the shaded region A is an area of the diagram where the mobile phase density does not vary significantly as a result of a pressure change.
- the shaded region B, and more particularly B′, is an area of the diagram where the mobile phase density does vary significantly as a result of a pressure change.
- FIG. 22 is a set of two exemplary pressure-temperature phase diagram showing isopycnic curves for a mobile phase having the composition of 80% CO 2 and 20% methanol (80/20 CO 2 /methanol) and a mobile phase having the composition of 70% CO 2 and 30% methanol (70/30 CO 2 /methanol).
- the shaded regions A are areas of the diagrams where the mobile phase density does not vary significantly as a result of a pressure change.
- the shaded regions B are areas of the diagrams where the mobile phase density does vary significantly as a result of a pressure change.
- Thermal heterogeneity affects the separation of analytes in a mixture because movement of an analyte through a chromatographic column is influenced by temperature of the mobile phase. Thermal heterogeneity may occur both in the axial and radial directions, and may be manifested as a temperature gradient. However, it affects the mobility of the analyte in the axial and radial directions differently.
- FIG. 1A illustrates how the width of an analyte peak is affected in each case.
- temperature gradient acts similarly to a solvent gradient in reverse phase high performance liquid chromatography in that it primarily affects the elution time of the analyte.
- the width of the analyte peak ( 10 ) is not affected significantly.
- radial variation of temperature causes the velocity of the analyte to be different at various locations in the cross-sectional plane of the column. For example, a lower temperature at the center ( 11 ) compared to the column wall ( 12 ) results in the analyte at the center ( 11 ) having a lower velocity relative to that near the wall ( 12 ). This leads to distortion and broadening ( 13 , 14 ) of the analyte peak with accompanying loss of resolution.
- thermal heterogeneity is the pressure drop in the mobile phase that occurs in high efficiency liquid chromatography as the mobile phase is forced through a chromatographic bed of small particle size (e.g., less than about 3 ⁇ M; less than about 2 ⁇ M, less than about 1 ⁇ M, or less than about 0.5 ⁇ M) at a high flow rate.
- Thermal heterogeneity arising from pressure drop can be understood better by considering FIG. 1B which shows energy flow at the different boundaries of a chromatography column, such as the column inlet ( 15 ), column outlet ( 16 ), and column wall ( 12 ). Also shown is the central column axis ( 17 ). At the column inlet ( 15 ), energy enters with the incoming mobile phase.
- the mobile phase At the column outlet ( 16 ), energy is removed as the mobile phase exits the column. If no energy transfer takes place across the column wall ( 12 ), as depicted in FIG. 1B , the mobile phase experiences adiabatic conditions and the enthalpy remains constant. Also, if there is energy transfer at the wall ( 12 ), but the energy is not transferred inwards due to poor thermal conductivity, the mobile phase near the column central axis ( 17 ) is thermally isolated relative to the column wall, and may be considered to be under an adiabatic condition.
- the pressure drop leads to a rise in the temperature of the mobile phase due to increased friction between the mobile phase and the particles of the chromatographic bed.
- the temperature rise in the mobile phase is neutralized due to heat transfer between the column wall (which is maintained at a constant temperature) and the mobile phase.
- the temperature remains high.
- the present disclosure relates to a method for estimating temperature variation of a mobile phase passing through a column in a chromatographic separation system, the method including providing a pressure-temperature (P-T) phase diagram of the mobile phase, wherein the phase diagram comprises isenthalpic curves of the mobile phase; drawing a triangular figure by connecting a first, second, and a third point on the phase diagram, wherein the first point corresponds to the temperature of the column T first and the mobile phase pressure P first at a first position in the column; the second point corresponds to T first and to the mobile phase pressure P second at a second position in the column; and the third point corresponds to P second , and T second , wherein T second is the temperature of the mobile phase at the second position, wherein the first and the third points lie on the same isenthalpic curve; and, and estimating the temperature variation by calculating the difference between T first and T second .
- Estimating the temperature variation of a mobile phase passing through a column in a chromatographic separation system is desirable, in
- the mobile phases can include an compressible fluid, such as carbon dioxide, and optionally a modifier, such as methanol.
- the modifier can be an non-compressible fluid.
- the amount of compressible fluid, or fluids, in the mobile phase can be greater than about 10%, 20%, 30%, 40%, 50%, 55%, 60%, 65%, 70%, 75%, 80%, 85%, 90%, 95%, 98%, or 99%.
- the mobile phase can also be 100% compressible fluid. These values can also be used to define a range, such as between about 70% and about 100%.
- the amount of non-compressible fluid, or fluids, in the mobile phase can be less than about 90%, 80%, 70%, 60%, 50%, 40%, 30%, 25%, 20%, 15%, 10%, 5%, 2%, or 1%.
- the mobile phase can also contain 0% non-compressible fluid. These values can also be used to define a range, such as between about 0% and about 30%.
- the column can be any column suitable for use in a chromatographic separation process that can experience temperature variation of the mobile phase across the column separation.
- the chromatographic separation process can be an ultra-high performance liquid chromatography system, a CO 2 -based chromatography system, a high temperature liquid chromatography system, or a chromatography system that uses sub-critical or supercritical fluid as the mobile phase.
- thermodynamic plots specifically pressure versus temperature phase diagrams (P-T diagram) of the mobile phase.
- the P-T diagram used for this purpose contain constant enthalpy (or iso-enthalpic or isenthalpic) curves, constant density (or isopycnic) curve, or both corresponding to the mobile phase.
- An isenthalpic curve is one in which all points on the curve represent states of same enthalpy.
- An isopycnic curve is one in which all points on the curve represent states of same density.
- FIG. 1C is a schematic diagram showing a temperature triangle for a mobile phase under perfectly adiabatic condition.
- the outlet temperature of the mobile phase can be estimated from the isenthalpic curve corresponding to the mobile phase inlet temperature.
- FIG. 1C is an illustration of a portion of a P-T diagram of a mobile phase; whereas FIG. 2 shows a P-T diagram of a mobile phase having a particular composition of 95% CO 2 and 5% methanol. Lines parallel to x-axis and y-axis are isobars and isotherms, respectively, and the curves are isenthalpic curves of the mobile phase.
- the construction of an exemplary temperature triangle is described in connection with FIG. 3 (e.g., for an exemplary CO 2 based chromatography control system) and in connection with FIGS. 4-8 , providing P-T diagrams for a mobile phase of 95% CO 2 and 5% methanol (95/05 CO 2 /methanol mixture).
- the system pressure and the column temperature are obtained from the chromatography instrument ( FIG. 3 ) and represented as “Point 1” on the P-T diagram ( FIG. 4 ).
- the system pressure may be obtained from a solvent delivery system module ( 31 )
- the column temperature may be obtained from a sample separation module ( 33 )
- Other modules of the representative CO 2 -based chromatography control system of FIG. 3 are a sample delivery system ( 32 ), a pressurization/supercritical condition control module ( 35 ) and a detection system ( 34 ).
- Point 1 represents a mobile phase condition before a pressure drop from a sample separation and mobile phase passing through the column.
- Point 1 can correspond to the system pressure or the mobile phase pressure at column inlet (P inlet ) and the column temperature, which in this example are 4000 psi and 151° C., respectively.
- Point 1 can correspond to other mobile phase conditions before another pressure drop in the system.
- the present disclosure is applicable to systems having pressures of about 100 psi, 200, 300, 400, 500, 600, 700, 800, 900, 1000, 1500, 2000, 2500, 3000, 3500, 4000, 4500, 5000, 5500, 6000, 7000, 8000, 9000 or about 10,000 psi. These values can be used to define a range, such as from about 1000 to about 6000 psi. These values can also be used to define the bounds of the P-T diagrams used to describe the mobile phase properties.
- the present disclosure is applicable to systems having temperatures of about 0° C., 10, 20, 30, 40, 50, 60, 70, 80, 90, 100, 110, 120, 130, 140, 150, 160, 170, 180, 190, or about 200° C. These values can be used to define a range, such as from about 0° C. and about 200° C. These values can also be used to define the bounds of the P-T diagrams used to describe the mobile phase properties.
- the exemplary pressure and temperature chosen are simply to aid in the description of constructing the temperature triangle.
- the construction method described herein is equally applicable for any other temperature.
- an isenthalpic curve can be interpolated between two adjacent isenthalpic curves on the plot.
- a similar estimation can be made of the isopycnic curves. An example of such a situation is shown in FIG. 5 .
- the interpolated curve ( 51 ) was generated by interpolation and is shown as a dashed line.
- the pressure drop at a second point due to the chromatographic separation is utilized in combination with the first point, e.g., the inlet temperature to generate, see FIG. 6 .
- the mobile phase pressure drop may be obtained from the ABPR, which corresponds to the pressure at column outlet (P outlet ).
- P outlet the pressure at column outlet
- the pressure is 2000 psi
- the temperature, which remains the same as that for Point 1, is 151° C. See “Point 2” ( FIG. 6 ).
- the second position is downstream from the first position.
- P first and T first can be the pressure and temperature of the mobile phase at the entry point of the column
- P second and T second can be the pressure and temperature of the mobile phase at the exit point of the column.
- a third point is identified on the diagram that lies on the isenthalpic curve passing though “Point 1.”
- a line parallel to the x-axis and passing through Point 2 is drawn. This line is the isobar at the point of pressure drop, for example the ABPR pressure.
- the isobar meets the isenthalpic curve at a point shown as “Point 3” in FIG. 7 .
- the coordinates of Point 3 are 2000 psi and 120° C.
- a similar exercise and triangle can be generated using isopycnic curves.
- a temperature triangle can be drawn using these three points.
- the resultant temperature triangle ( 80 ) for the current example is shown in FIG. 8 . While Points 1 and 2, and Points 2 and 3 are joined by straight lines, Points 1 and 3 are joined by the isenthalpic curve passing through Points 1 and 3. Although the resulting figure is not strictly a triangle, it is referred to herein as a “temperature triangle.”
- vertex A (which corresponds to Point 1 of the triangle ( 80 )) represents the pressure and temperature conditions at the column inlet ( 91 ).
- the pressure distribution in the radial direction at the column inlet can be assumed to be homogeneous.
- the temperature of the mobile phase at the column inlet ( 91 ) can be assumed to have reached the temperature of the column oven.
- vertex B (which corresponds to Point 2 in FIG. 8 ) represents the column outlet ( 92 ) and the condition when the temperature of the mobile phase in the column is unchanged (isothermal condition).
- the pressure drop across tubing connecting the column outlet and the ABPR is negligible; the pressure distribution in the radial direction at the column outlet is homogeneous; and, the heat-transfer between the column and the column oven along the length of the column is effective such that the temperature of the mobile phase is the same (oven temperature) at every location inside the column as the mobile phase passes through the column.
- Vertex C (which corresponds to Point 3 in FIG. 8 ) can represent the column outlet ( 91 ) and the pressure and temperature condition when the enthalpy of the mobile phase remains constant (isenthalpic condition).
- the pressure drop across tubing connecting the column outlet and the ABPR is negligible; the pressure distribution in the radial direction at the column outlet is always homogeneous; and the column is thermally insulated from the surroundings so that a perfect adiabatic condition is maintained in the column.
- the mobile phase conditions at the column wall and around the central axis of the column closely approximate isothermal and adiabatic conditions, respectively.
- the experimental conditions with respect to the lines and the curves joining the three vertices of the temperature triangle can include the column temperature being considered homogenous in the radial direction at each cross section of the column.
- the following conditions can apply to at least the following situations. First, when the entire column is maintained at a perfectly isothermal condition, and second, when the entire column is maintained at a perfectly adiabatic condition.
- the isothermal condition can be represented by the downward pointing vertical arrow 105 in FIG. 10 that joins Points 1 and 2.
- the curve joining Points 1 and 3 (curved arrow 110 in FIG. 10 ) represents the temperature and pressure profile of the mobile phase as it passes through the column when the condition is adiabatic.
- Points 1 and 3 represent temperatures and pressures of the mobile phase, at the inlet and outlet, respectively.
- Schematic diagrams of the temperature and the pressure profiles represented by the line joining Points 1 and 2 (isothermal condition), and the curve joining Points 1 and 3 (adiabatic condition), plotted as functions of the column position in axial direction are also shown in FIGS. 11 and 12 .
- the experimental conditions with respect to the lines and the curves joining the three vertices of the temperature triangle can include the column temperature being considered non-homogenous in the radial direction at each cross section of the column.
- This condition can be reflective of real operating conditions, in which the column is kept in a thermostatic environment, e.g., a column oven (or open to room temperature) such that the column wall is exposed to a constant temperature environment, and there is heat transfer between the wall and the mobile phase close to the wall which neutralizes the temperature variation in the mobile phase near the wall.
- a thermostatic environment e.g., a column oven (or open to room temperature)
- the temperature change due to pressure drop along the column axis e.g., 93 in FIG.
- the mobile phase in the interior of the column, along the axis ( 93 ) can experience conditions approximating adiabatic conditions. Under perfectly adiabatic conditions the enthalpy inside a chromatographic column remains constant. Therefore, the mobile phase temperature at the column axis (T outlet ), at the point of pressure drop (P outlet ) can be determined by the point of intersection (Point 3) of the isenthalpic curve corresponding to the starting temperature and pressure (Point 1) and the isobar for the final pressure. The mobile phase temperature, at the column wall (T inlet ) at the point of pressure drop (P outlet ) can be determined from the set oven temperature.
- the maximum temperature variation due to pressure drop can be estimated by the temperature difference between T inlet and T outlet . See FIGS. 10 and 13 . Further, the maximum temperature variation for different pressure drops by can be estimated by drawing lines parallel to the X-axis within the temperature triangle as shown in FIG. 13 .
- the present disclosure is related to a method of developing a chromatographic separation process, the method including selecting a column and a first mobile phase composition; estimating temperature variation in the first mobile phase composition between pressures P inlet and P outlet as described herein, wherein P inlet and P outlet , respectively, are the pressures of the mobile phase at the entry point and at the exit point of the column; and determining a second mobile phase composition for the process, wherein the estimated temperature variation in the second mobile phase composition between P inlet and P outlet is different from that in the first mobile phase composition.
- the method can be used to generate temperature triangles for a number of different inlet temperatures of a mobile phase. These different inlet temperatures can be evaluated for the maximum temperature variation that would result from selecting any one of the inlet temperatures (e.g., in one embodiment as shown the inlet and the outlet pressure remain constant) in order to then select an inlet temperature that result in a smaller temperature variation. In some instances, a smaller temperature variation can be an optimal or optimized conditions for a given CO 2 based chromatography separation.
- the temperature variation can be differ (e.g., be smaller or larger) by at least 5%, 10%, 15%, 20%, 25%, 30%, 35%, 40%, 45%, 50%, 55%, 60%, 65%, 70%, 75%, 80%, 85% or 90%. These values can also be used to define a range, such as about 10% to about 50%.
- the temperature triangles ( 1410 ), ( 1420 ), and ( 1430 ) show that for a given pressure drop, selecting an inlet temperature corresponding to triangle ( 1410 ) would result in the least temperature variation, followed by selecting that corresponding to the triangle ( 1420 ). The temperature variation due to pressure drop would be the highest for the inlet temperature corresponding to the triangle ( 1430 ).
- the method can also be used for improving the resolution of analyte peaks in liquid chromatography. For example, temperature variation in a first mobile phase composition arising from pressure drop can first be estimated using the temperature triangle described above. Next, temperature variation for the same pressure drop can be estimated for other mobile phase compositions, and a composition can be selected that has a lower estimated temperature variation. Use of the mobile phase having a lower estimated temperature variation can reduce the width of an analyte peak compared to the width obtained with the use of the first mobile phase composition at the beginning of the process.
- the present disclosure relates to a method for improving resolution of one or more analyte peaks in a chromatographic separation process, the method including estimating the temperature variation in a first mobile phase as described herein; and, obtaining a reduction in width of at least one of the one or more analyte peaks by substituting the first mobile phase with a second mobile phase having a different composition, wherein the estimated temperature variation in the second mobile phase as described herein is different compared to that estimated for the first mobile phase.
- the temperature variation can be differ (e.g., be smaller or larger) by at least 5%, 10%, 15%, 20%, 25%, 30%, 35%, 40%, 45%, 50%, 55%, 60%, 65%, 70%, 75%, 80%, 85% or 90%. These values can also be used to define a range, such as about 10% to about 50%.
- the estimated temperature variation in the second mobile phase is smaller than that estimated for the first mobile phase.
- the method of the present disclosure can further be used for designing thermal mitigators for liquid chromatography.
- These mitigators can include pre-cooling/pre-heating the mobile phase before entry into the column, cooling/heating the column at different points along the column length, or combinations thereof.
- the cooling/heating of the column can be a performed as a gradient along the length of the column.
- the gradient can be matched to offset or mitigate the temperature variation in the column.
- the mobile phase may be pre-cooled by approximately 20° C. to nullify the temperature effect of the pressure drop.
- the pre-cooling/pre-heating of the mobile phase can be about 10%, 15%, 20%, 25%, 30%, 35%, 40%, 45%, 50%, 55%, 60%, 65%, 70%, 75%, 80%, 85%, 90%, 95% or 100% of the estimated temperature difference. These values can also be used to define a range, such as about 10% to about 50%.
- FIG. 15 shows a pressure-temperature diagram illustrating the pre-cooling effect. In this manner, the band distortion or broadening due to thermal effect could be reduced, minimized or avoided.
- FIGS. 16-18 show a pressure-temperature diagrams illustrating the intermediate cooling of the column at different positions along the length of the chromatography column.
- intermediate cooling may not eliminate the temperature change completely, but it can greatly reduce the temperature change.
- FIG. 16 shows that the more intermediate cooling steps used, the lesser the magnitude of net temperature difference.
- FIG. 17 shows the use of heat exchangers for raising the temperature at different positions in the column to mitigate the effect of temperature variation in the mobile phase.
- FIG. 18 shows the effects of pre-heated mobile phase to mitigate the extent of temperature variation in the mobile phase.
- the present disclosure relates to a method for improving resolution of one or more analyte peaks in a chromatographic separation process, the method including providing a column and a mobile phase; estimating the temperature variation in the mobile phase between a first position and a second position in the column as described herein; and, pre-cooling or pre-heating the mobile phase by a temperature equal to or less than the estimated temperature variation.
- the present disclosure relates to a method for improving resolution of one or more analyte peaks in a chromatographic separation process, the method including providing a column and a mobile phase; estimating the temperature variation in a first mobile phase between a first position and a second position in the column as described herein; and cooling or heating the column at one or more positions along the length of the column during the separation process, wherein the cooling or heating results in a smaller estimated temperature variation in the mobile phase between the first and the second positions as described herein than that first estimated.
- the first position can be the column inlet and the second position can be the column outlet.
- the cooling or heating of the column at one or more positions along the length of the column can result in a gradient that changes from the column inlet to the column outlet.
- FIG. 19 show a P-T diagram having isenthalpic curves for a mobile phase composition containing 80% CO 2 and 20% methanol. Regions of the diagram can be selected, as exemplified by the shaded region A of FIG. 19 . In region A, the isenthalpic curves are almost parallel to the isothermal lines. Within the shaded region A, the selection of any temperature as the inlet temperature can result in an minimal or insubstantial temperature change in the mobile phase due to pressure drop.
- the conditions for operating a chromatographic separation system wherein the temperature variation is minimized can include selection of conditions, e.g., initial, final or both, corresponding to a region of the P-T diagram having one or more isenthalpic curves having an absolute slope of less than about 50, 40, 30, 20, 19, 18, 17, 16, 15, 14, 13, 12, 11, 10, 9, 8, 7, 6, 5, 4, 3, 2, 1.5, 1.4, 1.3, 1.2 or about 1.1.
- the values can also define a range of slopes such as about 1.1 to about 5.
- the conditions for operating a chromatographic separation system wherein the temperature variation is minimized can include selection of conditions, e.g., initial, final or both, corresponding to a region of the P-T diagram having one or more isenthalpic curves having an absolute slope of about 1.
- the slope value can depend on the thermal properties of the system, e.g. the thermal conductivity, specific heat, or thermal diffusivity.
- the method for estimating temperature difference due to pressure drop can also be used for determining a mobile phase composition for a chromatographic separation process in which the both the density and the temperature of the mobile phase remains substantially constant as the mobile phase pressure varies. That is, in this embodiment, both the temperature and the density remains substantially constant as the mobile phase pressure varies.
- a P-T phase diagram having both isopycnic curves and isenthalpic curves are provided.
- the P-T phase diagram containing isopycnic curves corresponding to different mobile phase compositions can first be used to select a range of mobile phase compositions between two isopycnic curves having a maximum variation in density of a mobile phase composition.
- the maximum variation in density can be less than about 1.0, 0.9, 0.8, 0.7, 0.6, 0.5, 0.4, 0.3, 0.2, 0.1, 0.05 or 0.02 g/L. These values can also be used to define a range such as from about 0.2 to about 0.5 g/L.
- the P-T phase diagram containing isenthalpic curves can be used to select a range of mobile phase compositions between two isenthalpic curves having a maximum temperature variation.
- the maximum variation in temperature can be less than about 20, 19, 18, 17, 16, 15, 14, 13, 12, 11, 10, 9, 8, 7, 6, 5, 4, 3, 2, 1, 0.5 or 0.2° C. These values can also be used to define a range such as from about 5 to about 0.5° C.
- the maximum variation in temperature using the P-T phase diagram containing isenthalpic curves can be first used, than the variation in density using the P-T phase diagram containing isopycnic curves.
- the present disclosure relates to a method for determining a mobile phase composition for a chromatographic separation process, wherein the density and the temperature of the mobile phase remains substantially constant as the mobile phase pressure varies, the method including providing a first P-T phase diagram comprising isopycnic curves corresponding to different mobile phase compositions; selecting a range of mobile phase compositions bounded by a first isopycnic curve and a second isopycnic curve, wherein, in a pressure interval defined by a first and a second mobile phase pressure, the maximum variation in density of any one of the mobile phase compositions in the range is less than about 0.5 g/L; providing a second P-T phase diagram comprising isenthalpic curves corresponding to a mobile phase composition selected from the range of compositions defined in step (b); and identifying a mobile phase composition from the second P-T phase diagram, wherein the estimated temperature variation of the mobile phase in the pressure interval as described herein is less than about 5.0° C.
- the first and second mobile phase pressures may, for example be the column inlet and column outlet pressure, respectively.
- a second P-T diagram having isenthalpic curves corresponding to a mobile phase composition selected from the range of compositions defined using the diagram having isopycnic curves is used to identify a mobile phase composition from the second P-T phase diagram such that the estimated mobile phase temperature variation in the pressure interval between the first and the second mobile phase pressures, estimated using the temperature triangle described above, is minimal.
- the estimated temperature variation is less than 5° C., such that the temperature of the mobile phase remains substantially constant. In this manner a mobile phase composition can be determined which maintains substantially the same temperature and density as the mobile phase pressure varies.
- the present disclosure also relates to methodologies and apparatus for compensating, addressing, and optimizing retention in CO 2 -based chromatography (i.e., mobile phase includes CO 2 ) using pressure-temperature (P-T) phase diagrams of the mobile phase having isopycnic curves.
- Parameters affecting carbon dioxide based chromatographic separations include temperature (e.g., column temperature, mobile phase temperature, detector temperature), pressure, and flow rate. These parameters are typically pre-set and controlled during carbon dioxide based separations. For example, one or more of these parameters may be held constant over the course of a separation (i.e., isothermal) or may be changed (i.e., temperature gradient) to effect a desired separation or retention.
- These parameters are often monitored or controlled by sensors placed throughout the carbon dioxide based chromatographic system (e.g., pressure sensor at the pump) or by equipment designed to achieve a pre-set value (e.g., external column heater setting or pump flow rate setting).
- Density of the mobile phase can be greatly affected by changes in pressure, temperature and other system operating parameters. For example, change of pressure can greatly affect the chromatography analysis in supercritical fluid chromatography (SFC) using CO 2 in the mobile phase—and in particular, if carried out at a temperature where the fluid is more compressible. For the same pressure drop, a change in the density of a mobile phase is greater if the operating temperature is higher.
- SFC supercritical fluid chromatography
- HPLC high pressure liquid chromatography
- the parameters such as the flow rate, the column length, and the particle size of the chromatographic bed are varied to obtain better efficiency and/or faster analysis. These changes do not affect the retention of the sample on the column, i.e., retention factor remains almost the same. Only the efficiency varies. In contrast, in CO 2 -based chromatography, changes in one or more of these parameters can affect retention characteristics.
- the extent to which the original retention characteristics can be maintained once the chromatography parameters are changed depends on how much density variation is taking place inside the column due to the change in one or more of the parameters.
- pressure-temperature phase diagrams having ispoycnic curves can be used to determine how much density variation there may be for a particular pressure drop at a particular temperature. At high temperatures, where the isopycnic plots show that the density variation due to pressure change is higher, significant changes in chromatographic separation can result from changes in chromatographic parameters such as flow rate.
- an isopycnic plot is used to determine a region in the plot where density does not vary significantly as a result of pressure change.
- FIGS. 20-22 show examples of isopycnic plots showing robust regions where the density does not vary significantly as a result of pressure change.
- FIG. 20 shows a pressure-temperature phase diagram having isopycnic curves for a 100% carbon dioxide mobile phase.
- the shaded region A is an exemplary area of the diagram where the mobile phase density does not vary significantly as a result of a pressure change.
- the shaded region B is an exemplary area of the diagram where the mobile phase density does vary significantly as a result of a pressure change.
- the conditions for operating a chromatographic separation system wherein the temperature variation is minimized can include selection of conditions, e.g., initial, final or both, corresponding to a region of the P-T diagram having one or more isopycnic curves having an absolute slope of less than about 50, 40, 30, 20, 19, 18, 17, 16, 15, 14, 13, 12, 11, 10, 9, 8, 7, 6, 5, 4, 3, 2, 1.5, 1.4, 1.3, 1.2 or about 1.1.
- the values can also define a range of slopes such as about 1.1 to about 5.
- the conditions for operating a chromatographic separation system wherein the temperature variation is minimized can include selection of conditions, e.g., initial, final or both, corresponding to a region of the P-T diagram having one or more isopycnic curves having an absolute slope of about 1.
- the condition for operating a chromatographic separation system wherein the temperature variation is minimized can include selection of conditions, e.g., initial, final or both, corresponding to a region of one or more P-T diagrams having one or more isenthalpic and/or one or more isopycnic curves having an absolute slope for each as defined herein.
- FIG. 21 shows a pressure-temperature phase diagram having isopycnic curves for a mobile phase having the composition of 90% CO 2 and 10% methanol (90/10 CO 2 /methanol).
- the shaded region A is an area of the diagram where the mobile phase density does not vary significantly as a result of a pressure change.
- the shaded region B is an area of the diagram where the mobile phase density does vary significantly as a result of a pressure change.
- FIG. 22 shows a set of pressure-temperature phase diagrams having isopycnic curves for a mobile phase having the composition of 80% CO 2 and 20% methanol (80/20 CO 2 /methanol) and a mobile phase having the composition of 70% CO 2 and 30% methanol (70/30 CO 2 /methanol).
- the shaded regions A are areas of the diagrams where the mobile phase density does not vary significantly as a result of a pressure change.
- the shaded regions B are areas of the diagrams where the mobile phase density does vary significantly as a result of a pressure change.
- the present disclosure relates to a method of developing a chromatographic separation process, the method including selecting a column and a mobile phase composition; providing a pressure-temperature (P-T) phase diagram of the mobile phase, wherein the phase diagram comprises isopycnic curves of the mobile phase and the pressure values range from at least 1000 to at least 6000 psi and the temperature values range from at least 0° C. to at least 200° C.; and (c) operating the chromatographic separation process in a region in the diagram where the mobile phase has a delta density/delta pressure value less than about 80% of the diagram.
- P-T pressure-temperature
- the present disclosure is applicable to systems having pressures of about 100 psi, 200, 300, 400, 500, 600, 700, 800, 900, 1000, 1500, 2000, 2500, 3000, 3500, 4000, 4500, 5000, 5500, 6000, 7000, 8000, 9000 or about 10,000 psi. These values can be used to define a range, such as from about 1000 to about 6000 psi. These values can also be used to define the bounds of the P-T diagrams used to describe the mobile phase properties.
- the present disclosure is applicable to systems having temperatures of about 0° C., 10, 20, 30, 40, 50, 60, 70, 80, 90, 100, 110, 120, 130, 140, 150, 160, 170, 180, 190, or about 200° C. These values can be used to define a range, such as from about 0° C. and about 200° C. These values can also be used to define the bounds of the P-T diagrams used to describe the mobile phase properties. In particular, the diagram can display mobile phase properties for pressures ranging from 1000 psi to 5000 psi, and for temperatures ranging from 0° C. and about 180° C. The pressure and temperature values disclosed herein can be used to describe the diagram display of mobile phase properties.
- the chromatographic separation process can operate in a region in the diagram where the mobile phase has a delta density/delta pressure value is less than about 50%, 55%, 60%, 65%, 70%, 75%, 80%, 85%, 90%, 95% or 100% of the diagram. These values can be used to define a range, such as from about 80% to about 90%. In particular, the process can be operated in a region where the mobile phase is in a supercritical or near supercritical state.
- a improved chromatographic separation is developed using the methodology of the present disclosure.
- the following chromatographic system is used: an analytical scale carbon dioxide based chromatography instrument using a BEH 2-EP column (2.1 ⁇ 150 mm, 1.7 ⁇ m particle size), available at Waters Technologies Corporation (Milford, Mass.).
- the separation is isocratic using a carbon dioxide mobile phase with 5% (v/v) methanol modifier and performed at a flow rate of 2.0 mL/min.
- the temperature and the pressure can range from 0 to 200° C., and 1000 to 6000 psi.
- the initial set of mobile phase conditions for temperature and pressure is selected as 70° C. and having an ABPR (Automated Back Pressure Regulator) pressure of 2000 psi.
- the final temperature is estimated to be about 65° C.
- the possible temperature variation inside the column at 70° C. and 2000 psi ABPR pressure is non-negligible. Under these experimental conditions, thermal heterogeneity occurs inside the column and efficiency is lower than it could have been.
- the test solution components are separated and exhibit a first set of performance characteristics (e.g., efficiency, E1, resolution, R1, etc.).
- a second set of initial mobile phase conditions for temperature and pressure is selected as 30° C. and having an ABPR (Automated Back Pressure Regulator) pressure of 1600 psi.
- the mobile phase composition is unchanged.
- the final temperature is estimated to be about 25° C.
- the possible temperature variation inside the column at 30° C. and 1600 psi ABPR pressure is negligible. Under these experimental conditions, thermal heterogeneity is minimized or non-existent inside the column and efficiency is maintained.
- the test solution components are separated and exhibit a second set of performance characteristics (e.g., efficiency, E2, resolution, R2, etc.). Both the efficiency and the resolution are at least about 10% improved.
Landscapes
- Physics & Mathematics (AREA)
- Health & Medical Sciences (AREA)
- Life Sciences & Earth Sciences (AREA)
- Chemical & Material Sciences (AREA)
- Analytical Chemistry (AREA)
- Biochemistry (AREA)
- General Health & Medical Sciences (AREA)
- General Physics & Mathematics (AREA)
- Immunology (AREA)
- Pathology (AREA)
- Treatment Of Liquids With Adsorbents In General (AREA)
Abstract
Description
Claims (12)
Priority Applications (1)
| Application Number | Priority Date | Filing Date | Title |
|---|---|---|---|
| US15/310,539 US10578592B2 (en) | 2014-05-12 | 2015-05-12 | Method for estimating temperature variation in chromatography using thermodynamic plots and uses thereof |
Applications Claiming Priority (4)
| Application Number | Priority Date | Filing Date | Title |
|---|---|---|---|
| US201461992061P | 2014-05-12 | 2014-05-12 | |
| US201461992016P | 2014-05-12 | 2014-05-12 | |
| US15/310,539 US10578592B2 (en) | 2014-05-12 | 2015-05-12 | Method for estimating temperature variation in chromatography using thermodynamic plots and uses thereof |
| PCT/US2015/030244 WO2015175447A1 (en) | 2014-05-12 | 2015-05-12 | Method for estimating temperature variation in chromatography using thermodynamic plots and uses thereof |
Publications (2)
| Publication Number | Publication Date |
|---|---|
| US20170082583A1 US20170082583A1 (en) | 2017-03-23 |
| US10578592B2 true US10578592B2 (en) | 2020-03-03 |
Family
ID=54480511
Family Applications (1)
| Application Number | Title | Priority Date | Filing Date |
|---|---|---|---|
| US15/310,539 Expired - Fee Related US10578592B2 (en) | 2014-05-12 | 2015-05-12 | Method for estimating temperature variation in chromatography using thermodynamic plots and uses thereof |
Country Status (2)
| Country | Link |
|---|---|
| US (1) | US10578592B2 (en) |
| WO (1) | WO2015175447A1 (en) |
Families Citing this family (3)
| Publication number | Priority date | Publication date | Assignee | Title |
|---|---|---|---|---|
| DE102014004286B3 (en) * | 2014-03-26 | 2015-04-16 | Peter Boeker | Flow field induced temperature gradient gas chromatography |
| JP7147255B2 (en) * | 2018-05-11 | 2022-10-05 | トヨタ自動車株式会社 | image display device |
| JP7073991B2 (en) | 2018-09-05 | 2022-05-24 | トヨタ自動車株式会社 | Peripheral display device for vehicles |
Citations (2)
| Publication number | Priority date | Publication date | Assignee | Title |
|---|---|---|---|---|
| US20090320660A1 (en) | 2006-08-09 | 2009-12-31 | Michael Gwosdz-Kaupmann | Method for producing at least one window opening in an elongate paper substrate, and apparatus |
| WO2014008058A1 (en) | 2012-07-06 | 2014-01-09 | Waters Technologies Corporation | Techniques for thermally insulating a liquid chromatographic column |
Family Cites Families (1)
| Publication number | Priority date | Publication date | Assignee | Title |
|---|---|---|---|---|
| US8226825B2 (en) * | 2009-04-09 | 2012-07-24 | The United States of America, as represented by the Sectretary of Commerce, The National Institute of Standards and Technology | Recirculating temperature wave focusing chromatography |
-
2015
- 2015-05-12 US US15/310,539 patent/US10578592B2/en not_active Expired - Fee Related
- 2015-05-12 WO PCT/US2015/030244 patent/WO2015175447A1/en not_active Ceased
Patent Citations (2)
| Publication number | Priority date | Publication date | Assignee | Title |
|---|---|---|---|---|
| US20090320660A1 (en) | 2006-08-09 | 2009-12-31 | Michael Gwosdz-Kaupmann | Method for producing at least one window opening in an elongate paper substrate, and apparatus |
| WO2014008058A1 (en) | 2012-07-06 | 2014-01-09 | Waters Technologies Corporation | Techniques for thermally insulating a liquid chromatographic column |
Non-Patent Citations (14)
Also Published As
| Publication number | Publication date |
|---|---|
| US20170082583A1 (en) | 2017-03-23 |
| WO2015175447A1 (en) | 2015-11-19 |
Similar Documents
| Publication | Publication Date | Title |
|---|---|---|
| US11273390B2 (en) | Techniques for thermally insulating a liquid chromatographic column | |
| Tarafder et al. | Use of the isopycnic plots in designing operations of supercritical fluid chromatography: IV. Pressure and density drops along columns | |
| Tarafder et al. | Use of the isopycnic plots in designing operations of supercritical fluid chromatography. V. Pressure and density drops using mixtures of carbon dioxide and methanol as the mobile phase | |
| US11351477B2 (en) | Techniques for accelerating thermal equilibrium in a chromatographic column | |
| De Pauw et al. | Occurrence of turbulent flow conditions in supercritical fluid chromatography | |
| US10578592B2 (en) | Method for estimating temperature variation in chromatography using thermodynamic plots and uses thereof | |
| US9488624B2 (en) | Chromatographic sample for determining equivalent thermal conditions between liquid chromatography systems | |
| Poe et al. | Pressure, temperature and density drops along supercritical fluid chromatography columns in different thermal environments. III. Mixtures of carbon dioxide and methanol as the mobile phase | |
| Delahaye et al. | Application of the isopycnic kinetic plot method for elucidating the potential of sub-2 µm and core–shell particles in SFC | |
| Soliven et al. | Optimization of gradient reversed phase chromatographic peak capacity for low molecular weight solutes | |
| US11565197B2 (en) | Methodology for scaling methods between supercritical fluid chromatography systems | |
| Broeckhoven et al. | Considerations for the use of ultra-high pressures in liquid chromatography for 2.1 mm inner diameter columns | |
| Miyamoto et al. | Measurement of the vapor–liquid equilibrium properties of the binary low GWP refrigerant R32/R1123 | |
| Tarafder et al. | Estimations of temperature deviations in chromatographic columns using isenthalpic plots. I. Theory for isocratic systems | |
| Gritti et al. | Realization and potential advantages of gradient separations performed under steady state temperature regime | |
| Leśko et al. | Modelling of retention in analytical supercritical fluid chromatography for CO2—Methanol mobile phase | |
| Poe | Theory of supercritical fluid chromatography | |
| US11020687B2 (en) | Methods for scaling between chromatographic systems using highly compressible fluids | |
| Grinias et al. | Repeatability of gradient ultrahigh pressure liquid chromatography–tandem mass spectrometry methods in instrument-controlled thermal environments | |
| Gritti et al. | Bridging the gap between gas and liquid chromatography | |
| Helmueller et al. | Adiabatic packed column supercritical fluid chromatography using a dual-zone still-air column heater | |
| Vezzani et al. | Prediction of retention times in linear gradient temperature and pressure programmed analysis on capillary columns | |
| van Niekerk Fourie et al. | CO2+ 3, 7-dimethyl-1-octanol+ 1-decanol: High pressure experimental phase equilibria data and thermodynamic modelling | |
| US10996204B2 (en) | Method and apparatus for scaling between chromatographic systems using highly compressible fluids | |
| Tarafder | Theory of supercritical fluid chromatography |
Legal Events
| Date | Code | Title | Description |
|---|---|---|---|
| AS | Assignment |
Owner name: WATERS TECHNOLOGIES CORPORATION, MASSACHUSETTS Free format text: ASSIGNMENT OF ASSIGNORS INTEREST;ASSIGNOR:TARAFDER, ABHIJIT;REEL/FRAME:042318/0192 Effective date: 20170426 |
|
| STPP | Information on status: patent application and granting procedure in general |
Free format text: RESPONSE TO NON-FINAL OFFICE ACTION ENTERED AND FORWARDED TO EXAMINER |
|
| STPP | Information on status: patent application and granting procedure in general |
Free format text: NON FINAL ACTION MAILED |
|
| STPP | Information on status: patent application and granting procedure in general |
Free format text: RESPONSE TO NON-FINAL OFFICE ACTION ENTERED AND FORWARDED TO EXAMINER |
|
| STPP | Information on status: patent application and granting procedure in general |
Free format text: NOTICE OF ALLOWANCE MAILED -- APPLICATION RECEIVED IN OFFICE OF PUBLICATIONS |
|
| ZAAA | Notice of allowance and fees due |
Free format text: ORIGINAL CODE: NOA |
|
| ZAAB | Notice of allowance mailed |
Free format text: ORIGINAL CODE: MN/=. |
|
| STPP | Information on status: patent application and granting procedure in general |
Free format text: AWAITING TC RESP., ISSUE FEE NOT PAID |
|
| STPP | Information on status: patent application and granting procedure in general |
Free format text: NOTICE OF ALLOWANCE MAILED -- APPLICATION RECEIVED IN OFFICE OF PUBLICATIONS |
|
| ZAAA | Notice of allowance and fees due |
Free format text: ORIGINAL CODE: NOA |
|
| STPP | Information on status: patent application and granting procedure in general |
Free format text: PUBLICATIONS -- ISSUE FEE PAYMENT RECEIVED |
|
| STCF | Information on status: patent grant |
Free format text: PATENTED CASE |
|
| FEPP | Fee payment procedure |
Free format text: MAINTENANCE FEE REMINDER MAILED (ORIGINAL EVENT CODE: REM.); ENTITY STATUS OF PATENT OWNER: LARGE ENTITY |
|
| LAPS | Lapse for failure to pay maintenance fees |
Free format text: PATENT EXPIRED FOR FAILURE TO PAY MAINTENANCE FEES (ORIGINAL EVENT CODE: EXP.); ENTITY STATUS OF PATENT OWNER: LARGE ENTITY |
|
| STCH | Information on status: patent discontinuation |
Free format text: PATENT EXPIRED DUE TO NONPAYMENT OF MAINTENANCE FEES UNDER 37 CFR 1.362 |
|
| FP | Lapsed due to failure to pay maintenance fee |
Effective date: 20240303 |