US10565220B2 - Generating visualizations for search results data containing multiple data dimensions - Google Patents
Generating visualizations for search results data containing multiple data dimensions Download PDFInfo
- Publication number
- US10565220B2 US10565220B2 US15/421,408 US201715421408A US10565220B2 US 10565220 B2 US10565220 B2 US 10565220B2 US 201715421408 A US201715421408 A US 201715421408A US 10565220 B2 US10565220 B2 US 10565220B2
- Authority
- US
- United States
- Prior art keywords
- data
- visualization
- field
- results
- query
- Prior art date
- Legal status (The legal status is an assumption and is not a legal conclusion. Google has not performed a legal analysis and makes no representation as to the accuracy of the status listed.)
- Active, expires
Links
Images


Classifications
-
- G—PHYSICS
- G06—COMPUTING; CALCULATING OR COUNTING
- G06F—ELECTRIC DIGITAL DATA PROCESSING
- G06F16/00—Information retrieval; Database structures therefor; File system structures therefor
- G06F16/20—Information retrieval; Database structures therefor; File system structures therefor of structured data, e.g. relational data
- G06F16/24—Querying
- G06F16/248—Presentation of query results
-
- G—PHYSICS
- G06—COMPUTING; CALCULATING OR COUNTING
- G06F—ELECTRIC DIGITAL DATA PROCESSING
- G06F16/00—Information retrieval; Database structures therefor; File system structures therefor
- G06F16/20—Information retrieval; Database structures therefor; File system structures therefor of structured data, e.g. relational data
- G06F16/24—Querying
- G06F16/245—Query processing
- G06F16/2458—Special types of queries, e.g. statistical queries, fuzzy queries or distributed queries
- G06F16/2477—Temporal data queries
Definitions
- Data analysis systems typically provide various types of graphical interfaces and visualizations used to display data identified based on execution of search queries. Using these interfaces, for example, a user typically can create search queries including various functions, arguments, and clauses to identify data of interest to the user. As one example, a sales manager might create and execute a query to search a sales information database for data corresponding to product sales within the past year. Based on execution of the query, a data analysis system might generate a graphical interface visualizing the results data using a bar chart, pie chart, or other type of visualization.
- Some data analysis systems further enable users to “split” search results data by specifying in a query one or more fields upon which to split the data. For example, referring again to the example of a query searching a sales information database, a user might create a query to search for data relating to product sales in the past year. Each entry in the database might contain various fields including a type of product sold, a region where the corresponding sale took place, and a dollar amount associated with the sale. In this example, a user might desire to split the sales data by region so that the user can compare a total sales amount across various regions.
- a resulting visualization may display a bar chart, for example, with one axis of the chart corresponding to the various regions, and a second axis of the chart corresponding to a range of total sales amounts. In this manner, the user can compare a relative height of each bar in the chart to compare an amount of total sales occurring in each region.
- FIG. 1 illustrates a networked computer environment in which an embodiment may be implemented
- FIG. 2 illustrates a block diagram of an example data intake and query system in which an embodiment may be implemented
- FIG. 3 is a flow diagram that illustrates how indexers process, index, and store data received from forwarders in accordance with the disclosed embodiments
- FIG. 4 is a flow diagram that illustrates how a search head and indexers perform a search query in accordance with the disclosed embodiments
- FIG. 5 illustrates a scenario where a common customer ID is found among log data received from three disparate sources in accordance with the disclosed embodiments
- FIG. 6A illustrates a search screen in accordance with the disclosed embodiments
- FIG. 6B illustrates a data summary dialog that enables a user to select various data sources in accordance with the disclosed embodiments
- FIGS. 7A-7D illustrate a series of user interface screens for an example data model-driven report generation interface in accordance with the disclosed embodiments
- FIG. 8 illustrates an example search query received from a client and executed by search peers in accordance with the disclosed embodiments
- FIG. 9A illustrates a key indicators view in accordance with the disclosed embodiments.
- FIG. 9B illustrates an incident review dashboard in accordance with the disclosed embodiments
- FIG. 9C illustrates a proactive monitoring tree in accordance with the disclosed embodiments.
- FIG. 9D illustrates a user interface screen displaying both log data and performance data in accordance with the disclosed embodiments
- FIG. 10 illustrates a block diagram of an example cloud-based data intake and query system in which an embodiment may be implemented
- FIG. 11 illustrates a block diagram of an example data intake and query system that performs searches across external data systems in accordance with the disclosed embodiments
- FIGS. 12-14 illustrate a series of user interface screens for an example data model-driven report generation interface in accordance with the disclosed embodiments
- FIGS. 15-17 illustrate example visualizations generated by a reporting application in accordance with the disclosed embodiments
- FIG. 18 illustrates an example user interface screen including display of a plurality of search results visualizations based on a selected facet dimension in accordance with the disclosed embodiments
- FIG. 19 is a flow diagram illustrating an example process for generating and displaying faceted visualizations in accordance with the disclosed embodiments
- FIGS. 20A-20D illustrate example user interface screens displaying faceted visualizations according to various display options in accordance with the disclosed embodiments.
- FIG. 21 illustrates a computer system upon which an embodiment may be implemented.
- Modern data centers and other computing environments can comprise anywhere from a few host computer systems to thousands of systems configured to process data, service requests from remote clients, and perform numerous other computational tasks.
- various components within these computing environments often generate significant volumes of machine-generated data.
- machine data is generated by various components in the information technology (IT) environments, such as servers, sensors, routers, mobile devices, Internet of Things (IoT) devices, etc.
- Machine-generated data can include system logs, network packet data, sensor data, application program data, error logs, stack traces, system performance data, etc.
- machine-generated data can also include performance data, diagnostic information, and many other types of data that can be analyzed to diagnose performance problems, monitor user interactions, and to derive other insights.
- a number of tools are available to analyze machine data, that is, machine-generated data.
- many of these tools typically pre-process the data based on anticipated data analysis needs. For example, pre-specified data items may be extracted from the machine data and stored in a database to facilitate efficient retrieval and analysis of those data items at search time.
- pre-specified data items may be extracted from the machine data and stored in a database to facilitate efficient retrieval and analysis of those data items at search time.
- the rest of the machine data typically is not saved and discarded during pre-processing. As storage capacity becomes progressively cheaper and more plentiful, there are fewer incentives to discard these portions of machine data and many reasons to retain more of the data.
- a data center, servers, or network appliances may generate many different types and formats of machine data (e.g., system logs, network packet data (e.g., wire data, etc.), sensor data, application program data, error logs, stack traces, system performance data, operating system data, virtualization data, etc.) from thousands of different components, which can collectively be very time-consuming to analyze.
- machine data e.g., system logs, network packet data (e.g., wire data, etc.), sensor data, application program data, error logs, stack traces, system performance data, operating system data, virtualization data, etc.
- mobile devices may generate large amounts of information relating to data accesses, application performance, operating system performance, network performance, etc. There can be millions of mobile devices that report these types of information.
- the SPLUNK® ENTERPRISE system is the leading platform for providing real-time operational intelligence that enables organizations to collect, index, and search machine-generated data from various websites, applications, servers, networks, and mobile devices that power their businesses.
- the SPLUNK® ENTERPRISE system is particularly useful for analyzing data which is commonly found in system log files, network data, and other data input sources.
- events In the SPLUNK® ENTERPRISE system, machine-generated data are collected and stored as “events”.
- An event comprises a portion of the machine-generated data and is associated with a specific point in time.
- events may be derived from “time series data,” where the time series data comprises a sequence of data points (e.g., performance measurements from a computer system, etc.) that are associated with successive points in time.
- time series data comprises a sequence of data points (e.g., performance measurements from a computer system, etc.) that are associated with successive points in time.
- each event can be associated with a timestamp that is derived from the raw data in the event, determined through interpolation between temporally proximate events having known timestamps, or determined based on other configurable rules for associating timestamps with events, etc.
- machine data can have a predefined format, where data items with specific data formats are stored at predefined locations in the data.
- the machine data may include data stored as fields in a database table.
- machine data may not have a predefined format, that is, the data is not at fixed, predefined locations, but the data does have repeatable patterns and is not random. This means that some machine data can comprise various data items of different data types and that may be stored at different locations within the data.
- an event can include one or more lines from the operating system log containing raw data that includes different types of performance and diagnostic information associated with a specific point in time.
- components which may generate machine data from which events can be derived include, but are not limited to, web servers, application servers, databases, firewalls, routers, operating systems, and software applications that execute on computer systems, mobile devices, sensors, Internet of Things (IoT) devices, etc.
- the data generated by such data sources can include, for example and without limitation, server log files, activity log files, configuration files, messages, network packet data, performance measurements, sensor measurements, etc.
- the SPLUNK® ENTERPRISE system uses flexible schema to specify how to extract information from the event data.
- a flexible schema may be developed and redefined as needed. Note that a flexible schema may be applied to event data “on the fly,” when it is needed (e.g., at search time, index time, ingestion time, etc.). When the schema is not applied to event data until search time it may be referred to as a “late-binding schema.”
- the SPLUNK® ENTERPRISE system starts with raw input data (e.g., one or more system logs, streams of network packet data, sensor data, application program data, error logs, stack traces, system performance data, etc.).
- the system divides this raw data into blocks (e.g., buckets of data, each associated with a specific time frame, etc.), and parses the raw data to produce timestamped events.
- the system stores the timestamped events in a data store.
- the system enables users to run queries against the stored data to, for example, retrieve events that meet criteria specified in a query, such as containing certain keywords or having specific values in defined fields.
- event data data that is part of an event is referred to as “event data”.
- the term “field” refers to a location in the event data containing one or more values for a specific data item.
- the fields are defined by extraction rules (e.g., regular expressions) that derive one or more values from the portion of raw machine data in each event that has a particular field specified by an extraction rule.
- the set of values so produced are semantically-related (such as by IP address), even though the raw machine data in each event may be in different formats (e.g., semantically-related values may be in different positions in the events derived from different sources).
- the SPLUNK® ENTERPRISE system utilizes a late-binding schema to event data while performing queries on events.
- One aspect of a late-binding schema is applying “extraction rules” to event data to extract values for specific fields during search time.
- the extraction rules for a field can include one or more instructions that specify how to extract a value for the field from the event data.
- An extraction rule can generally include any type of instruction for extracting values from data in events.
- an extraction rule comprises a regular expression where a sequence of characters form a search pattern, in which case the rule is referred to as a “regex rule.”
- the system applies the regex rule to the event data to extract values for associated fields in the event data by searching the event data for the sequence of characters defined in the regex rule.
- a field extractor may be configured to automatically generate extraction rules for certain field values in the events when the events are being created, indexed, or stored, or possibly at a later time.
- a user may manually define extraction rules for fields using a variety of techniques.
- a late-binding schema is not defined at data ingestion time. Instead, the late-binding schema can be developed on an ongoing basis until the time a query is actually executed. This means that extraction rules for the fields in a query may be provided in the query itself, or may be located during execution of the query.
- the user can continue to refine the late-binding schema by adding new fields, deleting fields, or modifying the field extraction rules for use the next time the schema is used by the system.
- the SPLUNK® ENTERPRISE system maintains the underlying raw data and uses late-binding schema for searching the raw data, it enables a user to continue investigating and learn valuable insights about the raw data.
- a common field name may be used to reference two or more fields containing equivalent data items, even though the fields may be associated with different types of events that possibly have different data formats and different extraction rules.
- CIM common information model
- FIG. 1 illustrates a networked computer system 100 in which an embodiment may be implemented. Those skilled in the art would understand that FIG. 1 represents one example of a networked computer system and other embodiments may use different arrangements.
- the networked computer system 100 comprises one or more computing devices. These one or more computing devices comprise any combination of hardware and software configured to implement the various logical components described herein.
- the one or more computing devices may include one or more memories that store instructions for implementing the various components described herein, one or more hardware processors configured to execute the instructions stored in the one or more memories, and various data repositories in the one or more memories for storing data structures utilized and manipulated by the various components.
- one or more client devices 102 are coupled to one or more host devices 106 and a data intake and query system 108 via one or more networks 104 .
- Networks 104 broadly represent one or more local area networks (LANs), wide area networks (WANs), cellular networks (e.g., Long-Term Evolution (LTE), High Speed Packet Access (HSPA), 3G, and other cellular technologies), and/or networks using any of wired, wireless, terrestrial microwave, or satellite links, and may include the public Internet.
- LANs local area networks
- WANs wide area networks
- cellular networks e.g., Long-Term Evolution (LTE), High Speed Packet Access (HSPA), 3G, and other cellular technologies
- LTE Long-Term Evolution
- HSPA High Speed Packet Access
- 3G 3G
- a system 100 includes one or more host devices 106 .
- Host devices 106 may broadly include any number of computers, virtual machine instances, and/or data centers that are configured to host or execute one or more instances of host applications 114 .
- a host device 106 may be involved, directly or indirectly, in processing requests received from client devices 102 .
- Each host device 106 may comprise, for example, one or more of a network device, a web server, an application server, a database server, etc.
- a collection of host devices 106 may be configured to implement a network-based service.
- a provider of a network-based service may configure one or more host devices 106 and host applications 114 (e.g., one or more web servers, application servers, database servers, etc.) to collectively implement the network-based application.
- client devices 102 communicate with one or more host applications 114 to exchange information.
- the communication between a client device 102 and a host application 114 may, for example, be based on the Hypertext Transfer Protocol (HTTP) or any other network protocol.
- Content delivered from the host application 114 to a client device 102 may include, for example, HyperText Markup Language (HTML) documents, media content, etc.
- the communication between a client device 102 and host application 114 may include sending various requests and receiving data packets.
- a client device 102 or application running on a client device may initiate communication with a host application 114 by making a request for a specific resource (e.g., based on an HTTP request), and the application server may respond with the requested content stored in one or more response packets.
- a specific resource e.g., based on an HTTP request
- one or more of host applications 114 may generate various types of performance data during operation, including event logs, network data, sensor data, and other types of machine-generated data.
- a host application 114 comprising a web server may generate one or more web server logs in which details of interactions between the web server and any number of client devices 102 is recorded.
- a host device 106 comprising a router may generate one or more router logs that record information related to network traffic managed by the router.
- a host application 114 comprising a database server may generate one or more logs that record information related to requests sent from other host applications 114 (e.g., web servers or application servers) for data managed by the database server.
- Client devices 102 of FIG. 1 represent any computing device capable of interacting with one or more host devices 106 via a network 104 .
- client devices 102 may include, without limitation, smart phones, tablet computers, handheld computers, wearable devices, laptop computers, desktop computers, servers, portable media players, gaming devices, and so forth.
- a client device 102 can provide access to different content, for instance, content provided by one or more host devices 106 , etc.
- Each client device 102 may comprise one or more client applications 110 , described in more detail in a separate section hereinafter.
- each client device 102 may host or execute one or more client applications 110 that are capable of interacting with one or more host devices 106 via one or more networks 104 .
- a client application 110 may be or comprise a web browser that a user may use to navigate to one or more websites or other resources provided by one or more host devices 106 .
- a client application 110 may comprise a mobile application or “app.”
- an operator of a network-based service hosted by one or more host devices 106 may make available one or more mobile apps that enable users of client devices 102 to access various resources of the network-based service.
- client applications 110 may include background processes that perform various operations without direct interaction from a user.
- a client application 110 may include a “plug-in” or “extension” to another application, such as a web browser plug-in or extension.
- a client application 110 may include a monitoring component 112 .
- the monitoring component 112 comprises a software component or other logic that facilitates generating performance data related to a client device's operating state, including monitoring network traffic sent and received from the client device and collecting other device and/or application-specific information.
- Monitoring component 112 may be an integrated component of a client application 110 , a plug-in, an extension, or any other type of add-on component. Monitoring component 112 may also be a stand-alone process.
- a monitoring component 112 may be created when a client application 110 is developed, for example, by an application developer using a software development kit (SDK).
- SDK software development kit
- the SDK may include custom monitoring code that can be incorporated into the code implementing a client application 110 .
- the custom code implementing the monitoring functionality can become part of the application itself.
- an SDK or other code for implementing the monitoring functionality may be offered by a provider of a data intake and query system, such as a system 108 .
- the provider of the system 108 can implement the custom code so that performance data generated by the monitoring functionality is sent to the system 108 to facilitate analysis of the performance data by a developer of the client application or other users.
- the custom monitoring code may be incorporated into the code of a client application 110 in a number of different ways, such as the insertion of one or more lines in the client application code that call or otherwise invoke the monitoring component 112 .
- a developer of a client application 110 can add one or more lines of code into the client application 110 to trigger the monitoring component 112 at desired points during execution of the application.
- Code that triggers the monitoring component may be referred to as a monitor trigger.
- a monitor trigger may be included at or near the beginning of the executable code of the client application 110 such that the monitoring component 112 is initiated or triggered as the application is launched, or included at other points in the code that correspond to various actions of the client application, such as sending a network request or displaying a particular interface.
- the monitoring component 112 may monitor one or more aspects of network traffic sent and/or received by a client application 110 .
- the monitoring component 112 may be configured to monitor data packets transmitted to and/or from one or more host applications 114 . Incoming and/or outgoing data packets can be read or examined to identify network data contained within the packets, for example, and other aspects of data packets can be analyzed to determine a number of network performance statistics. Monitoring network traffic may enable information to be gathered particular to the network performance associated with a client application 110 or set of applications.
- network performance data refers to any type of data that indicates information about the network and/or network performance.
- Network performance data may include, for instance, a Uniform Resource Locator (URL) requested, a connection type (e.g., HTTP, HTTP Secure (HTTPS), etc.), a connection start time, a connection end time, an HTTP status code, request length, response length, request headers, response headers, connection status (e.g., completion, response time(s), failure, etc.), and the like.
- the client application 110 can be distributed to client devices 102 .
- Applications generally can be distributed to client devices 102 in any manner, or they can be pre-loaded.
- the application may be distributed to a client device 102 via an application marketplace or other application distribution system.
- an application marketplace or other application distribution system might distribute the application to a client device based on a request from the client device to download the application.
- the monitoring component 112 may also monitor and collect performance data related to one or more aspects of the operational state of a client application 110 and/or client device 102 .
- a monitoring component 112 may be configured to collect device performance information by monitoring one or more client device operations, or by making calls to an operating system and/or one or more other applications executing on a client device 102 for performance information.
- Device performance information may include, for instance, a current wireless signal strength of the device, a current connection type and network carrier, current memory performance information, a geographic location of the device, a device orientation, and any other information related to the operational state of the client device.
- the monitoring component 112 may also monitor and collect other device profile information including, for example, a type of client device, a manufacturer and model of the device, versions of various software applications installed on the device, and so forth.
- a monitoring component 112 may be configured to generate performance data in response to a monitor trigger in the code of a client application 110 or other triggering application event, as described above, and to store the performance data in one or more data records.
- Each data record may include a collection of field-value pairs, each field-value pair storing a particular item of performance data in association with a field for the item.
- a data record generated by a monitoring component 112 may include a “networkLatency” field (not shown in the Figure) in which a value is stored. This field indicates a network latency measurement associated with one or more network requests.
- the data record may include a “state” field to store a value indicating a state of a network connection, and so forth for any number of aspects of collected performance data.
- FIG. 2 depicts a block diagram of an exemplary data intake and query system 108 , similar to the SPLUNK® ENTERPRISE system.
- System 108 includes one or more forwarders 204 that receive data from a variety of input data sources 202 , and one or more indexers 206 that process and store the data in one or more data stores 208 .
- These forwarders and indexers can comprise separate computer systems, or may alternatively comprise separate processes executing on one or more computer systems.
- Each data source 202 broadly represents a distinct source of data that can be consumed by a system 108 .
- Examples of a data source 202 include, without limitation, data files, directories of files, data sent over a network, event logs, registries, etc.
- the forwarders 204 identify which indexers 206 receive data collected from a data source 202 and forward the data to the appropriate indexers. Forwarders 204 can also perform operations on the data before forwarding, including removing extraneous data, detecting timestamps in the data, parsing data, indexing data, routing data based on criteria relating to the data being routed, and/or performing other data transformations.
- a forwarder 204 may comprise a service accessible to client devices 102 and host devices 106 via a network 104 .
- the forwarder 204 may, for example, comprise a computing device which implements multiple data pipelines or “queues” to handle forwarding of network data to indexers 206 .
- a forwarder 204 may also perform many of the functions that are performed by an indexer. For example, a forwarder 204 may perform keyword extractions on raw data or parse raw data to create events. A forwarder 204 may generate time stamps for events.
- a forwarder 204 may perform routing of events to indexers.
- Data store 208 may contain events derived from machine data from a variety of sources all pertaining to the same component in an IT environment, and this data may be produced by the machine in question or by other components in the IT environment.
- FIG. 3 depicts a flow chart illustrating an example data flow performed by data intake and query system 108 , in accordance with the disclosed embodiments.
- the data flow illustrated in FIG. 3 is provided for illustrative purposes only; those skilled in the art would understand that one or more of the steps of the processes illustrated in FIG. 3 may be removed or the ordering of the steps may be changed.
- one or more particular system components are described in the context of performing various operations during each of the data flow stages. For example, a forwarder is described as receiving and processing data during an input phase; an indexer is described as parsing and indexing data during parsing and indexing phases; and a search head is described as performing a search query during a search phase.
- a forwarder is described as receiving and processing data during an input phase
- an indexer is described as parsing and indexing data during parsing and indexing phases
- a search head is described as performing a search query during a search phase.
- other system arrangements and distributions of the processing steps across system components may be used
- a forwarder receives data from an input source, such as a data source 202 shown in FIG. 2 .
- a forwarder initially may receive the data as a raw data stream generated by the input source.
- a forwarder may receive a data stream from a log file generated by an application server, from a stream of network data from a network device, or from any other source of data.
- a forwarder receives the raw data and may segment the data stream into “blocks”, or “buckets,” possibly of a uniform data size, to facilitate subsequent processing steps.
- a forwarder or other system component annotates each block generated from the raw data with one or more metadata fields.
- These metadata fields may, for example, provide information related to the data block as a whole and may apply to each event that is subsequently derived from the data in the data block.
- the metadata fields may include separate fields specifying each of a host, a source, and a source type related to the data block.
- a host field may contain a value identifying a host name or Internet Protocol (IP) address of a device that generated the data.
- IP Internet Protocol
- a source field may contain a value identifying a source of the data, such as a pathname of a file or a protocol and port related to received network data.
- a source type field may contain a value specifying a particular source type label for the data. Additional metadata fields may also be included during the input phase, such as a character encoding of the data, if known, and possibly other values that provide information relevant to later processing steps.
- a forwarder forwards the annotated data blocks to another system component (typically an indexer) for further processing.
- SPLUNK® ENTERPRISE system allows forwarding of data from one SPLUNK® ENTERPRISE instance to another, or even to a third-party system.
- SPLUNK® ENTERPRISE system can employ different types of forwarders in a configuration.
- a forwarder may contain the essential components needed to forward data. It can gather data from a variety of inputs and forward the data to a SPLUNK® ENTERPRISE server for indexing and searching. It also can tag metadata (e.g., source, source type, host, etc.).
- a forwarder has the capabilities of the aforementioned forwarder as well as additional capabilities.
- the forwarder can parse data before forwarding the data (e.g., associate a time stamp with a portion of data and create an event, etc.) and can route data based on criteria such as source or type of event. It can also index data locally while forwarding the data to another indexer.
- an indexer receives data blocks from a forwarder and parses the data to organize the data into events.
- an indexer may determine a source type associated with each data block (e.g., by extracting a source type label from the metadata fields associated with the data block, etc.) and refer to a source type configuration corresponding to the identified source type.
- the source type definition may include one or more properties that indicate to the indexer to automatically determine the boundaries of events within the data. In general, these properties may include regular expression-based rules or delimiter rules where, for example, event boundaries may be indicated by predefined characters or character strings. These predefined characters may include punctuation marks or other special characters including, for example, carriage returns, tabs, spaces, line breaks, etc. If a source type for the data is unknown to the indexer, an indexer may infer a source type for the data by examining the structure of the data. Then, it can apply an inferred source type definition to the data to create the events.
- the indexer determines a timestamp for each event. Similar to the process for creating events, an indexer may again refer to a source type definition associated with the data to locate one or more properties that indicate instructions for determining a timestamp for each event. The properties may, for example, instruct an indexer to extract a time value from a portion of data in the event, to interpolate time values based on timestamps associated with temporally proximate events, to create a timestamp based on a time the event data was received or generated, to use the timestamp of a previous event, or use any other rules for determining timestamps.
- the indexer associates with each event one or more metadata fields including a field containing the timestamp (in some embodiments, a timestamp may be included in the metadata fields) determined for the event.
- metadata fields may include a number of “default fields” that are associated with all events, and may also include one more custom fields as defined by a user.
- the default metadata fields associated with each event may include a host, source, and source type field including or in addition to a field storing the timestamp.
- an indexer may optionally apply one or more transformations to data included in the events created at block 306 .
- transformations can include removing a portion of an event (e.g., a portion used to define event boundaries, extraneous characters from the event, other extraneous text, etc.), masking a portion of an event (e.g., masking a credit card number), removing redundant portions of an event, etc.
- the transformations applied to event data may, for example, be specified in one or more configuration files and referenced by one or more source type definitions.
- an indexer can optionally generate a keyword index to facilitate fast keyword searching for event data.
- the indexer identifies a set of keywords in each event.
- the indexer includes the identified keywords in an index, which associates each stored keyword with reference pointers to events containing that keyword (or to locations within events where that keyword is located, other location identifiers, etc.).
- the indexer can access the keyword index to quickly identify events containing the keyword.
- the keyword index may include entries for name-value pairs found in events, where a name-value pair can include a pair of keywords connected by a symbol, such as an equals sign or colon. This way, events containing these name-value pairs can be quickly located.
- the indexer stores the events with an associated timestamp in a data store 208 .
- Timestamps enable a user to search for events based on a time range.
- the stored events are organized into “buckets,” where each bucket stores events associated with a specific time range based on the timestamps associated with each event. This may not only improve time-based searching, but also allows for events with recent timestamps, which may have a higher likelihood of being accessed, to be stored in a faster memory to facilitate faster retrieval. For example, buckets containing the most recent events can be stored in flash memory rather than on a hard disk.
- Each indexer 206 may be responsible for storing and searching a subset of the events contained in a corresponding data store 208 .
- the indexers can analyze events for a query in parallel. For example, using map-reduce techniques, each indexer returns partial responses for a subset of events to a search head that combines the results to produce an answer for the query.
- an indexer may further optimize data retrieval process by searching buckets corresponding to time ranges that are relevant to a query.
- events and buckets can also be replicated across different indexers and data stores to facilitate high availability and disaster recovery as described in U.S. patent application Ser. No. 14/266,812, entitled “SITE-BASED SEARCH AFFINITY”, filed on 30 Apr. 2014, and in U.S. patent application Ser. No. 14/266,817, entitled “MULTI-SITE CLUSTERING” also filed on 30 Apr. 2014, each of which is hereby incorporated by reference in its entirety for all purposes.
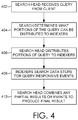
- FIG. 4 is a flow diagram that illustrates an exemplary process that a search head and one or more indexers may perform during a search query.
- a search head receives a search query from a client.
- the search head analyzes the search query to determine what portion(s) of the query can be delegated to indexers and what portions of the query can be executed locally by the search head.
- the search head distributes the determined portions of the query to the appropriate indexers.
- a search head cluster may take the place of an independent search head where each search head in the search head cluster coordinates with peer search heads in the search head cluster to schedule jobs, replicate search results, update configurations, fulfill search requests, etc.
- the search head (or each search head) communicates with a master node (also known as a cluster master, not shown in FIG. 4 ) that provides the search head with a list of indexers to which the search head can distribute the determined portions of the query.
- the master node maintains a list of active indexers and can also designate which indexers may have responsibility for responding to queries over certain sets of events.
- a search head may communicate with the master node before the search head distributes queries to indexers to discover the addresses of active indexers.
- the indexers to which the query was distributed search data stores associated with them for events that are responsive to the query.
- the indexer searches for events that match the criteria specified in the query. These criteria can include matching keywords or specific values for certain fields.
- the searching operations at block 408 may use the late-binding schema to extract values for specified fields from events at the time the query is processed. In an embodiment, one or more rules for extracting field values may be specified as part of a source type definition.
- the indexers may then either send the relevant events back to the search head, or use the events to determine a partial result, and send the partial result back to the search head.
- the search head combines the partial results and/or events received from the indexers to produce a final result for the query.
- This final result may comprise different types of data depending on what the query requested.
- the results can include a listing of matching events returned by the query, or some type of visualization of the data from the returned events.
- the final result can include one or more calculated values derived from the matching events.
- the results generated by the system 108 can be returned to a client using different techniques. For example, one technique streams results or relevant events back to a client in real-time as they are identified. Another technique waits to report the results to the client until a complete set of results (which may include a set of relevant events or a result based on relevant events) is ready to return to the client. Yet another technique streams interim results or relevant events back to the client in real-time until a complete set of results is ready, and then returns the complete set of results to the client. In another technique, certain results are stored as “search jobs” and the client may retrieve the results by referring the search jobs.
- the search head can also perform various operations to make the search more efficient. For example, before the search head begins execution of a query, the search head can determine a time range for the query and a set of common keywords that all matching events include. The search head may then use these parameters to query the indexers to obtain a superset of the eventual results. Then, during a filtering stage, the search head can perform field-extraction operations on the superset to produce a reduced set of search results. This speeds up queries that are performed on a periodic basis.
- the search head 210 allows users to search and visualize event data extracted from raw machine data received from homogenous data sources. It also allows users to search and visualize event data extracted from raw machine data received from heterogeneous data sources.
- the search head 210 includes various mechanisms, which may additionally reside in an indexer 206 , for processing a query.
- Splunk Processing Language (SPL), used in conjunction with the SPLUNK® ENTERPRISE system, can be utilized to make a query.
- SPL is a pipelined search language in which a set of inputs is operated on by a first command in a command line, and then a subsequent command following the pipe symbol “
- Other query languages such as the Structured Query Language (“SQL”), can be used to create a query.
- SQL Structured Query Language
- search head 210 uses extraction rules to extract values for the fields associated with a field or fields in the event data being searched.
- the search head 210 obtains extraction rules that specify how to extract a value for certain fields from an event.
- Extraction rules can comprise regex rules that specify how to extract values for the relevant fields.
- the extraction rules may also include instructions for deriving a field value by performing a function on a character string or value retrieved by the extraction rule. For example, a transformation rule may truncate a character string, or convert the character string into a different data format.
- the query itself can specify one or more extraction rules.
- the search head 210 can apply the extraction rules to event data that it receives from indexers 206 .
- Indexers 206 may apply the extraction rules to events in an associated data store 208 .
- Extraction rules can be applied to all the events in a data store, or to a subset of the events that have been filtered based on some criteria (e.g., event time stamp values, etc.).
- Extraction rules can be used to extract one or more values for a field from events by parsing the event data and examining the event data for one or more patterns of characters, numbers, delimiters, etc., that indicate where the field begins and, optionally, ends.
- FIG. 5 illustrates an example of raw machine data received from disparate data sources.
- a user submits an order for merchandise using a vendor's shopping application 501 running on the user's system.
- the order was not delivered to the vendor's server due to a resource exception at the destination server that is detected by the middleware code 502 .
- the user then sends a message to the customer support server 503 to complain about the order failing to complete.
- the three systems 501 , 502 , and 503 are disparate systems that do not have a common logging format.
- the order application 501 sends log data 504 to the SPLUNK® ENTERPRISE system in one format
- the middleware code 502 sends error log data 505 in a second format
- the support server 503 sends log data 506 in a third format.
- the search head 210 allows the vendor's administrator to search the log data from the three systems that one or more indexers 206 are responsible for searching, thereby obtaining correlated information, such as the order number and corresponding customer ID number of the person placing the order.
- the system also allows the administrator to see a visualization of related events via a user interface. The administrator can query the search head 210 for customer ID field value matches across the log data from the three systems that are stored at the one or more indexers 206 .
- the customer ID field value exists in the data gathered from the three systems, but the customer ID field value may be located in different areas of the data given differences in the architecture of the systems—there is a semantic relationship between the customer ID field values generated by the three systems.
- the search head 210 requests event data from the one or more indexers 206 to gather relevant event data from the three systems. It then applies extraction rules to the event data in order to extract field values that it can correlate.
- the search head may apply a different extraction rule to each set of events from each system when the event data format differs among systems.
- the user interface can display to the administrator the event data corresponding to the common customer ID field values 507 , 508 , and 509 , thereby providing the administrator with insight into a customer's experience.
- query results can be returned to a client, a search head, or any other system component for further processing.
- query results may include a set of one or more events, a set of one or more values obtained from the events, a subset of the values, statistics calculated based on the values, a report containing the values, or a visualization, such as a graph or chart, generated from the values.
- FIG. 6A illustrates an example search screen 600 in accordance with the disclosed embodiments.
- Search screen 600 includes a search bar 602 that accepts user input in the form of a search string. It also includes a time range picker 612 that enables the user to specify a time range for the search. For “historical searches” the user can select a specific time range, or alternatively a relative time range, such as “today,” “yesterday” or “last week.” For “real-time searches,” the user can select the size of a preceding time window to search for real-time events. Search screen 600 also initially displays a “data summary” dialog as is illustrated in FIG. 6B that enables the user to select different sources for the event data, such as by selecting specific hosts and log files.
- search screen 600 in FIG. 6A can display the results through search results tabs 604 , wherein search results tabs 604 includes: an “events tab” that displays various information about events returned by the search; a “statistics tab” that displays statistics about the search results; and a “visualization tab” that displays various visualizations of the search results.
- the events tab illustrated in FIG. 6A displays a timeline graph 605 that graphically illustrates the number of events that occurred in one-hour intervals over the selected time range. It also displays an events list 608 that enables a user to view the raw data in each of the returned events. It additionally displays a fields sidebar 606 that includes statistics about occurrences of specific fields in the returned events, including “selected fields” that are pre-selected by the user, and “interesting fields” that are automatically selected by the system based on pre-specified criteria.
- a data model is a hierarchically structured search-time mapping of semantic knowledge about one or more datasets. It encodes the domain knowledge necessary to build a variety of specialized searches of those datasets. Those searches, in turn, can be used to generate reports.
- a data model is composed of one or more “objects” (or “data model objects”) that define or otherwise correspond to a specific set of data.
- Objects in data models can be arranged hierarchically in parent/child relationships. Each child object represents a subset of the dataset covered by its parent object.
- the top-level objects in data models are collectively referred to as “root objects.”
- Child objects have inheritance. Data model objects are defined by characteristics that mostly break down into constraints and attributes. Child objects inherit constraints and attributes from their parent objects and have additional constraints and attributes of their own. Child objects provide a way of filtering events from parent objects. Because a child object always provides an additional constraint in addition to the constraints it has inherited from its parent object, the dataset it represents is always a subset of the dataset that its parent represents.
- a first data model object may define a broad set of data pertaining to e-mail activity generally, and another data model object may define specific datasets within the broad dataset, such as a subset of the e-mail data pertaining specifically to e-mails sent.
- data models can include electronic mail, authentication, databases, intrusion detection, malware, application state, alerts, compute inventory, network sessions, network traffic, performance, audits, updates, vulnerabilities, etc.
- Data models and their objects can be designed by knowledge managers in an organization, and they can enable downstream users to quickly focus on a specific set of data.
- a user can simply select an “e-mail activity” data model object to access a dataset relating to e-mails generally (e.g., sent or received), or select an “e-mails sent” data model object (or data sub-model object) to access a dataset relating to e-mails sent.
- a data model object may be defined by (1) a set of search constraints, and (2) a set of fields.
- a data model object can be used to quickly search data to identify a set of events and to identify a set of fields to be associated with the set of events.
- an “e-mails sent” data model object may specify a search for events relating to e-mails that have been sent, and specify a set of fields that are associated with the events.
- a user can retrieve and use the “e-mails sent” data model object to quickly search source data for events relating to sent e-mails, and may be provided with a listing of the set of fields relevant to the events in a user interface screen.
- a child of the parent data model may be defined by a search (typically a narrower search) that produces a subset of the events that would be produced by the parent data model's search.
- the child's set of fields can include a subset of the set of fields of the parent data model and/or additional fields.
- Data model objects that reference the subsets can be arranged in a hierarchical manner, so that child subsets of events are proper subsets of their parents.
- a user iteratively applies a model development tool (not shown in Fig.) to prepare a query that defines a subset of events and assigns an object name to that subset.
- a child subset is created by further limiting a query that generated a parent subset.
- a late-binding schema of field extraction rules is associated with each object or subset in the data model.
- Data definitions in associated schemas can be taken from the common information model (CIM) or can be devised for a particular schema and optionally added to the CIM.
- Child objects inherit fields from parents and can include fields not present in parents.
- a model developer can select fewer extraction rules than are available for the sources returned by the query that defines events belonging to a model. Selecting a limited set of extraction rules can be a tool for simplifying and focusing the data model, while allowing a user flexibility to explore the data subset.
- Development of a data model is further explained in U.S. Pat. Nos. 8,788,525 and 8,788,526, both entitled “DATA MODEL FOR MACHINE DATA FOR SEMANTIC SEARCH”, both issued on 22 Jul. 2014, U.S. Pat. No.
- a data model can also include reports.
- One or more report formats can be associated with a particular data model and be made available to run against the data model.
- a user can use child objects to design reports with object datasets that already have extraneous data pre-filtered out.
- the data intake and query system 108 provides the user with the ability to produce reports (e.g., a table, chart, visualization, etc.) without having to enter SPL, SQL, or other query language terms into a search screen.
- Data models are used as the basis for the search feature.
- Data models may be selected in a report generation interface.
- the report generator supports drag-and-drop organization of fields to be summarized in a report. When a model is selected, the fields with available extraction rules are made available for use in the report.
- the user may refine and/or filter search results to produce more precise reports.
- the user may select some fields for organizing the report and select other fields for providing detail according to the report organization. For example, “region” and “salesperson” are fields used for organizing the report and sales data can be summarized (subtotaled and totaled) within this organization.
- the report generator allows the user to specify one or more fields within events and apply statistical analysis on values extracted from the specified one or more fields.
- the report generator may aggregate search results across sets of events and generate statistics based on aggregated search results.
- FIGS. 12, 13, and 7A-7D illustrate a series of user interface screens where a user may select report generation options using data models.
- the report generation process may be driven by a predefined data model object, such as a data model object defined and/or saved via a reporting application or a data model object obtained from another source.
- a user can load a saved data model object using a report editor.
- the initial search query and fields used to drive the report editor may be obtained from a data model object.
- the data model object that is used to drive a report generation process may define a search and a set of fields.
- the report generation process may enable a user to use the fields (e.g., the fields defined by the data model object) to define criteria for a report (e.g., filters, split rows/columns, aggregates, etc.) and the search may be used to identify events (e.g., to identify events responsive to the search) used to generate the report. That is, for example, if a data model object is selected to drive a report editor, the graphical user interface of the report editor may enable a user to define reporting criteria for the report using the fields associated with the selected data model object, and the events used to generate the report may be constrained to the events that match, or otherwise satisfy, the search constraints of the selected data model object.
- the fields e.g., the fields defined by the data model object
- criteria for a report e.g., filters, split rows/columns, aggregates, etc.
- the search may be used to identify events (e.g., to identify events responsive to the search) used to generate the report. That is, for example,
- FIG. 12 illustrates an example interactive data model selection graphical user interface 1200 of a report editor that displays a listing of available data models 1201 . The user may select one of the data models 1202 .
- FIG. 13 illustrates an example data model object selection graphical user interface 1300 that displays available data objects 1301 for the selected data object model 1202 .
- the user may select one of the displayed data model objects 1302 for use in driving the report generation process.
- a user interface screen 700 shown in FIG. 7A may display an interactive listing of automatic field identification options 701 based on the selected data model object. For example, a user may select one of the three illustrated options (e.g., the “All Fields” option 702 , the “Selected Fields” option 703 , or the “Coverage” option (e.g., fields with at least a specified % of coverage) 704 ). If the user selects the “All Fields” option 702 , all of the fields identified from the events that were returned in response to an initial search query may be selected. That is, for example, all of the fields of the identified data model object fields may be selected.
- the “All Fields” option 702 all of the fields identified from the events that were returned in response to an initial search query may be selected. That is, for example, all of the fields of the identified data model object fields may be selected.
- the “Selected Fields” option 703 only the fields from the fields of the identified data model object fields that are selected by the user may be used. If the user selects the “Coverage” option 704 , only the fields of the identified data model object fields meeting a specified coverage criteria may be selected. A percent coverage may refer to the percentage of events returned by the initial search query that a given field appears in. Thus, for example, if an object dataset includes 10,000 events returned in response to an initial search query, and the “avg_age” field appears in 854 of those 10,000 events, then the “avg_age” field would have a coverage of 8.54% for that object dataset.
- the user selects the “Coverage” option and specifies a coverage value of 2%
- only fields having a coverage value equal to or greater than 2% may be selected.
- the number of fields corresponding to each selectable option may be displayed in association with each option. For example, “97” displayed next to the “All Fields” option 702 indicates that 97 fields will be selected if the “All Fields” option is selected.
- the “3” displayed next to the “Selected Fields” option 703 indicates that 3 of the 97 fields will be selected if the “Selected Fields” option is selected.
- the “49” displayed next to the “Coverage” option 704 indicates that 49 of the 97 fields (e.g., the 49 fields having a coverage of 2% or greater) will be selected if the “Coverage” option is selected.
- the number of fields corresponding to the “Coverage” option may be dynamically updated based on the specified percent of coverage.
- FIG. 7B illustrates an example graphical user interface screen (also called the pivot interface) 705 displaying the reporting application's “Report Editor” page.
- the screen may display interactive elements for defining various elements of a report.
- the page includes a “Filters” element 706 , a “Split Rows” element 707 , a “Split Columns” element 708 , and a “Column Values” element 709 .
- the page may include a list of search results 711 .
- the Split Rows element 707 is expanded, revealing a listing of fields 710 that can be used to define additional criteria (e.g., reporting criteria).
- the listing of fields 710 may correspond to the selected fields (attributes).
- the listing of fields 710 may list only the fields previously selected, either automatically and/or manually by a user.
- FIG. 7C illustrates a formatting dialogue 712 that may be displayed upon selecting a field from the listing of fields 710 .
- the dialogue can be used to format the display of the results of the selection (e.g., to label the column to be displayed as “optional”).
- FIG. 7D illustrates an example graphical user interface screen 705 including a table of results 713 based on the selected criteria including splitting the rows by the “component” field.
- a column 714 having an associated count for each component listed in the table may be displayed that indicates an aggregate count of the number of times that the particular field-value pair (e.g., the value in a row) occurs in the set of events responsive to the initial search query.
- FIG. 14 illustrates an example graphical user interface screen 1400 that allows the user to filter search results and to perform statistical analysis on values extracted from specific fields in the set of events.
- the top ten product names ranked by price are selected as a filter 1401 that causes the display of the ten most popular products sorted by price.
- Each row is displayed by product name and price 1402 . This results in each product displayed in a column labeled “product name” along with an associated price in a column labeled “price” 1406 .
- Statistical analysis of other fields in the events associated with the ten most popular products have been specified as column values 1403 .
- a count of the number of successful purchases for each product is displayed in column 1404 .
- These statistics may be produced by filtering the search results by the product name, finding all occurrences of a successful purchase in a field within the events and generating a total of the number of occurrences.
- a sum of the total sales is displayed in column 1405 , which is a result of the multiplication of the price and the number of successful purchases for each product.
- the reporting application allows the user to create graphical visualizations of the statistics generated for a report.
- FIG. 15 illustrates an example graphical user interface 1500 that displays a set of components and associated statistical data 1501 .
- the reporting application allows the user to select a visualization of the statistics in a graph (e.g., bar chart, scatter plot, area chart, line chart, pie chart, radial gauge, marker gauge, filler gauge, etc.).
- FIG. 16 illustrates an example of a bar chart visualization 1600 of an aspect of the statistical data 1501 .
- FIG. 17 illustrates a scatter plot visualization 1700 of an aspect of the statistical data 1501 .
- the above-described system provides significant flexibility by enabling a user to analyze massive quantities of minimally processed data “on the fly” at search time instead of storing pre-specified portions of the data in a database at ingestion time. This flexibility enables a user to see valuable insights, correlate data, and perform subsequent queries to examine interesting aspects of the data that may not have been apparent at ingestion time.
- the SPLUNK® ENTERPRISE system employs a number of unique acceleration techniques that have been developed to speed up analysis operations performed at search time. These techniques include: (1) performing search operations in parallel across multiple indexers; (2) using a keyword index; (3) using a high performance analytics store; and (4) accelerating the process of generating reports. These novel techniques are described in more detail below.
- a query can be structured such that multiple indexers perform the query in parallel, while aggregation of search results from the multiple indexers is performed locally at the search head.
- FIG. 8 illustrates how a search query 802 received from a client at a search head 210 can split into two phases, including: (1) subtasks 804 (e.g., data retrieval or simple filtering) that may be performed in parallel by indexers 206 for execution, and (2) a search results aggregation operation 806 to be executed by the search head when the results are ultimately collected from the indexers.
- subtasks 804 e.g., data retrieval or simple filtering
- a search head 210 determines that a portion of the operations involved with the search query may be performed locally by the search head.
- the search head modifies search query 802 by substituting “stats” (create aggregate statistics over results sets received from the indexers at the search head) with “prestats” (create statistics by the indexer from local results set) to produce search query 804 , and then distributes search query 804 to distributed indexers, which are also referred to as “search peers.”
- search queries may generally specify search criteria or operations to be performed on events that meet the search criteria. Search queries may also specify field names, as well as search criteria for the values in the fields or operations to be performed on the values in the fields.
- the search head may distribute the full search query to the search peers as illustrated in FIG. 4 , or may alternatively distribute a modified version (e.g., a more restricted version) of the search query to the search peers.
- the indexers are responsible for producing the results and sending them to the search head. After the indexers return the results to the search head, the search head aggregates the received results 806 to form a single search result set. By executing the query in this manner, the system effectively distributes the computational operations across the indexers while minimizing data transfers.
- data intake and query system 108 can construct and maintain one or more keyword indices to quickly identify events containing specific keywords. This technique can greatly speed up the processing of queries involving specific keywords.
- an indexer first identifies a set of keywords. Then, the indexer includes the identified keywords in an index, which associates each stored keyword with references to events containing that keyword, or to locations within events where that keyword is located. When an indexer subsequently receives a keyword-based query, the indexer can access the keyword index to quickly identify events containing the keyword.
- system 108 creates a high performance analytics store, which is referred to as a “summarization table,” that contains entries for specific field-value pairs. Each of these entries keeps track of instances of a specific value in a specific field in the event data and includes references to events containing the specific value in the specific field. For example, an example entry in a summarization table can keep track of occurrences of the value “94107” in a “ZIP code” field of a set of events and the entry includes references to all of the events that contain the value “94107” in the ZIP code field.
- This optimization technique enables the system to quickly process queries that seek to determine how many events have a particular value for a particular field.
- the system can examine the entry in the summarization table to count instances of the specific value in the field without having to go through the individual events or perform data extractions at search time. Also, if the system needs to process all events that have a specific field-value combination, the system can use the references in the summarization table entry to directly access the events to extract further information without having to search all of the events to find the specific field-value combination at search time.
- the system maintains a separate summarization table for each of the above-described time-specific buckets that stores events for a specific time range.
- a bucket-specific summarization table includes entries for specific field-value combinations that occur in events in the specific bucket.
- the system can maintain a separate summarization table for each indexer.
- the indexer-specific summarization table includes entries for the events in a data store that are managed by the specific indexer. Indexer-specific summarization tables may also be bucket-specific.
- the summarization table can be populated by running a periodic query that scans a set of events to find instances of a specific field-value combination, or alternatively instances of all field-value combinations for a specific field.
- a periodic query can be initiated by a user, or can be scheduled to occur automatically at specific time intervals.
- a periodic query can also be automatically launched in response to a query that asks for a specific field-value combination.
- the system can use the summarization tables to obtain partial results for the events that are covered by summarization tables, but may also have to search through other events that are not covered by the summarization tables to produce additional results. These additional results can then be combined with the partial results to produce a final set of results for the query.
- the summarization table and associated techniques are described in more detail in U.S. Pat. No. 8,682,925, entitled “DISTRIBUTED HIGH PERFORMANCE ANALYTICS STORE”, issued on 25 Mar. 2014, U.S. patent application Ser. No.
- a data server system such as the SPLUNK® ENTERPRISE system can accelerate the process of periodically generating updated reports based on query results.
- a summarization engine automatically examines the query to determine whether generation of updated reports can be accelerated by creating intermediate summaries. If reports can be accelerated, the summarization engine periodically generates a summary covering data obtained during a latest non-overlapping time period. For example, where the query seeks events meeting a specified criteria, a summary for the time period includes only events within the time period that meet the specified criteria. Similarly, if the query seeks statistics calculated from the events, such as the number of events that match the specified criteria, then the summary for the time period includes the number of events in the period that match the specified criteria.
- the summarization engine schedules the periodic updating of the report associated with the query.
- the query engine determines whether intermediate summaries have been generated covering portions of the time period covered by the report update. If so, then the report is generated based on the information contained in the summaries. Also, if additional event data has been received and has not yet been summarized, and is required to generate the complete report, the query can be run on this additional event data. Then, the results returned by this query on the additional event data, along with the partial results obtained from the intermediate summaries, can be combined to generate the updated report. This process is repeated each time the report is updated.
- SPLUNK® ENTERPRISE platform provides various schemas, dashboards, and visualizations that simplify developers' task to create applications with additional capabilities.
- One such application is the SPLUNK® APP FOR ENTERPRISE SECURITY, which performs monitoring and alerting operations and includes analytics to facilitate identifying both known and unknown security threats based on large volumes of data stored by the SPLUNK® ENTERPRISE system.
- SPLUNK® APP FOR ENTERPRISE SECURITY provides the security practitioner with visibility into security-relevant threats found in the enterprise infrastructure by capturing, monitoring, and reporting on data from enterprise security devices, systems, and applications.
- SPLUNK® ENTERPRISE searching and reporting capabilities SPLUNK® APP FOR ENTERPRISE SECURITY provides a top-down and bottom-up view of an organization's security posture.
- the SPLUNK® APP FOR ENTERPRISE SECURITY leverages SPLUNK® ENTERPRISE search-time normalization techniques, saved searches, and correlation searches to provide visibility into security-relevant threats and activity and generate notable events for tracking.
- the application enables the security practitioner to investigate and explore the data to find new or unknown threats that do not follow signature-based patterns.
- SIEM Security Information and Event Management
- the SPLUNK® APP FOR ENTERPRISE SECURITY system stores large volumes of minimally processed security-related data at ingestion time for later retrieval and analysis at search time when a live security threat is being investigated.
- the SPLUNK® APP FOR ENTERPRISE SECURITY provides pre-specified schemas for extracting relevant values from the different types of security-related event data and enables a user to define such schemas.
- the SPLUNK® APP FOR ENTERPRISE SECURITY can process many types of security-related information.
- this security-related information can include any information that can be used to identify security threats.
- the security-related information can include network-related information, such as IP addresses, domain names, asset identifiers, network traffic volume, uniform resource locator strings, and source addresses.
- network-related information such as IP addresses, domain names, asset identifiers, network traffic volume, uniform resource locator strings, and source addresses.
- the process of detecting security threats for network-related information is further described in U.S. Pat. No. 8,826,434, entitled “SECURITY THREAT DETECTION BASED ON INDICATIONS IN BIG DATA OF ACCESS TO NEWLY REGISTERED DOMAINS”, issued on 2 Sep. 2014, U.S. patent application Ser. No.
- Security-related information can also include malware infection data and system configuration information, as well as access control information, such as login/logout information and access failure notifications.
- the security-related information can originate from various sources within a data center, such as hosts, virtual machines, storage devices, and sensors.
- the security-related information can also originate from various sources in a network, such as routers, switches, email servers, proxy servers, gateways, firewalls, and intrusion-detection systems.
- the SPLUNK® APP FOR ENTERPRISE SECURITY facilitates detecting “notable events” that are likely to indicate a security threat.
- notable events can be detected in a number of ways: (1) a user can notice a correlation in the data and can manually identify a corresponding group of one or more events as “notable;” or (2) a user can define a “correlation search” specifying criteria for a notable event, and every time one or more events satisfy the criteria, the application can indicate that the one or more events are notable.
- a user can alternatively select a pre-defined correlation search provided by the application. Note that correlation searches can be run continuously or at regular intervals (e.g., every hour) to search for notable events.
- notable events can be stored in a dedicated “notable events index,” which can be subsequently accessed to generate various visualizations containing security-related information. Also, alerts can be generated to notify system operators when important notable events are discovered.
- FIG. 9A illustrates an example key indicators view 900 that comprises a dashboard, which can display a value 901 , for various security-related metrics, such as malware infections 902 . It can also display a change in a metric value 903 , which indicates that the number of malware infections increased by 63 during the preceding interval.
- Key indicators view 900 additionally displays a histogram panel 904 that displays a histogram of notable events organized by urgency values, and a histogram of notable events organized by time intervals.
- This key indicators view is described in further detail in pending U.S. patent application Ser. No. 13/956,338, entitled “KEY INDICATORS VIEW”, filed on 31 Jul. 2013, and which is hereby incorporated by reference in its entirety for all purposes.
- FIG. 9B illustrates an example incident review dashboard 910 that includes a set of incident attribute fields 911 that, for example, enables a user to specify a time range field 912 for the displayed events. It also includes a timeline 913 that graphically illustrates the number of incidents that occurred in time intervals over the selected time range.
- each notable event can be associated with an urgency value (e.g., low, medium, high, critical), which is indicated in the incident review dashboard.
- the urgency value for a detected event can be determined based on the severity of the event and the priority of the system component associated with the event.
- SPLUNK® ENTERPRISE platform provides various features that simplify the task of creating various applications.
- One such application is SPLUNK® APP FOR VMWARE® that provides operational visibility into granular performance metrics, logs, tasks and events, and topology from hosts, virtual machines and virtual centers. It empowers administrators with an accurate real-time picture of the health of the environment, proactively identifying performance and capacity bottlenecks.
- Machine-generated data is typically pre-processed prior to being stored, for example, by extracting pre-specified data items and storing them in a database to facilitate subsequent retrieval and analysis at search time.
- the rest of the data is not saved and discarded during pre-processing.
- the SPLUNK® APP FOR VMWARE® stores large volumes of minimally processed machine data, such as performance information and log data, at ingestion time for later retrieval and analysis at search time when a live performance issue is being investigated.
- this performance-related information can include values for performance metrics obtained through an application programming interface (API) provided as part of the vSphere HypervisorTM system distributed by VMware, Inc. of Palo Alto, Calif.
- API application programming interface
- these performance metrics can include: (1) CPU-related performance metrics; (2) disk-related performance metrics; (3) memory-related performance metrics; (4) network-related performance metrics; (5) energy-usage statistics; (6) data-traffic-related performance metrics; (7) overall system availability performance metrics; (8) cluster-related performance metrics; and (9) virtual machine performance statistics.
- Such performance metrics are described in U.S. patent application Ser. No. 14/167,316, entitled “CORRELATION FOR USER-SELECTED TIME RANGES OF VALUES FOR PERFORMANCE METRICS OF COMPONENTS IN AN INFORMATION-TECHNOLOGY ENVIRONMENT WITH LOG DATA FROM THAT INFORMATION-TECHNOLOGY ENVIRONMENT”, filed on 29 Jan. 2014, and which is hereby incorporated by reference in its entirety for all purposes.
- the SPLUNK® APP FOR VMWARE® provides pre-specified schemas for extracting relevant values from different types of performance-related event data, and also enables a user to define such schemas.
- the SPLUNK® APP FOR VMWARE® additionally provides various visualizations to facilitate detecting and diagnosing the root cause of performance problems.
- one such visualization is a “proactive monitoring tree” that enables a user to easily view and understand relationships among various factors that affect the performance of a hierarchically structured computing system.
- This proactive monitoring tree enables a user to easily navigate the hierarchy by selectively expanding nodes representing various entities (e.g., virtual centers or computing clusters) to view performance information for lower-level nodes associated with lower-level entities (e.g., virtual machines or host systems).
- Example node-expansion operations are illustrated in FIG. 9C , wherein nodes 933 and 934 are selectively expanded.
- nodes 931 - 939 can be displayed using different patterns or colors to represent different performance states, such as a critical state, a warning state, a normal state or an unknown/offline state.
- the ease of navigation provided by selective expansion in combination with the associated performance-state information enables a user to quickly diagnose the root cause of a performance problem.
- the proactive monitoring tree is described in further detail in U.S. patent application Ser. No. 14/253,490, entitled “PROACTIVE MONITORING TREE WITH SEVERITY STATE SORTING”, filed on 15 Apr. 2014, and U.S. patent application Ser. No. 14/812,948, also entitled “PROACTIVE MONITORING TREE WITH SEVERITY STATE SORTING”, filed on 29 Jul. 2015, each of which is hereby incorporated by reference in its entirety for all purposes.
- the SPLUNK® APP FOR VMWARE® also provides a user interface that enables a user to select a specific time range and then view heterogeneous data comprising events, log data, and associated performance metrics for the selected time range.
- the screen illustrated in FIG. 9D displays a listing of recent “tasks and events” and a listing of recent “log entries” for a selected time range above a performance-metric graph for “average CPU core utilization” for the selected time range.
- a user is able to operate pull-down menus 942 to selectively display different performance metric graphs for the selected time range. This enables the user to correlate trends in the performance-metric graph with corresponding event and log data to quickly determine the root cause of a performance problem.
- the example data intake and query system 108 described in reference to FIG. 2 comprises several system components, including one or more forwarders, indexers, and search heads.
- a user of a data intake and query system 108 may install and configure, on computing devices owned and operated by the user, one or more software applications that implement some or all of these system components.
- a user may install a software application on server computers owned by the user and configure each server to operate as one or more of a forwarder, an indexer, a search head, etc.
- This arrangement generally may be referred to as an “on-premises” solution. That is, the system 108 is installed and operates on computing devices directly controlled by the user of the system.
- Some users may prefer an on-premises solution because it may provide a greater level of control over the configuration of certain aspects of the system (e.g., security, privacy, standards, controls, etc.). However, other users may instead prefer an arrangement in which the user is not directly responsible for providing and managing the computing devices upon which various components of system 108 operate.
- a cloud-based service refers to a service hosted by one more computing resources that are accessible to end users over a network, for example, by using a web browser or other application on a client device to interface with the remote computing resources.
- a service provider may provide a cloud-based data intake and query system by managing computing resources configured to implement various aspects of the system (e.g., forwarders, indexers, search heads, etc.) and by providing access to the system to end users via a network.
- a user may pay a subscription or other fee to use such a service.
- Each subscribing user of the cloud-based service may be provided with an account that enables the user to configure a customized cloud-based system based on the user's preferences.
- FIG. 10 illustrates a block diagram of an example cloud-based data intake and query system. Similar to the system of FIG. 2 , the networked computer system 1000 includes input data sources 202 and forwarders 204 . These input data sources and forwarders may be in a subscriber's private computing environment. Alternatively, they might be directly managed by the service provider as part of the cloud service. In the example system 1000 , one or more forwarders 204 and client devices 1002 are coupled to a cloud-based data intake and query system 1006 via one or more networks 1004 .
- Network 1004 broadly represents one or more LANs, WANs, cellular networks, intranetworks, internetworks, etc., using any of wired, wireless, terrestrial microwave, satellite links, etc., and may include the public Internet, and is used by client devices 1002 and forwarders 204 to access the system 1006 . Similar to the system of 108 , each of the forwarders 204 may be configured to receive data from an input source and to forward the data to other components of the system 1006 for further processing.
- a cloud-based data intake and query system 1006 may comprise a plurality of system instances 1008 .
- each system instance 1008 may include one or more computing resources managed by a provider of the cloud-based system 1006 made available to a particular subscriber.
- the computing resources comprising a system instance 1008 may, for example, include one or more servers or other devices configured to implement one or more forwarders, indexers, search heads, and other components of a data intake and query system, similar to system 108 .
- a subscriber may use a web browser or other application of a client device 1002 to access a web portal or other interface that enables the subscriber to configure an instance 1008 .
- Each of the components of a system 108 may at times refer to various configuration files stored locally at each component. These configuration files typically may involve some level of user configuration to accommodate particular types of data a user desires to analyze and to account for other user preferences.
- users typically may not have direct access to the underlying computing resources implementing the various system components (e.g., the computing resources comprising each system instance 1008 ), and may instead desire to make such configurations indirectly (e.g., using web-based interfaces).
- the techniques and systems described herein are applicable to both on-premises and cloud-based service contexts, or some combination thereof (e.g., a hybrid system where both an on-premises environment such as SPLUNK® ENTERPRISE and a cloud-based environment such as SPLUNK CLOUDTM are centrally visible).
- FIG. 11 shows a block diagram of an example of a data intake and query system 108 that provides transparent search facilities for data systems that are external to the data intake and query system.
- Such facilities are available in the HUNK® system provided by Splunk Inc. of San Francisco, Calif.
- HUNK® represents an analytics platform that enables business and IT teams to rapidly explore, analyze, and visualize data in Hadoop and NoSQL data stores.
- the search head 210 of the data intake and query system receives search requests from one or more client devices 1104 over network connections 1120 .
- the data intake and query system 108 may reside in an enterprise location, in the cloud, etc.
- FIG. 11 illustrates that multiple client devices 1104 a , 1104 b , . . . , 1104 n may communicate with the data intake and query system 108 .
- the client devices 1104 may communicate with the data intake and query system using a variety of connections. For example, one client device in FIG. 11 is illustrated as communicating over an Internet (Web) protocol, another client device is illustrated as communicating via a command line interface, and another client device is illustrated as communicating via a system developer kit (SDK).
- Web Internet
- SDK system developer kit
- the search head 210 analyzes the received search request to identify request parameters. If a search request received from one of the client devices 1104 references an index maintained by the data intake and query system, then the search head 210 connects to one or more indexers 206 of the data intake and query system for the index referenced in the request parameters. That is, if the request parameters of the search request reference an index, then the search head accesses the data in the index via the indexer.
- the data intake and query system 108 may include one or more indexers 206 , depending on system access resources and requirements. As described further below, the indexers 206 retrieve data from their respective local data stores 208 as specified in the search request.
- the indexers and their respective data stores can comprise one or more storage devices and typically reside on the same system, though they may be connected via a local network connection.
- an external data collection may be referred to as a “virtual index” (plural, “virtual indices”).
- An ERP process provides an interface through which the search head 210 may access virtual indices.
- a search reference to an index of the system relates to a locally stored and managed data collection.
- a search reference to a virtual index relates to an externally stored and managed data collection, which the search head may access through one or more ERP processes 1110 , 1112 .
- FIG. 11 shows two ERP processes 1110 , 1112 that connect to respective remote (external) virtual indices, which are indicated as a Hadoop or another system 1114 (e.g., Amazon S3, Amazon Elastic MapReduce (EMR), other Hadoop Compatible File Systems (HCFS), etc.) and a relational database management system (RDBMS) 1116 .
- Other virtual indices may include other file organizations and protocols, such as Structured Query Language (SQL) and the like.
- An ERP process may be a computer process that is initiated or spawned by the search head 210 and is executed by the search data intake and query system 108 .
- an ERP process may be a process spawned by the search head 210 on the same or different host system as the search head 210 resides.
- the search head 210 may spawn a single ERP process in response to multiple virtual indices referenced in a search request, or the search head may spawn different ERP processes for different virtual indices.
- virtual indices that share common data configurations or protocols may share ERP processes.
- all search query references to a Hadoop file system may be processed by the same ERP process, if the ERP process is suitably configured.
- all search query references to an SQL database may be processed by the same ERP process.
- the search head may provide a common ERP process for common external data source types (e.g., a common vendor may utilize a common ERP process, even if the vendor includes different data storage system types, such as Hadoop and SQL).
- Common indexing schemes also may be handled by common ERP processes, such as flat text files or Weblog files.
- the search head 210 determines the number of ERP processes to be initiated via the use of configuration parameters that are included in a search request message.
- a one-to-many relationship between an external results provider “family” and ERP processes.
- ERP processes There is also a one-to-many relationship between an ERP process and corresponding virtual indices that are referred to in a search request.
- RDBMS assume two independent instances of such a system by one vendor, such as one RDBMS for production and another RDBMS used for development. In such a situation, it is likely preferable (but optional) to use two ERP processes to maintain the independent operation as between production and development data. Both of the ERPs, however, will belong to the same family, because the two RDBMS system types are from the same vendor.
- the ERP processes 1110 , 1112 receive a search request from the search head 210 .
- the search head may optimize the received search request for execution at the respective external virtual index.
- the ERP process may receive a search request as a result of analysis performed by the search head or by a different system process.
- the ERP processes 1110 , 1112 can communicate with the search head 210 via conventional input/output routines (e.g., standard in/standard out, etc.). In this way, the ERP process receives the search request from a client device such that the search request may be efficiently executed at the corresponding external virtual index.
- the ERP processes 1110 , 1112 may be implemented as a process of the data intake and query system. Each ERP process may be provided by the data intake and query system, or may be provided by process or application providers who are independent of the data intake and query system. Each respective ERP process may include an interface application installed at a computer of the external result provider that ensures proper communication between the search support system and the external result provider.
- the ERP processes 1110 , 1112 generate appropriate search requests in the protocol and syntax of the respective virtual indices 1114 , 1116 , each of which corresponds to the search request received by the search head 210 . Upon receiving search results from their corresponding virtual indices, the respective ERP process passes the result to the search head 210 , which may return or display the results or a processed set of results based on the returned results to the respective client device.
- Client devices 1104 may communicate with the data intake and query system 108 through a network interface 1120 , e.g., one or more LANs, WANs, cellular networks, intranetworks, and/or internetworks using any of wired, wireless, terrestrial microwave, satellite links, etc., and may include the public Internet.
- a network interface 1120 e.g., one or more LANs, WANs, cellular networks, intranetworks, and/or internetworks using any of wired, wireless, terrestrial microwave, satellite links, etc., and may include the public Internet.
- the ERP processes described above may include two operation modes: a streaming mode and a reporting mode.
- the ERP processes can operate in streaming mode only, in reporting mode only, or in both modes simultaneously. Operating in both modes simultaneously is referred to as mixed mode operation.
- mixed mode operation the ERP at some point can stop providing the search head with streaming results and only provide reporting results thereafter, or the search head at some point may start ignoring streaming results it has been using and only use reporting results thereafter.
- the streaming mode returns search results in real time, with minimal processing, in response to the search request.
- the reporting mode provides results of a search request with processing of the search results prior to providing them to the requesting search head, which in turn provides results to the requesting client device. ERP operation with such multiple modes provides greater performance flexibility with regard to report time, search latency, and resource utilization.
- both streaming mode and reporting mode are operating simultaneously.
- the streaming mode results e.g., the raw data obtained from the external data source
- the search head can then process the results data (e.g., break the raw data into events, timestamp it, filter it, etc.) and integrate the results data with the results data from other external data sources, and/or from data stores of the search head.
- the search head performs such processing and can immediately start returning interim (streaming mode) results to the user at the requesting client device; simultaneously, the search head is waiting for the ERP process to process the data it is retrieving from the external data source as a result of the concurrently executing reporting mode.
- the ERP process initially operates in a mixed mode, such that the streaming mode operates to enable the ERP quickly to return interim results (e.g., some of the raw or unprocessed data necessary to respond to a search request) to the search head, enabling the search head to process the interim results and begin providing to the client or search requester interim results that are responsive to the query.
- interim results e.g., some of the raw or unprocessed data necessary to respond to a search request
- the ERP also operates concurrently in reporting mode, processing portions of raw data in a manner responsive to the search query.
- the ERP may halt processing in the mixed mode at that time (or some later time) by stopping the return of data in streaming mode to the search head and switching to reporting mode only.
- the ERP starts sending interim results in reporting mode to the search head, which in turn may then present this processed data responsive to the search request to the client or search requester.
- the search head switches from using results from the ERP's streaming mode of operation to results from the ERP's reporting mode of operation when the higher bandwidth results from the reporting mode outstrip the amount of data processed by the search head in the ]streaming mode of ERP operation.
- a reporting mode may have a higher bandwidth because the ERP does not have to spend time transferring data to the search head for processing all the raw data.
- the ERP may optionally direct another processor to do the processing.
- the streaming mode of operation does not need to be stopped to gain the higher bandwidth benefits of a reporting mode; the search head could simply stop using the streaming mode results—and start using the reporting mode results—when the bandwidth of the reporting mode has caught up with or exceeded the amount of bandwidth provided by the streaming mode.
- the search head could simply stop using the streaming mode results—and start using the reporting mode results—when the bandwidth of the reporting mode has caught up with or exceeded the amount of bandwidth provided by the streaming mode.
- the reporting mode can involve the ERP process (or an external system) performing event breaking, time stamping, filtering of events to match the search query request, and calculating statistics on the results.
- the user can request particular types of data, such as if the search query itself involves types of events, or the search request may ask for statistics on data, such as on events that meet the search request.
- the search head understands the query language used in the received query request, which may be a proprietary language.
- One exemplary query language is Splunk Processing Language (SPL) developed by the assignee of the application, Splunk Inc.
- SAP Splunk Processing Language
- the search head typically understands how to use that language to obtain data from the indexers, which store data in a format used by the SPLUNK® Enterprise system.
- the ERP processes support the search head, as the search head is not ordinarily configured to understand the format in which data is stored in external data sources such as Hadoop or SQL data systems. Rather, the ERP process performs that translation from the query submitted in the search support system's native format (e.g., SPL if SPLUNK® ENTERPRISE is used as the search support system) to a search query request format that will be accepted by the corresponding external data system.
- the external data system typically stores data in a different format from that of the search support system's native index format, and it utilizes a different query language (e.g., SQL or MapReduce, rather than SPL or the like).
- the ERP process can operate in the streaming mode alone.
- the search head can integrate the returned data with any data obtained from local data sources (e.g., native to the search support system), other external data sources, and other ERP processes (if such operations were required to satisfy the terms of the search query).
- local data sources e.g., native to the search support system
- other ERP processes if such operations were required to satisfy the terms of the search query.
- An advantage of mixed mode operation is that, in addition to streaming mode, the ERP process is also executing concurrently in reporting mode.
- the ERP process (rather than the search head) is processing query results (e.g., performing event breaking, timestamping, filtering, possibly calculating statistics if required to be responsive to the search query request, etc.).
- the streaming mode will allow the search head to start returning interim results to the user at the client device before the ERP process can complete sufficient processing to start returning any search results.
- the switchover between streaming and reporting mode happens when the ERP process determines that the switchover is appropriate, such as when the ERP process determines it can begin returning meaningful results from its reporting mode.
- streaming mode has low latency (immediate results) and usually has relatively low bandwidth (fewer results can be returned per unit of time).
- concurrently running reporting mode has relatively high latency (it has to perform a lot more processing before returning any results) and usually has relatively high bandwidth (more results can be processed per unit of time).
- the ERP process does begin returning report results, it returns more processed results than in the streaming mode, because, e.g., statistics only need to be calculated to be responsive to the search request. That is, the ERP process doesn't have to take time to first return raw data to the search head.
- the ERP process could be configured to operate in streaming mode alone and return just the raw data for the search head to process in a way that is responsive to the search request.
- the ERP process can be configured to operate in the reporting mode only.
- the ERP process can be configured to operate in streaming mode and reporting mode concurrently, as described, with the ERP process stopping the transmission of streaming results to the search head when the concurrently running reporting mode has caught up and started providing results.
- the reporting mode does not require the processing of all raw data that is responsive to the search query request before the ERP process starts returning results; rather, the reporting mode usually performs processing of chunks of events and returns the processing results to the search head for each chunk.
- an ERP process can be configured to merely return the contents of a search result file verbatim, with little or no processing of results. That way, the search head performs all processing (such as parsing byte streams into events, filtering, etc.).
- the ERP process can be configured to perform additional intelligence, such as analyzing the search request and handling all the computation that a native search indexer process would otherwise perform. In this way, the configured ERP process provides greater flexibility in features while operating according to desired preferences, such as response latency and resource requirements.
- the SPLUNK® ENTERPRISE platform provides various schemas, dashboards and visualizations that make it easy for developers to create applications to provide additional capabilities.
- One such application is SPLUNK® IT SERVICE INTELLIGENCETM, which performs monitoring and alerting operations. It also includes analytics to help an analyst diagnose the root cause of performance problems based on large volumes of data stored by the SPLUNK® ENTERPRISE system as correlated to the various services an IT organization provides (a service-centric view).
- Traditional service monitoring systems typically use fixed schemas to extract data from pre-defined fields at data ingestion time, wherein the extracted data is typically stored in a relational database. This data extraction process and associated reduction in data content that occurs at data ingestion time inevitably hampers future investigations, when all of the original data may be needed to determine the root cause of or contributing factors to a service issue.
- SPLUNK® IT SERVICE INTELLIGENCETM stores large volumes of minimally-processed service-related data at ingestion time for later retrieval and analysis at search time, to perform regular monitoring, or to investigate a service issue.
- SPLUNK® IT SERVICE INTELLIGENCETM enables a user to define an IT operations infrastructure from the perspective of the services it provides.
- a service such as corporate e-mail may be defined in terms of the entities employed to provide the service, such as host machines and network devices.
- Each entity is defined to include information for identifying all of the event data that pertains to the entity, whether produced by the entity itself or by another machine, and considering the many various ways the entity may be identified in raw machine data (such as by a URL, an IP address, or machine name).
- the service and entity definitions can organize event data around a service so that all of the event data pertaining to that service can be easily identified. This capability provides a foundation for the implementation of Key Performance Indicators.
- KPI's Key Performance Indicators
- Each KPI measures an aspect of service performance at a point in time or over a period of time (aspect KPI's).
- Each KPI is defined by a search query that derives a KPI value from the machine data of events associated with the entities that provide the service. Information in the entity definitions may be used to identify the appropriate events at the time a KPI is defined or whenever a KPI value is being determined.
- the KPI values derived over time may be stored to build a valuable repository of current and historical performance information for the service, and the repository, itself, may be subject to search query processing.
- Aggregate KPIs may be defined to provide a measure of service performance calculated from a set of service aspect KPI values; this aggregate may even be taken across defined timeframes and/or across multiple services.
- a particular service may have an aggregate KPI derived from substantially all of the aspect KPI's of the service to indicate an overall health score for the service.
- SPLUNK® IT SERVICE INTELLIGENCETM facilitates the production of meaningful aggregate KPI's through a system of KPI thresholds and state values. Different KPI definitions may produce values in different ranges, and so the same value may mean something very different from one KPI definition to another. To address this, SPLUNK® IT SERVICE INTELLIGENCETM implements a translation of individual KPI values to a common domain of “state” values. For example, a KPI range of values may be 1-100, or 50-275, while values in the state domain may be ‘critical,’ ‘warning,’ ‘normal,’ and ‘informational’. Thresholds associated with a particular KPI definition determine ranges of values for that KPI that correspond to the various state values.
- KPI values 95-100 may be set to correspond to ‘critical’ in the state domain.
- KPI values from disparate KPI's can be processed uniformly once they are translated into the common state values using the thresholds. For example, “normal 80% of the time” can be applied across various KPI's.
- a weighting value can be assigned to each KPI so that its influence on the calculated aggregate KPI value is increased or decreased relative to the other KPI's.
- SPLUNK® IT SERVICE INTELLIGENCETM can reflect these dependencies. For example, a dependency relationship between a corporate e-mail service and a centralized authentication service can be reflected by recording an association between their respective service definitions. The recorded associations establish a service dependency topology that informs the data or selection options presented in a graphical user interface (GUI), for example.
- GUI graphical user interface
- the service dependency topology is like a “map” showing how services are connected based on their dependencies.
- the service topology may itself be depicted in a GUI and may be interactive to allow navigation among related services.
- Entity definitions in SPLUNK® IT SERVICE INTELLIGENCETM can include informational fields that can serve as metadata, implied data fields, or attributed data fields for the events identified by other aspects of the entity definition.
- Entity definitions in SPLUNK® IT SERVICE INTELLIGENCETM can also be created and updated by an import of tabular data (as represented in a comma-separate values (CSV) file, another delimited file, or a search query result set). The import may be GUI-mediated or processed using import parameters from a GUI-based import definition process.
- Entity definitions in SPLUNK® IT SERVICE INTELLIGENCETM can also be associated with a service by means of a service definition rule. Processing the rule results in the matching entity definitions being associated with the service definition. The rule can be processed at creation time, and thereafter on a scheduled or on-demand basis. This allows dynamic, rule-based updates to the service definition.
- SPLUNK® IT SERVICE INTELLIGENCETM can recognize so-called “notable events” that may indicate a service performance problem or other situation of interest.
- notable events can be recognized by a “correlation search” specifying trigger criteria for a notable event: every time KPI values satisfy the criteria, the application indicates a notable event. A severity level for the notable event may also be specified.
- the correlation search may additionally or alternatively cause a service ticket to be created in an IT service management (ITSM) system, such as a systems available from ServiceNow, Inc., of Santa Clara, Calif.
- ITSM IT service management
- SPLUNK® IT SERVICE INTELLIGENCETM provides various visualizations built on its service-centric organization of event data and the KPI values generated and collected. Visualizations can be particularly useful for monitoring or investigating service performance.
- SPLUNK® IT SERVICE INTELLIGENCETM provides a service monitoring interface suitable as the home page for ongoing IT service monitoring. The interface is appropriate for settings such as desktop use or for a wall-mounted display in a network operations center (NOC).
- NOC network operations center
- the interface may prominently display a services health section with tiles for the aggregate KPI's indicating overall health for defined services and a general KPI section with tiles for KPI's related to individual service aspects. These tiles may display KPI information in a variety of ways, such as by being colored and ordered according to factors like the KPI state value. They also can be interactive and navigate to visualizations of more detailed KPI information.
- SPLUNK® IT SERVICE INTELLIGENCETM provides a service-monitoring dashboard visualization based on a user-defined template.
- the template can include user-selectable widgets of varying types and styles to display KPI information.
- the content and the appearance of widgets can respond dynamically to changing KPI information.
- the KPI widgets can appear in conjunction with a background image, user drawing objects, or other visual elements, that depict the IT operations environment, for example.
- the KPI widgets or other GUI elements can be interactive so as to provide navigation to visualizations of more detailed KPI information.
- SPLUNK® IT SERVICE INTELLIGENCETM provides a visualization showing detailed time-series information for multiple KPI's in parallel graph lanes.
- the length of each lane can correspond to a uniform time range, while the width of each lane may be automatically adjusted to fit the displayed KPI data.
- Data within each lane may be displayed in a user selectable style, such as a line, area, or bar chart.
- Lane inspection may display an indicator for the selected time across the graph lanes and display the KPI value associated with that point in time for each of the graph lanes.
- the visualization may also provide navigation to an interface for defining a correlation search, using information from the visualization to pre-populate the definition.
- SPLUNK® IT SERVICE INTELLIGENCETM provides a visualization for incident review showing detailed information for notable events.
- the incident review visualization may also show summary information for the notable events over a time frame, such as an indication of the number of notable events at each of a number of severity levels.
- the severity level display may be presented as a rainbow chart with the warmest color associated with the highest severity classification.
- the incident review visualization may also show summary information for the notable events over a time frame, such as the number of notable events occurring within segments of the time frame.
- the incident review visualization may display a list of notable events within the time frame ordered by any number of factors, such as time or severity. The selection of a particular notable event from the list may display detailed information about that notable event, including an identification of the correlation search that generated the notable event.
- SPLUNK® IT SERVICE INTELLIGENCETM provides pre-specified schemas for extracting relevant values from the different types of service-related event data. It also enables a user to define such schemas.
- a faceted visualization display refers to a graphical interface including display of at least two separate data visualizations generated based on a selected facet data dimension, where each of the separate data visualizations is generated based on a distinct value of the selected facet dimension.
- a facet dimension can be selected by a user from a set of possible facet dimensions automatically identified in results data by a data intake and query system.
- a data intake and query system can execute the query and return results data indicating the product sales including a total sales amount for each separate region identified in the sales data.
- the results data can be used, for example, to generate a visualization such as a bar chart, a pie chart, or any other type of visualization capable of showing the sales data across the different regions.
- the user may desire to further explore other dimensions of the data in addition to those initially specified in the query to learn more about the data.
- the user in the example above can use a graphical interface component to further split and cause display of the results data based on one or more dimensions identified in the results data.
- the data intake and query system executing the query might analyze the results data and determine that the results data contains a field named productId that identifies a type of product associated with each sale.
- the data intake and query system can include the productId field as a selectable option using an element of the graphical interface component.
- the system can generate and cause display of a graphical interface including a plurality of separate data visualizations, where each visualization is specific to a distinct value of the selected dimension (e.g.
- embodiments of the invention encompass a computer apparatus and a computer-readable medium configured to carry out the foregoing.
- FIG. 18 illustrates an example graphical interface including a faceted visualization display of search results data based on a selected facet dimension.
- the graphical interface 1800 includes a query creation interface element 1801 , a display options panel 1802 , and a query results visualization panel 1803 .
- a user has specified a search query in the query creation interface element 1801 using syntax according to a query language.
- a query can be generated in other ways including, for example, based on a user selection of an interface element requesting display of particular information, based on a default query associated with a graphical interface (e.g., a query associated with one or more panels of a dashboard interface), or in response to any other action or condition.
- the query in the query creation interface element 1801 requests results data related to network traffic, where the results data is to include an average number of bytes transferred split by the data fields Region and categoryId.
- the graphical interface 1800 further includes a display options panel 1802 , which includes various interface elements corresponding to user-selectable options for displaying results data generated based on execution of a query specified in the query creation interface element 1801 .
- a user has selected a checkbox interface element 1804 labeled “Display as multiple charts,” which requests display of the results data using multiple data visualizations based on a selected facet dimension.
- the user has further selected the Region field using a dropdown list interface element 1805 .
- the fields shown in a dropdown list interface element 1805 can be those identified by a data intake and query system based on analyzing the results data to be displayed.
- the dropdown list interface element 1805 might display fields including Region, categoryId, or any other fields contained in the results data regardless of whether the fields were explicitly specified in the query in query creation interface element 1801 .
- the query results visualization panel 1803 displays several independent bar chart visualizations, where each bar chart shows results data specific to one distinct value of the selected field (e.g., one bar chart for the “Arizona” region, another chart for the “California” region, another chart for the “Connecticut” region, and so forth).
- the user can use the display options panel 1802 and other interface elements to further modify the display of the results data by selecting a different field, turning off the faceted visualization (e.g., to cause display of only a single visualization for the results data), selecting a size with which to display the faceted visualizations, among other visualization display options described herein.
- FIG. 19 is a flow diagram illustrating an example process for generating and causing display of faceted visualizations.
- the various elements of flow 1900 may be performed in a variety of systems, including systems such as system 108 described above.
- each of the processes described in connection with the functional blocks described below may be implemented using one or more computer programs, other software elements, and/or digital logic in any of a general-purpose computer or a special-purpose computer, while performing data retrieval, transformation, and storage operations that involve interacting with and transforming the physical state of memory of the computer.
- a data intake and query system based on execution of a query, identifies results data including a plurality of timestamped events.
- a data intake and query system executes a search query using a search head and one or more indexers, as described in Section 2.6.
- the identified results data generally includes one or more timestamped events satisfying any search criteria specified in the query, and may also include one or more calculated values derived from the matching events.
- the query may be created by a user, generated based on a request to display a particular graphical interface, or generated in response to any other action or condition.
- the query is received as input to a query creation interface element of a graphical interface.
- the query might be received via a query creation interface element 1801 of a graphical interface 1800 , wherein a user can create a custom query according to a query language syntax supported by the data intake and query system 108 .
- the graphical interface may be generated by a search head 210 , an indexer 206 , or any other component of a data intake and query system 108 .
- At block 1904 at least one field associated with a plurality of distinct values is identified in the results data identified at block 1902 .
- a data intake and query system 108 can analyze results data returned by a search head or other data source to identify fields contained in the results data.
- a field refers to a location in the results data containing one or more values for a specific data item, where the fields can be defined by extraction rules (e.g., regular expressions) that derive one or more values from the portion of raw machine data in each event that has a field specified by an extraction rule.
- extraction rules e.g., regular expressions
- a data intake and query system identifies at least one field associated with a plurality of distinct values.
- a data intake and query system 108 might identify fields in the results data such as a productId field, a Region field, etc., where events in the results data including these fields are further associated with at least one value of a plurality of distinct values for the field.
- a data intake and query system 108 identifying a Region field in results data relating to sales information might further determine that events of the results data have a value associated with the Region field from the following set of values: “Arizona”, “California”, “Connecticut”, “Florida”, “Illinois”, “New York”, and “Texas”. Based on determining that a field is associated with a plurality of distinct values in the results data, the data intake and query system 108 can identify the field as a possible dimension of the data by which a faceted visualization display can be generated.
- the plurality of distinct values associated with a field identified in the results data as a possible faceted display dimension can include statistical values calculated based on the results data.
- one field might be associated with values calculated based on other data contained in the results data, where a type of calculation used to create a statistical value field can include a summation, an average, a minimum, a maximum, or any other type of calculation.
- the plurality of distinct values associated with a field identified in the results data can include values retrieved based on a data look-up using values contained in the results data.
- a data intake and query system 108 might detect a field associated with values known to correspond to items of another data set.
- one example field in the results data might include a numerical identifier or short character string known to correspond to country labels (e.g., “US” for “United States” and “CA” for “Canada”).
- a data intake and query system 108 can create a field which contains a full label for each country, where the full label for each results item is obtained based on a data look-up using a value contained in the original results data.
- the creation of a field using a data look-up can be based on syntax included in a user query, or based on the data intake and query system 108 automatically identifying the field as being associated with the corresponding items of another data set.
- input is received selecting a field from the at least one field identified at block 1904 .
- the data intake and query system 108 might populate a dropdown list interface element 1805 with the names of fields identified by the data intake and query system at block 1904 .
- other types of interface elements can be used to display the identified fields including, for example, buttons, toggles, checkboxes, etc.
- a user can use the interface element to select a field of interest to the user and for which the user desires to view a faceted visualization display based on the selected field.
- the data intake and query system segments the results data based on the plurality of distinct values to generate a plurality of field value-specific data sets.
- a data intake and query system 108 can segment the results data by creating new results data sets from the original results data, or by logically segmenting the results data but leaving the original results data intact.
- a data intake and query system 108 receives input selecting a field named productId that is associated with five distinct values (e.g., “Product A”, “Product B”, “Product F”, “Product R”, and “Product Z”), the system 108 can segment the results data into a separate field-value specific data set containing only those events from the results data associated with a respective field value (e.g., one field-value specific data set including events having a productId value of “Product A”, another field-value specific data set including events having a productId value of “Product B”, and so forth).
- the data intake and query system further causes display of a graphical interface including a plurality of data visualizations, where each data visualization of the plurality of data visualizations corresponds to a respective field-value specific data set of the plurality of field value-specific data sets.
- a query results visualization panel 1803 includes display of a plurality of data visualizations, where each data visualization corresponds to a respective field-value specific data for the selected Region dimension.
- causing display of the graphical interface including the plurality of data visualizations is based on the data intake and query system executing a single query.
- a data intake and query system 108 executes a query, identifies results data based on execution of the query, and segments the results data into a plurality of field value-specific data sets based on a selected facet dimension. This process of segmenting a results data set identified based on execution of a single query may often be more efficient than executing a plurality of separate queries to generate each of the field value-specific data sets (e.g., executing a separate query for data relating to each distinct value of the plurality of distinct values).
- a process for generating the field-value specific data sets can include executing multiple separate queries based on an initially specified query to generate the field value-specific data sets.
- causing display of the graphical interface including the plurality of data visualizations is further in response to receiving input requesting display of the graphical interface including the plurality of data visualizations.
- a display options panel 1802 includes a checkbox interface element 1804 , which enables a user to select whether or not the user desires to view a faceted display of the results data.
- the interface 1800 can display results data using multiple, faceted data visualizations if the checkbox interface element 1804 is selected, and display the same results data as a single data visualization if the checkbox interface element 1804 is not selected.
- At least one data visualization of the plurality of data visualizations is one of: a bar chart, a histogram, a pie chart, a time-series chart, a radar chart, a scatter plot, an area chart, a bubble chart, or any other type of data visualization.
- the faceted visualization display shown in FIG. 18 includes a plurality of separate bar charts. However, the same data shown in FIG. 18 can be displayed using other types of visualizations such as those described above (e.g., a separate pie chart for each Region value, where each slice of the pie chart corresponds to a different categoryId value).
- the data intake and query system in response to receiving input selecting one or more of the displayed plurality of data visualizations, causes display of the one or more selected data visualizations without displaying other unselected data visualizations.
- a user might use an input cursor or other mechanism to select one or more of the data visualizations display in query results visualization panel 1803 .
- the selected visualization(s) might correspond to one or more regions of particular interest to the user and which the user desires view in insolation from the other regions.
- the data intake and query system 108 in response to receiving the selection of the one or more visualizations, can regenerate the graphical interface 1800 to include the selected one or more visualizations without displaying the other unselected visualizations, or can display the selected visualizations in a different graphical interface.
- a data intake and query system 108 enables the creation and execution of queries, the automatic identification of fields or “dimensions” within the results data associated with a plurality of distinct values, and the generation and display of faceted visualizations based on a selected dimension.
- a data intake and query system 108 further includes various interface elements which enable additional customization and interaction with faceted visualizations.
- a data intake and query system 108 can display a plurality of data visualizations on a graphical interface according to a display size received as input.
- the display options panel 1802 includes display size interface elements 1806 , which enable a user to request a larger or smaller display of the visualizations in the query results visualization panel 1803 .
- Larger visualizations may enable more detail to be displayed in each visualization, for example, but may also affect how many visualizations are able to be displayed on a given interface.
- faceted data visualizations can be displayed according to a selected arrangement option indicating how to arrange the visualizations on a graphical interface relative to one another.
- Example arrangement options might include visualization wrapping (e.g., displaying as many data visualizations in horizontal or vertical alignment as fit on a graphical interface and wrapping additional visualizations to a new row or column), horizontal alignment (e.g., such that the visualizations are displayed in a single horizontal row without wrapping), vertical alignment (e.g., such that the visualizations are displayed in a single vertical row without wrapping), and a grid arrangement (e.g., such that the visualizations are displayed in a fixed grid of rows and columns, creating combined facets along two dimensions).
- FIGS. 20A-20D illustrate example graphical interfaces displaying faceted visualizations according to various display options such as those described above.
- FIG. 20A illustrates a graphical interface including a repeated or “wrapped” display of faceted visualizations.
- the display 2000 shows rows of visualizations displayed horizontally until there is no longer room to display a next visualization, at which point the visualizations wrap to a next row on the display.
- FIG. 20B illustrates a graphical interface including a horizontal display of faceted visualizations without wrapping.
- the faceted visualizations 2001 of are displayed in horizontal alignment without wrapping the visualizations to a new horizontal row.
- the faceted visualizations can be scaled in size to fit the display area, the display may be scrollable such that a user can move the display horizontally through the visualizations, the visualizations can be truncated, or an interface may allow users to page through the visualizations.
- FIG. 20C illustrates a graphical interface including a vertical display of faceted visualizations. Similar to FIGS. 20A and 20B , the faceted visualizations 2003 displayed vertically in FIG. 20C may be displayed with or without wrapping (e.g., by starting a new vertical column of visualizations when the current display area is exceeded, allow for vertical scrolling of the display area, truncate the visualizations when the display area is exceeded, or allow users to page through the visualizations).
- FIG. 20D illustrates a graphical interface including a grid layout of faceted visualizations, repeating the visualizations both vertically and horizontally.
- the visualizations 2004 may be scaled in size to fit the current display area, or allow for scrolling, truncate after a number of visualizations, or allow users to page through the visualizations.
- a data intake and query system 108 normalizes a range of values used to display each data visualization of a faceted data visualization display.
- each of the field-value specific data sets upon which the faceted visualizations are based may be associated with a different range of values used to display one or more aspects of a visualization.
- each region may be associated with a different range of values (e.g., a “California” region might have total sales ranging from $0 to $10,000, while a “Texas” region has total sales ranging from $0 to $50,000).
- the system 108 can normalize a range of values used to display a vertical axis on the bar charts such that the range is the same for each of the visualizations.
- normalizing a range of values can include normalizing time scales, numeric scales, categorical/ordinal scales (e.g., where the categories are the same for each facet), and color scales (e.g., for choropleth maps).
- a data intake and query system 108 causes display of a plurality of data visualizations according to a selected type of visualization.
- a graphical interface displaying faceted visualization can include interface components which enable a user to select a type of visualization the user desires to use to display the search results data.
- a display options panel 1802 might include an interface component that enables a user to select from a plurality of possible data visualizations (e.g., a drop-down list of options including a bar chart, a pie chart, a bubble chart, or any other type of visualization).
- a user can select an option from the interface component and cause the data intake and query system 108 to regenerate a query results visualization panel 1803 display based on the selected option.
- a data intake and query system determines, based on at least one characteristic of the results data, at least one suggested type of visualization for displaying the results data, and further causes display of an interface component including a selectable list of the at least one type of visualization.
- a data intake and query system 108 might analyze the results data and determine, based on one or more characteristics of the data, that the data is particularly suited for display as a bar chart, a pie chart, a scatter plot, etc.
- the characteristics of the data might include a number of total events in the results data, a range of values associated with fields to be displayed, a type of value associated with fields to be displayed, a number of distinct values associated with a field to be displayed, or any other characteristics.
- a method or non-transitory computer readable medium comprises: receiving, based on execution of a query, results data including a plurality of timestamped events; identifying, in the results data, a field associated with a plurality of distinct values; receiving input selecting the field associated with the plurality of distinct values; in response to receiving the input selecting the field: segmenting the results data based on the plurality of distinct values to generate a plurality of field value-specific data sets; and causing display of a graphical interface including a plurality of data visualizations, each data visualization corresponding to a respective field-value specific data set of the plurality of field value-specific data sets.
- a method or non-transitory computer readable medium comprises: wherein identifying the field associated with the plurality of distinct values includes identifying a plurality of fields each associated with a respective plurality of distinct values, and wherein receiving the input selecting the field includes receiving input selecting the field from the plurality of fields.
- a method or non-transitory computer readable medium comprises: wherein the plurality of distinct values associated with the field include statistical values calculated based on the results data.
- a method or non-transitory computer readable medium comprises: wherein the plurality of distinct values associated with the field include values retrieved based on a data look-up using values contained in the results data.
- a method or non-transitory computer readable medium comprises: wherein the query is received as input to a query interface element of the graphical interface.
- a method or non-transitory computer readable medium comprises: wherein identifying the field associated with the plurality of distinct values includes identifying a plurality of fields each associated with a respective plurality of distinct values; and causing display of a selectable list including the plurality of fields.
- a method or non-transitory computer readable medium comprises: receiving input requesting display of the graphical interface including the plurality of data visualizations.
- a method or non-transitory computer readable medium comprises: receiving input requesting to display the results data in a single data visualization; and in response to receiving the input, causing display of the graphical interface including a single data visualization corresponding to the results data.
- a method or non-transitory computer readable medium comprises: wherein at least one data visualization of the plurality of data visualizations is one of: a bar chart, a histogram, a pie chart, a time-series chart, a radar chart, an area chart, and a bubble chart.
- a method or non-transitory computer readable medium comprises: receiving input selecting a size used to display the plurality of data visualizations on the graphical interface; and in response to receiving the input, causing display of the plurality of data visualizations according to the selected size.
- a method or non-transitory computer readable medium comprises: receiving input requesting to display the plurality of data visualizations using an arrangement option including one or more of: visualization wrapping, horizontal alignment, vertical alignment, and grid arrangement; and in response to receiving the input, causing display of the plurality of data visualizations according to the arrangement option.
- a method or non-transitory computer readable medium comprises: normalizing a range of values used to display each data visualization of the plurality of data visualizations.
- a method or non-transitory computer readable medium comprises: receiving input selecting a type of visualization used to display the plurality of data visualizations; and in response to receiving the input, causing display of the plurality of data visualizations according to the selected type of visualization.
- a method or non-transitory computer readable medium comprises: determining, based on at least one characteristic of the results data, at least one suggested type of visualization for displaying the results data; and causing display of an interface element including a selectable list of the at least one suggested type of visualization.
- a method or non-transitory computer readable medium comprises: receiving a selection of a data visualization from the plurality of data visualizations; and in response to receiving the selection of the data visualization, causing display of the selected data visualization without displaying other data visualizations of the plurality of data visualizations.
- a method or non-transitory computer readable medium comprises: wherein causing display of the graphical interface including the plurality of data visualizations is based on execution of a single query.
- the techniques described herein are implemented by one or more special-purpose computing devices.
- the special-purpose computing devices may be desktop computer systems, portable computer systems, handheld devices, networking devices or any other device that incorporates hard-wired and/or program logic to implement the techniques.
- the special-purpose computing devices may be hard-wired to perform the techniques, or may include digital electronic devices such as one or more application-specific integrated circuits (ASICs) or field programmable gate arrays (FPGAs) that are persistently programmed to perform the techniques, or may include one or more general purpose hardware processors programmed to perform the techniques pursuant to program instructions in firmware, memory, other storage, or a combination thereof.
- ASICs application-specific integrated circuits
- FPGAs field programmable gate arrays
- Such special-purpose computing devices may also combine custom hard-wired logic, ASICs, or FPGAs with custom programming to accomplish the techniques.
- FIG. 21 is a block diagram that illustrates a computer system 2100 utilized in implementing the above-described techniques, according to an embodiment.
- Computer system 2100 may be, for example, a desktop computing device, laptop computing device, tablet, smartphone, server appliance, computing mainframe, multimedia device, handheld device, networking apparatus, or any other suitable device.
- Computer system 2100 includes one or more busses 2102 or other communication mechanism for communicating information, and one or more hardware processors 2104 coupled with busses 2102 for processing information.
- Hardware processors 2104 may be, for example, general purpose microprocessors.
- Busses 2102 may include various internal and/or external components, including, without limitation, internal processor or memory busses, a Serial ATA bus, a PCI Express bus, a Universal Serial Bus, a HyperTransport bus, an Infiniband bus, and/or any other suitable wired or wireless communication channel.
- Computer system 2100 also includes a main memory 2106 , such as a random access memory (RAM) or other dynamic or volatile storage device, coupled to bus 2102 for storing information and instructions to be executed by processor 2104 .
- Main memory 2106 also may be used for storing temporary variables or other intermediate information during execution of instructions to be executed by processor 2104 .
- Such instructions when stored in non-transitory storage media accessible to processor 2104 , render computer system 2100 a special-purpose machine that is customized to perform the operations specified in the instructions.
- Computer system 2100 further includes one or more read only memories (ROM) 2108 or other static storage devices coupled to bus 2102 for storing static information and instructions for processor 2104 .
- ROM read only memories
- One or more storage devices 2110 such as a solid-state drive (SSD), magnetic disk, optical disk, or other suitable non-volatile storage device, is provided and coupled to bus 2102 for storing information and instructions.
- Computer system 2100 may be coupled via bus 2102 to one or more displays 2112 for presenting information to a computer user.
- computer system 2100 may be connected via an High-Definition Multimedia Interface (HDMI) cable or other suitable cabling to a Liquid Crystal Display (LCD) monitor, and/or via a wireless connection such as peer-to-peer Wi-Fi Direct connection to a Light-Emitting Diode (LED) television.
- HDMI High-Definition Multimedia Interface
- LCD Liquid Crystal Display
- LED Light-Emitting Diode
- Other examples of suitable types of displays 2112 may include, without limitation, plasma display devices, projectors, cathode ray tube (CRT) monitors, electronic paper, virtual reality headsets, braille terminal, and/or any other suitable device for outputting information to a computer user.
- any suitable type of output device such as, for instance, an audio speaker or printer, may be utilized instead of a display 2112 .
- One or more input devices 2114 are coupled to bus 2102 for communicating information and command selections to processor 2104 .
- One example of an input device 2114 is a keyboard, including alphanumeric and other keys.
- cursor control 2116 is Another type of user input device 2114 , such as a mouse, a trackball, or cursor direction keys for communicating direction information and command selections to processor 2104 and for controlling cursor movement on display 2112 .
- This input device typically has two degrees of freedom in two axes, a first axis (e.g., x) and a second axis (e.g., y), that allows the device to specify positions in a plane.
- suitable input devices 2114 include a touch-screen panel affixed to a display 2112 , cameras, microphones, accelerometers, motion detectors, and/or other sensors.
- a network-based input device 2114 may be utilized.
- user input and/or other information or commands may be relayed via routers and/or switches on a Local Area Network (LAN) or other suitable shared network, or via a peer-to-peer network, from the input device 2114 to a network link 2120 on the computer system 2100 .
- LAN Local Area Network
- a computer system 2100 may implement techniques described herein using customized hard-wired logic, one or more ASICs or FPGAs, firmware and/or program logic which in combination with the computer system causes or programs computer system 2100 to be a special-purpose machine. According to one embodiment, the techniques herein are performed by computer system 2100 in response to processor 2104 executing one or more sequences of one or more instructions contained in main memory 2106 . Such instructions may be read into main memory 2106 from another storage medium, such as storage device 2110 . Execution of the sequences of instructions contained in main memory 2106 causes processor 2104 to perform the process steps described herein. In alternative embodiments, hard-wired circuitry may be used in place of or in combination with software instructions.
- Non-volatile media includes, for example, optical or magnetic disks, such as storage device 2110 .
- Volatile media includes dynamic memory, such as main memory 2106 .
- Common forms of storage media include, for example, a floppy disk, a flexible disk, hard disk, solid state drive, magnetic tape, or any other magnetic data storage medium, a CD-ROM, any other optical data storage medium, any physical medium with patterns of holes, a RAM, a PROM, an EPROM, a FLASH-EPROM, NVRAM, any other memory chip or cartridge.
- Storage media is distinct from but may be used in conjunction with transmission media.
- Transmission media participates in transferring information between storage media.
- transmission media includes coaxial cables, copper wire and fiber optics, including the wires that comprise bus 2102 .
- transmission media can also take the form of acoustic or light waves, such as those generated during radio-wave and infra-red data communications.
- Various forms of media may be involved in carrying one or more sequences of one or more instructions to processor 2104 for execution.
- the instructions may initially be carried on a magnetic disk or a solid state drive of a remote computer.
- the remote computer can load the instructions into its dynamic memory and use a modem to send the instructions over a network, such as a cable network or cellular network, as modulate signals.
- a modem local to computer system 2100 can receive the data on the network and demodulate the signal to decode the transmitted instructions.
- Appropriate circuitry can then place the data on bus 2102 .
- Bus 2102 carries the data to main memory 2106 , from which processor 2104 retrieves and executes the instructions.
- the instructions received by main memory 2106 may optionally be stored on storage device 2110 either before or after execution by processor 2104 .
- a computer system 2100 may also include, in an embodiment, one or more communication interfaces 2118 coupled to bus 2102 .
- a communication interface 2118 provides a data communication coupling, typically two-way, to a network link 2120 that is connected to a local network 2122 .
- a communication interface 2118 may be an integrated services digital network (ISDN) card, cable modem, satellite modem, or a modem to provide a data communication connection to a corresponding type of telephone line.
- the one or more communication interfaces 2118 may include a local area network (LAN) card to provide a data communication connection to a compatible LAN.
- LAN local area network
- the one or more communication interfaces 2118 may include a wireless network interface controller, such as a 802.11-based controller, Bluetooth controller, Long Term Evolution (LTE) modem, and/or other types of wireless interfaces.
- communication interface 2118 sends and receives electrical, electromagnetic, or optical signals that carry digital data streams representing various types of information.
- Network link 2120 typically provides data communication through one or more networks to other data devices.
- network link 2120 may provide a connection through local network 2122 to a host computer 2124 or to data equipment operated by a Service Provider 2126 .
- Service Provider 2126 which may for example be an Internet Service Provider (ISP), in turn provides data communication services through a wide area network, such as the world wide packet data communication network now commonly referred to as the “Internet” 2128 .
- ISP Internet Service Provider
- Internet 2128 uses electrical, electromagnetic or optical signals that carry digital data streams.
- the signals through the various networks and the signals on network link 2120 and through communication interface 2118 which carry the digital data to and from computer system 2100 , are example forms of transmission media.
- computer system 2100 can send messages and receive data, including program code and/or other types of instructions, through the network(s), network link 2120 , and communication interface 2118 .
- a server 2130 might transmit a requested code for an application program through Internet 2128 , ISP 2126 , local network 2122 and communication interface 2118 .
- the received code may be executed by processor 2104 as it is received, and/or stored in storage device 2110 , or other non-volatile storage for later execution.
- information received via a network link 2120 may be interpreted and/or processed by a software component of the computer system 2100 , such as a web browser, application, or server, which in turn issues instructions based thereon to a processor 2104 , possibly via an operating system and/or other intermediate layers of software components.
- a software component of the computer system 2100 such as a web browser, application, or server, which in turn issues instructions based thereon to a processor 2104 , possibly via an operating system and/or other intermediate layers of software components.
- some or all of the systems described herein may be or comprise server computer systems, including one or more computer systems 2100 that collectively implement various components of the system as a set of server-side processes.
- the server computer systems may include web server, application server, database server, and/or other conventional server components that certain above-described components utilize to provide the described functionality.
- the server computer systems may receive network-based communications comprising input data from any of a variety of sources, including without limitation user-operated client computing devices such as desktop computers, tablets, or smartphones, remote sensing devices, and/or other server computer systems.
- certain server components may be implemented in full or in part using “cloud”-based components that are coupled to the systems by one or more networks, such as the Internet.
- the cloud-based components may expose interfaces by which they provide processing, storage, software, and/or other resources to other components of the systems.
- the cloud-based components may be implemented by third-party entities, on behalf of another entity for whom the components are deployed.
- the described systems may be implemented entirely by computer systems owned and operated by a single entity.
- an apparatus comprises a processor and is configured to perform any of the foregoing methods.
- a non-transitory computer readable storage medium storing software instructions, which when executed by one or more processors cause performance of any of the foregoing methods.
- the terms “first,” “second,” “certain,” and “particular” are used as naming conventions to distinguish queries, plans, representations, steps, objects, devices, or other items from each other, so that these items may be referenced after they have been introduced. Unless otherwise specified herein, the use of these terms does not imply an ordering, timing, or any other characteristic of the referenced items.
Abstract
Description
-
- 1.0. General Overview
- 2.0. Operating Environment
- 2.1. Host Devices
- 2.2. Client Devices
- 2.3. Client Device Applications
- 2.4. Data Server System
- 2.5. Data Ingestion
- 2.5.1. Input
- 2.5.2. Parsing
- 2.5.3. Indexing
- 2.6. Query Processing
- 2.7. Field Extraction
- 2.8. Example Search Screen
- 2.9. Data Modelling
- 2.10. Acceleration Techniques
- 2.10.1. Aggregation Technique
- 2.10.2. Keyword Index
- 2.10.3. High Performance Analytics Store
- 2.10.4. Accelerating Report Generation
- 2.11. Security Features
- 2.12. Data Center Monitoring
- 2.13. Cloud-Based System Overview
- 2.14. Searching Externally Archived Data
- 2.14.1. ERP Process Features
- 3.0. Functional Overview
- 3.1. Faceted Visualizations Overview and Examples
- 3.2. Generating Faceted Visualizations
- 3.3. Faceted Visualization Enhancements
- 4.0. Example Embodiments
- 5.0. Implementation Mechanism—Hardware Overview
- 6.0. Extensions and Alternatives
Claims (30)
Priority Applications (1)
| Application Number | Priority Date | Filing Date | Title |
|---|---|---|---|
| US15/421,408 US10565220B2 (en) | 2017-01-31 | 2017-01-31 | Generating visualizations for search results data containing multiple data dimensions |
Applications Claiming Priority (1)
| Application Number | Priority Date | Filing Date | Title |
|---|---|---|---|
| US15/421,408 US10565220B2 (en) | 2017-01-31 | 2017-01-31 | Generating visualizations for search results data containing multiple data dimensions |
Publications (2)
| Publication Number | Publication Date |
|---|---|
| US20180218050A1 US20180218050A1 (en) | 2018-08-02 |
| US10565220B2 true US10565220B2 (en) | 2020-02-18 |
Family
ID=62980644
Family Applications (1)
| Application Number | Title | Priority Date | Filing Date |
|---|---|---|---|
| US15/421,408 Active 2037-08-14 US10565220B2 (en) | 2017-01-31 | 2017-01-31 | Generating visualizations for search results data containing multiple data dimensions |
Country Status (1)
| Country | Link |
|---|---|
| US (1) | US10565220B2 (en) |
Cited By (9)
| Publication number | Priority date | Publication date | Assignee | Title |
|---|---|---|---|---|
| US20200034414A1 (en) * | 2012-09-07 | 2020-01-30 | Splunk Inc. | Determining an extraction rule from positive and negative examples |
| US10802797B2 (en) * | 2013-01-23 | 2020-10-13 | Splunk Inc. | Providing an extraction rule associated with a selected portion of an event |
| US11106691B2 (en) | 2013-01-22 | 2021-08-31 | Splunk Inc. | Automated extraction rule generation using a timestamp selector |
| US11159383B1 (en) * | 2020-04-21 | 2021-10-26 | Aviatrix Systems, Inc. | Systems and methods for deploying a cloud management system configured for tagging constructs deployed in a multi-cloud environment |
| US11210325B2 (en) | 2013-01-23 | 2021-12-28 | Splunk Inc. | Automatic rule modification |
| US20220224587A1 (en) * | 2021-01-07 | 2022-07-14 | Servicenow, Inc. | Systems and methods for ranked visualization of events |
| US11514086B2 (en) | 2013-01-23 | 2022-11-29 | Splunk Inc. | Generating statistics associated with unique field values |
| US11651149B1 (en) | 2012-09-07 | 2023-05-16 | Splunk Inc. | Event selection via graphical user interface control |
| US11695661B1 (en) | 2020-04-21 | 2023-07-04 | Aviatrix Systems, Inc. | Systems and methods for deploying a cloud management system configured for tagging constructs deployed in a multi-cloud environment |
Families Citing this family (16)
| Publication number | Priority date | Publication date | Assignee | Title |
|---|---|---|---|---|
| US20110029565A1 (en) * | 2009-07-31 | 2011-02-03 | Leonardo William Estevez | Generation of a Media Profile |
| US20190102390A1 (en) * | 2017-09-29 | 2019-04-04 | Novabase Sgps, S.A. | Semantic search engine and visualization platform |
| US11620315B2 (en) * | 2017-10-09 | 2023-04-04 | Tableau Software, Inc. | Using an object model of heterogeneous data to facilitate building data visualizations |
| US11157568B2 (en) * | 2017-11-01 | 2021-10-26 | Sap Se | Offline mode for mobile application |
| CN111046304B (en) * | 2018-10-12 | 2023-10-13 | 阿里巴巴集团控股有限公司 | Data searching method and device |
| CN111522856A (en) * | 2019-02-01 | 2020-08-11 | 和硕联合科技股份有限公司 | Measurement data management device and measurement data management method |
| US11194845B2 (en) | 2019-04-19 | 2021-12-07 | Tableau Software, LLC | Interactive lineage analyzer for data assets |
| GB201910654D0 (en) | 2019-07-25 | 2019-09-11 | Palantir Technologies Inc | System event detection system and method |
| US11651003B2 (en) * | 2019-09-27 | 2023-05-16 | Tableau Software, LLC | Interactive data visualization interface for data and graph models |
| US11423217B2 (en) | 2019-11-07 | 2022-08-23 | Tableau Software, LLC | Flexible table based visualizations |
| US11829421B2 (en) | 2019-11-08 | 2023-11-28 | Tableau Software, LLC | Dynamic graph generation for interactive data analysis |
| US11188558B2 (en) | 2019-12-06 | 2021-11-30 | Tableau Software, LLC | Parenting computed fields with data objects |
| US11714826B2 (en) * | 2020-02-27 | 2023-08-01 | Intuitive Data Analytics, LLC | Generation and adaptation of visualizations from one or more data sets stored using a single-branch approach |
| US11422985B2 (en) | 2020-07-30 | 2022-08-23 | Tableau Software, LLC | Interactive data modeling |
| CN113032079B (en) * | 2021-03-31 | 2024-03-29 | 北京晟世天安科技有限公司 | Novel condition control chart display method |
| CN113360152B (en) * | 2021-06-11 | 2023-11-03 | 软子数字软件(广州)有限公司 | Method and system for realizing parameterized data query webpage display program |
Citations (15)
| Publication number | Priority date | Publication date | Assignee | Title |
|---|---|---|---|---|
| US20110295871A1 (en) * | 2006-01-25 | 2011-12-01 | Microsoft Corporation | Filtering and Sorting Information |
| US20130238631A1 (en) * | 2012-03-11 | 2013-09-12 | International Business Machines Corporation | Indexing and searching entity-relationship data |
| US20140095540A1 (en) * | 2012-09-28 | 2014-04-03 | Oracle International Corporation | Mechanism to chain continuous queries |
| US20150039651A1 (en) * | 2013-07-31 | 2015-02-05 | Splunk Inc. | Templates for defining fields in machine data |
| US20150149879A1 (en) * | 2012-09-07 | 2015-05-28 | Splunk Inc. | Advanced field extractor with multiple positive examples |
| US20150154269A1 (en) * | 2012-09-07 | 2015-06-04 | Splunk Inc. | Advanced field extractor with modification of an extracted field |
| US20150213631A1 (en) * | 2014-01-27 | 2015-07-30 | Splunk Inc. | Time-based visualization of the number of events having various values for a field |
| US20150278214A1 (en) * | 2014-04-01 | 2015-10-01 | Tableau Software, Inc. | Systems and Methods for Ranking Data Visualizations Using Different Data Fields |
| US9269095B1 (en) * | 2015-03-20 | 2016-02-23 | TappingStone Inc. | Methods and systems for visual replay of predictive engine performance |
| US20160224626A1 (en) * | 2015-01-30 | 2016-08-04 | Splunk, Inc. | Column-based table maninpulation of event data |
| US20160224532A1 (en) * | 2015-01-30 | 2016-08-04 | Splunk Inc. | Data summary view |
| US20160224643A1 (en) * | 2015-01-30 | 2016-08-04 | Splunk Inc. | Extracting From Extracted Event Fields |
| US20160224625A1 (en) * | 2015-01-30 | 2016-08-04 | Splunk, Inc. | Events Sets In A Visually Distinct Display Format |
| US20160321369A1 (en) * | 2012-09-07 | 2016-11-03 | Splunk Inc. | Graphically Selectable Filter Parameters for Field Data in a Set of Machine Data |
| US9842160B2 (en) * | 2015-01-30 | 2017-12-12 | Splunk, Inc. | Defining fields from particular occurences of field labels in events |
-
2017
- 2017-01-31 US US15/421,408 patent/US10565220B2/en active Active
Patent Citations (22)
| Publication number | Priority date | Publication date | Assignee | Title |
|---|---|---|---|---|
| US20110295871A1 (en) * | 2006-01-25 | 2011-12-01 | Microsoft Corporation | Filtering and Sorting Information |
| US20130238631A1 (en) * | 2012-03-11 | 2013-09-12 | International Business Machines Corporation | Indexing and searching entity-relationship data |
| US20150149879A1 (en) * | 2012-09-07 | 2015-05-28 | Splunk Inc. | Advanced field extractor with multiple positive examples |
| US20150154269A1 (en) * | 2012-09-07 | 2015-06-04 | Splunk Inc. | Advanced field extractor with modification of an extracted field |
| US20170139887A1 (en) * | 2012-09-07 | 2017-05-18 | Splunk, Inc. | Advanced field extractor with modification of an extracted field |
| US20160321369A1 (en) * | 2012-09-07 | 2016-11-03 | Splunk Inc. | Graphically Selectable Filter Parameters for Field Data in a Set of Machine Data |
| US20140095540A1 (en) * | 2012-09-28 | 2014-04-03 | Oracle International Corporation | Mechanism to chain continuous queries |
| US20150039651A1 (en) * | 2013-07-31 | 2015-02-05 | Splunk Inc. | Templates for defining fields in machine data |
| US9437022B2 (en) * | 2014-01-27 | 2016-09-06 | Splunk Inc. | Time-based visualization of the number of events having various values for a field |
| US20150213631A1 (en) * | 2014-01-27 | 2015-07-30 | Splunk Inc. | Time-based visualization of the number of events having various values for a field |
| US20170032550A1 (en) * | 2014-01-27 | 2017-02-02 | Splunk Inc. | Visualization of Unique Field Values for a Field in a Set of Events |
| US20150278214A1 (en) * | 2014-04-01 | 2015-10-01 | Tableau Software, Inc. | Systems and Methods for Ranking Data Visualizations Using Different Data Fields |
| US20160224532A1 (en) * | 2015-01-30 | 2016-08-04 | Splunk Inc. | Data summary view |
| US20160225271A1 (en) * | 2015-01-30 | 2016-08-04 | Splunk Inc. | Interface templates for query commands |
| US20160224676A1 (en) * | 2015-01-30 | 2016-08-04 | Splunk Inc. | Data summary view with filtering |
| US20160224625A1 (en) * | 2015-01-30 | 2016-08-04 | Splunk, Inc. | Events Sets In A Visually Distinct Display Format |
| US20160224618A1 (en) * | 2015-01-30 | 2016-08-04 | Splunk Inc. | Cell-based table manipulation of event data |
| US20160224643A1 (en) * | 2015-01-30 | 2016-08-04 | Splunk Inc. | Extracting From Extracted Event Fields |
| US20160224626A1 (en) * | 2015-01-30 | 2016-08-04 | Splunk, Inc. | Column-based table maninpulation of event data |
| US9842160B2 (en) * | 2015-01-30 | 2017-12-12 | Splunk, Inc. | Defining fields from particular occurences of field labels in events |
| US9977803B2 (en) * | 2015-01-30 | 2018-05-22 | Splunk Inc. | Column-based table manipulation of event data |
| US9269095B1 (en) * | 2015-03-20 | 2016-02-23 | TappingStone Inc. | Methods and systems for visual replay of predictive engine performance |
Cited By (25)
| Publication number | Priority date | Publication date | Assignee | Title |
|---|---|---|---|---|
| US11651149B1 (en) | 2012-09-07 | 2023-05-16 | Splunk Inc. | Event selection via graphical user interface control |
| US20200034414A1 (en) * | 2012-09-07 | 2020-01-30 | Splunk Inc. | Determining an extraction rule from positive and negative examples |
| US11042697B2 (en) * | 2012-09-07 | 2021-06-22 | Splunk Inc. | Determining an extraction rule from positive and negative examples |
| US11423216B2 (en) | 2012-09-07 | 2022-08-23 | Splunk Inc. | Providing extraction results for a particular field |
| US11106691B2 (en) | 2013-01-22 | 2021-08-31 | Splunk Inc. | Automated extraction rule generation using a timestamp selector |
| US11709850B1 (en) | 2013-01-22 | 2023-07-25 | Splunk Inc. | Using a timestamp selector to select a time information and a type of time information |
| US11822372B1 (en) | 2013-01-23 | 2023-11-21 | Splunk Inc. | Automated extraction rule modification based on rejected field values |
| US11210325B2 (en) | 2013-01-23 | 2021-12-28 | Splunk Inc. | Automatic rule modification |
| US11782678B1 (en) | 2013-01-23 | 2023-10-10 | Splunk Inc. | Graphical user interface for extraction rules |
| US11119728B2 (en) | 2013-01-23 | 2021-09-14 | Splunk Inc. | Displaying event records with emphasized fields |
| US11556577B2 (en) | 2013-01-23 | 2023-01-17 | Splunk Inc. | Filtering event records based on selected extracted value |
| US11514086B2 (en) | 2013-01-23 | 2022-11-29 | Splunk Inc. | Generating statistics associated with unique field values |
| US10802797B2 (en) * | 2013-01-23 | 2020-10-13 | Splunk Inc. | Providing an extraction rule associated with a selected portion of an event |
| US11469977B2 (en) | 2020-04-21 | 2022-10-11 | Aviatrix Systems, Inc. | System and method for generating a network health dashboard for a multi-cloud environment |
| US11356344B2 (en) | 2020-04-21 | 2022-06-07 | Aviatrix Systems, Inc. | System and method for deploying a distributed cloud management system configured for generating interactive user interfaces of the state of a multi-cloud environment over time |
| US11658890B1 (en) | 2020-04-21 | 2023-05-23 | Aviatrix Systems, Inc. | System and method for deploying a distributed cloud management system configured for generating interactive user interfaces detailing link latencies |
| US11671337B2 (en) | 2020-04-21 | 2023-06-06 | Aviatrix Systems, Inc. | System, method and apparatus for generating and searching a topology of resources among multiple cloud computing environments |
| US11695661B1 (en) | 2020-04-21 | 2023-07-04 | Aviatrix Systems, Inc. | Systems and methods for deploying a cloud management system configured for tagging constructs deployed in a multi-cloud environment |
| US11283695B2 (en) | 2020-04-21 | 2022-03-22 | Aviatrix Systems, Inc. | System and method for determination of network operation metrics and generation of network operation metrics visualizations |
| US11722387B1 (en) | 2020-04-21 | 2023-08-08 | Aviatrix Systems, Inc. | System and method for determination of network operation metrics and generation of network operation metrics visualizations |
| US11265233B2 (en) | 2020-04-21 | 2022-03-01 | Aviatrix Systems, Inc. | System and method for generating a global traffic heat map |
| US11159383B1 (en) * | 2020-04-21 | 2021-10-26 | Aviatrix Systems, Inc. | Systems and methods for deploying a cloud management system configured for tagging constructs deployed in a multi-cloud environment |
| US11863410B2 (en) | 2020-04-21 | 2024-01-02 | Aviatrix Systems, Inc. | System and method for conducting intelligent traffic flow analytics |
| US20220224587A1 (en) * | 2021-01-07 | 2022-07-14 | Servicenow, Inc. | Systems and methods for ranked visualization of events |
| US11777792B2 (en) * | 2021-01-07 | 2023-10-03 | Servicenow, Inc. | Systems and methods for ranked visualization of events |
Also Published As
| Publication number | Publication date |
|---|---|
| US20180218050A1 (en) | 2018-08-02 |
Similar Documents
| Publication | Publication Date | Title |
|---|---|---|
| US11855863B1 (en) | Animated visualizations of network activity across network address spaces | |
| US11677760B2 (en) | Executing modular alerts and associated security actions | |
| US11075825B2 (en) | Generating and displaying topology map time-lapses of cloud computing resources | |
| US11934418B2 (en) | Reducing index file size based on event attributes | |
| US11736502B2 (en) | Generating meta-notable event summary information | |
| US10565220B2 (en) | Generating visualizations for search results data containing multiple data dimensions | |
| US11750663B2 (en) | Threat identification-based collection of forensic data from endpoint devices | |
| US20210149912A1 (en) | Clustering events while excluding extracted values | |
| US11232125B1 (en) | Conversion of cloud computing platform data for ingestion by data intake and query system | |
| US10387448B2 (en) | Replication of summary data in a clustered computing environment | |
| US10693743B2 (en) | Displaying interactive topology maps of cloud computing resources | |
| US20190356676A1 (en) | Correlating forensic and non-forensic data in an information technology environment | |
| US11514006B2 (en) | Modifying event generation rules responsive to detected schema changes | |
| US20230273936A1 (en) | Disaster recovery in a clustered environment using generation identifiers |
Legal Events
| Date | Code | Title | Description |
|---|---|---|---|
| AS | Assignment |
Owner name: SPLUNK INC., CALIFORNIA Free format text: ASSIGNMENT OF ASSIGNORS INTEREST;ASSIGNORS:PORATH, MICHAEL;AGNEW, MARSHALL C.;NG, HO LUN;REEL/FRAME:041239/0167 Effective date: 20170131 |
|
| AS | Assignment |
Owner name: SPLUNK INC., CALIFORNIA Free format text: ASSIGNMENT OF ASSIGNORS INTEREST;ASSIGNOR:REYES, BRIAN;REEL/FRAME:042574/0335 Effective date: 20170531 |
|
| STPP | Information on status: patent application and granting procedure in general |
Free format text: NON FINAL ACTION MAILED |
|
| STPP | Information on status: patent application and granting procedure in general |
Free format text: RESPONSE TO NON-FINAL OFFICE ACTION ENTERED AND FORWARDED TO EXAMINER |
|
| STPP | Information on status: patent application and granting procedure in general |
Free format text: FINAL REJECTION MAILED |
|
| STPP | Information on status: patent application and granting procedure in general |
Free format text: ADVISORY ACTION MAILED |
|
| STPP | Information on status: patent application and granting procedure in general |
Free format text: DOCKETED NEW CASE - READY FOR EXAMINATION |
|
| STPP | Information on status: patent application and granting procedure in general |
Free format text: NOTICE OF ALLOWANCE MAILED -- APPLICATION RECEIVED IN OFFICE OF PUBLICATIONS |
|
| STPP | Information on status: patent application and granting procedure in general |
Free format text: PUBLICATIONS -- ISSUE FEE PAYMENT RECEIVED |
|
| STCF | Information on status: patent grant |
Free format text: PATENTED CASE |
|
| MAFP | Maintenance fee payment |
Free format text: PAYMENT OF MAINTENANCE FEE, 4TH YEAR, LARGE ENTITY (ORIGINAL EVENT CODE: M1551); ENTITY STATUS OF PATENT OWNER: LARGE ENTITY Year of fee payment: 4 |