US10401284B2 - Spectroscopic characterization of seafood - Google Patents
Spectroscopic characterization of seafood Download PDFInfo
- Publication number
- US10401284B2 US10401284B2 US15/131,654 US201615131654A US10401284B2 US 10401284 B2 US10401284 B2 US 10401284B2 US 201615131654 A US201615131654 A US 201615131654A US 10401284 B2 US10401284 B2 US 10401284B2
- Authority
- US
- United States
- Prior art keywords
- seafood
- spectra
- type
- information associated
- sample
- Prior art date
- Legal status (The legal status is an assumption and is not a legal conclusion. Google has not performed a legal analysis and makes no representation as to the accuracy of the status listed.)
- Active, expires
Links
Images


Classifications
-
- G—PHYSICS
- G01—MEASURING; TESTING
- G01N—INVESTIGATING OR ANALYSING MATERIALS BY DETERMINING THEIR CHEMICAL OR PHYSICAL PROPERTIES
- G01N21/00—Investigating or analysing materials by the use of optical means, i.e. using sub-millimetre waves, infrared, visible or ultraviolet light
- G01N21/17—Systems in which incident light is modified in accordance with the properties of the material investigated
- G01N21/25—Colour; Spectral properties, i.e. comparison of effect of material on the light at two or more different wavelengths or wavelength bands
- G01N21/31—Investigating relative effect of material at wavelengths characteristic of specific elements or molecules, e.g. atomic absorption spectrometry
- G01N21/35—Investigating relative effect of material at wavelengths characteristic of specific elements or molecules, e.g. atomic absorption spectrometry using infrared light
- G01N21/359—Investigating relative effect of material at wavelengths characteristic of specific elements or molecules, e.g. atomic absorption spectrometry using infrared light using near infrared light
-
- G—PHYSICS
- G01—MEASURING; TESTING
- G01N—INVESTIGATING OR ANALYSING MATERIALS BY DETERMINING THEIR CHEMICAL OR PHYSICAL PROPERTIES
- G01N21/00—Investigating or analysing materials by the use of optical means, i.e. using sub-millimetre waves, infrared, visible or ultraviolet light
- G01N21/01—Arrangements or apparatus for facilitating the optical investigation
-
- G—PHYSICS
- G01—MEASURING; TESTING
- G01J—MEASUREMENT OF INTENSITY, VELOCITY, SPECTRAL CONTENT, POLARISATION, PHASE OR PULSE CHARACTERISTICS OF INFRARED, VISIBLE OR ULTRAVIOLET LIGHT; COLORIMETRY; RADIATION PYROMETRY
- G01J3/00—Spectrometry; Spectrophotometry; Monochromators; Measuring colours
- G01J3/02—Details
- G01J3/0205—Optical elements not provided otherwise, e.g. optical manifolds, diffusers, windows
- G01J3/0216—Optical elements not provided otherwise, e.g. optical manifolds, diffusers, windows using light concentrators or collectors or condensers
-
- G—PHYSICS
- G01—MEASURING; TESTING
- G01J—MEASUREMENT OF INTENSITY, VELOCITY, SPECTRAL CONTENT, POLARISATION, PHASE OR PULSE CHARACTERISTICS OF INFRARED, VISIBLE OR ULTRAVIOLET LIGHT; COLORIMETRY; RADIATION PYROMETRY
- G01J3/00—Spectrometry; Spectrophotometry; Monochromators; Measuring colours
- G01J3/12—Generating the spectrum; Monochromators
- G01J3/26—Generating the spectrum; Monochromators using multiple reflection, e.g. Fabry-Perot interferometer, variable interference filters
-
- G—PHYSICS
- G01—MEASURING; TESTING
- G01J—MEASUREMENT OF INTENSITY, VELOCITY, SPECTRAL CONTENT, POLARISATION, PHASE OR PULSE CHARACTERISTICS OF INFRARED, VISIBLE OR ULTRAVIOLET LIGHT; COLORIMETRY; RADIATION PYROMETRY
- G01J3/00—Spectrometry; Spectrophotometry; Monochromators; Measuring colours
- G01J3/28—Investigating the spectrum
- G01J3/2803—Investigating the spectrum using photoelectric array detector
-
- G—PHYSICS
- G01—MEASURING; TESTING
- G01N—INVESTIGATING OR ANALYSING MATERIALS BY DETERMINING THEIR CHEMICAL OR PHYSICAL PROPERTIES
- G01N21/00—Investigating or analysing materials by the use of optical means, i.e. using sub-millimetre waves, infrared, visible or ultraviolet light
- G01N21/17—Systems in which incident light is modified in accordance with the properties of the material investigated
- G01N21/25—Colour; Spectral properties, i.e. comparison of effect of material on the light at two or more different wavelengths or wavelength bands
- G01N21/27—Colour; Spectral properties, i.e. comparison of effect of material on the light at two or more different wavelengths or wavelength bands using photo-electric detection ; circuits for computing concentration
-
- G—PHYSICS
- G01—MEASURING; TESTING
- G01N—INVESTIGATING OR ANALYSING MATERIALS BY DETERMINING THEIR CHEMICAL OR PHYSICAL PROPERTIES
- G01N21/00—Investigating or analysing materials by the use of optical means, i.e. using sub-millimetre waves, infrared, visible or ultraviolet light
- G01N21/17—Systems in which incident light is modified in accordance with the properties of the material investigated
- G01N21/25—Colour; Spectral properties, i.e. comparison of effect of material on the light at two or more different wavelengths or wavelength bands
- G01N21/31—Investigating relative effect of material at wavelengths characteristic of specific elements or molecules, e.g. atomic absorption spectrometry
- G01N21/35—Investigating relative effect of material at wavelengths characteristic of specific elements or molecules, e.g. atomic absorption spectrometry using infrared light
- G01N21/3563—Investigating relative effect of material at wavelengths characteristic of specific elements or molecules, e.g. atomic absorption spectrometry using infrared light for analysing solids; Preparation of samples therefor
-
- G—PHYSICS
- G01—MEASURING; TESTING
- G01N—INVESTIGATING OR ANALYSING MATERIALS BY DETERMINING THEIR CHEMICAL OR PHYSICAL PROPERTIES
- G01N21/00—Investigating or analysing materials by the use of optical means, i.e. using sub-millimetre waves, infrared, visible or ultraviolet light
- G01N21/17—Systems in which incident light is modified in accordance with the properties of the material investigated
- G01N21/55—Specular reflectivity
-
- G—PHYSICS
- G01—MEASURING; TESTING
- G01N—INVESTIGATING OR ANALYSING MATERIALS BY DETERMINING THEIR CHEMICAL OR PHYSICAL PROPERTIES
- G01N33/00—Investigating or analysing materials by specific methods not covered by groups G01N1/00 - G01N31/00
- G01N33/02—Food
- G01N33/12—Meat; Fish
-
- G—PHYSICS
- G01—MEASURING; TESTING
- G01J—MEASUREMENT OF INTENSITY, VELOCITY, SPECTRAL CONTENT, POLARISATION, PHASE OR PULSE CHARACTERISTICS OF INFRARED, VISIBLE OR ULTRAVIOLET LIGHT; COLORIMETRY; RADIATION PYROMETRY
- G01J3/00—Spectrometry; Spectrophotometry; Monochromators; Measuring colours
- G01J3/12—Generating the spectrum; Monochromators
- G01J2003/1226—Interference filters
- G01J2003/1234—Continuously variable IF [CVIF]; Wedge type
-
- G—PHYSICS
- G01—MEASURING; TESTING
- G01J—MEASUREMENT OF INTENSITY, VELOCITY, SPECTRAL CONTENT, POLARISATION, PHASE OR PULSE CHARACTERISTICS OF INFRARED, VISIBLE OR ULTRAVIOLET LIGHT; COLORIMETRY; RADIATION PYROMETRY
- G01J3/00—Spectrometry; Spectrophotometry; Monochromators; Measuring colours
- G01J3/28—Investigating the spectrum
- G01J2003/2866—Markers; Calibrating of scan
- G01J2003/2873—Storing reference spectrum
-
- G—PHYSICS
- G01—MEASURING; TESTING
- G01N—INVESTIGATING OR ANALYSING MATERIALS BY DETERMINING THEIR CHEMICAL OR PHYSICAL PROPERTIES
- G01N2201/00—Features of devices classified in G01N21/00
- G01N2201/02—Mechanical
- G01N2201/022—Casings
- G01N2201/0221—Portable; cableless; compact; hand-held
-
- G—PHYSICS
- G01—MEASURING; TESTING
- G01N—INVESTIGATING OR ANALYSING MATERIALS BY DETERMINING THEIR CHEMICAL OR PHYSICAL PROPERTIES
- G01N2201/00—Features of devices classified in G01N21/00
- G01N2201/06—Illumination; Optics
- G01N2201/061—Sources
-
- G—PHYSICS
- G01—MEASURING; TESTING
- G01N—INVESTIGATING OR ANALYSING MATERIALS BY DETERMINING THEIR CHEMICAL OR PHYSICAL PROPERTIES
- G01N2201/00—Features of devices classified in G01N21/00
- G01N2201/12—Circuits of general importance; Signal processing
Definitions
- the present invention relates to materials characterization and identification, and in particular to spectroscopic characterization of seafood.
- the supply chain “from boat to plate” is complex and unregulated, making such illegal activities difficult to track.
- Combating fish fraud requires traceability of fish supply across the entire supply chain, as well as and increased inspection.
- DNA testing for inspection is time consuming and can only be done on a sampling basis. The DNA testing requires taking samples of fish to a lab and waiting for results, —a process that can take days.
- FT-IR Fourier Transform Infrared
- An FT-IR spectrometer is a complex and bulky optical device. Its core module, a scanning Michelson interferometer, uses a precisely movable large optical mirror to perform a wavelength scan. To stabilize the mirror, a heavy optical bench is used. Due to many precision optical and mechanical components, an FT-IR spectrometer requires laboratory conditions, and needs to be re-calibrated and re-aligned frequently by trained personnel. The use of an FT-IR spectrometer is dictated by the fact that the fundamental vibrational frequencies of the infrared fingerprint are present in the 2.5 to 5 micrometers region of the electromagnetic spectrum. These vibrational bands are of high resolution and high absorption levels, showing strong absorption with narrow spectral bands.
- Monro in U.S. Pat. No. 7,750,299 discloses a system for active biometric spectroscopy, in which a DNA film of a particular biological subject is irradiated by a frequency-tunable millimeter-wave radio transmitter, and radio waves transmitted and scattered by the DNA film are detected.
- Monro teaches that radio wave scattering spectra of different DNA films are different. Therefore, transmitted or scattered radio wave spectrum can detect different DNA films, which can be associated with different fish species. In this way, species of a fish sample can be identified.
- THz radiation occupies a frequency band between infrared and millimeter radio waves.
- Many explosive materials have a unique spectral signature in THz frequency domain, thus affording a non-invasive, remote detection of explosives with a high sensitivity.
- THz radiation sources are bulky and expensive, limiting their current use to security-critical applications such as at airport security checkpoints.
- a method and system are required that would enable a food and drug administration (FDA) official perform a quick on-the-spot seafood species identification and characterization, assisting the official in deciding whether to take a law enforcement action.
- FDA food and drug administration
- NIR near infrared
- Broadband light emitting diodes and even miniature incandescent sources can be used for generation of NIR light in this wavelength band.
- a variety of spectrally selective elements, e.g. thin-film interference filters, are available for wavelength separation.
- Photodiode arrays are available for detection of NIR light.
- PCA Principle Component Analysis
- SIMCA Soft Independent Modeling of Class Analogy
- PLS-DA Partial Least Square Discriminant Analysis
- SVM Support Vector Machine
- a method for field authentication of a seafood sample comprising:
- step (b) obtaining a reflection spectrum of the seafood sample using the NIR spectrometer of step (a);
- step (c) performing a multivariate pattern recognition analysis of the reflection spectrum of the seafood sample obtained in step (b) to determine a matching spectrum with a most similar spectral pattern by comparing the reflection spectrum to a library of known identity spectra corresponding to different species of seafood;
- step (d) identifying the seafood sample based on the matching spectrum bearing the most similar spectral pattern determined in step (c).
- pattern recognition algorithms can also generate a confidence measure, or a probability estimate, of a likelihood of the identification result.
- a method for field determination of freshness of a seafood sample comprising:
- step (b) obtaining a reflection spectrum of the seafood sample using the NIR spectrometer of step (a);
- step (c) performing a multivariate pattern recognition analysis of the reflection spectrum of the seafood sample obtained in step (b) to determine a matching spectrum with a most similar spectral pattern by comparing the reflection spectrum to a library of known identity spectra corresponding to the freshness of the seafood sample, thereby providing a quantitative measure of the freshness of the seafood sample.
- the reflection spectrum can be obtained from a plurality of locations on the seafood sample to reduce the effect of surface texture of the seafood sample.
- the multivariate regression analysis can include e.g. Partial Least Square (PLS) and Support Vector Regression (SVR).
- an apparatus for field authentication of a seafood sample comprising:
- an analyzer operationally coupled to the spectrometer and configured for performing a multivariate pattern recognition analysis of the reflection spectrum of the seafood samples to determine a matching spectrum with a most similar spectral pattern by comparing the reflection spectrum to a library of known identity spectra corresponding to different species of seafood, and to identify the seafood sample based on the matching spectrum bearing the most similar spectral pattern.
- the portable NIR spectrometer can include a spectrally laterally variable optical transmission filter coupled to a photodetector array, resulting in a particularly compact and lightweight structure.
- a mobile communication device can be configured to communicate with the NIR spectrometer and perform the multivariate analysis of the reflection spectra obtained by the portable NIR spectrometer. Furthermore, at least some data analysis and spectra pattern models building activities can be performed at a remote server in communication with the mobile device.
- a non-transitory storage medium disposed in the mobile communication device and having encoded thereon the library of the known identity spectra.
- FIG. 1 is a schematic three-dimensional view of an apparatus for field authentication of a seafood sample according to the invention, superimposed with an NIR reflection spectrum measured by the apparatus;
- FIG. 2 is a side cross-sectional view of a portable handheld NIR spectrometer of the apparatus of FIG. 1 ;
- FIG. 3A is a side cross-sectional view of a light detection subassembly the portable NIR spectrometer of FIG. 2 ;
- FIG. 3B is a side cross-sectional view of a wavelength dispersive element used in the light detection subassembly of FIG. 3A ;
- FIG. 3C is a transmission spectrum of the wavelength dispersive element of FIG. 3B ;
- FIG. 3D is a three-dimensional view of the portable handheld NIR spectrometer of FIG. 2 ;
- FIG. 4A is a flow chart of a method for field authentication of a seafood sample according to the invention.
- FIG. 4B is a flow chart of an exemplary multivariate analysis of the NIR spectra according to the invention.
- FIG. 5A is a schematic view of one embodiment of the apparatus of the invention, in which a portable device in wireless communication with the NIR spectrometer is used to analyze NIR spectra obtained by the NIR spectrometer;
- FIG. 5B is a schematic view of another embodiment of the apparatus of the invention, in which the portable device is used to relay the measured NIR spectra to a remote server for performing the multivariate analysis;
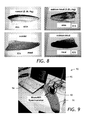
- FIGS. 6 to 8 are color photographs of seafood pairs to be discriminated between, including: red mullet/mullet pair ( FIG. 6 ); winter codfish/codfish pair (skin and meat— FIG. 7 ); and samlet/salmon trout (skin and meat— FIG. 8 ), used in experimental verification of the invention;
- FIG. 9 is a color photograph of a prototype of the apparatus measuring a NIR spectrum of a salmon sample
- FIGS. 10A and 10B are flow charts of data collection and analysis for higher and lower quality seafood, respectively, used in the experimental verification
- FIGS. 11, 14, and 17 are measured diffuse reflection spectra of the red mullet/mullet pair, winter codfish/codfish pair, and samlet/salmon trout pair, respectively;
- FIGS. 12, 15, and 18 are three-dimensional score plots of principal component analysis (PCA) models of the red mullet/mullet pair, winter codfish/codfish pair, and samlet/salmon trout pair, respectively; and
- PCA principal component analysis
- FIGS. 13A , B; 16 A, B; and 19 A, B are Coomans plots of Soft Independent Modeling of Class Analogy (SIMCA) analyses of the red mullet/mullet pair, winter codfish/codfish pair, and samlet/salmon trout pair, respectively.
- SIMCA Soft Independent Modeling of Class Analogy
- an apparatus 10 for field authentication of a seafood sample 11 includes a portable NIR spectrometer 12 for obtaining a diffuse NIR reflection spectrum 13 (signal power P vs. wavelength ⁇ ) of the seafood sample 11 .
- An analyzer 14 is operationally coupled e.g. via a cable 15 to the spectrometer 12 .
- the analyzer 14 is configured to perform a multivariate analysis of the reflection spectrum 13 of the seafood sample 11 to determine at least one characteristic parameter corresponding to the reflection spectrum 13 .
- the analyzer 14 is configured for comparing the at least one parameter to a threshold corresponding to species of the seafood sample 11 , for determination of the species of the seafood sample 11 .
- the species can be displayed on a display 16 of the analyzer 14 .
- the at least one parameter can include two or more parameters.
- the two parameters can be represented graphically as a point on an XY plot called Coomans plot.
- a position of the point on the Coomans plot is indicative of the seafood species of which the reflection spectrum 13 was taken.
- Multivariate regression/pattern recognition analysis and Coomans plots will be considered in detail further below.
- the construction of the NIR spectrometer 12 is considered first.
- the NIR spectrometer 12 includes a body 23 , incandescent lamps 24 for illuminating the seafood sample 11 , a tapered light pipe (TLP) 25 for guiding diffusely reflected light 36 , a laterally variable filter (LVF) 31 for separating the reflected light 36 into individual wavelengths, and a photodetector array 37 for detecting optical power levels of the individual wavelengths.
- the photodetector array 37 is formed in a CMOS processing chip 37 A and coupled to the LVF 31 with a optically transmissive adhesive 38 .
- An electronics board 37 B is provided to support and control the CMOS processing chip 37 A.
- An optional pushbutton 21 is provided to initiate the spectra collection.
- the photodetector array 37 is aligned perpendicular to a longitudinal axis LA of the TLP 25 .
- the incandescent lamps 24 illuminate the seafood sample 11 .
- the TLP 25 collects the diffusely reflected light 36 and direct it towards the LVF 31 .
- the LVF 31 separates the diffusely reflected light 36 into individual wavelengths, which are detected by the photodetector array 31 .
- the measurement cycle can be initiated by pressing the pushbutton 21 , or by an external command from the analyzer 14 .
- the compact size of the NIR spectrometer 12 is enabled by the construction of its light detection subassembly 29 .
- the light detection subassembly 29 is shown in XZ plane.
- the light detection subassembly 29 is flipped by 180 degrees as indicated by the direction of the z-axis on the right side of FIGS. 2 and 3A .
- the optically transparent adhesive 38 directly couples the photodetector array 37 to the LVF 31 .
- the optically transparent adhesive 38 needs to: be electrically non-conductive or dielectric in nature; be mechanically neutral by achieving good adhesion strength with inducing stress or destructive forces to the detector array 37 ; optically compatible to transmit the desired spectral content; remove reflection created at air to glass interfaces; and have reasonable coefficient of thermal expansion properties to minimize stress to the detector pixels 52 during curing and during thermal cycling.
- Am opaque epoxy 22 encapsulates the LVF 31 , facilitating removal of stray light and protecting the LVF 31 from humidity.
- An optional glass window 39 is placed on top of the LVF 31 for additional environmental protection.
- the LVF 31 is shown in YZ plane, in which the wavelengths are dispersed.
- the LVF 31 includes a wedged spacer 32 sandwiched between wedged dichroic mirrors 33 , to form a Fabry-Perot interferometer with a laterally variable spacing between the dichroic mirrors 33 .
- the wedge shape of the optical transmission filter 31 makes its transmission wavelength laterally variable, as shown with arrows 34 A, 34 B, and 34 C pointing to individual transmission peaks 35 A, 35 B, and 35 C, respectively, of a transmission spectrum 35 ( FIG. 3C ) shown under the variable optical transmission filter 31 .
- the polychromatic light 36 reflected from the seafood sample 11 impinges on the variable optical filter 31 , which separates the polychromatic light 36 into individual spectral components shown with the arrows 43 A to 34 C.
- the wavelength range of the NIR spectrometer 12 is preferably between 700 nm and 2500 nm, and more preferably between 950 nm and 1950 nm.
- the NIR spectrometer 12 is free of any moving parts for wavelength scanning. Small weight of the NIR spectrometer 12 , typically less than 100 g, allows a direct placement of the NIR spectrometer 12 onto the seafood sample 11 . Small weight and size also makes the NIR spectrometer 12 easily transportable e.g. in a pocket of a food inspector.
- the size of the NIR spectrometer 12 is illustrated in FIG. 3D .
- the NIR spectrometer 12 can easily be held in hand, with the pushbutton 21 conveniently located for thumb operation.
- the incandescent bulbs 24 can be replaced with broadband light emitting diodes or LEDs.
- the TLP 25 can be replaced with another optical element, such as a fiber optic plate or a holographic beam shaper.
- the LVF 31 can be replaced with another suitable wavelength-selective element such as a miniature diffraction grating, an array of dichroic mirrors, a MEMS device, etc.
- a method 40 for field authentication of the seafood sample 11 includes a step 41 of providing the portable NIR spectrometer 12 described above.
- the reflection spectrum 13 of the seafood sample 11 is obtained using the NIR spectrometer 12 .
- a multivariate pattern recognition analysis of the reflection spectrum 13 of the seafood sample 11 is performed to determine a matching spectrum with a most similar spectral pattern by comparing the reflection spectrum 13 to a library of known identity spectra corresponding to different species of seafood.
- the seafood sample 11 is identified based on the matching spectrum bearing the most similar spectral pattern determined in the previous step 43 .
- matching spectrum does not of course denote an exact match. Instead, it denotes an identity spectrum of the library, carrying the most similar spectral pattern, as compared to the measured reflection spectrum 13 . Thus, the “match” does not have to be exact, only the closest match of those available. The proximity of the match can be calculated based on the particular matching evaluation method used.
- the multivariate pattern recognition analysis 43 is performed to extract seafood species information from the reflection spectrum 13 . Due to multitude of overtones of vibrational frequencies of characteristic molecular bonds, the reflection spectrum 13 can be very complex, so that individual spectral peaks cannot be visually identified. According to the invention, the multivariate pattern recognition analysis 43 , also known as “chemometric analysis”, is performed to identify or authenticate species of the seafood sample 11 .
- the measuring step 42 preferably includes performing repetitive spectral measurements at different locations on the seafood sample 11 , and averaging the repetitive measurements, to lessen a dependence of the obtained reflection spectrum on a texture of the seafood sample 11 .
- Extended Multiplicative Scatter Correction (EMSC) of the reflection spectrum 13 can be used to reduce dependence of the measured reflection spectrum 13 on scattering properties of the seafood sample 11 .
- the reflection spectrum 13 can also be pre-processed using other known statistical methods, e.g. a Standard Normal Variation (SNV) of the reflection spectrum 13 can be computed before proceeding to the multivariate pattern recognition analysis step 43 .
- SNV Standard Normal Variation
- the slope and/or inflection of the spectral features in the reflection spectrum 13 can be accounted for by performing Savitzky-Golay filtering of the reflection spectrum 13 , and computing a first and/or second derivative of the reflection spectrum 13 to be accounted for in the multivariate pattern recognition analysis step 43 .
- Other statistical methods such as sample-wise normalization and/or channel-wise auto-scaling of the reflection spectrum 13 , can be used to facilitate the multivariate pattern recognition analysis step 43 , and to provide more stable results.
- the multivariate pattern recognition analysis 43 is usually performed in two stages.
- a PCA step 45 is performed at first, to define a calibration model for each seafood type that needs to be identified.
- the PCA step 45 can be done in advance, before measuring the seafood sample 11 , at a calibration stage of the apparatus 10 .
- a second step 46 similarities between the collected reflection spectrum 13 and the calibration models of different seafood species are analyzed.
- SIMCA soft independent modeling of class analogies
- two parameters are determined. These two parameters are plotted in a XY plot (Coomans plot), different areas of which correspond to different seafood species.
- FIGS. 4A and 4B an apparatus 50 A for field authentication of the seafood sample 11 is similar to the apparatus 10 of FIG. 1 .
- a mobile communication device 54 is configured to perform the multivariate analysis step 43 and the identification step 44 of the method 40 of FIG. 4A .
- the mobile communication device 54 can include a non-transitory storage medium 58 having encoded thereon the library of the known identity spectra corresponding to different species of seafood, and/or computer instructions for performing the multivariate pattern recognition/data reduction analysis step 43 .
- the mobile communication device 54 can be coupled to the NIR spectrometer 12 via a wireless link 59 such as BluetoothTM, or via a wired e.g. USB communication, for communicating the obtained reflection spectrum 13 to the mobile communication device 54 .
- an apparatus 50 B for field authentication of a seafood sample is similar to the apparatus 50 A of FIG. 5A .
- the apparatus 50 B of FIG. 5B includes a remote server 57 in communication with the mobile communication device 54 via an RF communication link 56 to a cell tower 55 connected to the Internet 52 .
- the reflection spectrum 13 is communicated from the mobile device 54 to the remote server 57 , and the multivariate pattern recognition analysis, i.e. the step 43 of the method 40 of FIG. 4A , is performed at the remote server 57 .
- the result of the multivariate analysis step 43 ( FIG. 4A ) is communicated back to the mobile device 54 ( FIG.
- the identification step 44 ( FIG. 4A ) can be performed either by the mobile device 54 or by the remote server 57 ( FIG. 5B ). Using the computational power of a remote server frees up the resources on the mobile communication device, and as a result can speed up the overall process of seafood identification.
- FIGS. 6 to 8 A number of experiments were performed to verify that similarly looking, but differently priced fish species can be identified using a combination of NIR spectroscopy and multivariate regression (chemometric) analysis.
- the first set included a whole red mullet 60 A and a whole mullet 60 B ( FIG. 6 ), both skin and meat (the meat is not shown).
- the second set included: winter codfish skin 71 A; codfish skin 71 B; winter codfish meat 72 A; and codfish meat 72 B.
- the third set included: samlet skin 81 A; salmon trout skin 81 B; samlet meat 82 A; and salmon trout meat 82 B. As can be seen from the photos of FIGS.
- the “A” group includes more expensive species 60 A, 71 A, 72 A, 81 A, and 82 A
- the “B” group includes less expensive species 60 B, 71 B, 72 B, 81 B, and 82 B.
- substitution of “A” species with “B” species can provide a substantial economic benefit.
- an apparatus 90 used in the experimental verification of the invention included MicroNIRTM 1700 spectrometer 92 manufactured by JDS Uniphase Corporation, Milpitas, Calif., USA.
- the MicroNIR spectrometer 92 was operated in a wavelength range of 950 nm to 1650 nm.
- the MicroNIR spectrometer 92 is a low-cost, ultra-compact portable spectrometer that weighs 60 grams and is less than 50 mm in diameter.
- the spectrometer 92 operates in a diffuse reflection and is constructed similarly to the spectrometer 12 of FIG.
- the spectrometer 92 is connected by a cable 95 to a laptop computer 94 running UnscramblerTM multivariate analysis software provided by CAMO AS, Oslo, Norway (version 9.6). For each spectral measurement, 50 scans having integration times of 5 milliseconds have been accumulated, resulting in a total measurement time of 0.25 seconds per reflection spectrum measurement.
- flow charts 100 A and 100 B represent spectra acquisition and PCA model building steps performed for the fish samples 60 A and 60 B; 71 A and 71 B; 72 A and 72 B; 81 A and 81 B; and 82 A and 82 B, respectively.
- steps 101 A and 101 B three different individual pieces were provided for each fish sample 60 A and 60 B; 71 A and 71 B; 72 A and 72 B; 81 A and 81 B; 82 A and 82 B, respectively, of FIGS. 6 to 8 .
- the skin reflection spectra were collected in steps 102 A and 102 B, respectively; and the meat reflection spectra were collected in steps 103 A and 103 B, respectively.
- a total of ten NIR reflection spectra were obtained at different positions on each of the three pieces, resulting in thirty measurements for each fish sample 60 A; 60 B; 71 A; 71 B; 72 A; 72 B; 81 A; 81 B; 82 A; and 82 B of FIGS. 6 to 8 .
- the spectra were corrected for scattering using a standard method of extended multiplicative scatter correction.
- the total of thirty spectra have been obtained for each fish skin type 60 A and 60 B; 71 A and 71 B; 81 A and 81 B in steps 104 A and 104 B, respectively.
- the total of thirty spectra have been obtained for each fish meat type 72 A and 72 B; 82 A and 82 B in steps 105 A and 105 B, respectively.
- the spectra have been averaged in groups of five for each of the three samples of each type in respective steps 106 A, 107 A; and 106 B, 107 B, resulting in two averaged spectra for each sample, and six averaged spectra for each sample type, including skin and meat.
- the averaging was done to lessen a dependence of the obtained reflection spectrum on a texture of respective the seafood samples 60 A; 60 B; 71 A; 71 B; 72 A; 72 B; 81 A; 81 B; 82 A; and 82 B.
- PCA models have been established in steps 108 A, 108 B for the respective “A” and “B” samples.
- a SIMCA analysis was performed to identify the type of each fish sample. The results were presented in form of Coomans plots for each fish type.
- reflection spectra of the red mullet 60 A and mullet 60 B are shown as dependence of reflection signal in arbitrary units on the wavenumber in inverse centimeters (cm ⁇ 1 ), in the range between 10900 to 6000 cm ⁇ 1 .
- Twelve traces including six spectra of red mullet skin and the six spectra of mullet skin are shown at 111 .
- Twelve traces including the respective six spectra of red mullet meat and six spectra of mullet meat are shown at 112 .
- red mullet skin score points 121 A are sufficiently separated from mullet skin score points 121 B to allow easy identification, but no clear separation was achieved between red mullet meat score points 122 A and mullet meat score points 122 B.
- FIGS. 13A and 13B results of SIMCA analysis of red mullet/mullet pair are presented in form of Coomans plots at 5% significance.
- FIG. 13A shows results of red mullet sample identification.
- Gray-colored circles 131 A represent calibration red mullet samples, skin and meat, used to obtain the identity spectra of red mullet;
- white-filled circles 131 B represent calibration mullet samples, skin and meat, used to obtain the identity spectra of mullet;
- filled (black) circles 132 represent the test sample.
- the total of four black circles correspond to one red mullet skin sample and one red mullet meat samples, each represented by two averaged spectra.
- FIG. 13B shows results of mullet sample identification.
- Filled (black) circles 133 represent two test samples. The total of eight black circles 133 correspond to two mullet skin samples and two mullet meat samples, each represented by two averaged spectra as explained above.
- reflection spectra of the winter cod skin 71 A, winter cod meat 72 A, cod skin 71 B, and cod meat 72 B are shown as dependence of reflection signal in arbitrary units on the wavenumber in inverse centimeters (cm ⁇ 1 ), in the range between 10900 to 6000 cm ⁇ 1 .
- Twelve traces including the six spectra of winter cod skin and the six spectra of cod skin are shown at 141 .
- Twelve traces including the respective six spectra of winter cod meat and six spectra of cod meat are shown at 142 .
- FIG. 15 the results of the PCA analysis steps 108 A, 108 B ( FIG. 10B ) are presented.
- winter cod skin score points 151 A appear interspersed with cod skin score points 151 B
- winter cod meat score points 152 A appear interspersed with cod meat score points 152 B, so no clear distinction can be made at this stage.
- FIGS. 16A and 16B results of SIMCA analysis of winter cod/cod pair are presented in form of Coomans plots at 5% significance.
- FIG. 16A shows results of cod sample identification.
- Gray-colored circles 161 A represent calibration winter cod samples, both skin and meat, used to obtain the identity spectra of winter cod;
- white-filled circles 161 B represent calibration cod samples, both skin and meat, used to obtain the identity spectra of cod;
- filled (black) circles 162 represent the test sample.
- the total of eight black circles correspond to two cod skin samples and two cod meat samples, each represented by two averaged spectra as explained above.
- FIG. 16B shows results of winter cod sample identification.
- Filled (black) circles 163 represent one test sample.
- the total of four black circles 163 correspond to one winter cod skin sample and one winter cod meat sample, each represented by two averaged spectra.
- reflection spectra of the samlet skin 81 A, samlet meat 82 A, salmon trout skin 81 B, and salmon trout meat 82 B are shown as dependence of reflection signal in arbitrary units on the wavenumber in inverse centimeters (cm ⁇ 1 ), in the range between 10900 to 6000 cm ⁇ 1 .
- Twelve traces including the six spectra of samlet skin and the six spectra of salmon trout skin are shown at 171 .
- Twelve traces including the respective six spectra of samlet meat and six spectra of salmon trout meat are shown at 172 .
- FIG. 18 the results of the PCA analysis steps 108 A, 108 B ( FIG. 10B ) are presented.
- samlet skin score points 181 A appear interspersed with salmon trout skin score points 181 B
- samlet meat score points 182 A appear interspersed with salmon trout meat score points 182 B, so that no clear distinction can be made at this stage.
- FIGS. 19A and 19B results of SIMCA analysis of samlet/salmon trout are presented in form of Coomans plots at 5% significance.
- FIG. 19A shows results of salmon trout sample identification.
- Gray-colored circles 191 A represent calibration samlet samples, both skin and meat, used to obtain the identity spectra of samlet;
- white-filled circles 191 B represent calibration salmon trout samples, both skin and meat, used to obtain the identity spectra of salmon trout;
- filled (black) circles 192 represent the test sample.
- the total of eight black circles correspond to two salmon trout skin samples and two salmon trout meat samples, each represented by two averaged spectra.
- FIG. 19B shows results of samlet sample identification.
- Filled (black) circles 193 represent two test samples. The total of four black circles 193 correspond to two samlet skin samples and two samlet meat samples, each represented by two averaged spectra. One can see from FIGS. 19A and 19B that samlet, both skin and meat, is readily identifiable and distinguishable from salmon trout.
- Table 1 summarizes successful prediction rate with alternate matching methods of the mullet and red mullet performed on a typical desktop computer.
- the spectra were auto-scaled before being sent to multivariate pattern classifiers.
- the last column of Table 1 provides the time it takes to build the predictive models.
- the time to perform prediction based on existing models are typically in the range of milliseconds.
- the time to build model can become important factors when one needs to do in-situ models updating.
- the speed of measurement and the speed of obtaining the results are important to be as short as possible.
- the accuracy of the results is important. From Table 1, one can see that methods such as SVM (with linear kernel) provide the best accuracy at the shortest time.
- the SVM method with Linear Kernel including Support Vector Classification (SVC) for qualitative analysis, and Support Vector Regression (SVR) for quantitative analysis, resulted in the prediction success rate of over 93%.
- SVC Support Vector Classification
- SVR Support Vector Regression
- LDA method it is assumed that all classes have identical covariance matrix and are normally distributed, and Discriminant functions are always linear.
- QDA method the classes do not necessarily have identical covariance matrix, but the normal distribution is still assumed.
- Partial Least Square (PLS) is a statistical method that bears some relation to principal components regression; instead of finding hyperplanes of minimum variance between the response and independent variables, it finds a linear regression model by projecting the predicted variables and the observable variables to a new space.
- Partial least squares Discriminant Analysis (PLS-DA) is a variant used when the Y is catel. PLS-DA methods resulted in moderate prediction rates of 85-87%.
- DSP digital signal processor
- ASIC application specific integrated circuit
- FPGA field programmable gate array
- a general-purpose processor may be a microprocessor, but, in the alternative, the processor may be any conventional processor, controller, microcontroller, or state machine.
- a processor may also be implemented as a combination of computing devices, e.g., a combination of a DSP and a microprocessor, a plurality of microprocessors, one or more microprocessors in conjunction with a DSP core, or any other such configuration. Alternatively, some steps or methods may be performed by circuitry that is specific to a given function.
Landscapes
- Physics & Mathematics (AREA)
- Spectroscopy & Molecular Physics (AREA)
- General Physics & Mathematics (AREA)
- Health & Medical Sciences (AREA)
- Chemical & Material Sciences (AREA)
- Life Sciences & Earth Sciences (AREA)
- Immunology (AREA)
- Analytical Chemistry (AREA)
- Biochemistry (AREA)
- General Health & Medical Sciences (AREA)
- Pathology (AREA)
- Engineering & Computer Science (AREA)
- Food Science & Technology (AREA)
- Medicinal Chemistry (AREA)
- Theoretical Computer Science (AREA)
- Mathematical Physics (AREA)
- Investigating Or Analysing Materials By Optical Means (AREA)
Abstract
Description
| TABLE 1 | ||
| Prediction | Models | |
| Method Name | Success Rate | building Time |
| Naive Bayes classifier | 83.3% | <0.1 sec |
| Classification and Regression | 75% | <0.1 sec |
| Trees (CART) | ||
| TreeBagger implementation of | 83.3% | 0.3 sec |
| bagged decision trees | ||
| LIBLINEAR linear classifier | 81.7% | <0.1 sec |
| Support Vector Machine (SVM) | 93.3% | <0.1 sec |
| with Linear Kernel | ||
| Support Vector Machine Radial | 81.7% | <0.1 sec |
| Basis Function (SVM-RBF) | ||
| Linear Discriminant Analysis | 85% | <0.1 sec |
| (LDA) | ||
| Quadratic Discriminant Analysis | 85% | <0.1 sec |
| (QDA) | ||
| Partial Least Squares Discriminant | 86.7% | 44 sec |
| Analysis (PLS-DA) | ||
| SIMCA | 88.3% | 1 sec |
Claims (20)
Priority Applications (2)
| Application Number | Priority Date | Filing Date | Title |
|---|---|---|---|
| US15/131,654 US10401284B2 (en) | 2013-03-21 | 2016-04-18 | Spectroscopic characterization of seafood |
| US16/527,712 US10976246B2 (en) | 2013-03-21 | 2019-07-31 | Spectroscopic characterization of seafood |
Applications Claiming Priority (3)
| Application Number | Priority Date | Filing Date | Title |
|---|---|---|---|
| US201361804106P | 2013-03-21 | 2013-03-21 | |
| US14/222,216 US9316628B2 (en) | 2013-03-21 | 2014-03-21 | Spectroscopic characterization of seafood |
| US15/131,654 US10401284B2 (en) | 2013-03-21 | 2016-04-18 | Spectroscopic characterization of seafood |
Related Parent Applications (1)
| Application Number | Title | Priority Date | Filing Date |
|---|---|---|---|
| US14/222,216 Continuation US9316628B2 (en) | 2013-03-21 | 2014-03-21 | Spectroscopic characterization of seafood |
Related Child Applications (1)
| Application Number | Title | Priority Date | Filing Date |
|---|---|---|---|
| US16/527,712 Continuation US10976246B2 (en) | 2013-03-21 | 2019-07-31 | Spectroscopic characterization of seafood |
Publications (2)
| Publication Number | Publication Date |
|---|---|
| US20160231237A1 US20160231237A1 (en) | 2016-08-11 |
| US10401284B2 true US10401284B2 (en) | 2019-09-03 |
Family
ID=51659131
Family Applications (3)
| Application Number | Title | Priority Date | Filing Date |
|---|---|---|---|
| US14/222,216 Active 2034-04-10 US9316628B2 (en) | 2013-03-21 | 2014-03-21 | Spectroscopic characterization of seafood |
| US15/131,654 Active 2034-08-21 US10401284B2 (en) | 2013-03-21 | 2016-04-18 | Spectroscopic characterization of seafood |
| US16/527,712 Active US10976246B2 (en) | 2013-03-21 | 2019-07-31 | Spectroscopic characterization of seafood |
Family Applications Before (1)
| Application Number | Title | Priority Date | Filing Date |
|---|---|---|---|
| US14/222,216 Active 2034-04-10 US9316628B2 (en) | 2013-03-21 | 2014-03-21 | Spectroscopic characterization of seafood |
Family Applications After (1)
| Application Number | Title | Priority Date | Filing Date |
|---|---|---|---|
| US16/527,712 Active US10976246B2 (en) | 2013-03-21 | 2019-07-31 | Spectroscopic characterization of seafood |
Country Status (6)
| Country | Link |
|---|---|
| US (3) | US9316628B2 (en) |
| EP (1) | EP2976605B1 (en) |
| CN (2) | CN107884340B (en) |
| HK (1) | HK1221010A1 (en) |
| TW (3) | TWI629464B (en) |
| WO (1) | WO2014165331A1 (en) |
Families Citing this family (42)
| Publication number | Priority date | Publication date | Assignee | Title |
|---|---|---|---|---|
| WO2013065035A1 (en) | 2011-11-03 | 2013-05-10 | Verifood Ltd. | Low-cost spectrometry system for end-user food analysis |
| US9885655B2 (en) | 2012-11-13 | 2018-02-06 | Viavi Solutions Inc. | Spectrometer with a relay lightpipe |
| CN107345835B (en) * | 2012-11-13 | 2019-11-08 | 唯亚威通讯技术有限公司 | Portable Spectrometer |
| CN107884340B (en) | 2013-03-21 | 2022-04-01 | 唯亚威通讯技术有限公司 | Spectroscopic characterization of seafood |
| CN105593651B (en) | 2013-08-02 | 2019-06-07 | 威利食品有限公司 | Spectrometric system and method, spectroscopy equipment and system |
| CN106461461A (en) | 2014-01-03 | 2017-02-22 | 威利食品有限公司 | Spectrometry systems, methods, and applications |
| CN107250739A (en) | 2014-10-23 | 2017-10-13 | 威利食品有限公司 | The annex of Handheld spectrometer |
| WO2016125164A2 (en) | 2015-02-05 | 2016-08-11 | Verifood, Ltd. | Spectrometry system applications |
| WO2016125165A2 (en) | 2015-02-05 | 2016-08-11 | Verifood, Ltd. | Spectrometry system with visible aiming beam |
| US10066990B2 (en) | 2015-07-09 | 2018-09-04 | Verifood, Ltd. | Spatially variable filter systems and methods |
| WO2017020000A1 (en) * | 2015-07-30 | 2017-02-02 | The Research Foundation For The State University Of New York | Spectroscopic methods for body fluid age determination |
| US10203246B2 (en) | 2015-11-20 | 2019-02-12 | Verifood, Ltd. | Systems and methods for calibration of a handheld spectrometer |
| WO2018015951A1 (en) | 2016-07-20 | 2018-01-25 | Verifood, Ltd. | Accessories for handheld spectrometer |
| US10791933B2 (en) | 2016-07-27 | 2020-10-06 | Verifood, Ltd. | Spectrometry systems, methods, and applications |
| CN106560698A (en) * | 2016-10-20 | 2017-04-12 | 中国计量大学 | Identification method for producing area of plant based on multiple detection technologies |
| CN106560697A (en) * | 2016-10-20 | 2017-04-12 | 中国计量大学 | Method for identifying producing area of Wuyi rock tea through combination of near infrared spectroscopy and trace element detection |
| EP3381368A1 (en) | 2017-03-27 | 2018-10-03 | Samsung Electronics Co., Ltd. | Method of enabling feature extraction for glucose monitoring using near-infrared (nir) spectroscopy |
| KR102491854B1 (en) | 2017-09-29 | 2023-01-26 | 삼성전자주식회사 | Spectrometer |
| DE102018103509B3 (en) | 2017-10-11 | 2018-12-13 | Carl Zeiss Spectroscopy Gmbh | Mobile ingredient analysis system as well as procedures for sample-correct measurement and user guidance with this |
| WO2019102400A1 (en) * | 2017-11-22 | 2019-05-31 | Cti Srl | System and process for the recognition, characterization and classification of foods and nutrients in foods |
| KR20200095547A (en) * | 2017-12-13 | 2020-08-10 | 트리나미엑스 게엠베하 | Spectrometer devices and systems |
| CN108254324B (en) * | 2017-12-18 | 2020-09-22 | 中国农业大学 | Method and device for rapid detection of crab meat freshness |
| CN108489927A (en) * | 2018-01-24 | 2018-09-04 | 仲恺农业工程学院 | Fish origin tracing method, electronic equipment, storage medium and device |
| US11656174B2 (en) | 2018-01-26 | 2023-05-23 | Viavi Solutions Inc. | Outlier detection for spectroscopic classification |
| US10810408B2 (en) | 2018-01-26 | 2020-10-20 | Viavi Solutions Inc. | Reduced false positive identification for spectroscopic classification |
| US11009452B2 (en) | 2018-01-26 | 2021-05-18 | Viavi Solutions Inc. | Reduced false positive identification for spectroscopic quantification |
| EP3561486A1 (en) | 2018-04-27 | 2019-10-30 | CERAGOS Electronics et Nature | Portative optical system for detection of chemical substances at trace levels in foods and liquids |
| KR102627146B1 (en) | 2018-07-20 | 2024-01-18 | 삼성전자주식회사 | Apparatus and method for processing spectrum |
| EP3864384A4 (en) | 2018-10-08 | 2022-06-29 | Verifood Ltd. | Accessories for optical spectrometers |
| JP7424607B2 (en) * | 2019-09-30 | 2024-01-30 | 国立大学法人 奈良先端科学技術大学院大学 | Plant sensing device and real-time plant monitoring system |
| CN110954499B (en) * | 2019-11-20 | 2022-08-02 | 中国计量大学 | Mixed identification method and system for producing areas of imported salmon |
| AU2021238642A1 (en) | 2020-03-18 | 2022-10-06 | Basf Se | Communication system, monitoring system and related methods |
| EP4122180B1 (en) | 2020-03-18 | 2024-04-17 | trinamiX GmbH | Communication system, monitoring system and related methods |
| JP7543824B2 (en) * | 2020-10-09 | 2024-09-03 | セイコーエプソン株式会社 | IMAGE ANALYSIS DEVICE, IMAGE ANALYSIS METHOD, AND IMAGE ANALYSIS PROGRAM |
| US20220397458A1 (en) * | 2021-06-10 | 2022-12-15 | Si-Ware Systems | Mass screening biological detection solutions |
| TWI823135B (en) * | 2021-08-27 | 2023-11-21 | 國立臺北科技大學 | Remote function expansion system for spectrum sensing device |
| WO2023049490A1 (en) * | 2021-09-27 | 2023-03-30 | Purdue Reserach Foundation | Label-free food analysis and molecular detection |
| FR3127805B1 (en) | 2021-10-01 | 2024-12-13 | Plastri | Method of identifying a material type in a target material |
| CN114460244A (en) * | 2022-01-17 | 2022-05-10 | 上海海洋大学 | Method for detecting texture of fugu obscurus |
| CN114460035A (en) * | 2022-02-25 | 2022-05-10 | 广西小研人生物科技有限公司 | A method for rapid detection of freshness of marine cephalopods |
| CN117969425B (en) * | 2024-02-05 | 2025-03-18 | 烟台大学 | Method for identifying bighead cod based on multispectral imaging system |
| JP7725640B1 (en) * | 2024-02-29 | 2025-08-19 | ソフトバンク株式会社 | Data processing system and data processing method |
Citations (15)
| Publication number | Priority date | Publication date | Assignee | Title |
|---|---|---|---|---|
| US5539207A (en) | 1994-07-19 | 1996-07-23 | National Research Council Of Canada | Method of identifying tissue |
| US20030032064A1 (en) | 2001-03-01 | 2003-02-13 | Umass/Worcester | Correction of spectra for subject diversity |
| US6649412B1 (en) * | 1999-07-28 | 2003-11-18 | Marine Harvest Norway As | Method and apparatus for determining quality properties of fish |
| US20040146615A1 (en) | 2001-04-13 | 2004-07-29 | Mcdonald John Thomas | Processes for evaluating agricultural and/or food materials; applications;and, products |
| WO2007000165A1 (en) | 2005-06-27 | 2007-01-04 | Sfk Technology A/S | Online recording of wavelength absorption spectra in meat |
| US20070262257A1 (en) | 2006-05-11 | 2007-11-15 | Monro Donald M | Passive biometric spectroscopy |
| US20080058619A1 (en) | 2006-09-06 | 2008-03-06 | Donald Martin Monro | Active biometric spectroscopy |
| CN100480680C (en) | 2007-05-22 | 2009-04-22 | 浙江大学 | Multiple spectrum meat freshness artificial intelligence measurement method and system |
| US20090220189A1 (en) | 2005-12-22 | 2009-09-03 | Palo Alto Research Center Incorporated | Transmitting Light with Lateral Variation |
| US7728296B2 (en) | 2003-03-21 | 2010-06-01 | Teraview Limited | Spectroscopy apparatus and associated technique |
| US20100309454A1 (en) | 2007-11-30 | 2010-12-09 | Jingyun Zhang | Spectrometers miniaturized for working with cellular phones and other portable electronic devices |
| US20110273709A1 (en) | 2009-05-08 | 2011-11-10 | Zinir Limited | Spectrophotometer |
| US20120153221A1 (en) | 2010-12-16 | 2012-06-21 | Baxter Healthcare S.A. | Real Time Monitoring and Control of Protein Production Processes Using Impedance Spectroscopy |
| US20150330906A1 (en) * | 2014-05-15 | 2015-11-19 | Panasonic Corporation | Freshness estimation method, freshness estimation apparatus, and non-volatile recording medium |
| US9316628B2 (en) | 2013-03-21 | 2016-04-19 | Viavi Solutions Inc. | Spectroscopic characterization of seafood |
Family Cites Families (11)
| Publication number | Priority date | Publication date | Assignee | Title |
|---|---|---|---|---|
| US6560352B2 (en) * | 1999-10-08 | 2003-05-06 | Lumidigm, Inc. | Apparatus and method of biometric identification or verification of individuals using optical spectroscopy |
| US6697654B2 (en) * | 1999-07-22 | 2004-02-24 | Sensys Medical, Inc. | Targeted interference subtraction applied to near-infrared measurement of analytes |
| US7321791B2 (en) * | 2003-09-23 | 2008-01-22 | Cambridge Research And Instrumentation, Inc. | Spectral imaging of deep tissue |
| US7420663B2 (en) * | 2005-05-24 | 2008-09-02 | Bwt Property Inc. | Spectroscopic sensor on mobile phone |
| ES2443033T3 (en) * | 2005-06-08 | 2014-02-17 | Massachusetts Institute Of Technology | Continuous monitoring of fish stocks and behavior on a continental shelf scale |
| US8724829B2 (en) * | 2008-10-24 | 2014-05-13 | Qualcomm Incorporated | Systems, methods, apparatus, and computer-readable media for coherence detection |
| CN102273323B (en) * | 2009-01-07 | 2014-09-10 | 皇家飞利浦电子股份有限公司 | Intelligent controllable lighting networks and schemata therefore |
| CN101620178B (en) * | 2009-06-19 | 2011-02-16 | 广东省药品检验所 | Method for quickly detecting additive chemical component in Chinese patent medicine, health-care food or food based on near-infrared spectrum technique |
| US8384851B2 (en) * | 2010-01-11 | 2013-02-26 | 3M Innovative Properties Company | Reflective display system with enhanced color gamut |
| CN102959932A (en) * | 2010-06-30 | 2013-03-06 | 皇家飞利浦电子股份有限公司 | Methods and apparatus for capturing ambience |
| WO2013065035A1 (en) * | 2011-11-03 | 2013-05-10 | Verifood Ltd. | Low-cost spectrometry system for end-user food analysis |
-
2014
- 2014-03-20 CN CN201711155221.6A patent/CN107884340B/en active Active
- 2014-03-20 TW TW103110534A patent/TWI629464B/en active
- 2014-03-20 HK HK16108979.0A patent/HK1221010A1/en unknown
- 2014-03-20 EP EP14779143.8A patent/EP2976605B1/en active Active
- 2014-03-20 TW TW108148694A patent/TWI749437B/en active
- 2014-03-20 CN CN201480017241.5A patent/CN105190261B/en active Active
- 2014-03-20 TW TW107118926A patent/TWI683093B/en active
- 2014-03-20 WO PCT/US2014/031369 patent/WO2014165331A1/en not_active Ceased
- 2014-03-21 US US14/222,216 patent/US9316628B2/en active Active
-
2016
- 2016-04-18 US US15/131,654 patent/US10401284B2/en active Active
-
2019
- 2019-07-31 US US16/527,712 patent/US10976246B2/en active Active
Patent Citations (17)
| Publication number | Priority date | Publication date | Assignee | Title |
|---|---|---|---|---|
| US5539207A (en) | 1994-07-19 | 1996-07-23 | National Research Council Of Canada | Method of identifying tissue |
| US6649412B1 (en) * | 1999-07-28 | 2003-11-18 | Marine Harvest Norway As | Method and apparatus for determining quality properties of fish |
| US20030032064A1 (en) | 2001-03-01 | 2003-02-13 | Umass/Worcester | Correction of spectra for subject diversity |
| US20040146615A1 (en) | 2001-04-13 | 2004-07-29 | Mcdonald John Thomas | Processes for evaluating agricultural and/or food materials; applications;and, products |
| US7728296B2 (en) | 2003-03-21 | 2010-06-01 | Teraview Limited | Spectroscopy apparatus and associated technique |
| WO2007000165A1 (en) | 2005-06-27 | 2007-01-04 | Sfk Technology A/S | Online recording of wavelength absorption spectra in meat |
| US20090220189A1 (en) | 2005-12-22 | 2009-09-03 | Palo Alto Research Center Incorporated | Transmitting Light with Lateral Variation |
| US20070262257A1 (en) | 2006-05-11 | 2007-11-15 | Monro Donald M | Passive biometric spectroscopy |
| US20080058619A1 (en) | 2006-09-06 | 2008-03-06 | Donald Martin Monro | Active biometric spectroscopy |
| US7750299B2 (en) | 2006-09-06 | 2010-07-06 | Donald Martin Monro | Active biometric spectroscopy |
| CN100480680C (en) | 2007-05-22 | 2009-04-22 | 浙江大学 | Multiple spectrum meat freshness artificial intelligence measurement method and system |
| US20100309454A1 (en) | 2007-11-30 | 2010-12-09 | Jingyun Zhang | Spectrometers miniaturized for working with cellular phones and other portable electronic devices |
| US20110273709A1 (en) | 2009-05-08 | 2011-11-10 | Zinir Limited | Spectrophotometer |
| US20120153221A1 (en) | 2010-12-16 | 2012-06-21 | Baxter Healthcare S.A. | Real Time Monitoring and Control of Protein Production Processes Using Impedance Spectroscopy |
| TW201236734A (en) | 2010-12-16 | 2012-09-16 | Baxter Int | Real time monitoring and control of protein production processes using impedance spectroscopy |
| US9316628B2 (en) | 2013-03-21 | 2016-04-19 | Viavi Solutions Inc. | Spectroscopic characterization of seafood |
| US20150330906A1 (en) * | 2014-05-15 | 2015-11-19 | Panasonic Corporation | Freshness estimation method, freshness estimation apparatus, and non-volatile recording medium |
Non-Patent Citations (24)
Also Published As
| Publication number | Publication date |
|---|---|
| EP2976605A4 (en) | 2016-11-16 |
| CN105190261A (en) | 2015-12-23 |
| US10976246B2 (en) | 2021-04-13 |
| TW201504614A (en) | 2015-02-01 |
| US20150204833A1 (en) | 2015-07-23 |
| TWI683093B (en) | 2020-01-21 |
| TWI749437B (en) | 2021-12-11 |
| HK1249178A1 (en) | 2018-10-26 |
| US20160231237A1 (en) | 2016-08-11 |
| CN107884340A (en) | 2018-04-06 |
| US20190353587A1 (en) | 2019-11-21 |
| CN107884340B (en) | 2022-04-01 |
| EP2976605A1 (en) | 2016-01-27 |
| CN105190261B (en) | 2017-12-22 |
| WO2014165331A1 (en) | 2014-10-09 |
| US9316628B2 (en) | 2016-04-19 |
| HK1221010A1 (en) | 2017-05-19 |
| TW201831868A (en) | 2018-09-01 |
| EP2976605B1 (en) | 2023-11-01 |
| TW202014681A (en) | 2020-04-16 |
| TWI629464B (en) | 2018-07-11 |
Similar Documents
| Publication | Publication Date | Title |
|---|---|---|
| US10976246B2 (en) | Spectroscopic characterization of seafood | |
| Pullanagari et al. | Uncertainty assessment for firmness and total soluble solids of sweet cherries using hyperspectral imaging and multivariate statistics | |
| Schmutzler et al. | Methods for detection of pork adulteration in veal product based on FT-NIR spectroscopy for laboratory, industrial and on-site analysis | |
| Jahani et al. | Novel application of near-infrared spectroscopy and chemometrics approach for detection of lime juice adulteration | |
| Sowoidnich et al. | Shifted excitation Raman difference spectroscopy at multiple wavelengths for in-situ meat species differentiation | |
| US20140267684A1 (en) | System and method for detecting contamination in food using hyperspectral imaging | |
| US20110261355A1 (en) | Portable device and method for spectroscopic analysis | |
| BRPI1006077B1 (en) | system for analyzing one or more meat properties | |
| Mukundan et al. | Portable and low-cost hologram verification module using a snapshot-based hyperspectral imaging algorithm | |
| Zhang et al. | Development of a portable field imaging spectrometer: application for the identification of sun-dried and sulfur-fumigated Chinese herbals | |
| EP4236812A1 (en) | Home toilet system for monitoring urine components in real time while urination | |
| Paraskevaidi et al. | Aluminium foil as an alternative substrate for the spectroscopic interrogation of endometrial cancer | |
| Amsaraj et al. | Multi-instrument spectroscopic study for authentication of curcumin content in commercial turmeric powders using machine learning algorithms | |
| Crocombe | The future of portable spectroscopy | |
| EP4198465A2 (en) | Devices, systems, and methods for analyzing measurement objects | |
| Arrobas et al. | Raman spectroscopy for analyzing anthocyanins of lyophilized blueberries | |
| HK1249178B (en) | Spectroscopic characterization of seafood | |
| US10041885B2 (en) | Optical and chemical analytical systems and methods | |
| Magnus et al. | Broadband diffuse reflection spectroscopy and linear discriminant analysis enabling a non-destructive milk identification | |
| Zhang et al. | Development of VIS/NIR spectroscopic system for real-time prediction of fresh pork quality | |
| TWM558902U (en) | Optical spectrum analyzer mobile phone | |
| Qiao et al. | Rapid discrimination of main red meat species based on near-infrared hyperspectral imaging technology | |
| Wang et al. | Nondestructive detection of pork quality based on dual-band VIS/NIR spectroscopy | |
| Edwards et al. | Non-Destructive Spectroscopic and Imaging Techniques for the Detection of Processed Meat Fraud. Foods 2021, 10, 448 | |
| Sowoidnich et al. | In-situ identification of meat from different animal species by shifted excitation Raman difference spectroscopy |
Legal Events
| Date | Code | Title | Description |
|---|---|---|---|
| AS | Assignment |
Owner name: JDS UNIPHASE CORPORATION, CALIFORNIA Free format text: ASSIGNMENT OF ASSIGNORS INTEREST;ASSIGNORS:O'BRIEN, NADA A.;HULSE, CHARLES A.;SIESLER, HEINZ W.;AND OTHERS;SIGNING DATES FROM 20140318 TO 20140522;REEL/FRAME:039527/0634 Owner name: VIAVI SOLUTIONS INC., CALIFORNIA Free format text: CHANGE OF NAME;ASSIGNOR:JDS UNIPHASE CORPORATION;REEL/FRAME:039806/0752 Effective date: 20150731 |
|
| STCV | Information on status: appeal procedure |
Free format text: APPEAL BRIEF (OR SUPPLEMENTAL BRIEF) ENTERED AND FORWARDED TO EXAMINER |
|
| STPP | Information on status: patent application and granting procedure in general |
Free format text: NOTICE OF ALLOWANCE MAILED -- APPLICATION RECEIVED IN OFFICE OF PUBLICATIONS |
|
| STPP | Information on status: patent application and granting procedure in general |
Free format text: PUBLICATIONS -- ISSUE FEE PAYMENT RECEIVED |
|
| STPP | Information on status: patent application and granting procedure in general |
Free format text: PUBLICATIONS -- ISSUE FEE PAYMENT VERIFIED |
|
| STCF | Information on status: patent grant |
Free format text: PATENTED CASE |
|
| AS | Assignment |
Owner name: WELLS FARGO BANK, NATIONAL ASSOCIATION, AS ADMINISTRATIVE AGENT, COLORADO Free format text: SECURITY INTEREST;ASSIGNORS:VIAVI SOLUTIONS INC.;3Z TELECOM, INC.;ACTERNA LLC;AND OTHERS;REEL/FRAME:052729/0321 Effective date: 20200519 |
|
| AS | Assignment |
Owner name: RPC PHOTONICS, INC., NEW YORK Free format text: TERMINATIONS OF SECURITY INTEREST AT REEL 052729, FRAME 0321;ASSIGNOR:WELLS FARGO BANK, NATIONAL ASSOCIATION, AS ADMINISTRATIVE AGENT;REEL/FRAME:058666/0639 Effective date: 20211229 Owner name: VIAVI SOLUTIONS INC., CALIFORNIA Free format text: TERMINATIONS OF SECURITY INTEREST AT REEL 052729, FRAME 0321;ASSIGNOR:WELLS FARGO BANK, NATIONAL ASSOCIATION, AS ADMINISTRATIVE AGENT;REEL/FRAME:058666/0639 Effective date: 20211229 |
|
| MAFP | Maintenance fee payment |
Free format text: PAYMENT OF MAINTENANCE FEE, 4TH YEAR, LARGE ENTITY (ORIGINAL EVENT CODE: M1551); ENTITY STATUS OF PATENT OWNER: LARGE ENTITY Year of fee payment: 4 |
|
| AS | Assignment |
Owner name: WELLS FARGO BANK, NATIONAL ASSOCIATION, AS ADMINISTRATIVE AGENT, CALIFORNIA Free format text: SECURITY AGREEMENT;ASSIGNORS:INERTIAL LABS, INC.;VIAVI SOLUTIONS INC.;VIAVI SOLUTIONS LICENSING LLC;REEL/FRAME:073189/0873 Effective date: 20251016 |
|
| AS | Assignment |
Owner name: WELLS FARGO BANK, NATIONAL ASSOCIATION, AS AGENT, CALIFORNIA Free format text: SECURITY INTEREST;ASSIGNORS:VIAVI SOLUTIONS INC.;VIAVI SOLUTIONS LICENSING LLC;INERTIAL LABS, INC.;REEL/FRAME:073571/0137 Effective date: 20251113 |