US10190992B2 - Structure status determination device, status determination system, and status determination method - Google Patents
Structure status determination device, status determination system, and status determination method Download PDFInfo
- Publication number
- US10190992B2 US10190992B2 US15/555,154 US201615555154A US10190992B2 US 10190992 B2 US10190992 B2 US 10190992B2 US 201615555154 A US201615555154 A US 201615555154A US 10190992 B2 US10190992 B2 US 10190992B2
- Authority
- US
- United States
- Prior art keywords
- displacement
- spatial distribution
- dimensional spatial
- time
- differential
- Prior art date
- Legal status (The legal status is an assumption and is not a legal conclusion. Google has not performed a legal analysis and makes no representation as to the accuracy of the status listed.)
- Active
Links
- 238000000034 method Methods 0.000 title claims description 49
- 238000006073 displacement reaction Methods 0.000 claims abstract description 490
- 238000012937 correction Methods 0.000 claims abstract description 92
- 238000004364 calculation method Methods 0.000 claims abstract description 87
- 230000005856 abnormality Effects 0.000 claims abstract description 85
- 238000011068 loading method Methods 0.000 claims abstract description 77
- 230000007547 defect Effects 0.000 claims abstract description 71
- 239000000284 extract Substances 0.000 claims abstract description 10
- 230000008859 change Effects 0.000 claims description 29
- 230000002123 temporal effect Effects 0.000 claims description 26
- 238000000926 separation method Methods 0.000 abstract description 44
- 238000005336 cracking Methods 0.000 abstract 1
- 238000010586 diagram Methods 0.000 description 71
- 230000014509 gene expression Effects 0.000 description 67
- 238000005259 measurement Methods 0.000 description 14
- 238000012545 processing Methods 0.000 description 14
- 230000004044 response Effects 0.000 description 14
- 230000006870 function Effects 0.000 description 7
- 230000000638 stimulation Effects 0.000 description 7
- 238000013459 approach Methods 0.000 description 6
- 238000011156 evaluation Methods 0.000 description 5
- 239000000463 material Substances 0.000 description 4
- 238000004088 simulation Methods 0.000 description 4
- 238000001514 detection method Methods 0.000 description 3
- 230000002349 favourable effect Effects 0.000 description 3
- 230000003287 optical effect Effects 0.000 description 3
- 230000000452 restraining effect Effects 0.000 description 3
- 239000007787 solid Substances 0.000 description 3
- 238000003776 cleavage reaction Methods 0.000 description 2
- 230000000694 effects Effects 0.000 description 2
- 238000007689 inspection Methods 0.000 description 2
- NRNCYVBFPDDJNE-UHFFFAOYSA-N pemoline Chemical compound O1C(N)=NC(=O)C1C1=CC=CC=C1 NRNCYVBFPDDJNE-UHFFFAOYSA-N 0.000 description 2
- 230000007017 scission Effects 0.000 description 2
- 230000002159 abnormal effect Effects 0.000 description 1
- 230000001133 acceleration Effects 0.000 description 1
- 230000008901 benefit Effects 0.000 description 1
- 230000015556 catabolic process Effects 0.000 description 1
- 238000004891 communication Methods 0.000 description 1
- 230000002950 deficient Effects 0.000 description 1
- 238000006731 degradation reaction Methods 0.000 description 1
- 230000006866 deterioration Effects 0.000 description 1
- 238000002474 experimental method Methods 0.000 description 1
- 238000009499 grossing Methods 0.000 description 1
- 238000012986 modification Methods 0.000 description 1
- 230000004048 modification Effects 0.000 description 1
- 230000010355 oscillation Effects 0.000 description 1
- 230000010363 phase shift Effects 0.000 description 1
- 230000002441 reversible effect Effects 0.000 description 1
- 238000012360 testing method Methods 0.000 description 1
- 230000000007 visual effect Effects 0.000 description 1
Images


Classifications
-
- G—PHYSICS
- G01—MEASURING; TESTING
- G01N—INVESTIGATING OR ANALYSING MATERIALS BY DETERMINING THEIR CHEMICAL OR PHYSICAL PROPERTIES
- G01N21/00—Investigating or analysing materials by the use of optical means, i.e. using sub-millimetre waves, infrared, visible or ultraviolet light
- G01N21/84—Systems specially adapted for particular applications
- G01N21/88—Investigating the presence of flaws or contamination
- G01N21/8851—Scan or image signal processing specially adapted therefor, e.g. for scan signal adjustment, for detecting different kinds of defects, for compensating for structures, markings, edges
-
- G—PHYSICS
- G01—MEASURING; TESTING
- G01B—MEASURING LENGTH, THICKNESS OR SIMILAR LINEAR DIMENSIONS; MEASURING ANGLES; MEASURING AREAS; MEASURING IRREGULARITIES OF SURFACES OR CONTOURS
- G01B11/00—Measuring arrangements characterised by the use of optical techniques
- G01B11/30—Measuring arrangements characterised by the use of optical techniques for measuring roughness or irregularity of surfaces
-
- G—PHYSICS
- G01—MEASURING; TESTING
- G01M—TESTING STATIC OR DYNAMIC BALANCE OF MACHINES OR STRUCTURES; TESTING OF STRUCTURES OR APPARATUS, NOT OTHERWISE PROVIDED FOR
- G01M5/00—Investigating the elasticity of structures, e.g. deflection of bridges or air-craft wings
- G01M5/0033—Investigating the elasticity of structures, e.g. deflection of bridges or air-craft wings by determining damage, crack or wear
-
- G—PHYSICS
- G01—MEASURING; TESTING
- G01M—TESTING STATIC OR DYNAMIC BALANCE OF MACHINES OR STRUCTURES; TESTING OF STRUCTURES OR APPARATUS, NOT OTHERWISE PROVIDED FOR
- G01M5/00—Investigating the elasticity of structures, e.g. deflection of bridges or air-craft wings
- G01M5/0075—Investigating the elasticity of structures, e.g. deflection of bridges or air-craft wings by means of external apparatus, e.g. test benches or portable test systems
-
- G—PHYSICS
- G01—MEASURING; TESTING
- G01M—TESTING STATIC OR DYNAMIC BALANCE OF MACHINES OR STRUCTURES; TESTING OF STRUCTURES OR APPARATUS, NOT OTHERWISE PROVIDED FOR
- G01M5/00—Investigating the elasticity of structures, e.g. deflection of bridges or air-craft wings
- G01M5/0091—Investigating the elasticity of structures, e.g. deflection of bridges or air-craft wings by using electromagnetic excitation or detection
-
- G—PHYSICS
- G01—MEASURING; TESTING
- G01N—INVESTIGATING OR ANALYSING MATERIALS BY DETERMINING THEIR CHEMICAL OR PHYSICAL PROPERTIES
- G01N21/00—Investigating or analysing materials by the use of optical means, i.e. using sub-millimetre waves, infrared, visible or ultraviolet light
- G01N21/84—Systems specially adapted for particular applications
- G01N21/88—Investigating the presence of flaws or contamination
- G01N21/8851—Scan or image signal processing specially adapted therefor, e.g. for scan signal adjustment, for detecting different kinds of defects, for compensating for structures, markings, edges
- G01N2021/8854—Grading and classifying of flaws
- G01N2021/8861—Determining coordinates of flaws
- G01N2021/8864—Mapping zones of defects
-
- G—PHYSICS
- G01—MEASURING; TESTING
- G01N—INVESTIGATING OR ANALYSING MATERIALS BY DETERMINING THEIR CHEMICAL OR PHYSICAL PROPERTIES
- G01N21/00—Investigating or analysing materials by the use of optical means, i.e. using sub-millimetre waves, infrared, visible or ultraviolet light
- G01N21/84—Systems specially adapted for particular applications
- G01N21/88—Investigating the presence of flaws or contamination
- G01N21/8851—Scan or image signal processing specially adapted therefor, e.g. for scan signal adjustment, for detecting different kinds of defects, for compensating for structures, markings, edges
- G01N2021/8896—Circuits specially adapted for system specific signal conditioning
-
- G—PHYSICS
- G01—MEASURING; TESTING
- G01N—INVESTIGATING OR ANALYSING MATERIALS BY DETERMINING THEIR CHEMICAL OR PHYSICAL PROPERTIES
- G01N3/00—Investigating strength properties of solid materials by application of mechanical stress
- G01N3/20—Investigating strength properties of solid materials by application of mechanical stress by applying steady bending forces
Definitions
- the present invention relates to a technique to remotely determine the status of defects or the like caused in a structure.
- Defects caused on the surface of a concrete structure such as tunnels and bridges are known to affect the soundness of the structure. It is thus necessary to accurately detect these defects so as to accurately judge the soundness of a structure.
- PTL 6 proposes, in measuring the strain caused on a surface of an object to be measured, a method to correct the out-of-plane displacement amount based on the displacement of a captured image.
- the out-of-plane displacement amount is read from the side images before and after the deformation of the structure.
- two video devices are provided, namely, a first video device that captures an image of the surface of the structure and a second video device that captures the side of the structure.
- the present invention has been made in view of the above problems, and has an objective to detect with favorable accuracy any defect of a structure, such as cracks, separations, or internal cavities, remotely without contact, while restraining costs.
- a status determination device comprises: a displacement calculation unit that, from time-series images of a structure surface before and after loading application, calculates a two-dimensional spatial distribution of a displacement of the time-series images; a correction amount calculation unit that calculates a correction amount based on a moving amount of the structure surface in a normal direction due to the loading application, from the two-dimensional spatial distribution of the displacement of the time-series images; a displacement correction unit that extracts a two-dimensional spatial distribution of a displacement of the structure surface, by subtracting the correction amount from the two-dimensional spatial distribution of the displacement of the time-series images; and an abnormality determination unit that identifies a defect of the structure, based on comparison between the two-dimensional spatial distribution of the displacement of the structure surface and a prepared spatial distribution of a displacement having been prepared in advance.
- a status determination system comprises: a status determination device that includes: a displacement calculation unit that, from time-series images of a structure surface before and after loading application, calculates a two-dimensional spatial distribution of a displacement of the time-series images; a correction amount calculation unit that calculates a correction amount based on a moving amount of the structure surface in a normal direction due to the loading application, from the two-dimensional spatial distribution of the displacement of the time-series images; a displacement correction unit that extracts a two-dimensional spatial distribution of a displacement of the structure surface, by subtracting the correction amount from the two-dimensional spatial distribution of the displacement of the time-series images; and an abnormality determination unit that identifies a defect of the structure, based on comparison between the two-dimensional spatial distribution of the displacement of the structure surface and a prepared spatial distribution of a displacement having been prepared in advance; and an image-capturing unit that captures the time-series images and provides the status determination device with the time-series images.
- a status determination method comprises: calculating, from time-series images of a structure surface before and after loading application, a two-dimensional spatial distribution of a displacement of the time-series images; calculating a correction amount based on a moving amount of the structure surface in a normal direction due to the loading application, from the two-dimensional spatial distribution of the displacement of the time-series images; extracting a two-dimensional spatial distribution of a displacement of the structure surface, by subtracting the correction amount from the two-dimensional spatial distribution of the displacement of the time-series images; and identifying a defect of the structure, based on comparison between the two-dimensional spatial distribution of the displacement of the structure surface and a prepared spatial distribution of a displacement having been prepared in advance.
- the present invention enables detection with favorable accuracy any defect of a structure, such as cracks, separations, or internal cavities, remotely without contact, while restraining costs.
- FIG. 1 is a block diagram illustrating a configuration of a status determination device according to an example embodiment of the present invention.
- FIG. 2 is a block diagram illustrating a specific configuration of a status determination device according to an example embodiment of the present invention.
- FIG. 3 is a block diagram illustrating a configuration of a status determination system according to an example embodiment of the present invention.
- FIG. 4A is a diagram for explaining a relation between the structure status (sound case) and the displacement of the surface.
- FIG. 4B is a diagram for explaining a relation between the structure status (crack case) and the displacement of the surface.
- FIG. 4C is a diagram for explaining a relation between the structure status (separation case) and the displacement of the surface.
- FIG. 4D is a diagram for explaining a relation between the structure status (internal cavity case) and the displacement of the surface.
- FIG. 5 is a diagram for explaining an out-of-plane displacement at the time of image-capturing a lower surface of the structure, when the structure is deflected attributed to loading.
- FIG. 6 is a diagram for explaining the relationship between an out-of-plane displacement vector, an in-plane displacement vector, and a measurement vector.
- FIG. 7A is a diagram illustrating a graph of a magnitude of the out-of-plane displacement vector.
- FIG. 7B is a diagram illustrating a graph of a magnitude of the out-of-plane displacement vector.
- FIG. 8 is a diagram illustrating a magnitude of the out-of-plane displacement vector and a graph of a magnitude of the out-of-plane displacement vector.
- FIG. 9A is a diagram illustrating a result of calculating, in a displacement calculation unit, a displacement of a structure surface in X-direction after loading compared to before loading (crack case).
- FIG. 9B is a diagram illustrating a result of calculating, in the displacement calculation unit, a displacement of the structure surface in Y-direction after loading compared to before loading (crack case).
- FIG. 10A is a diagram illustrating a result of calculating, in a displacement correction unit, an in-plane displacement of the structure surface in X-direction after loading compared to before loading (crack case).
- FIG. 10B is a diagram illustrating a result of calculating, in the displacement correction unit, an in-plane displacement of the structure surface in Y-direction after loading compared to before loading (crack case).
- FIG. 11 is a diagram for explaining a calculation method of a correction amount when there is a tilt, in a correction amount calculation unit according to an example embodiment of the present invention.
- FIG. 12A is a diagram illustrating a distribution of the stress field around a crack.
- FIG. 12B is a diagram illustrating a distribution of the stress field around a crack.
- FIG. 13A is a diagram illustrating an example of a two-dimensional distribution (X-direction) of a displacement amount around a crack (when the crack is shallow).
- FIG. 13B is a diagram illustrating an example of a two-dimensional distribution (Y-direction) of a displacement amount around a crack (when the crack is shallow).
- FIG. 13C is a diagram illustrating an example of a two-dimensional distribution (X-direction) of a displacement amount around a crack (when the crack is deep).
- FIG. 13D is a diagram illustrating an example of a two-dimensional distribution (Y-direction) of a displacement amount around a crack (when the crack is deep).
- FIG. 14A is a diagram for explaining a pattern matching with a displacement distribution (a pattern in X-direction of the displacement) by an abnormality determination unit.
- FIG. 14B is a diagram for explaining a pattern matching with a displacement distribution (a pattern in Y-direction of the displacement) by the abnormality determination unit.
- FIG. 14C is a diagram for explaining a pattern matching with a displacement distribution (a pattern of a differential vector field of a displacement) by the abnormality determination unit.
- FIG. 15A is a perspective view illustrating a two-dimensional distribution of a stress on a surface viewed along the image-capturing direction when there is an internal cavity.
- FIG. 15B is a plan view illustrating a two-dimensional distribution of a stress on a surface viewed along the image-capturing direction when there is an internal cavity.
- FIG. 16A is a diagram illustrating a contour (X-component) of a displacement of a surface viewed along the image-capturing direction when there is an internal cavity.
- FIG. 16B is a diagram illustrating a contour (Y-component) of a displacement of a surface viewed along the image-capturing direction when there is an internal cavity.
- FIG. 16C is a diagram illustrating a stress field on a surface viewed along the image-capturing direction when there is an internal cavity.
- FIG. 17A is a diagram for explaining a response when an impulse stimulation is provided on a structure when there is an internal cavity (illustrating a location ABC at which a response is obtained).
- FIG. 17B is a diagram for explaining a response when an impulse stimulation is provided on a structure when there is an internal cavity (illustrating a location ABC at which a response is obtained).
- FIG. 18A is a diagram illustrating a contour (X-component) of a displacement of a surface viewed along the image-capturing direction when there is a separation.
- FIG. 18B is a diagram illustrating a contour (Y-component) of a displacement of a surface viewed along the image-capturing direction when there is a separation.
- FIG. 18C is a diagram illustrating a stress field on a surface viewed along the image-capturing direction when there is a separation.
- FIG. 19 is a diagram for explaining a time response of a displacement when an impulse stimulation is provided on a structure when there is a separation.
- FIG. 20 is a flowchart illustrating a status determination method in a status determination device according to an example embodiment of the present invention.
- FIG. 1 is a block diagram illustrating a configuration of a status determination device according to an example embodiment of the present invention.
- the status determination device 100 includes a displacement calculation unit 101 that calculates a two-dimensional spatial distribution of a displacement in time-series images taken before and after loading is applied on a surface of a structure, from the time-series images.
- the status determination device 100 includes a correction amount calculation unit 102 that calculates a correction amount based on a moving amount of the structure surface in the normal direction due to loading application, from the two-dimensional spatial distribution of the displacement of the time-series images.
- the status determination device 100 includes a displacement correction unit 103 that extracts a two-dimensional spatial distribution of the displacement of the structure surface, by subtracting the correction amount from the two-dimensional spatial distribution of the displacement of the time-series images.
- the status determination device 100 according to the present example embodiment includes an abnormality determination unit 104 that identifies defects in the structure based on a comparison between the two-dimensional spatial distribution of a displacement of the structure surface and a spatial distribution of a displacement prepared in advance. Note that the direction of the arrows in FIG. 1 is an example, and is not intended to limit the direction of the signals between the blocks.
- FIG. 2 is a block diagram illustrating a specific configuration of a status determination device according to an example embodiment of the present invention.
- the status determination device 1 includes a displacement calculation unit 2 , a correction amount calculation unit 3 , a displacement correction unit 4 , a differential displacement calculation unit 5 , an abnormality determination unit 6 , and an abnormality map creation unit 9 .
- the abnormality determination unit 6 includes a two-dimensional spatial distribution information analysis unit 7 and a temporal change information analysis unit 8 . Note that the direction of the arrows in FIG. 2 is an example, and is not intended to limit the direction of the signals between the blocks.
- FIG. 3 is a block diagram illustrating a configuration of a status determination system according to an example embodiment of the present invention.
- the status determination system 10 includes a status determination device 1 and an image-capturing unit 11 .
- the status determination device 1 is a device illustrated in FIG. 2 .
- the image-capturing unit 11 is an image-capturing camera.
- the image-capturing unit 11 captures an image of a surface of a structure 12 before and after loading is applied on the structure 12 , as the time-series images on the X-Y plane, and inputs the captured time-series images to the displacement calculation unit 2 of the status determination device 1 .
- the status determination device 1 obtains time-series image information from the image-capturing unit 11 .
- FIG. 1 is a block diagram illustrating a configuration of a status determination system according to an example embodiment of the present invention.
- the status determination system 10 includes a status determination device 1 and an image-capturing unit 11 .
- the status determination device 1 is a device illustrated in FIG. 2 .
- the structure 12 which is an object to be measured, is assumed to be a beam-like structure supported at two points.
- the structure 12 may have various types of defects 13 . Note that the direction of the arrows in FIG. 3 is an example, and is not intended to limit the direction of the signals between the blocks.
- the displacement calculation unit 2 of the status determination device 1 calculates a displacement for each (X, Y) coordinate on the X-Y plane of the time-series images. That is, by using, as a reference, the frame image before loading application which was captured by the image-capturing unit 11 , the displacement of the frame image at the initial time after loading application is calculated. Then, the displacement of the frame image at the subsequent time after loading application is calculated, and the displacement of the frame image at the further subsequent time is calculated, and so on, to calculate the displacement from the image before loading application for each time-series image.
- the displacement calculation unit 2 can calculate a displacement using an image correlation operation.
- the displacement calculation unit 2 may also represent a displacement distribution diagram of the calculated displacement, as a two-dimensional spatial distribution on the X-Y plane.
- the correction amount calculation unit 3 calculates a displacement (referred to as “out-of-plane displacement”) that is included in the displacement calculated by the displacement calculation unit 2 and that has been caused by moving of the surface of the structure 12 in its normal direction which is attributed to the deflection of the structure 12 and the like.
- the displacement correction unit 4 extracts a displacement (referred to as “in-plane displacement”) caused on a surface of the structure 12 , by subtracting the out-of-plane displacement calculated by the correction amount calculation unit 3 , either from the displacement calculated by the displacement calculation unit 2 or the displacement distribution diagram.
- the displacement correction unit 4 inputs the extracted in-plane displacement to the differential displacement calculation unit 5 and to the abnormality determination unit 6 .
- the differential displacement calculation unit 5 performs spatial differential on either the displacement or the displacement distribution diagram, to calculate either a differential displacement or a differential displacement distribution diagram in which the calculated differential displacement is plotted as the two-dimensional differential spatial distribution on the X-Y plane.
- the calculation results of the displacement correction unit 4 and the differential displacement calculation unit 5 are input to the abnormality determination unit 6 .
- the abnormality determination unit 6 determines the status of the structure 12 based on the input calculation results. That is, the abnormality determination unit 6 determines the location and type of the abnormality (defect 13 ) of the structure 12 , from the analysis results of the two-dimensional spatial distribution information analysis unit 7 and the temporal change information analysis unit 8 . Further, the abnormality determination unit 6 inputs the determined location and type of the abnormality of the structure 12 , to the abnormality map creation unit 9 .
- the abnormality map creation unit 9 maps the spatial distribution of the abnormal status of the structure 12 on the X-Y plane, records it as an abnormality map, and outputs the abnormality map.
- the status determination device 1 can be an information appliance such as a personal computer (PC) and a server. Each unit that constitutes a status determination device 1 can be realized by operating a CPU (central processing unit), being an operational resource, and a memory and an HDD (hard disk drive), being a storage resource, included in the information appliance, to operate a program in the CPU.
- a CPU central processing unit
- HDD hard disk drive
- FIG. 4A to FIG. 4D are diagrams for explaining a relation between various abnormality statuses of the structure 12 and the in-plane displacement of the surfaces.
- FIG. 4A is a side view of the structure 12 having a beam-like form supported at two points.
- the image-capturing unit 11 as illustrated in FIG. 3 is placed under a condition to capture an image of a lower surface of the structure 12 in the image-capturing direction (Z-direction).
- Z-direction the image-capturing direction
- a compressive stress is applied onto the upper surface of the structure 12
- a tensile stress is applied onto the lower surface thereof, as illustrated in FIG. 4A .
- the structure 12 is not necessarily a beam-like structure which is supported at two points, as long as similar stresses are exerted on the structure.
- the differential displacement calculation unit 5 can calculate the strain by performing spatial differential on the result obtained by calculation by the displacement correction unit 4 . That is, a stress field can be obtained by the result of the differential displacement calculation unit 5 .
- the outer appearance of the structure 12 when viewed from the lower surface looks similar to as in the case of cracks, as illustrated in FIG. 4C .
- no stress is conveyed from the separated portion to the portion above the separated portion. Therefore, the displacement due to loading at the separated portion only moves in parallel in a certain amount and in a certain direction, and no strain, being its spatial differential value, will be caused. Accordingly, a crack can be distinguished from a separation, by using information on the strain obtained by performing spatial differential on the displacement due to loading.
- the displacement of the structure surface to be measured in FIG. 4A to FIG. 4D is an in-plane displacement (X-direction and Y-direction) within the X-Y plane. Therefore, the correction amount calculation unit 3 calculates the apparent displacement (out-of-plane displacement) caused when the surface of the structure 12 moves in its normal direction due to loading as a correction amount, and the displacement correction unit 4 subtracts the out-of-plane displacement therefrom, to extract an in-plane displacement.
- the following describes a method to calculate an out-of-plane displacement in the correction amount calculation unit 3 .
- normal line is used for a curved surface. When one large curved surface is formed overall, and a plurality of small curves are formed on the large curved surface, the normal line is deemed to mean the normal line of the large curved surface. Normally, for a plane surface, the term “perpendicular line” is used. However, in the following description, the term “normal line” is used also in the case of a plane surface, for the sake of simplicity.
- FIG. 5 is a diagram for explaining an out-of-plane displacement at the time of image-capturing a lower surface of the structure, when the structure 12 is deflected attributed to loading (Please refer to FIG. 3 ).
- the moving amount of the surface of the structure 12 in its normal direction (Z-direction) is deemed to be caused by deflection of the structure, and is denoted as the amount of deflection ⁇ .
- the moving amount of a surface in Z-direction is not limited to the amount of deflection, and can include an amount by which the entire structure 12 is moved by going downward attributed to loading, for example.
- the out-of-plane displacement ⁇ x i of the image-capturing plane is 1.6 ⁇ m, from Expression 1.
- the in-plane displacement ⁇ x i of the image-capturing plane is 1.6 ⁇ m, from Expression 3. In this way, an out-of-plane displacement equal to an in-plane displacement is likely superposed on the displacement of the time-series images calculated by the displacement calculation unit 2 and the displacement distribution diagram depicting the two-dimensional spatial distribution on the X-Y plane.
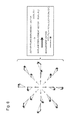
- FIG. 6 is a diagram illustrating the relationship between an out-of-plane displacement vector ⁇ i( ⁇ x i , ⁇ y i ) and an in-plane displacement vector ⁇ i( ⁇ x i , ⁇ y i ), which are represented by Expression 5 and Expression 6.
- the out-of-plane displacement vector ⁇ i( ⁇ x i , ⁇ y i ) is a radial vector group (the thin solid arrow in FIG. 6 ), and its magnitude R (x, y) is expressed as Expression 7, from Expression 1 and Expression 2.
- Expression 7 if the amount of deflection ⁇ is constant, its magnitude takes a value proportional to the distance from the image-capturing center.
- Expression 7 can be expressed as Expression 9.
- the displacement distribution calculated by the displacement calculation unit 2 corresponds to a measurement vector V(Vx, Vy) (the dotted arrow in FIG. 6 ), which is a resultant vector between the out-of-plane displacement vector ⁇ i( ⁇ x i , ⁇ y i ) (the thin solid arrow in FIG. 6 ) and the in-plane displacement vector ⁇ i( ⁇ x i , ⁇ y i ) (the bold solid arrow in FIG. 6 ).
- Rmes(x, y) be the magnitude of the measurement vector V(Vx, Vy). Then, Expression 10 and Expression 11 result.
- FIG. 7A and FIG. 7B are graphs depicting an example of the value of the magnitude R(x, y) of the out-of-plane displacement vector ⁇ i( ⁇ x i , ⁇ y i ) given by Expression 7, Expression 8, and Expression 9.
- FIG. 7A and FIG. 7B are graphs depicting the magnitude R(x, y) of the out-of-plane displacement vector when the amount of deflection ⁇ is 1 mm and 4 mm, respectively.
- the image-capturing distance L before deflection is 5000 mm
- the focal distance f is 50 mm.
- both graphs are similar figures to each other, and as the amount of deflection ⁇ is larger, its enlargement factor increases. This enlargement factor corresponds to the factor of proportionality K given by Expression 8.
- FIG. 8 is a graph in which the magnitude Rmes(x, y) of the measurement vector V(Vx, Vy) is superposed on the graph in FIG. 7B .
- Rmes(x, y) is expressed by a thin solid line.
- Rmes(x, y) takes a form similar to the magnitude R(x, y) of the out-of-plane displacement vector, if the magnitude R(x, y) of the out-of-plane displacement vector is larger than the in-plane displacement vector ⁇ i( ⁇ x i , ⁇ y i ), and therefore the enlargement factor of R(x, y) can be estimated from Rmes(x, y).
- the enlargement factor of R(x, y) is estimated by obtaining the factor of proportionality k at which the evaluation function E(k) depicted in Expression 12 is minimized.
- the intensity factor k in Expression 12 is calculated by the least-square method.
- the evaluation function E(k) may be sum of absolute values, other power sums, and the like, other than the sum of squares of the difference between Rmes(x, y) and R(x, y).
- the correction amount calculation unit 3 estimates the out-of-plane displacement vector by performing an operation to convert the estimated enlargement factor k into an amount of deflection ⁇ using Expression 8, to estimate the out-of-plane displacement vector.
- the displacement correction unit 4 extracts an in-plane displacement vector, by subtracting the out-of-plane displacement vector calculated by the correction amount calculation unit 3 as a correction amount, from the measurement vector obtained by the displacement calculation unit 2 .
- the in-plane displacement is extracted by calculating the out-of-plane displacement, and subtracting the calculated out-of-plane displacement from the measured displacement, taking an example in which the structure 12 has a crack along Y-direction as illustrated in FIG. 4B .
- the time-series images obtained by image-capturing the lower surface of the structure 12 illustrated in FIG. 3 in the image-capturing direction illustrated in this drawing before and after loading application are used.
- the image-capturing distance is set to be 5 m
- the structure 12 is assumed to be a double-supported beam under the condition equivalent to when 10 tons of loading is applied, which is made of concrete (Young's modulus of 40 GPa) and has a length of 20 m, a thickness of 0.5 m, and a width of 10 m.
- the area of the image at which the displacement is measured is assumed to be in the range of ⁇ 200 mm both in X-direction and Y-direction, with the cracked portion of the surface of the structure 12 serving as the image center.
- the lens focal distance of the camera of the image-capturing unit 11 is 50 mm and the pixel pitch to be 5 ⁇ m, so as to obtain pixel resolution of 250 ⁇ m at the image-capturing distance of 5 m.
- the image-capturing element of the image-capturing unit 11 is monochroic and has 2000 pixels horizontally and 2000 pixels vertically, to enable image-capturing the range of 0.5 m ⁇ 0.5 m at the image-capturing distance of 5 m.
- the frame rate of the image-capturing element is assumed to be 60 Hz.
- the image correlation is conducted by sub-pixel displacement estimation by quadratic curve interpolation, to enable displacement estimation up to 1/100 pixels, and 2.5 ⁇ m displacement resolution.
- the image displacement measurement area (in the range of ⁇ 200 mm to 200 mm in both X-direction and Y-direction) will have 1600 pixels horizontally and 1600 pixels vertically. For this pixel area, the operations of Expression 1 to Expression 12 are conducted.
- FIG. 9A and FIG. 9B are graphs in which the displacement obtained from Expression 6 is the displacement in the coordinates on the surface of the structure 12 to be measured, which do not take into consideration the out-of-plane displacement contained in the measurement vector V(Vx, Vy).
- FIG. 9A illustrating a displacement in X-direction
- the displacement of ⁇ 170 ⁇ m is caused in the range of ⁇ 200 mm from the image capturing range.
- FIG. 9B illustrating a displacement in Y-direction
- the displacement of ⁇ 160 ⁇ m is caused as a straight line, in the range of ⁇ 200 mm from the image capturing range.
- the displacement in X-direction is a displacement on which the out-of-plane displacement is superposed on the in-plane displacement.
- the displacement in Y-direction is a displacement with only the out-of-plane displacement.
- the factor of proportionality k at which the evaluation function E(k) in Expression 12 is minimized is obtained as 0.000008 using the measurement vector V(Vx, Vy) obtained in the displacement calculation unit 2 in the least-square method.
- the amount of deflection ⁇ is obtained to be 4 mm.
- the out-of-plane displacement vector ⁇ i( ⁇ x i , ⁇ y i ) is obtained. This result is input to the displacement correction unit 4 as an output of the correction amount calculation unit 3 .
- the displacement correction unit 4 obtains the in-plane displacement vector ⁇ i( ⁇ x i , ⁇ y i ) by subtracting the out-of-plane displacement vector ⁇ i( ⁇ x i , ⁇ y i ) obtained in the correction amount calculation unit 3 from the measurement vector V(Vx, Vy) obtained in the displacement calculation unit 2 , and calculates the in-plane displacements for X-direction and Y-direction from Expression 6.
- FIG. 10A and FIG. 10B illustrate an output of the displacement correction unit 4 .
- FIG. 10A is a graph depicting a displacement in X-direction, which illustrates occurrence of a steep and discontinuous displacement of 20 ⁇ m in the cracked portion.
- FIG. 10B is a graph depicting a displacement in Y-direction, in which the displacement is 0.
- the in-plane displacement on the structure surface can be extracted by being separated from the out-of-plane displacement.
- FIG. 11 is a diagram for explaining an out-of-plane displacement when there is a tilt in the structure 12 , in a calculation method of a correction amount adopted in the correction amount calculation unit 3 .
- the relation between the coordinates with z-axis being the optical axis of the image-capturing unit 11 and the coordinates with the normal line of the structure surface being z′ is expressed by Expression 13, Expression 14, and Expression 15.
- the function R( ⁇ ) is obtained by substituting Expression 18 and Expression 19 into Expression 7.
- the function R( ⁇ ) is used for each angle ⁇ to obtain k( ⁇ ) at which the evaluation function E(k) in Expression 12 is minimized, by changing ⁇ for example by 0.5° from 0° to 90°.
- the angle at which the evaluation function E(k) is minimized is set to be the tilt angle.
- the amount of deflection ⁇ is obtained. From the relation among the obtained tilt angle, the obtained amount of deflection ⁇ , and Expressions 13, 14, 15, 16, 17, 18, and 19, the out-of-plane displacement vector ⁇ i( ⁇ x i , ⁇ y i ) can be estimated.
- the displacement correction unit 4 obtains the in-plane displacement vector ⁇ i( ⁇ x i , ⁇ y i ) by subtracting the out-of-plane displacement vector ⁇ i( ⁇ x i , ⁇ y i ) from the measurement vector V(Vx, Vy).
- the in-plane displacement of the structure can be obtained by calculating the projection onto the surface after loading application with respect to the in-plane displacement vector ⁇ i( ⁇ x i , ⁇ y i ) using Expressions 13, 14, 15, 16, and 17.
- FIG. 11 deals with a case in which, where Y-axis serves as an axis, the normal line of the surface of the structure 12 is rotated by ⁇ with respect to the optical axis in the center of the image-capturing direction of the image-capturing unit 11 .
- correction is also possible in cases where X-axis or Z-axis serves as an axis.
- the in-plane displacement on the structure surface being the output of the displacement correction unit 4 , is replaced with the strain on the structure surface in the differential displacement calculation unit 5 .
- the stress will result. Accordingly, the stress field on the structure surface is obtained.
- the displacement information obtained by the displacement correction unit 4 and the strain information obtained by the differential displacement calculation unit 5 are input to the abnormality determination unit 6 .
- the abnormality determination unit 6 includes, in advance, a threshold value for determining a defect, and patterns of a characteristic displacement and strain for the type of defect, in the two-dimensional spatial distribution information analysis unit 7 and the temporal change information analysis unit 8 .
- the two-dimensional spatial distribution information analysis unit 7 and the temporal change information analysis unit 8 thereby determine the sound status or a defect such as a crack, a separation, and an internal cavity, as illustrated in FIG. 4A to FIG. 4D , by comparing the displacement information or the strain information with the threshold value or by means of pattern matching with the pattern.
- FIG. 10A illustrates an example of an in-plane displacement on a surface of a structure in X-direction due to loading application when there is a crack along Y-direction. It can be understood that a steep and discontinuous in-plane displacement of 20 ⁇ m is generated in the cracked portion. Such a sudden displacement will not be generated in a sound status without defects. Therefore, by providing a threshold value for a size of a discontinuous displacement in advance, a crack can be detected when a displacement exceeding this is confirmed.
- FIG. 12A and FIG. 12B illustrate a distribution of a stress field around a cracked portion calculated by the differential displacement calculation unit 5 when there is a crack along Y-direction.
- the direction of the stress will be bent by the crack. Therefore, even when there is a tensile stress exerted on both ends of the structure in X-direction in FIG. 12A , a Y-direction component will be generated in the direction of the stress in the vicinity of the crack as illustrated in FIG. 12B . Therefore, a crack can also be detected by detecting whether there is this Y-direction component.
- a distribution of such a stress field around a crack is known as a stress intensity factor in an elastic body which exhibits a linear response, and thus such information can also be used.
- FIG. 13A to FIG. 13D illustrate an example of a two-dimensional displacement distribution of a displacement amount around a crack.
- FIG. 13A and FIG. 13B are a contour of a displacement amount in a direction horizontal (X-direction) in FIG. 4B and in a direction vertical (Y-direction) to the paper in which the drawing is drawn in FIG. 4B .
- the contour of the displacement amount is less dense around a crack than in the area without cracks. This corresponds to the portion of a moderate displacement outside the steep displacement in the cracked portion illustrated in FIG. 10A .
- the displacement in this portion is more moderate than the displacement without cracks.
- a Y-direction component of a displacement is generated in an area around the cracked portion. This corresponds to the Y-direction component in the stress field (strain) illustrated in FIG. 12B .
- FIG. 13C and FIG. 13D each illustrate a case in which a crack is deeper than in the cases of FIG. 13A and FIG. 13B .
- the contour of the displacement amount is less dense in an area around a crack in each of X-direction and Y-direction. It is also possible to know the depth of a crack, from this density information.
- the determination of a crack as described above is performed in the two-dimensional spatial distribution information analysis unit 7 in the abnormality determination unit 6 in FIG. 2 .
- the strain in X-direction becomes rapidly large at the cracked portion. For this reason, by preparing a threshold value for the strain value in X-direction, it is possible to expect a crack at a location where a strain that exceeds the threshold value is detected.
- Each threshold value described above can be set by a simulation using a size or a material similar to those of the structure, an experiment using a reduced-size model, and the like.
- the threshold value can also be set by measuring the actual structure for a long period of time and accumulating the data.
- the above-described determination can also be performed by pattern matching processing as described below, not limited to the above-described numerical comparison.
- FIG. 14A to FIG. 14C are a diagram illustrating pattern matching processing of a displacement distribution by the two-dimensional spatial distribution information analysis unit 7 .
- the displacement amount can be represented as a displacement diagram on the X-Y plane, as illustrated in FIG. 13A to FIG. 13D .
- the two-dimensional spatial distribution information analysis unit 7 rotates, or scales up or down the pattern in X-direction of the displacement around the crack having been stored in advance, subjects the same to pattern matching with the displacement distribution diagram obtained in the displacement correction unit 4 , to determine the direction and depth of the crack.
- the pattern in X-direction of the displacement around the crack having been stored in advance may be created in advance by simulation or the like, for each depth or width of a crack.
- the two-dimensional spatial distribution information analysis unit 7 rotates, or scales up or down the pattern in Y-direction of the displacement around the crack having been stored in advance, subjects the same to pattern matching with the displacement distribution diagram obtained in the displacement correction unit 4 , to determine the direction and depth of the crack.
- the pattern in Y-direction of the displacement around the crack having been stored in advance may be created in advance by simulation or the like, for each depth or width of a crack.
- the two-dimensional spatial distribution information analysis unit 7 rotates, or scales up or down the pattern of the differential vector field of the displacement around the crack having been stored in advance, subjects the same to pattern matching with the differential vector field (corresponding to a stress field) obtained in differential displacement calculation unit 5 , to determine the direction and depth of the crack.
- the pattern of the differential vector field of the displacement around the crack having been stored in advance may be created in advance by simulation or the like, for each depth or width of a crack.
- a correlation operation is used in the pattern matching.
- the pattern matching may be performed using various other statistical operational approaches.
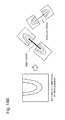
- FIG. 15A and FIG. 15B illustrate a two-dimensional distribution of a stress on a surface viewed along the image-capturing direction when there is an internal cavity as illustrated in FIG. 4D , where FIG. 15A is a perspective view and FIG. 15B is a plan view.
- loading causes a stress exerted in X-direction in the drawing.
- the stress field is bent, to causes the stress to contain a component in Y-direction as illustrated in the drawing.
- FIG. 16A to FIG. 16C are diagrams illustrating a contour and a stress field of a displacement of a surface viewed along the image-capturing direction when there is an internal cavity.
- FIG. 16A illustrates a contour of an X-component of the displacement
- FIG. 16B illustrates a contour of a Y-component of the displacement
- FIG. 16C illustrates a stress field.
- a strain amount is small in a cavity portion. Therefore, the density of the contour of the X-component of the displacement illustrated in FIG. 16A is small.
- the contour of the Y-component of the displacement illustrated in FIG. 16B takes a form of a closed curve.
- the stress field which is a differential of the displacement and is illustrated in FIG. 16C , is bent at the cavity portion. The effect of the stress field on the surface gets more noticeable when the cavity portion is closer to the surface. Therefore, the depth of a cavity portion from the surface can also be estimated from how the stress field is bent.
- the status determination of the location and depth of the internal cavity can be performed.
- the pattern matching uses a correlation operation.
- the pattern matching may be performed using various other statistical operational approaches.
- FIG. 17A and FIG. 17B are diagrams for explaining a response when short-term loading (referred to as “impulse stimulation”) is applied onto a structure having an internal cavity.
- the impulse stimulation can be applied on a location to be applied with loading, for example.
- FIG. 17B illustrates a time response of displacement at each point A, B, C on a surface illustrated in FIG. 17A in response to this impulse stimulation.
- the stress is conveyed fast, and the amplitude of displacement is great.
- point C since the stress is not conveyed within the internal cavity but is conveyed from around the cavity, the stress is conveyed slowly and the amplitude of the displacement is small.
- the stress conveyance time and amplitude are the values between those of point A and point C. Therefore, when the displacement distribution within the plane when the structure is viewed along the image-capturing direction is subject to frequency analysis in the temporal change information analysis unit 8 in the abnormality determination unit 6 , the area of the internal cavity can be identified, from the amplitude and the phase near the resonant frequency. An internal cavity may be determined by the shift in the resonant frequency.
- the temporal change information analysis unit 8 can still identify the area of the internal cavity.
- the temporal change information analysis unit 8 performs the above-described displacement time response processing by frequency analysis using fast Fourier transform.
- the frequency analysis may be performed by various types of frequency analysis approaches, such as wavelet transform.
- FIG. 18A to FIG. 18C are diagrams illustrating a contour and a stress field of a displacement of a surface viewed along the image-capturing direction when there is a separation.
- FIG. 18A illustrates a contour of an X-component of the displacement
- FIG. 18B illustrates a contour of a Y-component of the displacement
- FIG. 18C illustrates a stress field.
- FIG. 18A illustrates a contour of an X-component of a displacement.
- the separated portion does not have a contour because there is no strain and moves in a certain direction.
- the abnormality determination unit 6 determines that there is a separation.
- the portion corresponding to point A in the drawing is a cleavage due to a separation, at which a stress is hardly conveyed, and has a less dense contour than in point B which is a sound portion.
- the abnormality determination unit 6 may use this characteristic to distinguish between the separated portion and the sound portion.
- FIG. 18B illustrates a contour of a Y-component of a displacement.
- a Y-direction displacement is caused at a portion outside the separated portion.
- the abnormality determination unit 6 can determine that there is a separation.
- the stress field that is a differential of the displacement illustrated in FIG. 18C takes either 0 or a value near 0 at the separated portion.
- the abnormality determination unit 6 may use this characteristic to determine that there is a separation.
- the location of the separation can be determined.
- the pattern matching uses a correlation operation.
- the pattern matching may be performed using various other statistical operational approaches.
- FIG. 19 is a diagram illustrating a time response when the structure having a separation is subject to an impulse stimulation.
- the separated portion has a displacement that is reverse to that of the sound portion; that is, the separated portion takes a waveform whose phase is 180° different from the sound portion.
- the separated portion has a great amplitude because of being light.
- the separated portion can be identified based on the amplitude and the phase.
- a separated portion likely include a frequency component different from that of the entire structure. Therefore, a separated portion may be determined by the shift in the resonant frequency.
- the temporal change information analysis unit 8 performs frequency analysis using fast Fourier transform.
- the frequency analysis may be performed by various types of frequency analysis approaches, such as wavelet transform.
- FIG. 20 is a flowchart illustrating a status determination method of the status determination device 1 as illustrated in FIG. 2 .
- Step S 1 the displacement calculation unit 2 in the status determination device 1 takes in a frame image before loading application which serves as a reference in calculating a displacement amount after the loading application, compared to before the loading application, for the time-series images of the surface of the structure 12 before and after the loading application which have been captured by the image-capturing unit 11 , and further takes in frame images after the loading application in time series.
- the displacement calculation unit 2 calculates a displacement amounts in X, Y-directions of the image after the loading application with respect to the image before the loading application which serves as a reference.
- a displacement distribution diagram (a contour of the displacement amount) may also be drawn in which the two-dimensional distribution of the calculated displacement amount is displayed on the X-Y plane.
- the displacement calculation unit 2 inputs the calculated displacement amount or the displacement distribution diagram, to the correction amount calculation unit 3 and the displacement correction unit 4 .
- Step S 2 from the two-dimensional spatial distribution of the displacement of the time-series images calculated by the displacement calculation unit 2 , the correction amount calculation unit 3 estimates distance information representing a distance in which the surface of the structure 12 has moved in its normal direction by deflection of the structure 12 due to loading or the like, as well as tilt information representing an angle formed by the optical axis of the image-capturing unit 11 and the normal line of the surface of the structure 12 .
- Step S 3 the correction amount calculation unit 3 calculates an out-of-plane displacement from the distance information and the tilt information.
- Step S 4 the displacement correction unit 4 extracts the in-plane displacement by subtracting the out-of-plane displacement obtained in the correction amount calculation unit 3 , from the displacement amount obtained in the displacement calculation unit 2 . That is, the displacement correction unit 4 calculates the in-plane displacement in the X-Y direction of the surface of the structure 12 after loading application, with respect to before the loading application which serves as a reference.
- a displacement distribution diagram (a contour of the displacement amount) may also be drawn in which the two-dimensional distribution of the calculated in-plane displacement is displayed on the X-Y plane.
- the displacement correction unit 4 inputs the calculated result, to the differential displacement calculation unit 5 and the abnormality determination unit 6 .
- Step S 5 the differential displacement calculation unit 5 subjects the in-plane displacement or the displacement distribution diagram input by the displacement correction unit 4 to spatial differential processing, to calculate a differential displacement amount (stress value) or a differential displacement distribution diagram (stress field).
- the differential displacement calculation unit 5 inputs the calculated result to the abnormality determination unit 6 .
- Step S 6 , Step S 7 , and Step S 8 are steps in which the two-dimensional spatial distribution information analysis unit 7 of the abnormality determination unit 6 determines a crack, a separation, and an internal cavity, being a defect of a structure.
- the pattern matching method and the method by way of a threshold value having been described above, are taken as an example.
- Step S 6 the two-dimensional spatial distribution information analysis unit 7 of the abnormality determination unit 6 determines the status of a crack, a separation, or an internal cavity, from the displacement amount in X-direction or the displacement distribution diagram having been input.
- the two-dimensional spatial distribution information analysis unit 7 includes, as a database, a displacement distribution pattern created in advance corresponding to a width, a depth, or the like of a crack, an internal cavity, or a separation as illustrated in FIG. 14A , FIG. 16A , and FIG. 18A .
- the two-dimensional spatial distribution information analysis unit 7 performs pattern matching, by rotating or scaling up or down these displacement distribution patterns with respect to the displacement distribution diagram in X-direction input from the displacement correction unit 4 , thereby determining the location or type of the defect on the X-Y plane.
- the two-dimensional spatial distribution information analysis unit 7 determines continuity of the displacement amount, for example, based on the displacement amount in X-direction having been input. That is, as illustrated in FIG. 10A , whether there is continuity is determined based on whether there is a sudden change of a threshold value or above in the displacement amount.
- the two-dimensional spatial distribution information analysis unit 7 determines that there is a possibility of a crack or a separation existing in that part, and sets a discontinuity flag Dis C(x, y, t) to 1, and records, as numerical value information, the displacement amount data for the portion subject to the sudden change.
- “t” indicates a time of the frame image taken in Step S 1 on the time-series images.
- the abnormality determination unit 6 inputs, to the abnormality map creation unit 9 , information on the defect determined by the pattern matching, or the discontinuity flag Dis C(x, y, t) or the numerical value information determined by the threshold value of the displacement amount.
- Step S 7 the two-dimensional spatial distribution information analysis unit 7 of the abnormality determination unit 6 determines the status of a crack, a separation, or an internal cavity, from the displacement amount in Y-direction or the displacement distribution diagram having been input.
- the two-dimensional spatial distribution information analysis unit 7 includes, as a database, a displacement distribution pattern created in advance corresponding to a width, a depth, or the like of a crack, an internal cavity, or a separation as illustrated in FIG. 14B , FIG. 16B , and FIG. 18B .
- the two-dimensional spatial distribution information analysis unit 7 performs pattern matching, by rotating or scaling up or down these displacement distribution patterns with respect to the displacement distribution diagram in Y-direction input from the displacement correction unit 4 , thereby determining the location or type of the defect on the X-Y plane.
- the two-dimensional spatial distribution information analysis unit 7 determines that there is a defect in that part, and sets an orthogonal flag ortho(x, y, t) to 1, and records, as numerical value information, the displacement amount data for the portion for which a displacement amount which is greater than the pre-set threshold value has been detected.
- the abnormality determination unit 6 inputs, to the abnormality map creation unit 9 , the information on the defect determined by pattern matching, or the orthogonal flag ortho(x, y, t) or the numerical value information determined by the displacement amount.
- Step S 8 the two-dimensional spatial distribution information analysis unit 7 of the abnormality determination unit 6 determines the status of a crack, a separation, or an internal cavity, from the differential displacement amount (stress value) or the differential displacement distribution diagram (stress field) having been input.
- the two-dimensional spatial distribution information analysis unit 7 includes, as a database, a displacement distribution pattern created in advance corresponding to a width, a depth, or the like of a crack, an internal cavity, or a separation as illustrated in FIG. 14C , FIG. 16C , and FIG. 18C .
- the two-dimensional spatial distribution information analysis unit 7 performs pattern matching, by rotating or scaling up or down these displacement distribution patterns with respect to the differential displacement distribution diagram input from the differential displacement calculation unit 5 , thereby determining the location or type of the defect on the X-Y plane.
- the two-dimensional spatial distribution information analysis unit 7 determines that there is a crack in the portion based on the input differential displacement amount, and sets the differential value flag Diff(x, y, t) to 1, and records, as numerical value information, the differential displacement amount data for the defective portion.
- the abnormality determination unit 6 inputs, to the abnormality map creation unit 9 , information on the defect determined by the pattern matching, or the differential value flag Diff(x, y, t) or the numerical value information determined by the differential displacement amount.
- Step S 9 the displacement calculation unit 2 determines whether the processing of each frame image of the time-series images is completed. That is, if there are n frames in the time-series images, the displacement calculation unit 2 determines whether the processing of n-th frame is completed. If the processing of the n frame images has not been completed (NO), the processing is repeated from Step S 1 . This is repeated until the n frame images are processed. Note that “n” is not limited to the total number of frames, and may be set to any number. When the processing of the n frame images has been completed (YES), the processing proceeds to Step S 10 .
- Step S 10 the temporal change information analysis unit 8 of the abnormality determination unit 6 analyzes the time response of the displacement as illustrated in FIG. 17B or FIG. 19 , based on the time-series displacement amount or the displacement distribution diagram corresponding to the n frame images. That is, from n displacement distribution diagrams I(x, y, n), a time frequency distribution (time frequency is denoted as “f”) is calculated as a amplitude A(x, y, f), and a phase P(x, y, f).
- time frequency distribution time frequency is denoted as “f”
- the temporal change information analysis unit 8 determines that there is an internal cavity in a portion that undergoes phase shift.
- the temporal change information analysis unit 8 determines that there is a separation in a portion between them.
- the temporal change information analysis unit 8 inputs the above-described time frequency distribution calculation result and defect determination result to the abnormality map creation unit 9 .
- Step S 11 the abnormality map creation unit 9 creates an abnormality map (x, y) based on the information input in the above-steps.
- the result sent from the two-dimensional spatial distribution information analysis unit 7 and the temporal change information analysis unit 8 is a group of data related to the point (x, y) on the X-Y coordinates.
- the structure status of these pieces of data is determined by the two-dimensional spatial distribution information analysis unit 7 and the temporal change information analysis unit 8 in the abnormality determination unit 6 .
- the abnormality map creation unit 9 can still decide the status of the corresponding portion in the X-Y coordinates, due to determination made for the displacement amount in X-direction and the differential displacement amount, and can create an abnormality map (x, y) based on this decision.
- the decision when there is any discrepancy in determination among X-direction displacement, Y-direction displacement, and differential displacement, the decision may be made by majority decision, or it is also possible to decide on the item having the greatest difference from the threshold value being the determination reference.
- the abnormality map creation unit 9 may represent the degree of the defect based on various types of numerical value information described above. For example, it is possible to represent the width or depth of the crack, the size of the separation, or the size or depth from a surface of the internal cavity.
- the abnormality map creation unit 9 perform determination of the defect status of the structure while creating the abnormality map (x, y), which is performed by the two-dimensional spatial distribution information analysis unit 7 and the temporal change information analysis unit 8 in the abnormality determination unit 6 . That is, analysis data may be obtained from the two-dimensional spatial distribution information analysis unit 7 and the temporal change information analysis unit 8 , and the determination of the defect status based on that analysis data may be performed by the abnormality map creation unit 9 .
- the output of the result from the abnormality map creation unit 9 may be information in the form in which a person can directly view on a display device, or information in the form in which a machine can read.
- the lens focal distance of the image-capturing unit 11 may be 50 mm, and the pixel pitch may be 5 ⁇ m, so as to be able to obtain a pixel resolution of 500 ⁇ m at an image-capturing distance of 5 m.
- the image-capturing element of the image-capturing unit 11 may be monochroic, and has 2000 pixels horizontally and 2000 pixels vertically, to enable image-capturing the range of 1 m ⁇ 1 m at an image-capturing distance of 5 m.
- the frame rate of the image-capturing element may be 60 Hz.
- the sub-pixel displacement estimation by means of quadratic curve interpolation is adopted in the image correlation in the displacement calculation unit 2 , so as to realize displacement estimation up to 1/100 pixels, and to obtain the displacement resolution of 5 ⁇ m displacement.
- the sub-pixel displacement estimation in image estimation may adopt the various methods as described below.
- a smoothing filter may be used to reduce the noise when performing the differential operation.
- Interpolation using quadratic curve, conformal straight line, or the like may be used for the sub-pixel displacement estimation.
- various methods such as SAD (Sum of Absolute Difference) method, or SSD (Sum of Squared Difference) method, NCC (Normalized Cross Correlation) method, and ZNCC (Zero-mean Normalized Cross Correlation) method may be used. It is also possible to use any combination between these methods and the above-described sub-pixel displacement estimation method.
- the lens focal distance of the image-capturing unit 11 and the pixel pitch, the pixel number, and the frame rate of the image-capturing element may be changed, depending on the object to be measured, where necessary.
- the beam-like structure may correspond to a bridge, and the loading may correspond to a traveling vehicle.
- loading was explained to be applied on the beam-like structure.
- the present example embodiment can be applied to any structure having a different material, size, or form, and to any loading method different from the method to apply loading on the structure, for example a loading method such as hanging the loading, as long as the structure can behave just as in the above description from the viewpoint of material mechanics.
- an array laser Doppler sensor an array strain gauge, an array oscillation sensor, and an array acceleration sensor or the like may be used, as long as it can measure the time-series signals of a spatial two-dimensional distribution of the surface displacement of a structure.
- the spatial two-dimensional time-series signals obtained from these array sensors may be treated as image information.
- the present example embodiment it is possible to obtain distance information or tilt information for calculating the out-of-plane displacement due to movement of a structure surface in the normal direction, from the images obtained by image-capturing the structure surface before and after loading application.
- the structure is a bridge or the like, from an operational point of view, it is extremely difficult to measure the bridge from its side, and therefore the measurement accuracy thereof is degraded.
- the present example embodiment can resolve this operational difficulty, and therefore can amend the displacement of the images of the structure surface with high accuracy.
- a status determination device comprising:
- a displacement calculation unit that, from time-series images of a structure surface before and after loading application, calculates a two-dimensional spatial distribution of a displacement of the time-series images
- a correction amount calculation unit that calculates a correction amount based on a moving amount of the structure surface in a normal direction due to the loading application, from the two-dimensional spatial distribution of the displacement of the time-series images;
- a displacement correction unit that extracts a two-dimensional spatial distribution of a displacement of the structure surface, by subtracting the correction amount from the two-dimensional spatial distribution of the displacement of the time-series images
- an abnormality determination unit that identifies a defect of the structure, based on comparison between the two-dimensional spatial distribution of the displacement of the structure surface and a prepared spatial distribution of a displacement having been prepared in advance.
- the correction amount calculation unit estimates a tilt angle of the structure from the time-series images, and calculates the correction amount based on the moving amount corrected using the tilt angle.
- the status determination device comprising:
- a differential displacement calculation unit that calculates a two-dimensional differential spatial distribution from the two-dimensional spatial distribution of the displacement of the structure surface
- the abnormality determination unit identifies a defect of the structure, based on comparison between the two-dimensional differential spatial distribution and a differential spatial distribution of a differential displacement having been prepared in advance.
- the abnormality determination unit identifies a defect of the structure, based on a temporal change of the two-dimensional spatial distribution of the displacement of the structure surface.
- the abnormality determination unit identifies a defect of the structure, based on a temporal change of the two-dimensional differential spatial distribution.
- the abnormality determination unit identifies a defect of the structure, based on comparison between a displacement amount of the displacement of the structure surface and a threshold value having been prepared in advance.
- the abnormality determination unit identifies a defect of the structure, based on comparison between a differential displacement amount of the displacement of the structure surface and a threshold value having been prepared in advance.
- the status determination device according to any one of Supplementary notes 1 to 7, comprising:
- an abnormality map creation unit that creates an abnormality map that represents a location and a type of the defect, based on a determination result of the abnormality determination unit.
- the type of the defect includes a crack, a separation, and an internal cavity.
- the prepared spatial distribution of the displacement and the prepared differential spatial distribution of the differential displacement are based on information of the crack, the separation, and the internal cavity.
- the two-dimensional spatial distribution includes a distribution of an X-direction displacement of the displacement on an X-Y plane and a distribution of a Y-direction displacement of the displacement on the X-Y plane.
- a status determination system comprising:
- a status determination device that includes: a displacement calculation unit that, from time-series images of a structure surface before and after loading application, calculates a two-dimensional spatial distribution of a displacement of the time-series images; a correction amount calculation unit that calculates a correction amount based on a moving amount of the structure surface in a normal direction due to the loading application, from the two-dimensional spatial distribution of the displacement of the time-series images; a displacement correction unit that extracts a two-dimensional spatial distribution of a displacement of the structure surface, by subtracting the correction amount from the two-dimensional spatial distribution of the displacement of the time-series images; and an abnormality determination unit that identifies a defect of the structure, based on comparison between the two-dimensional spatial distribution of the displacement of the structure surface and a spatial distribution of a displacement having been prepared in advance; and
- an image-capturing unit that captures the time-series images and provides the status determination device with the time-series images.
- the correction amount calculation unit estimates a tilt angle of the structure from the time-series images, and calculates the correction amount based on the moving amount corrected using the tilt angle.
- a differential displacement calculation unit that calculates a two-dimensional differential spatial distribution from the two-dimensional spatial distribution of the displacement of the structure surface
- the abnormality determination unit identifies a defect of the structure, based on comparison between the two-dimensional differential spatial distribution and a differential spatial distribution of a differential displacement having been prepared in advance.
- the abnormality determination unit identifies a defect of the structure, based on a temporal change of the two-dimensional spatial distribution of the displacement of the structure surface.
- the abnormality determination unit identifies a defect of the structure, based on a temporal change of the two-dimensional differential spatial distribution.
- the abnormality determination unit identifies a defect of the structure, based on comparison between a displacement amount of the displacement of the structure surface and a threshold value having been prepared in advance.
- the abnormality determination unit identifies a defect of the structure, based on comparison between a differential displacement amount of the displacement of the structure surface and a threshold value having been prepared in advance.
- the status determination system according to any one of Supplementary notes 12 to 18, comprising:
- an abnormality map creation unit that creates an abnormality map that represents a location and a type of the defect, based on a determination result of the abnormality determination unit.
- the type of the defect includes a crack, a separation, and an internal cavity.
- the prepared spatial distribution of the displacement and the prepared differential spatial distribution of the differential displacement are based on information of the crack, the separation, and the internal cavity.
- the two-dimensional spatial distribution includes a distribution of an X-direction displacement of the displacement on an X-Y plane and a distribution of a Y-direction displacement of the displacement on the X-Y plane.
- a status determination method comprising:
- identifying a defect of the structure based on comparison between the two-dimensional spatial distribution of the displacement of the structure surface and a spatial distribution of a displacement having been prepared in advance.
- a tilt angle of the structure is estimated from the time-series images, and the correction amount is calculated based on the moving amount corrected using the tilt angle.
- a defect of the structure is identified, based on comparison between the two-dimensional differential spatial distribution and a differential spatial distribution of a differential displacement having been prepared in advance.
- a defect of the structure is identified, based on a temporal change of the two-dimensional spatial distribution of the displacement of the structure surface.
- a defect of the structure is identified, based on a temporal change of the two-dimensional differential spatial distribution.
- a defect of the structure is identified, based on comparison between a displacement amount of the displacement of the structure surface and a threshold value having been prepared in advance.
- a defect of the structure is identified, based on comparison between a differential displacement amount of the displacement of the structure surface and a threshold value having been prepared in advance.
- the type of the defect includes a crack, a separation, and an internal cavity.
- the prepared spatial distribution of the displacement and the prepared differential spatial distribution of the differential displacement are based on information of the crack, the separation, and the internal cavity.
- the two-dimensional spatial distribution includes a distribution of an X-direction displacement of the displacement on an X-Y plane and a distribution of a Y-direction displacement of the displacement on the X-Y plane.
- the present invention can be applied to devices and systems that detect such defects as a crack, a separation, and an internal cavity generated in a structure such as a tunnel and a bridge, by observing from a remote location.
Landscapes
- Physics & Mathematics (AREA)
- General Physics & Mathematics (AREA)
- Engineering & Computer Science (AREA)
- Aviation & Aerospace Engineering (AREA)
- General Health & Medical Sciences (AREA)
- Biochemistry (AREA)
- Pathology (AREA)
- Health & Medical Sciences (AREA)
- Life Sciences & Earth Sciences (AREA)
- Chemical & Material Sciences (AREA)
- Analytical Chemistry (AREA)
- Immunology (AREA)
- Electromagnetism (AREA)
- Computer Vision & Pattern Recognition (AREA)
- Signal Processing (AREA)
- Length Measuring Devices By Optical Means (AREA)
- Investigating Materials By The Use Of Optical Means Adapted For Particular Applications (AREA)
- Testing Of Devices, Machine Parts, Or Other Structures Thereof (AREA)
Abstract
Description
- [PTL 1] Japanese Patent Application Publication No. 2003-035528
- [PTL 2] Japanese Patent Application Publication No. 2008-232998
- [PTL 3] Japanese Patent Application Publication No. 2006-343160
- [PTL 4] Japanese Patent Application Publication No. 2004-347585
- [PTL 5] Japanese Patent Application Publication No. 2002-236100
- [PTL 6] Japanese Patent Application Publication No. 2012-132786
- [NPL 1] Z. Wang, et al., “Crack-opening displacement estimation method based on sequence of motion vector field images for civil infrastructure deterioration inspection”, Image Media Processing Symposium (PCSJ/IMPS2014), 1-1-17, The Institute of Electronics, Information and Communication Engineers, Nov. 12, 2014
Rmes(x,y)=√{square root over (Vx(x,y)2 +Vy(x,y)2)} (Expression 10)
[Math. 11]
V(V x ,V y)=Δi(Δx i ,Δy i)+(δx i ,δy i) (Expression 11)
x′=x*cos θ+z*sin θ (Expression 13)
[Math. 14]
y′=y (Expression 14)
[Math. 15]
z′=−x·sin θ+z*cos θ (Expression 15)
- 1, 100 status determination device
- 2 displacement calculation unit
- 3 correction amount calculation unit
- 4 displacement correction unit
- 5 differential displacement calculation unit
- 6 abnormality determination unit
- 7 two-dimensional spatial distribution information analysis unit
- 8 temporal change information analysis unit
- 9 abnormality map creation unit
- 10 status determination system
- 11 image-capturing unit
- 12 structure
- 13 defect
Claims (10)
Applications Claiming Priority (3)
| Application Number | Priority Date | Filing Date | Title |
|---|---|---|---|
| JP2015057047 | 2015-03-20 | ||
| JP2015-057047 | 2015-03-20 | ||
| PCT/JP2016/001421 WO2016152075A1 (en) | 2015-03-20 | 2016-03-14 | Structure status determination device, status determination system, and status determination method |
Publications (2)
| Publication Number | Publication Date |
|---|---|
| US20180052117A1 US20180052117A1 (en) | 2018-02-22 |
| US10190992B2 true US10190992B2 (en) | 2019-01-29 |
Family
ID=56978255
Family Applications (1)
| Application Number | Title | Priority Date | Filing Date |
|---|---|---|---|
| US15/555,154 Active US10190992B2 (en) | 2015-03-20 | 2016-03-14 | Structure status determination device, status determination system, and status determination method |
Country Status (3)
| Country | Link |
|---|---|
| US (1) | US10190992B2 (en) |
| JP (1) | JPWO2016152075A1 (en) |
| WO (1) | WO2016152075A1 (en) |
Cited By (1)
| Publication number | Priority date | Publication date | Assignee | Title |
|---|---|---|---|---|
| US11561078B2 (en) * | 2020-04-03 | 2023-01-24 | The Boeing Company | Methods and systems for measuring gaps between exterior structures and interior structures |
Families Citing this family (17)
| Publication number | Priority date | Publication date | Assignee | Title |
|---|---|---|---|---|
| US11365963B2 (en) | 2017-09-12 | 2022-06-21 | Nec Corporation | State determination apparatus, state determination method, and computer-readable recording medium |
| JP6954367B2 (en) * | 2017-11-14 | 2021-10-27 | 日本電気株式会社 | Measurement system, correction processing device, correction processing method, and program |
| WO2019097579A1 (en) * | 2017-11-14 | 2019-05-23 | 日本電気株式会社 | Vibration measurement device, vibration measurement method and computer-readable recording medium |
| WO2019097578A1 (en) * | 2017-11-14 | 2019-05-23 | 日本電気株式会社 | Displacement component detection device, displacement component detection method, and computer-readable recording medium |
| WO2019163556A1 (en) * | 2018-02-22 | 2019-08-29 | パナソニックIpマネジメント株式会社 | Inspection device and inspection method |
| WO2019176464A1 (en) * | 2018-03-15 | 2019-09-19 | パナソニックIpマネジメント株式会社 | Inspection device and inspection method |
| JP2019215203A (en) * | 2018-06-12 | 2019-12-19 | セイコーエプソン株式会社 | Display device, display method, program, recording medium, and structure monitoring system |
| US11790511B2 (en) | 2018-07-27 | 2023-10-17 | Nec Corporation | Information processing device, system, and method |
| WO2020065959A1 (en) * | 2018-09-28 | 2020-04-02 | 日本電気株式会社 | Information processing device, control method, and program |
| JP6996642B2 (en) * | 2018-11-14 | 2022-01-17 | 日本電気株式会社 | Information processing equipment, control methods, and programs |
| WO2021111533A1 (en) | 2019-12-04 | 2021-06-10 | 日本電気株式会社 | Abnormality determination device, abnormality determination method, and program storage medium |
| JP7453542B2 (en) * | 2020-06-08 | 2024-03-21 | 日本製鉄株式会社 | Estimation device, estimation method, and program |
| US12553195B2 (en) * | 2020-10-15 | 2026-02-17 | Nec Corporation | Deterioration determination device, deterioration determination method, and recording medium |
| JP7643210B2 (en) * | 2021-06-30 | 2025-03-11 | セイコーエプソン株式会社 | DERIVATION METHOD, DERIVATION DEVICE, DERIVATION SYSTEM, AND PROGRAM |
| WO2023009890A1 (en) * | 2021-07-30 | 2023-02-02 | Tensar International Corporation | Systems and methods for sensor enabled monitoring of working platforms |
| WO2023013058A1 (en) * | 2021-08-06 | 2023-02-09 | 日本電気株式会社 | State determination device, state determination method, and computer-readable recording medium |
| CN115828373A (en) * | 2022-11-14 | 2023-03-21 | 中国核电工程有限公司 | Method for determining vulnerability of structure, storage medium and device |
Citations (11)
| Publication number | Priority date | Publication date | Assignee | Title |
|---|---|---|---|---|
| JPS62150111A (en) | 1985-12-25 | 1987-07-04 | Mitsubishi Heavy Ind Ltd | Laser speckle distortion measuring device |
| JP2002236100A (en) | 2001-02-09 | 2002-08-23 | Hitachi Ltd | Nondestructive inspection method and device |
| JP2003035528A (en) | 2001-07-19 | 2003-02-07 | Ohbayashi Corp | System and method for evaluating damage degree of structure by crack image measurement |
| JP2004347585A (en) | 2003-02-21 | 2004-12-09 | Fast:Kk | Inspection/analysis system for construction and civil engineering structure |
| JP2005533320A (en) | 2002-07-18 | 2005-11-04 | ザ ユニバーシティ オブ ノッティンガム | Image analysis method, apparatus and software |
| JP2006343160A (en) | 2005-06-08 | 2006-12-21 | Kanazawa Inst Of Technology | Displacement measurement method and stress measurement method for structures using captured images |
| JP2007071793A (en) | 2005-09-09 | 2007-03-22 | Hitachi Zosen Corp | Method for detecting cracks in structural members |
| US20080160431A1 (en) * | 2006-11-22 | 2008-07-03 | Jeffrey Scott | Apparatus and method for conformal mask manufacturing |
| JP2008232998A (en) | 2007-03-23 | 2008-10-02 | Osaka Univ | Method for measuring stress fluctuation distribution of structure and measuring apparatus thereof, method for detecting defect in structure and method for grasping risk of structure |
| JP2012132786A (en) | 2010-12-21 | 2012-07-12 | Mitsubishi Heavy Ind Ltd | Strain measuring device and strain measuring system |
| US20150215584A1 (en) * | 2014-01-28 | 2015-07-30 | The Boeing Company | Non-Destructive Evaluation of Structures Using Motion Magnification Technology |
-
2016
- 2016-03-14 WO PCT/JP2016/001421 patent/WO2016152075A1/en not_active Ceased
- 2016-03-14 US US15/555,154 patent/US10190992B2/en active Active
- 2016-03-14 JP JP2017507466A patent/JPWO2016152075A1/en active Pending
Patent Citations (13)
| Publication number | Priority date | Publication date | Assignee | Title |
|---|---|---|---|---|
| JPS62150111A (en) | 1985-12-25 | 1987-07-04 | Mitsubishi Heavy Ind Ltd | Laser speckle distortion measuring device |
| JP2002236100A (en) | 2001-02-09 | 2002-08-23 | Hitachi Ltd | Nondestructive inspection method and device |
| US20020154811A1 (en) | 2001-02-09 | 2002-10-24 | Hitachi, Ltd. | Method for non-destructive inspection, apparatus thereof and digital camera system |
| JP2003035528A (en) | 2001-07-19 | 2003-02-07 | Ohbayashi Corp | System and method for evaluating damage degree of structure by crack image measurement |
| US20060098861A1 (en) | 2002-07-18 | 2006-05-11 | See Chung W | Image analysis method, apparatus and software |
| JP2005533320A (en) | 2002-07-18 | 2005-11-04 | ザ ユニバーシティ オブ ノッティンガム | Image analysis method, apparatus and software |
| JP2004347585A (en) | 2003-02-21 | 2004-12-09 | Fast:Kk | Inspection/analysis system for construction and civil engineering structure |
| JP2006343160A (en) | 2005-06-08 | 2006-12-21 | Kanazawa Inst Of Technology | Displacement measurement method and stress measurement method for structures using captured images |
| JP2007071793A (en) | 2005-09-09 | 2007-03-22 | Hitachi Zosen Corp | Method for detecting cracks in structural members |
| US20080160431A1 (en) * | 2006-11-22 | 2008-07-03 | Jeffrey Scott | Apparatus and method for conformal mask manufacturing |
| JP2008232998A (en) | 2007-03-23 | 2008-10-02 | Osaka Univ | Method for measuring stress fluctuation distribution of structure and measuring apparatus thereof, method for detecting defect in structure and method for grasping risk of structure |
| JP2012132786A (en) | 2010-12-21 | 2012-07-12 | Mitsubishi Heavy Ind Ltd | Strain measuring device and strain measuring system |
| US20150215584A1 (en) * | 2014-01-28 | 2015-07-30 | The Boeing Company | Non-Destructive Evaluation of Structures Using Motion Magnification Technology |
Non-Patent Citations (3)
| Title |
|---|
| International Search Report dated Jun. 7, 2016, in counterpart international application No. PCT/JP2016/001421. |
| Written Opinion of International Search Authority dated Jun. 7, 2016, in counterpart international application No. PCT/JP2016/001421. |
| Zhen Wang et al., "Crack-opening displacement estimation method based on sequence of motion vector field images for civil infrastructure deterioration inspection", Image Media Processing Symposium (PCSJ/IMPS2014), Jan. 1, 2017, The Institute of Electronics, Information and Communication Engineers, Nov. 12, 2014, total 2 pages. |
Cited By (1)
| Publication number | Priority date | Publication date | Assignee | Title |
|---|---|---|---|---|
| US11561078B2 (en) * | 2020-04-03 | 2023-01-24 | The Boeing Company | Methods and systems for measuring gaps between exterior structures and interior structures |
Also Published As
| Publication number | Publication date |
|---|---|
| JPWO2016152075A1 (en) | 2018-01-18 |
| WO2016152075A1 (en) | 2016-09-29 |
| US20180052117A1 (en) | 2018-02-22 |
Similar Documents
| Publication | Publication Date | Title |
|---|---|---|
| US10190992B2 (en) | Structure status determination device, status determination system, and status determination method | |
| US10371510B2 (en) | Structure status determination device, status determination system, and status determination method | |
| Tian et al. | Noncontact cable force estimation with unmanned aerial vehicle and computer vision | |
| US20170307360A1 (en) | Status determination device and status determination method | |
| Kong et al. | Vision‐based fatigue crack detection of steel structures using video feature tracking | |
| Zhang et al. | Complex image background segmentation for cable force estimation of urban bridges with drone‐captured video and deep learning | |
| US11714024B2 (en) | Vision-based fatigue crack detection using feature tracking | |
| JP6485454B2 (en) | Information processing device | |
| JP6954368B2 (en) | Displacement component detection device, displacement component detection method, and program | |
| US10788320B2 (en) | Defect detecting device, defect detecting method, and computer-readable recording medium | |
| Civera et al. | An experimental validation of phase‐based motion magnification for structures with developing cracks and time‐varying configurations | |
| WO2017179535A1 (en) | Structure condition assessing device, condition assessing system, and condition assessing method | |
| JP6813025B2 (en) | Status determination device, status determination method, and program | |
| US11846498B2 (en) | Displacement amount measuring device, displacement amount measuring method, and recording medium | |
| Sabato et al. | A novel optical investigation technique for railroad track inspection and assessment | |
| JP6511892B2 (en) | State determination apparatus for a structure, state determination system, and state determination method | |
| US11365963B2 (en) | State determination apparatus, state determination method, and computer-readable recording medium | |
| Ji et al. | A novel image-based approach for structural displacement measurement | |
| Shang et al. | Multi-point vibration measurement for mode identification of bridge structures using video-based motion magnification | |
| JP7156529B2 (en) | Displacement measuring device, displacement measuring method, and program | |
| Machynia et al. | Vision-based automatic fatigue crack visualization and assessment in metallic structures |
Legal Events
| Date | Code | Title | Description |
|---|---|---|---|
| AS | Assignment |
Owner name: NEC CORPORATION, JAPAN Free format text: ASSIGNMENT OF ASSIGNORS INTEREST;ASSIGNOR:IMAI, HIROSHI;REEL/FRAME:043470/0538 Effective date: 20170808 |
|
| FEPP | Fee payment procedure |
Free format text: ENTITY STATUS SET TO UNDISCOUNTED (ORIGINAL EVENT CODE: BIG.); ENTITY STATUS OF PATENT OWNER: LARGE ENTITY |
|
| STCF | Information on status: patent grant |
Free format text: PATENTED CASE |
|
| MAFP | Maintenance fee payment |
Free format text: PAYMENT OF MAINTENANCE FEE, 4TH YEAR, LARGE ENTITY (ORIGINAL EVENT CODE: M1551); ENTITY STATUS OF PATENT OWNER: LARGE ENTITY Year of fee payment: 4 |