US10170678B2 - Thermomechanical cycle for thermal and/or mechanical energy conversion using piezoelectric materials - Google Patents
Thermomechanical cycle for thermal and/or mechanical energy conversion using piezoelectric materials Download PDFInfo
- Publication number
- US10170678B2 US10170678B2 US14/219,958 US201414219958A US10170678B2 US 10170678 B2 US10170678 B2 US 10170678B2 US 201414219958 A US201414219958 A US 201414219958A US 10170678 B2 US10170678 B2 US 10170678B2
- Authority
- US
- United States
- Prior art keywords
- piezoelectric component
- cycle
- temperature
- electric field
- stress
- Prior art date
- Legal status (The legal status is an assumption and is not a legal conclusion. Google has not performed a legal analysis and makes no representation as to the accuracy of the status listed.)
- Active, expires
Links
- 239000000463 material Substances 0.000 title claims description 83
- 230000000930 thermomechanical effect Effects 0.000 title description 33
- 238000006243 chemical reaction Methods 0.000 title description 16
- 230000005684 electric field Effects 0.000 claims abstract description 119
- 230000007704 transition Effects 0.000 claims description 90
- 238000000034 method Methods 0.000 claims description 37
- 230000010287 polarization Effects 0.000 claims description 23
- 230000008859 change Effects 0.000 claims description 21
- 239000013078 crystal Substances 0.000 claims description 18
- 230000003247 decreasing effect Effects 0.000 claims description 12
- 230000001351 cycling effect Effects 0.000 claims description 7
- 230000009466 transformation Effects 0.000 claims description 4
- 239000000919 ceramic Substances 0.000 claims description 3
- 239000007787 solid Substances 0.000 claims 2
- 239000002131 composite material Substances 0.000 claims 1
- 230000035882 stress Effects 0.000 description 114
- 238000006073 displacement reaction Methods 0.000 description 37
- 230000006870 function Effects 0.000 description 21
- RKTYLMNFRDHKIL-UHFFFAOYSA-N copper;5,10,15,20-tetraphenylporphyrin-22,24-diide Chemical compound [Cu+2].C1=CC(C(=C2C=CC([N-]2)=C(C=2C=CC=CC=2)C=2C=CC(N=2)=C(C=2C=CC=CC=2)C2=CC=C3[N-]2)C=2C=CC=CC=2)=NC1=C3C1=CC=CC=C1 RKTYLMNFRDHKIL-UHFFFAOYSA-N 0.000 description 16
- 238000002474 experimental method Methods 0.000 description 15
- 238000010438 heat treatment Methods 0.000 description 13
- 238000001816 cooling Methods 0.000 description 10
- 230000007423 decrease Effects 0.000 description 10
- 238000003306 harvesting Methods 0.000 description 10
- 238000010586 diagram Methods 0.000 description 9
- 238000012360 testing method Methods 0.000 description 8
- 238000000113 differential scanning calorimetry Methods 0.000 description 6
- 238000010587 phase diagram Methods 0.000 description 5
- RYGMFSIKBFXOCR-UHFFFAOYSA-N Copper Chemical compound [Cu] RYGMFSIKBFXOCR-UHFFFAOYSA-N 0.000 description 4
- 239000002033 PVDF binder Substances 0.000 description 4
- 229910052782 aluminium Inorganic materials 0.000 description 4
- XAGFODPZIPBFFR-UHFFFAOYSA-N aluminium Chemical compound [Al] XAGFODPZIPBFFR-UHFFFAOYSA-N 0.000 description 4
- 230000006399 behavior Effects 0.000 description 4
- 230000008901 benefit Effects 0.000 description 4
- 229910052802 copper Inorganic materials 0.000 description 4
- 239000010949 copper Substances 0.000 description 4
- 230000001419 dependent effect Effects 0.000 description 4
- 230000000694 effects Effects 0.000 description 4
- 238000005259 measurement Methods 0.000 description 4
- 229920002981 polyvinylidene fluoride Polymers 0.000 description 4
- 230000008569 process Effects 0.000 description 4
- 230000003068 static effect Effects 0.000 description 4
- 229910000831 Steel Inorganic materials 0.000 description 3
- 238000011088 calibration curve Methods 0.000 description 3
- 230000015556 catabolic process Effects 0.000 description 3
- 238000004891 communication Methods 0.000 description 3
- 238000012986 modification Methods 0.000 description 3
- 230000004048 modification Effects 0.000 description 3
- 229920003223 poly(pyromellitimide-1,4-diphenyl ether) Polymers 0.000 description 3
- 230000004044 response Effects 0.000 description 3
- 230000002269 spontaneous effect Effects 0.000 description 3
- 239000010959 steel Substances 0.000 description 3
- 238000003860 storage Methods 0.000 description 3
- 229910002113 barium titanate Inorganic materials 0.000 description 2
- 230000006835 compression Effects 0.000 description 2
- 238000007906 compression Methods 0.000 description 2
- 230000008602 contraction Effects 0.000 description 2
- 238000011161 development Methods 0.000 description 2
- 229910052738 indium Inorganic materials 0.000 description 2
- APFVFJFRJDLVQX-UHFFFAOYSA-N indium atom Chemical compound [In] APFVFJFRJDLVQX-UHFFFAOYSA-N 0.000 description 2
- 229910052451 lead zirconate titanate Inorganic materials 0.000 description 2
- 230000003287 optical effect Effects 0.000 description 2
- 230000010355 oscillation Effects 0.000 description 2
- 230000003534 oscillatory effect Effects 0.000 description 2
- 230000009467 reduction Effects 0.000 description 2
- 239000002023 wood Substances 0.000 description 2
- XPIIYLUXKKHAPJ-UHFFFAOYSA-N 1,1,2-trifluoroethene;hydrofluoride Chemical group F.FC=C(F)F XPIIYLUXKKHAPJ-UHFFFAOYSA-N 0.000 description 1
- WVKNHTAFNUBFJJ-UHFFFAOYSA-N 1-chloro-1-fluoroethene 1,1,2-trifluoroethene hydrofluoride Chemical group C=C(F)Cl.FC=C(F)F.F WVKNHTAFNUBFJJ-UHFFFAOYSA-N 0.000 description 1
- 241000251468 Actinopterygii Species 0.000 description 1
- 108010053481 Antifreeze Proteins Proteins 0.000 description 1
- 241000283690 Bos taurus Species 0.000 description 1
- 102000008186 Collagen Human genes 0.000 description 1
- 108010035532 Collagen Proteins 0.000 description 1
- 229910012657 LiTiO3 Inorganic materials 0.000 description 1
- WHXSMMKQMYFTQS-UHFFFAOYSA-N Lithium Chemical compound [Li] WHXSMMKQMYFTQS-UHFFFAOYSA-N 0.000 description 1
- FYYHWMGAXLPEAU-UHFFFAOYSA-N Magnesium Chemical compound [Mg] FYYHWMGAXLPEAU-UHFFFAOYSA-N 0.000 description 1
- 229920001166 Poly(vinylidene fluoride-co-trifluoroethylene) Polymers 0.000 description 1
- RTAQQCXQSZGOHL-UHFFFAOYSA-N Titanium Chemical compound [Ti] RTAQQCXQSZGOHL-UHFFFAOYSA-N 0.000 description 1
- 230000001133 acceleration Effects 0.000 description 1
- NIXOWILDQLNWCW-UHFFFAOYSA-N acrylic acid group Chemical group C(C=C)(=O)O NIXOWILDQLNWCW-UHFFFAOYSA-N 0.000 description 1
- 238000004458 analytical method Methods 0.000 description 1
- JRPBQTZRNDNNOP-UHFFFAOYSA-N barium titanate Chemical compound [Ba+2].[Ba+2].[O-][Ti]([O-])([O-])[O-] JRPBQTZRNDNNOP-UHFFFAOYSA-N 0.000 description 1
- 239000012620 biological material Substances 0.000 description 1
- 230000005540 biological transmission Effects 0.000 description 1
- 210000000988 bone and bone Anatomy 0.000 description 1
- 238000012512 characterization method Methods 0.000 description 1
- 229920001436 collagen Polymers 0.000 description 1
- 238000004590 computer program Methods 0.000 description 1
- 238000005336 cracking Methods 0.000 description 1
- 125000004122 cyclic group Chemical group 0.000 description 1
- 239000010432 diamond Substances 0.000 description 1
- 230000005611 electricity Effects 0.000 description 1
- 230000007613 environmental effect Effects 0.000 description 1
- 229920006332 epoxy adhesive Polymers 0.000 description 1
- 238000013213 extrapolation Methods 0.000 description 1
- 229910052500 inorganic mineral Inorganic materials 0.000 description 1
- HFGPZNIAWCZYJU-UHFFFAOYSA-N lead zirconate titanate Chemical compound [O-2].[O-2].[O-2].[O-2].[O-2].[Ti+4].[Zr+4].[Pb+2] HFGPZNIAWCZYJU-UHFFFAOYSA-N 0.000 description 1
- 229910052744 lithium Inorganic materials 0.000 description 1
- 229910052749 magnesium Inorganic materials 0.000 description 1
- 239000011777 magnesium Substances 0.000 description 1
- 230000007246 mechanism Effects 0.000 description 1
- 238000002844 melting Methods 0.000 description 1
- 230000008018 melting Effects 0.000 description 1
- 239000011707 mineral Substances 0.000 description 1
- 239000000203 mixture Substances 0.000 description 1
- 230000035699 permeability Effects 0.000 description 1
- 229920000642 polymer Polymers 0.000 description 1
- 229920006254 polymer film Polymers 0.000 description 1
- 238000010248 power generation Methods 0.000 description 1
- 238000003825 pressing Methods 0.000 description 1
- 238000004549 pulsed laser deposition Methods 0.000 description 1
- 239000010453 quartz Substances 0.000 description 1
- 238000011160 research Methods 0.000 description 1
- 239000004065 semiconductor Substances 0.000 description 1
- VYPSYNLAJGMNEJ-UHFFFAOYSA-N silicon dioxide Inorganic materials O=[Si]=O VYPSYNLAJGMNEJ-UHFFFAOYSA-N 0.000 description 1
- 229920002545 silicone oil Polymers 0.000 description 1
- 238000005382 thermal cycling Methods 0.000 description 1
- 230000008646 thermal stress Effects 0.000 description 1
- 229910052613 tourmaline Inorganic materials 0.000 description 1
- 239000011032 tourmaline Substances 0.000 description 1
- 229940070527 tourmaline Drugs 0.000 description 1
- 238000012546 transfer Methods 0.000 description 1
- 210000000689 upper leg Anatomy 0.000 description 1
- 239000002918 waste heat Substances 0.000 description 1
- 239000002699 waste material Substances 0.000 description 1
Images


Classifications
-
- H—ELECTRICITY
- H10—SEMICONDUCTOR DEVICES; ELECTRIC SOLID-STATE DEVICES NOT OTHERWISE PROVIDED FOR
- H10N—ELECTRIC SOLID-STATE DEVICES NOT OTHERWISE PROVIDED FOR
- H10N15/00—Thermoelectric devices without a junction of dissimilar materials; Thermomagnetic devices, e.g. using the Nernst-Ettingshausen effect
- H10N15/10—Thermoelectric devices using thermal change of the dielectric constant, e.g. working above and below the Curie point
-
- H01L37/02—
Definitions
- FIG. 3A illustrates an example of an Olsen cycle.
- FIG. 3C illustrates an example of states and transitions of a new power cycle.
- FIG. 5 illustrates an example of a testing device.
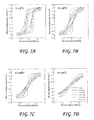
- FIGS. 7A-D illustrate examples of isothermal D-E cycles.
- FIGS. 8A-D illustrate examples of isothermal D-E cycles.
- FIG. 9 illustrates specific heat of a pyroelectric component.
- FIGS. 10A-D illustrate sample temperature of a pyroelectric component.
- FIGS. 11A-B illustrate sample temperature of a pyroelectric component.
- FIG. 13 illustrates energy density of a new power cycle as a function of material temperature.
- FIG. 14 illustrates energy density of a new power cycle as a function of stress.
- FIG. 15B illustrates power density of a new power cycle as a function of heater temperature.
- FIGS. 16A-B illustrate electric displacement of a new power cycle.
- FIG. 17 illustrates electric displacement of a new power cycle as a function of electric field.
- FIG. 19B illustrates large-field relative permeability
- FIG. 21 illustrates power density of a new power cycle as a function of stress.
- FIG. 22 illustrates power density of a new power cycle as a function of stress.
- FIG. 23A illustrates electric displacement versus electric field.
- FIG. 23B illustrates stress versus strain
- V Volts (MV: megavolt)
- Pa Pascals (kPa: kiloPascals)
- This disclosure presents a new power cycle for direct conversion of thermomechanical energy into electrical energy using piezoelectric materials.
- the cycle includes, sequentially: (i) isothermal electric poling performed under substantially zero stress; (ii) uniaxial compressive stress during a heating transition; (iii) an isothermal electric de-poling under uniaxial stress; and (iv) the removal of compressive stress during a cooling transition.
- the new power cycle is able to generate electrical energy at temperatures below those of the Olsen cycle.
- the new power cycle is able to adapt to changing thermal and mechanical conditions.
- a variation of the new power cycle maintains an applied isothermal temperature throughout the cycle such that a temperature of the piezoelectric material is held close to constant at a bias temperature T bias .
- T bias is selected such that application of stress to the piezoelectric material in stage (ii) causes the material to undergo a phase transformation.
- T bias is further selected such that a phase transition caused by stress changes in stage (iv) of the cycle is a phase transition to a phase with a maximize polarization.
- the electric charge within the material changes when the material is mechanically deformed. Applying a compressive stress in the poling direction decreases the electric displacement for a given temperature and electric field. The reduction in surface charge can be captured as current in an external load.
- a subclass of piezoelectric materials is pyroelectric materials.
- Pyroelectric materials possess a temperature-dependent spontaneous polarization defined as the average electric dipole moment per unit volume in the absence of an applied electric field.
- ferroelectrics there exists the ability to switch the direction and magnitude of the spontaneous polarization by applying a magnetic field opposite and with greater magnitude than a coercive electric field due to the spontaneous polarization.
- the new power cycle leverages the piezoelectric properties of a material, and may further leverage the pyroelectric properties of the material.
- Categories of pyroelectric materials include (i) ceramics such as lead zirconate titanate (PZT), barium titanate (BaTiO3), and lithium titanate (LiTiO3), (ii) single crystals such as lead magnesium niobate-lead titanate (PMN-PT) and lead zirconate niobate-lead titanate (PZN-PT), (iii) polymers like polyvinylidene fluoride (PVDF), polyvinylidene fluoride trifluoroethylene (P(VDF-TrFE)), and polyvinylidene fluoride trifluoroethylene chlorofluoroethylene (P(VDF-TrFE-CFE)), (iv) biological materials including bovine phalanx, femur bones, and collagen (found in fish scales and hair), and (v
- FIG. 1 illustrates system 100 for energy conversion in accordance with this disclosure.
- System 100 includes a process 110 that generates energy 120 by its operation.
- Energy 120 may be waste energy of process 110 .
- Energy converter 130 receives energy 120 and converts it to electrical energy 140 .
- Energy converter 130 includes a variable electric field source 150 , a variable stress source 160 , and a variable thermal source 170 .
- the conversion cycle is controlled by cycle controller 180 , which controls changes in electric field, stress, and temperature to perform cycles of energy conversion, and to adapt the cycles to the energy received and to the present environmental conditions.
- Cycle controller 180 may be, may include, or may be included in, a computing device.
- Cycle controller 180 controls variable electric field source 150 , variable stress source 160 , and variable thermal source 170 to selectively apply an electric field, stress, and temperature, respectively, to a piezoelectric component 190 , which in response generates electrical energy.
- Power for operation of variable electric field source 150 , variable stress source 160 , and variable thermal source 170 may be provided by energy 120 received from process 110 , and cycle controller 180 may control the new power cycle based on the energy 120 presently available.
- FIG. 2 illustrates an example of a computing device 200 that includes a processor 210 , a memory 220 , an input/output interface 230 , and a communication interface 240 .
- a bus 250 provides a communication path between two or more of the components of computing device 200 .
- the components shown are provided by way of illustration and are not limiting. Computing device 200 may have additional or fewer components, or multiple of the same component.
- Processor 210 represents one or more of a processor, microprocessor, microcontroller, ASIC, and/or FPGA, along with associated logic.
- Memory 220 represents one or both of volatile and non-volatile memory for storing information.
- Examples of memory include semiconductor memory devices such as EPROM, EEPROM and flash memory devices, magnetic disks such as internal hard disks or removable disks, magneto-optical disks, CD-ROM and DVD-ROM disks, and the like.
- Input/output interface 230 represents electrical components and optional code that together provides an interface from the internal components of computing device 200 to external components. For example, a signal representing a value of energy 120 , such as a temperature, voltage, or current may be received at input/output interface 230 , and computing device 200 may use information in the signal to adjust the new power cycle according to the available energy 120 . For another example, input/output interface 230 may provide control signals to devices such as variable electric field source 150 , variable stress source 160 , and variable thermal source 170 .
- Communications interface 240 represents electrical components and optional code that together provides an interface from the internal components of computing device 200 to external networks.
- Bus 250 represents one or more interfaces between components within computing device 200 .
- bus 250 may include a dedicated connection between processor 210 and memory 220 as well as a shared connection between processor 210 and multiple other components of computing device 200 .
- Portions of cycle controller 180 may be implemented as computer-executable instructions in memory 220 of computing device 200 , executed by processor 210 .
- An embodiment of the disclosure relates to a non-transitory computer-readable storage medium having computer code thereon for performing various computer-implemented operations.
- the term “computer-readable storage medium” is used herein to include any medium that is capable of storing or encoding a sequence of instructions or computer codes for performing the operations, methodologies, and techniques described herein.
- the media and computer code may be those specially designed and constructed for the purposes of the embodiments of the disclosure, or they may be of the kind well known and available to those having skill in the computer software arts.
- Examples of computer-readable storage media include, but are not limited to: magnetic media such as hard disks, floppy disks, and magnetic tape; optical media such as CD-ROMs and holographic devices; magneto-optical media such as optical disks; and hardware devices that are specially configured to store and execute program code, such as application-specific integrated circuits (“ASICs”), programmable logic devices (“PLDs”), and ROM and RAM devices.
- ASICs application-specific integrated circuits
- PLDs programmable logic devices
- ROM and RAM devices read-only memory
- Examples of computer code include machine code, such as produced by a compiler, and files containing higher-level code that are executed by a computer using an interpreter or a compiler.
- an embodiment of the disclosure may be implemented using Java, C++, or other object-oriented programming language and development tools. Additional examples of computer code include encrypted code and compressed code.
- an embodiment of the disclosure may be downloaded as a computer program product, which may be transferred from a remote computer (e.g., a server computer) to a requesting computer (e.g., a client computer or a different server computer) via a transmission channel.
- a remote computer e.g., a server computer
- a requesting computer e.g., a client computer or a different server computer
- Another embodiment of the disclosure may be implemented in hardwired circuitry in place of, or in combination with, machine-executable software instructions.
- Cycle controller 180 controls the new power cycle to convert thermal energy and/or mechanical energy into electrical energy using a piezoelectric material.
- the piezoelectric material may be also pyroelectric.
- the electric displacement D of a pyroelectric material at temperature T under electric field E and compressive stress ⁇ can be expressed as in equation (1).
- D ( E,T , ⁇ ) ⁇ 0 ⁇ r ( T , ⁇ ) E+P S ( T , ⁇ ) (1)
- ⁇ r (T, ⁇ ) is the large-field relative permittivity of the material at temperature T and under stress ⁇ .
- the saturation polarization P S (T, ⁇ ) is equal to the electric displacement in the linear fit of D versus E at large field extrapolated to zero electric field, and the slope of this linear fit corresponds to the product ⁇ 0 ⁇ r (T, ⁇ ).
- T Curie defined as the temperature at which a ferroelectric material undergoes a phase transition from ferroelectric to paraelectric. This phase transition temperature is typically defined as the temperature corresponding to the maximum of the real part of the complex dielectric constant for a given frequency and applied electric field.
- PMN-xPT crystals possess large piezoelectric constants near the morphotropic phase boundary (MPB) separating the rhombohedral and tetragonal phases. This MPB in PMN-xPT corresponds to x between 27.5 and 33%.
- MPB morphotropic phase boundary
- FIG. 3A illustrates the Olsen cycle superimposed on electric displacement D versus electric field E diagram (D-E diagram) for three isothermal bipolar loops.
- the Olsen cycle superimposed over the D-E loops includes cyclic transitions between T cold and T hot , and also between low electric field E L and high electric field E H , as described above.
- the area enclosed by the four associated state transitions corresponds to the generated energy density N D , defined as the electrical energy (in Joules) produced per unit volume (in liters) of the material per cycle. It is expressed in J/L/cycle and defined as in equation (2).
- N D EdD (2)
- pyroelectric crystals may crack due to thermal stresses for temperature differences in excess of 90° C., and piezoelectric crystals may experience dielectric breakdown for electric fields larger than 0.9 MV/m.
- the power density of the Olsen cycle is limited by the necessarily low cycle frequency due to slow thermal relaxation transitions.
- FIG. 3B illustrates one example of the new power cycle, showing that the new power cycle achieves a higher energy density N D than does the Olsen cycle.
- the new power cycle is projected onto the D-E plane, superimposed over the same isothermal bipolar D-E loops as shown in FIG. 3A .
- transition 1 applied stress is equal to zero, the temperature of the piezoelectric material sample is low (T cold ) due to applied temperature T C , and the electric field applied is low (E L ).
- the transition from state 1 to state 2 (transition 1 - 2 ) is an increase in electric field from E L to E H at T cold , where the transition is isothermal and in the absence of applied stress.
- the transition 2 - 3 is the simultaneous compression of the sample ( ⁇ H ) and an increase in temperature to T hot , while the electric field remains constant at E H .
- the transition 3 - 4 is a decrease in electric field from E H to E L , where the transition is isothermal at T hot and the stress remains ⁇ H .
- the transition 4 - 1 closes the cycle by simultaneously cooling the sample to T cold and removing the stress, while electric field E L remains constant.
- Cycle frequency refers to how often the complete cycle (states 1 , 2 , 3 , and 4 , and transitions 1 - 2 , 2 - 3 , 3 - 4 , 4 - 1 ) may be performed.
- the area enclosed by the four transitions in the D-E diagram, shown in FIG. 3B corresponds to the generated energy density N D defined by equation (2).
- Cycle frequency depends on material properties and material thickness, among other things.
- a thinner sample may allow for improved cycle frequency, as polarization may be achieved more quickly in the thinner sample.
- the experiments reported in this disclosure were performed at cycle frequencies of 0.025 Hz, 0.1 Hz, 0.125 Hz, 0.5 Hz, 1 Hz, 2 Hz, and 3 Hz, for example.
- cycle frequencies may be in one of the ranges: greater than 0.1 Hz, greater than 0.5 Hz, greater than 1 Hz, greater than 2 Hz, greater than 5 Hz, greater than 10 Hz, greater than 50 Hz, or greater than 100 Hz, depending upon the piezoelectric material used for the energy conversion.
- FIG. 4B is a graphic representing the four states of the cycle with transitions between states.
- applied stress is equal to zero and the electric field applied is low (E L ).
- the transition 1 - 2 is an increase in electric field from E L to E H , where the transition is in the absence of applied stress.
- the transition 2 - 3 is the compression of the sample ( ⁇ H ) while the electric field remains constant at E H .
- the transition 3 - 4 is a decrease in electric field from E H to E L , where the stress remains ⁇ H .
- the transition 4 - 1 closes the cycle by removing the stress, while electric field E L remains constant.
- N D is the electrical energy produced per unit volume of the material per cycle while Q in and W in are the thermal energy and mechanical work provided per unit volume of the material during the cycle.
- c p (T) is the specific heat of the pyroelectric material in J/kg ⁇ K and ⁇ is the density of the pyroelectric material in kg/m 3 .
- the specific heat of pyroelectric materials c p (T) is temperature-dependent and can be estimated, for example from differential scanning calorimetry.
- ⁇ and x are typically non-linear, and may be estimated from stress-strain curves.
- the large-field dielectric constant ⁇ r (T, ⁇ ) and the saturation polarization P s (T, ⁇ ) are functions of both temperature and compressive stress.
- Equation (6) presents a model that could enable the rapid determination of the power density of materials undergoing the new thermal bias cycle from intrinsic dielectric properties of PMN-28PT without physically having to perform the cycle.
- PMN-28PT was chosen to demonstrate the advantages of the new power cycle for its strong piezoelectric response over a broad temperature range.
- Single crystal samples of PMN-28PT were purchased from Sinoceramics, LLC. The dimensions of the samples were 5 ⁇ 5 ⁇ 3 mm 3 . The average weight of the samples was 588.5 ⁇ 0.8 mg, corresponding to a density of ⁇ 7847 ⁇ 11 kg/m 3 . The samples were poled in the [001]-direction. The two 5 ⁇ 5 mm 2 faces of each sample were entirely coated with Cr/Au electrodes. Two strain gages were mounted to opposite 5 ⁇ 3 mm 2 faces of one of the samples to measure longitudinal strain (parallel to the polarization direction).
- FIG. 5 illustrates a diagram of a setup used to perform experiments related to the new thermomechanical cycle.
- a spring return air cylinder (McMaster-Carr 6498K252) was vertically actuated using compressed air at a maximum pressure of 469 kPa.
- a 24 V DC solenoid valve was used to control the extension and contraction of the cylinder rod.
- a 100 W cartridge heater was embedded in a 1.27 cm thick aluminum plate serving as a heat source.
- a type-K thermocouple was embedded at the center of this heating block, whose temperature was maintained at T H with an Omega CN-7823 proportional integral derivative (PID) temperature controller.
- the PMN-28PT sample was sandwiched between two copper tapes used to provide electrical contact between the sample's electrodes and the wires.
- This assembly was placed on top of a 5 mm thick steel die.
- An aluminum heat sink (Cool Innovations 3-151514M) was placed in thermal contact with the steel die by epoxy adhesive (OMEGABOND® 200) to passively cool the pyroelectric sample to T cold during the transition 4 - 1 .
- OMEGABOND® 200 epoxy adhesive
- a 0.14 mm thick Kapton film was used to electrically isolate the sample's electrodes from the metallic heat source and sink. Note that the sample temperature could not be measured during electric field cycling due to electrical conduction between the sample and the thermocouple.
- An electrical system (not shown) was used to control the cycles and take measurements. The electrical system included a Sawyer-Tower circuit that measures electric field and electric displacement.
- FIG. 6 illustrates a diagram of a setup used to perform experiments related to the new thermal bias cycle.
- a spring return air cylinder (McMaster-Carr 6498K252) vertically actuated using compressed air at a maximum pressure of 469 kPa.
- a 24V DC solenoid valve was used to control the extension and contraction of the cylinder rod applying pressure on the sample between two copper rods.
- the PMN-28PT sample was sandwiched between two copper tapes used to provide electrical contact between the sample's electrodes and the wires.
- a 0.14 mm thick Kapton film was used to electrically isolate the sample's electrodes from the copper rods.
- the sample was placed inside an acrylic support structure submerged in a heated silicone oil bath.
- a 100-Watt cartridge heater was imbedded in a 1.27 cm thick aluminum plate serving as a heat source to the oil bath.
- a type-K thermocouple was embedded at the center of this heating block whose temperature was maintained at T H with an Omega CN-7823 proportional integral derivative (PID) temperature controller.
- the corresponding sample bias temperature T b was measured by a type-K thermocouple placed on the sample. After the desired steady-state temperature was reached, this second thermocouple was removed prior to performing the cycle so that it did not electrically interfere with electrical measurements performed on the sample.
- a servo-hydraulic test frame was used in place of the spring return air cylinder for mechanical characterization of the sample during the cycle.
- the electrical system included a Sawyer-Tower circuit that measures electric field and electric displacement.
- the compressive force applied by the servo-hydraulic mechanism was computer-controlled, enabling strain to be measured as a function of stress while also simultaneously measuring electric field and electric displacement.
- a variation of the setup illustrated in FIG. 5 was also used for experiments related to collecting isothermal D-E loops under different (static) compressive stress.
- the setup was modified in that the heat sink and steel die were replaced with a wood block and an aluminum heating plate, respectively, similar (but inverted) to the wood block and heat source placed above the sample.
- the sample was uniformly heated to T hot from both sides in this manner, to minimize the temperature gradient in the sample.
- a type-K thermocouple placed directly on the sample was used to measure the sample temperature, and removed before electric field cycling began.
- FIG. 6 was used for experiments related to collecting isothermal D-E loops under different (static) compressive stress.
- the setup of FIG. 5 was also used to test sample temperature as a function of time for various cycle frequencies. Thermomechanical cycling was performed without electric field cycling for the above conditions on one of the samples in order to measure the sample temperature oscillations. To do so, a type-K thermocouple was bonded with OMEGABOND® 101 to the center of one of the 3 ⁇ 5 mm 2 faces for one of the samples.
- DSC Differential scanning calorimetry
- ⁇ dot over (Q) ⁇ DSC is the heat transfer rate provided to the sample and measured by the DSC (in W)
- m is the sample mass (in kg)
- the instrument was calibrated using an indium standard purchased from Perkin Elmer, USA. The melting temperature at atmospheric pressure and specific phase change enthalpy were measured to be 160.82° C. and 26.94 J/g, respectively (i.e., within 2.7% and 5.6%, respectively, of the indium properties reported in literature).
- the frequency ranged from 0.025 to 1 Hz by varying ⁇ 23 between 17.5 and 0.438 seconds (and correspondingly varying ⁇ 12 ).
- the cold source temperature T C was passively maintained near room temperature (approximately 22° C.) and did not exceed 30° C.
- the hot source temperature T H varied from 60° C. to 217° C.
- the low electric field E L was fixed at 0.2 MV/m.
- the high electric field E H varied from 0.75 to 0.95 MV/m.
- the uniaxial stress ⁇ H applied during transitions 2 - 3 and 3 - 4 ranged from 0 to 33.56 MPa.
- the new thermal bias cycle was executed for frequency f ranging from 0.5 Hz to 3 Hz by varying ⁇ ij between 1 second and 0.083 second, respectively.
- the uniaxial stress ⁇ H applied during transitions 2 - 3 and 3 - 4 ranged from 0 to 35.67 MPa.
- the low and high electric fields E L and E H were fixed at 0.2 MV/m and 0.8 MV/m, respectively.
- FIGS. 7A-D illustrate results of experiments for collecting isothermal bipolar D-E loops using the test structure of FIG. 5 with modifications as described above for isothermal testing.
- the loops were measured at 0.1 Hz for one sample at 22° C., 130° C., 140° C., and 150° C. ( FIGS. 7A-D , respectively) under mechanical loading between 0 and 25.13 MPa.
- FIGS. 7A-D illustrate the effect of compressive stress on the D-E loops.
- the isothermal D-E loops were closed and consecutive D-E loops overlapped for the temperature and compressive stress considered. This indicates that leakage current through the sample was negligibly small.
- the non-linearities in D-E loops observed as the electric field was reduced from 0.75 MV/m to 0.0 under zero stress, correspond to electric field induced phase transitions—tetragonal to monoclinic Mc phase transition at 80° C. and 0.4 MV/m, tetragonal to cubic phase transition at 130° C., 140° C., 150° C., and 160° C. at electric fields 0.01 MV/m, 0.1 MV/m, 0.18 MV/m, and 0.25 MV/m, respectively.
- FIG. 9 plots the specific heat c p (T) as a function of temperature T between 20° C. and 180° C., followed by cooling from 180° C. to 20° C.
- the PMN-28PT sample exhibited peaks in c p at the phase transition temperatures corresponding to 90° C. and 150° C. during heating and 135° C. and 70° C. during cooling.
- FIGS. 10A-D illustrate the results of sample temperature experiments, without electric field variation, showing temperature oscillations of a PMN-28PT sample for frequencies of 0.025 Hz, 0.125 Hz, 0.5 Hz, and 1 Hz, respectively, for heater temperatures T H varying from 80 to 200° C. For each heater temperature, it took approximately 40 seconds for sample temperature to reach oscillatory steady-state. For a given frequency, the peak to peak temperature span and the maximum and minimum sample temperatures T hot and T cold , respectively, increased with increasing heater temperature T H .
- FIGS. 11A-B show sample temperature for sample temperatures T hot and T cold as a function of heater temperature for frequency varying from 0.025 Hz to 1 Hz. Each data point corresponds to the arithmetic mean of T hot and T cold measured over five consecutive cycles in the oscillatory steady-state regime.
- the solid lines correspond to the linear fit of T hot or T cold versus T H for a given frequency. This fit was used to compute calibrations for T hot or T cold for given heater temperatures and cycle frequencies. Note that, for f>0.5 Hz, T hot is approximately equal to T cold .
- the temperature of a sample during cycling was found to be independent of compressive stress for a given heater temperature.
- FIGS. 12A-B depicts, in a D-E diagram, the new thermomechanical cycle performed at 0.025 Hz superimposed over isothermal D-E loops.
- FIG. 14 shows the generated energy density of the new thermomechanical cycle as a function of applied compressive stress ⁇ H for heater temperatures T H varying between 60° C. and 170° C.
- the frequency was fixed at 0.125 Hz while the electric field was cycled between 0.2 and 0.75 MV/m.
- Energy density increased nearly linearly with increasing ⁇ H for any given heater temperature T H .
- T H 160° C.
- the sample temperature calibration curve at 0.125 Hz predicted T cold 92° C., corresponding to the temperature at which [001] PMN-28PT is in the tetragonal phase and exhibits the highest saturation polarization under zero stress.
- T H 170° C.
- T H 160° C.
- FIG. 15A shows the energy density generated using the new power cycle as a function of heater temperature T H for frequency 0.125 Hz, 0.5 Hz, and 1 Hz.
- the high applied stress ⁇ H was fixed at 25.13 MPa
- the low and high electric fields E L and E H were set at 0.2 MV/m and 0.75 MV/m, respectively
- the cold source temperature T C was 22° C.
- the energy density increased with increasing heater temperature for any given frequency.
- it decreased only slightly with increasing cycle frequency, because the change in electric displacement as a result of a change in compressive stress occurred quickly and was nearly similar for all frequencies.
- longer heating and cooling durations at lower cycle frequency allowed the slow thermal relaxation transitions to take place.
- FIG. 15B shows the power density as a function of heater temperatures for the data used as the basis of FIG. 15A .
- Increasing the cycle frequency resulted in increased power density.
- the power density at 1 Hz was nearly ten times larger than that at 0.125 Hz for heater temperature T H above 100° C. This can be attributed to the fact that N D did not decrease significantly as the frequency increased by a factor of eight.
- FIGS. 16A-B show electric displacement variations versus time t for representative new thermomechanical cycles performed at frequency 0.125 and 1 Hz, respectively.
- the heater temperature T H was maintained at 160° C.
- the states 1 - 4 of the cycle are indicated. For comparison, the two cycles are aligned to state 4 .
- the cycle of FIG. 16A at 0.125 Hz illustrates the piezoelectric and pyroelectric contributions to the cycle.
- the cycle of FIG. 16B at 1 Hz showed a similar response to the reduction in compressive stress during transition 4 - 1 as the electric displacement increased from 0 to 6 ⁇ C/cm 2 in the first 0.25 seconds.
- the large cycle frequency did not allow the sample to experience cooling during transition 4 - 1 . Instead, the sample remained at 104° C. for the entire cycle and thus did not experience any change in electric displacement due to a change in temperature. As a result, the generated energy density as well as the overall change in electric displacement between states 4 and 2 for the cycle at 1 Hz were approximately 85% of those at 0.125 Hz. This indicates that the piezoelectric contribution to the new cycle is independent of cycle frequency between 0.125 Hz and 1 Hz.
- FIG. 17 shows five consecutive (superimposed) new cycles performed on PMN-28PT in the D-E diagram corresponding to the maximum generated power density.
- the thermal source temperatures T C and T H were set at 22° C. and 130° C., respectively.
- the high compressive stress ⁇ H was 33.56 MPa.
- the low and high electric fields were 0.2 MV/m and 0.95 MV/m, respectively.
- the consecutive cycles nearly overlapped, indicating the cycle was repeatable, resulting in power density of 41.3 ⁇ 0.4 W/L.
- thermomechanical power cycle the material efficiency of the thermomechanical power cycle and of the Olsen cycle was estimated using equation (3).
- the thermal energy Qin was estimated according to equation (4) using the measured density and specific heat c p presented in FIG. 9 .
- the mechanical energy input W m was computed from equation (5) using the area enclosed by the stress-strain curves at 85° C. measured at 0.2 MV/m and 0.95 MV/m for [001] PMN-28PT single crystals.
- the new cycle was performed at low frequency, the large heat input resulted in small efficiencies.
- the efficiency was highly dependent on the operating temperatures.
- One cycle was performed between 82.3° C. and 83.2° C. where c p (T) exhibited a phase transition peak and a large thermal hysteresis ( FIG. 9 ) while the other was performed between 99.9° C. and 100.9° C., where no phase transition occurred.
- T cold At low frequencies, it is important to choose T cold such that heating and applying compressive stress have a similar effect on the electric displacement.
- the two cycles performed at 0.125 Hz in Table 1 illustrate this fact.
- the cycle performed between 90.4° C. and 103.1° C. had a material efficiency of 9.4%.
- both heating and the addition of compressive stress during transition 2 - 3 decreased the electric displacement of the material.
- the efficiency reported corresponds to the material's ability to convert thermomechanical energy into electricity.
- the efficiency of a device implementing the new thermomechanical cycle on PMN-28PT is expected to be significantly lower.
- W in was estimated based on properties of PMN-28PT measured at 85° C.
- the mechanical work was performed at two different temperatures and the stress-strain behavior may have deviated from that at 85° C.
- Q in was estimated based on the specific heat c p (T) measured under zero mechanical stress. In practice, the heat input occurred under large uniaxial compressive stress known to affect the phase transition temperatures and the corresponding peaks in c p (T).
- FIGS. 18A-B plot isothermal bipolar D-E loops measured at 0.1 Hz on [001] PMN-28PT samples for bias temperature T b of 80° C. ( FIG. 18A ) and 100° C. ( FIG. 18B ) under mechanical loading ranging between 0 and 25.13 MPa.
- the D-E loops were closed, and consecutive D-E loops overlapped for temperature and compressive stress considered. This indicates that leakage current through the sample was negligibly small.
- the D-E loops gradually became slimmer with increasing compressive stress. This behavior is indicative of continuous polarization rotation.
- FIG. 19A shows the saturation polarization P s (T, ⁇ ) and FIG. 19B shows the large-field dielectric constant ⁇ r (T, ⁇ ) retrieved from the isothermal bipolar D-E loops for temperatures 22° C., 80° C., and 100° C. and compressive stress between 0 and 25.13 MPa. Each data point represents the average over three D-E loops. The error bars have been omitted because they fell within the data markers.
- FIGS. 19A-B shows the piecewise cubic hermite interpolating polynomial fit of the properties for each temperature considered.
- FIG. 19A indicates that the saturation polarization P s decreased nearly linearly with increasing stress at 22° C. and 100° C.
- FIG. 19B indicates that the large-field relative permittivity increased with increasing compressive stress for all temperatures considered. This behavior is consistent with bipolar D-E loops reported for [001] PMN-30PT and [001] PMN-32PT at room temperature for compressive stress up to 30 MPa.
- the cycle traveled in the clockwise direction and therefore produced electrical energy.
- the rate of electric field change dE/dt for the D-E loops at 0.1 Hz and 0.75 Hz was 0.3 MV/m/s and 2.4 MV/m/s, respectively. Transitions 1 - 2 and 3 - 4 of the cycle performed at 1 Hz corresponded to a time rate of change in electric field of 2.4 MV/m/s.
- FIG. 20 indicates that at the frequencies considered, the D-E loops were independent of dE/dt.
- P s (T, ⁇ ) and ⁇ r (T, ⁇ ) previously retrieved from the bipolar D-E loops at 0.1 Hz, it was possible to predict the power density based on equation (6).
- PMN-28PT Given the phase diagram of PMN-28PT at a frequency of 10 Hz, at bias temperature of 80° C., PMN-28PT is estimated to have been in the tetragonal (T) phase at both state 1 and 2 of the cycle. This is supported by the fact that (i) the coercive electric field in the D-E loops at low frequency of 0.1 Hz was around 0.1 MV/m and (ii) the change in electric displacement between these states was small as illustrated in FIG. 20 . Additionally, the application of compressive stress during the transition 2 - 3 may have caused the sample to undergo a phase transition into the monoclinic M A phase, as suggested by the T-M A phase transition occurring in [001] PMN-32PT at 0.8 MV/m and 80° C.
- FIG. 21 shows the power density generated by the new thermal bias cycle as a function of applied compressive stress ⁇ H for bias temperature T b ranging between 22° C. and 100° C.
- the frequency was fixed at 1 Hz while the electric field was cycled between 0.2 MV/m and 0.8 MV/m.
- Each data point represents an average of five cycles and the error bars correspond to one standard deviation or 63% confidence interval.
- FIG. 21 indicates that the power density increased nearly linearly with increasing ⁇ H for any given bias temperature T b .
- the power density decreased and was nearly identical for 90° C. and 100° C.
- the largest power density of 44 W/L was achieved for bias temperature of 80° C. with a compressive stress of 25.13 MPa.
- FIG. 22 shows the power density generated by the new thermal bias cycle as a function of compressive stress ⁇ H for frequency of 0.5 Hz, 1 Hz, 2 Hz, and 3 Hz.
- the low and high electric fields E L and E H were set at 0.2 MV/m and 0.8 MV/m, and the bias temperature T b was 80° C.
- Each data point represents an average over five cycles and the error bars correspond to one standard deviation or 63% confidence interval. It is evident that the power density increased with increasing compressive stress for frequency below 1 Hz. However, at higher frequency, the power density reached a maximum at compressive stress of 23.02 MPa and decreased beyond.
- the PMN-28PT sample had not transitioned to the orthorhombic phase for the stresses considered. This is illustrated in FIGS. 23A-B by the fact that increasing compressive stress from 0 to 25 MPa during transition 2 - 3 produced a larger change in (i) strain and (ii) electric displacement at 80° C. than at 100° C.
- the model yields reasonable predictions.
- the average relative error between experimental data and model predictions at 0.5 Hz and 1 Hz was 29.1% and 13.9%, respectively.
- the model did not yield accurate predictions for frequencies larger than 1 Hz because the cycle did not follow the path of the D-E loops at 0.1 Hz. In other words, D did not reach its equilibrium value during the transitions 2 - 3 and 4 - 1 as previously discussed.
- the model can be used to predict energy and power densities from the material dielectric properties.
- thermomechanical cycle with variation of a new thermal bias cycle. Also described was experimental implementation and experimental results of the new cycles performed on [001]-poled PMN-28PT single crystals.
- Each cycle includes four states, and four transitions between the states.
- the transitions relate to applied electric field, stress, and temperature.
- the transitions relate to applied electric field and stress.
- thermomechanical cycle on ferroelectric [001]-poled PMN-28PT single crystals maximum energy and power densities of 41 J/L/cycle and 41 W/L were achieved with cycles performed at 1 Hz with thermal source temperatures of 22° C. and 130° C. and electric field cycled between 0.2 MV/m and 0.95 MV/m under compressive stress 33.56 MPa. These conditions also yielded the maximum material efficiency of converting thermomechanical energy into electric energy of 64.1%.
- the energy density of the new thermomechanical cycle was found to be nearly independent of cycle frequency, while the power density and efficiency increased with increasing cycle frequency. Both the energy and power densities increased with increasing compressive stress.
- the new thermomechanical cycle was able to convert thermal and mechanical energies into electrical energy at all temperatures considered.
- the new thermomechanical cycle was also capable of maintaining constant power output for changing hot source temperature by adjusting the applied stress.
- the maximum power density of the new cycle was obtained for temperature bias of 80° C., due to tetragonal to monoclinic to orthorhombic phase transition sequence during the cycle resulting in large changes in electric displacement.
- the material efficiency of the thermal bias version of the new power cycle exceeded that of the thermomechanical variation of the new power cycle.
- the energy and power densities generated by the thermal bias version of the new power cycle were orders of magnitude larger than alternative mechanical energy conversion methods.
- a physics-based model predicting the power density was derived and validated against experimental data. It can be used to predict the energy and power densities for any material based on their dielectric properties and the operating electric fields, temperature, and frequency.
- the terms “substantially” and “about” are used to describe and account for small variations.
- the terms can refer to instances in which the event or circumstance occurs precisely as well as instances in which the event or circumstance occurs to a close approximation.
- the terms can refer to less than or equal to ⁇ 10%, such as less than or equal to ⁇ 5%, less than or equal to ⁇ 4%, less than or equal to ⁇ 3%, less than or equal to ⁇ 2%, less than or equal to ⁇ 1%, less than or equal to ⁇ 0.5%, less than or equal to ⁇ 0.1%, or less than or equal to ⁇ 0.05%.
Landscapes
- General Electrical Machinery Utilizing Piezoelectricity, Electrostriction Or Magnetostriction (AREA)
Abstract
Description
D(E,T,σ)=ε0εr(T,σ)E+P S(T,σ) (1)
In equation (1), ε0 is the vacuum permittivity (=8.854×10⁻¹² F/m) and εr(T,σ) is the large-field relative permittivity of the material at temperature T and under stress σ. The saturation polarization PS(T,σ) is equal to the electric displacement in the linear fit of D versus E at large field extrapolated to zero electric field, and the slope of this linear fit corresponds to the product ε0εr(T,σ). Other important properties include (i) the remnant polarization Pr(T,σ) corresponding to the polarization under zero applied electric field, (ii) the coercive field Ec(T,σ) corresponding to the electric field required to reach zero electric displacement, and (iii) the Curie temperature TCurie defined as the temperature at which a ferroelectric material undergoes a phase transition from ferroelectric to paraelectric. This phase transition temperature is typically defined as the temperature corresponding to the maximum of the real part of the complex dielectric constant for a given frequency and applied electric field.
N D =
where ND is the electrical energy produced per unit volume of the material per cycle while Qin and Win are the thermal energy and mechanical work provided per unit volume of the material during the cycle.
Q in =
where cp(T) is the specific heat of the pyroelectric material in J/kg·K and ρ is the density of the pyroelectric material in kg/m3. The specific heat of pyroelectric materials cp(T) is temperature-dependent and can be estimated, for example from differential scanning calorimetry.
W in=
where ‘x’ represents the strain in the longitudinal direction parallel to the polarization. For pyroelectric materials undergoing phase transitions, the relationship between σ and x is typically non-linear, and may be estimated from stress-strain curves.
Equation (6) presents a model that could enable the rapid determination of the power density of materials undergoing the new thermal bias cycle from intrinsic dielectric properties of PMN-28PT without physically having to perform the cycle.
where {dot over (Q)}DSC is the heat transfer rate provided to the sample and measured by the DSC (in W), m is the sample mass (in kg), and {dot over (T)}=dT/dt is the heating rate expressed in ° C./s. The instrument was calibrated using an indium standard purchased from Perkin Elmer, USA. The melting temperature at atmospheric pressure and specific phase change enthalpy were measured to be 160.82° C. and 26.94 J/g, respectively (i.e., within 2.7% and 5.6%, respectively, of the indium properties reported in literature).
| TABLE 1 | ||||||||||
| f | EH | TH | Thot | Tcold | σH | Win | Qin | ND | η | |
| Cycle type | (Hz) | (MV/m) | (° C.) | (° C.) | (° C.) | (MPa) | (kJ/m3) | (kJ/m3) | (kJ/m3) | (%) |
| Olsen | 0.021 | 0.75 | — | 170 | 90 | 0 | 0 | 540 | 86 | 15.9 |
| TM | 0.025 | 0.75 | 157 | 108.5 | 51.9 | 18.81 | 30 | 1202 | 24 | 2.0 |
| TM | 0.025 | 0.75 | 107 | 73.9 | 40.2 | 18.81 | 30 | 292 | 15 | 4.7 |
| TM | 0.125 | 0.75 | 160 | 103.1 | 90.4 | 25.13 | 41 | 301 | 32 | 9.4 |
| TM | 0.125 | 0.75 | 130 | 85.1 | 74.4 | 25.13 | 41 | 469 | 31 | 6.1 |
| TM | 0.5 | 0.75 | 160 | 100.9 | 99.9 | 25.13 | 41 | 21 | 27 | 43.5 |
| TM | 0.5 | 0.75 | 130 | 83.2 | 82.2 | 25.13 | 41 | 62 | 26 | 25.2 |
| |
1 | 0.75 | 160 | 104.4 | 104.3 | 25.13 | 41 | 2 | 26 | 60.5 |
| |
1 | 0.75 | 130 | 85.4 | 85.3 | 25.13 | 41 | 9 | 25 | 50.0 |
| |
1 | 0.95 | 130 | 85.4 | 85.3 | 33.56 | 55 | 9 | 41 | 64.1 |
Claims (27)
Priority Applications (1)
| Application Number | Priority Date | Filing Date | Title |
|---|---|---|---|
| US14/219,958 US10170678B2 (en) | 2013-03-21 | 2014-03-19 | Thermomechanical cycle for thermal and/or mechanical energy conversion using piezoelectric materials |
Applications Claiming Priority (2)
| Application Number | Priority Date | Filing Date | Title |
|---|---|---|---|
| US201361804108P | 2013-03-21 | 2013-03-21 | |
| US14/219,958 US10170678B2 (en) | 2013-03-21 | 2014-03-19 | Thermomechanical cycle for thermal and/or mechanical energy conversion using piezoelectric materials |
Publications (2)
| Publication Number | Publication Date |
|---|---|
| US20140285061A1 US20140285061A1 (en) | 2014-09-25 |
| US10170678B2 true US10170678B2 (en) | 2019-01-01 |
Family
ID=51568670
Family Applications (1)
| Application Number | Title | Priority Date | Filing Date |
|---|---|---|---|
| US14/219,958 Active 2036-10-18 US10170678B2 (en) | 2013-03-21 | 2014-03-19 | Thermomechanical cycle for thermal and/or mechanical energy conversion using piezoelectric materials |
Country Status (1)
| Country | Link |
|---|---|
| US (1) | US10170678B2 (en) |
Cited By (1)
| Publication number | Priority date | Publication date | Assignee | Title |
|---|---|---|---|---|
| US11607260B2 (en) * | 2015-01-26 | 2023-03-21 | Rush University Medical Center | Implant removal devices and methods of use thereof |
Families Citing this family (2)
| Publication number | Priority date | Publication date | Assignee | Title |
|---|---|---|---|---|
| US9793829B2 (en) * | 2013-09-25 | 2017-10-17 | Prime Photonics, Lc | Magneto-thermoelectric generator for energy harvesting |
| JP7542941B2 (en) * | 2018-12-21 | 2024-09-02 | キヤノン株式会社 | Method for manufacturing piezoelectric element, method for manufacturing electronic device, piezoelectric element, and electronic device |
Citations (4)
| Publication number | Priority date | Publication date | Assignee | Title |
|---|---|---|---|---|
| US20110163636A1 (en) * | 2009-10-22 | 2011-07-07 | Lawrence Livermore National Security, Llc | Matrix-assisted energy conversion in nanostructured piezoelectric arrays |
| US20120019098A1 (en) * | 2009-05-14 | 2012-01-26 | Neothermal Energy Company | Method and apparatus for generating electricity by thermally cycling an electrically polarizable material using heat from various sources and a vehicle comprising the apparatus |
| US20120256427A1 (en) * | 2008-01-28 | 2012-10-11 | The Boeing Company | Temperature-Activated Voltage Generator |
| US20130300258A1 (en) * | 2012-05-09 | 2013-11-14 | Chung-Yuan Christian University | Piezoelectric device system producing both vibration and electric power |
-
2014
- 2014-03-19 US US14/219,958 patent/US10170678B2/en active Active
Patent Citations (4)
| Publication number | Priority date | Publication date | Assignee | Title |
|---|---|---|---|---|
| US20120256427A1 (en) * | 2008-01-28 | 2012-10-11 | The Boeing Company | Temperature-Activated Voltage Generator |
| US20120019098A1 (en) * | 2009-05-14 | 2012-01-26 | Neothermal Energy Company | Method and apparatus for generating electricity by thermally cycling an electrically polarizable material using heat from various sources and a vehicle comprising the apparatus |
| US20110163636A1 (en) * | 2009-10-22 | 2011-07-07 | Lawrence Livermore National Security, Llc | Matrix-assisted energy conversion in nanostructured piezoelectric arrays |
| US20130300258A1 (en) * | 2012-05-09 | 2013-11-14 | Chung-Yuan Christian University | Piezoelectric device system producing both vibration and electric power |
Non-Patent Citations (41)
Cited By (1)
| Publication number | Priority date | Publication date | Assignee | Title |
|---|---|---|---|---|
| US11607260B2 (en) * | 2015-01-26 | 2023-03-21 | Rush University Medical Center | Implant removal devices and methods of use thereof |
Also Published As
| Publication number | Publication date |
|---|---|
| US20140285061A1 (en) | 2014-09-25 |
Similar Documents
| Publication | Publication Date | Title |
|---|---|---|
| McKinley et al. | A novel thermomechanical energy conversion cycle | |
| Lee et al. | Pyroelectric waste heat energy harvesting using heat conduction | |
| Bowen et al. | Pyroelectric materials and devices for energy harvesting applications | |
| Lee et al. | Pyroelectric waste heat energy harvesting using relaxor ferroelectric 8/65/35 PLZT and the Olsen cycle | |
| McKinley et al. | Waste heat energy harvesting using the Olsen cycle on 0.945 Pb (Zn1/3Nb2/3) O3–0.055 PbTiO3 single crystals | |
| Kandilian et al. | The pyroelectric energy harvesting capabilities of PMN–PT near the morphotropic phase boundary | |
| Sebald et al. | Pyroelectric energy conversion: optimization principles | |
| Vats et al. | Thermal energy harvesting using bulk lead‐free ferroelectric ceramics | |
| Chauhan et al. | Enhanced thermal energy harvesting using Li, K‐doped Bi0. 5Na0. 5TiO3 lead‐free ferroelectric ceramics | |
| Guyomar et al. | Energy harvesting based on FE-FE transition in ferroelectric single crystals | |
| Ma et al. | Enhanced electrocaloric cooling in ferroelectric single crystals by electric field reversal | |
| Shkuratov et al. | Ultrahigh energy density harvested from domain-engineered relaxor ferroelectric single crystals under high strain rate loading | |
| McKinley et al. | A novel thermally biased mechanical energy conversion cycle | |
| McKinley et al. | Phase transitions and thermal expansion in pyroelectric energy conversion | |
| US10170678B2 (en) | Thermomechanical cycle for thermal and/or mechanical energy conversion using piezoelectric materials | |
| Tung et al. | Ultimate electromechanical energy conversion performance and energy storage capacity of ferroelectric materials under high excitation levels | |
| Subhani et al. | Nonlinear magneto-electro-mechanical response of layered magneto-electric composites: theoretical and experimental approach | |
| Pilon et al. | Pyroelectric energy conversion | |
| Cheng et al. | Effects of uniaxial compressive stress on the electrocaloric effect of ferroelectric ceramics | |
| Xue et al. | Uniaxial stress-induced ferroelectric depolarization in< 001>-oriented 0.72 Pb (Mg1/3Nb2/3) O3-0.28 PbTiO3 single crystal | |
| Barr et al. | Electrocaloric response of KNbO3 from a first-principles effective Hamiltonian | |
| Patel et al. | Large barocaloric effect and pressure‐mediated electrocaloric effect in Pb0. 99Nb0. 02 (Zr0. 95Ti0. 05) 0.08 O3 ceramics | |
| Chin et al. | Direct thermal to electrical energy conversion using 9.5/65/35 PLZT ceramics in the ergodic relaxor phase | |
| Rashadfar et al. | Electric field-dependent thermal conductivity of relaxor ferroelectric PMN-33PT through changes in the phonon spectrum | |
| Raghavendra et al. | Preparation and characterization of BaTiO3–PbZrTiO3 coating for pyroelectric energy harvesting |
Legal Events
| Date | Code | Title | Description |
|---|---|---|---|
| AS | Assignment |
Owner name: THE REGENTS OF THE UNIVERSITY OF CALIFORNIA, CALIF Free format text: ASSIGNMENT OF ASSIGNORS INTEREST;ASSIGNORS:MCKINLEY, IAN;PILON, LAURENT;REEL/FRAME:032479/0033 Effective date: 20140318 |
|
| AS | Assignment |
Owner name: NATIONAL SCIENCE FOUNDATION, VIRGINIA Free format text: CONFIRMATORY LICENSE;ASSIGNOR:UNIVERSITY OF CALIFORNIA, LOS ANGELES;REEL/FRAME:035090/0351 Effective date: 20140416 |
|
| STCF | Information on status: patent grant |
Free format text: PATENTED CASE |
|
| MAFP | Maintenance fee payment |
Free format text: PAYMENT OF MAINTENANCE FEE, 4TH YR, SMALL ENTITY (ORIGINAL EVENT CODE: M2551); ENTITY STATUS OF PATENT OWNER: SMALL ENTITY Year of fee payment: 4 |