JPWO2004022463A1 - Safety stock quantity calculation device, safety stock quantity calculation program and order point calculation device - Google Patents
Safety stock quantity calculation device, safety stock quantity calculation program and order point calculation device Download PDFInfo
- Publication number
- JPWO2004022463A1 JPWO2004022463A1 JP2004534101A JP2004534101A JPWO2004022463A1 JP WO2004022463 A1 JPWO2004022463 A1 JP WO2004022463A1 JP 2004534101 A JP2004534101 A JP 2004534101A JP 2004534101 A JP2004534101 A JP 2004534101A JP WO2004022463 A1 JPWO2004022463 A1 JP WO2004022463A1
- Authority
- JP
- Japan
- Prior art keywords
- lead time
- calculating
- safety stock
- probability
- stock quantity
- Prior art date
- Legal status (The legal status is an assumption and is not a legal conclusion. Google has not performed a legal analysis and makes no representation as to the accuracy of the status listed.)
- Granted
Links
Images
Classifications
-
- G—PHYSICS
- G06—COMPUTING; CALCULATING OR COUNTING
- G06Q—INFORMATION AND COMMUNICATION TECHNOLOGY [ICT] SPECIALLY ADAPTED FOR ADMINISTRATIVE, COMMERCIAL, FINANCIAL, MANAGERIAL OR SUPERVISORY PURPOSES; SYSTEMS OR METHODS SPECIALLY ADAPTED FOR ADMINISTRATIVE, COMMERCIAL, FINANCIAL, MANAGERIAL OR SUPERVISORY PURPOSES, NOT OTHERWISE PROVIDED FOR
- G06Q10/00—Administration; Management
- G06Q10/08—Logistics, e.g. warehousing, loading or distribution; Inventory or stock management
- G06Q10/087—Inventory or stock management, e.g. order filling, procurement or balancing against orders
-
- G—PHYSICS
- G06—COMPUTING; CALCULATING OR COUNTING
- G06Q—INFORMATION AND COMMUNICATION TECHNOLOGY [ICT] SPECIALLY ADAPTED FOR ADMINISTRATIVE, COMMERCIAL, FINANCIAL, MANAGERIAL OR SUPERVISORY PURPOSES; SYSTEMS OR METHODS SPECIALLY ADAPTED FOR ADMINISTRATIVE, COMMERCIAL, FINANCIAL, MANAGERIAL OR SUPERVISORY PURPOSES, NOT OTHERWISE PROVIDED FOR
- G06Q10/00—Administration; Management
- G06Q10/10—Office automation; Time management
- G06Q10/101—Collaborative creation, e.g. joint development of products or services
-
- G—PHYSICS
- G06—COMPUTING; CALCULATING OR COUNTING
- G06Q—INFORMATION AND COMMUNICATION TECHNOLOGY [ICT] SPECIALLY ADAPTED FOR ADMINISTRATIVE, COMMERCIAL, FINANCIAL, MANAGERIAL OR SUPERVISORY PURPOSES; SYSTEMS OR METHODS SPECIALLY ADAPTED FOR ADMINISTRATIVE, COMMERCIAL, FINANCIAL, MANAGERIAL OR SUPERVISORY PURPOSES, NOT OTHERWISE PROVIDED FOR
- G06Q20/00—Payment architectures, schemes or protocols
- G06Q20/08—Payment architectures
- G06Q20/20—Point-of-sale [POS] network systems
- G06Q20/203—Inventory monitoring
-
- G—PHYSICS
- G06—COMPUTING; CALCULATING OR COUNTING
- G06Q—INFORMATION AND COMMUNICATION TECHNOLOGY [ICT] SPECIALLY ADAPTED FOR ADMINISTRATIVE, COMMERCIAL, FINANCIAL, MANAGERIAL OR SUPERVISORY PURPOSES; SYSTEMS OR METHODS SPECIALLY ADAPTED FOR ADMINISTRATIVE, COMMERCIAL, FINANCIAL, MANAGERIAL OR SUPERVISORY PURPOSES, NOT OTHERWISE PROVIDED FOR
- G06Q30/00—Commerce
- G06Q30/06—Buying, selling or leasing transactions
- G06Q30/0601—Electronic shopping [e-shopping]
- G06Q30/0633—Lists, e.g. purchase orders, compilation or processing
Abstract
ある物品に対する顧客の要求納期がそのリードタイムLよりも短い期間である確率Pbを算出するステップS8と、リードタイムLが顧客要求納期を超過した場合について、リードタイムLと顧客要求納期との差の平均値LLを算出するステップS9と、平均値LLを用いて在庫調整期間Nを補正するステップS10と、前記物品の需要の標準偏差σ、補正された在庫調整期間N、確率Pb、出荷頻度F及び安全係数kを用いて、安全在庫量SSを次式SS=Pb×k×(√N×F)×σによって算出するステップS11を有する。The difference between the lead time L and the customer required delivery date when the probability Pb for calculating the probability Pb that the customer requested delivery date for an article is shorter than the lead time L and the lead time L exceeds the customer required delivery date are as follows. Step S9 for calculating the average value LL, step S10 for correcting the inventory adjustment period N using the average value LL, the standard deviation σ of the demand for the goods, the corrected inventory adjustment period N, the probability Pb, the shipping frequency Using F and the safety coefficient k, there is a step S11 for calculating the safety stock quantity SS by the following equation SS = Pb × k × (√N × F) × σ.
Description
本発明は、安全在庫量の算出方法及び算出装置に関し、特に、未来在庫に基づいて在庫管理を行うシステムおける安全在庫量の算出に適用して有効な技術に関する。 The present invention relates to a method and apparatus for calculating a safety stock quantity, and more particularly, to a technique effective when applied to calculation of a safety stock quantity in a system that performs inventory management based on future stock.
従来より、過去の出荷量の標準偏差やリードタイムL、安全係数kなどから安全在庫量を計算する方式が知られている。そこでは、安全在庫量SSは、次の[式1]にて算出される。

![]()
安全係数kは許容欠品率の程度を表し、需要変動や予測誤差などの不確定性をどの程度面倒見るかによって決定される。安全係数kは目標とするサービス率Sから設定され、需要量の正規分布表から、例えば、サービス率95%(95%の需要を満たす場合;許容欠品率5%)には、安全係数はk=1.65となる。
在庫調整期間は、1回の発注によって入荷した数量で対応しなければならない期間の長さである。この在庫調整期間は、発注点方式による在庫管理を行っている場合にはリードタイムLそのものとなり、定期発注方式の場合には、リードタイムLに発注サイクルMを加えた期間となる。出荷発生頻度は、在庫調整期間中に行われる発注回数を示しており、例えば10日で3回の発注を行う場合には0.3などの値を設定する。なお、需要の標準偏差σを1週間単位や1ヶ月単位で算出する場合には、リードタイムLや発注サイクルMの時間単位もこれに適合させる。
一方、近年、企業の基幹的な情報処理システムでは、在庫管理を含む種々の管理業務、例えば、会計管理や生産管理、販売管理、人事管理等に関し、社内で流通する情報を統合して処理するERP(Enterprise Resource Planning)パッケージの導入が進んでいる。ERPパッケージでは、大福帳型構造を持った統合データベースを中核として、在庫管理等の各業務モジュールが構築されており、各モジュールは通常各々独立して稼働するようになっている。そのうち在庫管理モジュールでは、製品の部品相互の関係とリードタイムをもとに、資材の所要量と必要時期に着目して生産計画を立案するいわゆるMRP(Material Requirements Planning;資材所要量計画)が採用されており、将来の在庫量予測値である未来在庫に基づいて物品等の発注が行われる。
このようなERPパッケージでは、在庫管理に際し、発注点方式の場合は発注点及び一定の発注量、定期発注方式の場合は発注量の計算方法を定義しておき、ユーザー側が適宜数値を入力して発注業務の管理を行う。この発注点や発注量は前述の安全在庫量を用いて決定され、発注点方式では、発注点=最小在庫=在庫調整期間(リードタイムL期間)中の平均需要量+安全在庫量となる。また、定期発注方式では、発注量=在庫調整期間中における予定使用量+安全在庫量−現在の在庫量−現在の注文残量となる。
しかしながら、前述のような従来の安全在庫量算出方式は、現時点における在庫量と発注点を参照して発注を行う場合の安全在庫量を算出する方式であり、未来在庫に基づくシステムには必ずしも適応しない。このため、ERPパッケージのように未来在庫に基づいて在庫管理を行うシステムでは、従来方式による算出値を用いると安全在庫量が過小や過大となるおそれがあり、適正な発注点や発注量を設定するのが難しいという問題があった。そこで、ERPソフトウェア上では、安全在庫量として、精度低下を承知で従来方式の算出値を入力したり、担当者の勘や経験に基づいて適宜修正した値を入力したりしており、システムの能力を十分生かしきれず、その改善が求められていた。
本発明の目的は、未来在庫に基づいて在庫管理を行うシステムに対応した安全在庫量の算出方法及び装置を提供することにある。Conventionally, a method for calculating a safety stock quantity from a standard deviation of a past shipment quantity, a lead time L, a safety factor k, and the like is known. There, the safety stock quantity SS is calculated by the following [Equation 1].
![]()
The safety factor k represents the degree of the allowable shortage rate, and is determined by how much trouble is taken into account of uncertainties such as demand fluctuations and prediction errors. The safety factor k is set from the target service rate S. From the normal distribution table of the demand amount, for example, the service factor is 95% (if 95% demand is satisfied; the allowable shortage rate is 5%), the safety factor is k = 1.65.
The inventory adjustment period is the length of the period that must be dealt with by the quantity received by one order. This inventory adjustment period is the lead time L itself when inventory management is performed by the order point method, and is a period obtained by adding the order cycle M to the lead time L in the case of the periodic order method. The shipping occurrence frequency indicates the number of orders placed during the inventory adjustment period. For example, when ordering three times in 10 days, a value such as 0.3 is set. When the standard deviation σ of demand is calculated in units of one week or one month, the time units of the lead time L and the ordering cycle M are also adapted to this.
On the other hand, in recent years, a company's core information processing system integrates and processes information distributed in-house for various management tasks including inventory management, such as accounting management, production management, sales management, and personnel management. Introduction of ERP (Enterprise Resource Planning) package is progressing. In the ERP package, each business module such as inventory management is constructed with an integrated database having a Daifuku book type structure as the core, and each module normally operates independently. Among them, the inventory management module employs so-called MRP (Material Requirements Planning), which draws production plans based on the relationship between component parts and lead time, focusing on material requirements and required time. Thus, the ordering of goods and the like is performed based on the future inventory which is the predicted value of the future inventory quantity.
In such an ERP package, in order to manage inventory, the order point and a fixed order quantity are defined for the order point method, and the order quantity calculation method is defined for the periodic order method. Manage ordering work. The order point and the order quantity are determined using the above-described safety stock quantity. In the order point system, the order point = minimum stock = average demand amount during the inventory adjustment period (lead time L period) + safety stock quantity. In the regular ordering method, the order quantity = scheduled usage quantity during the inventory adjustment period + safety stock quantity-current stock quantity-current order remaining quantity.
However, the conventional safety inventory quantity calculation method as described above is a system that calculates the safety inventory quantity when placing an order with reference to the current inventory quantity and the order point, and is not necessarily applicable to systems based on future inventory. do not do. For this reason, in a system that performs inventory management based on future inventory, such as the ERP package, the safety stock amount may be too small or too large when using the calculated value based on the conventional method, and appropriate order points and order quantities are set. There was a problem that it was difficult to do. Therefore, on the ERP software, as the safety stock quantity, the calculated value of the conventional method is input with knowledge of the accuracy drop, or the value appropriately corrected based on the intuition and experience of the person in charge is input. The ability was not fully utilized, and the improvement was demanded.
An object of the present invention is to provide a safety inventory quantity calculation method and apparatus corresponding to a system that performs inventory management based on future inventory.
本発明の安全在庫量算出方法は、ある物品に対する需要の標準偏差σと、前記物品又はその構成物のリードタイムLから算出される在庫調整期間Nと、需要に対するサービス率Sの程度を示す安全係数kに基づいて安全在庫量SSの算出を行う安全在庫量算出方法であって、前記物品に対する顧客の要求納期が、前記リードタイムLよりも短い期間である確率Pbを算出するステップと、前記リードタイムLが前記顧客要求納期を超過した場合について、前記リードタイムLと前記顧客要求納期との差の代表値LLを算出するステップと、前記代表値LLを用いて前記在庫調整期間Nを補正するステップと、前記標準偏差σ、補正された前記在庫調整期間N、前記確率Pb及び前記安全係数kに基づいて安全在庫量SSを算出するステップとを有することを特徴とする。
本発明にあっては、在庫調整期間Nを代表値LLにて補正すると共に、短納期確率Pbを用いて安全在庫量SSを算出するので、安全在庫にて対応しなければならないケースの発生に即した現実的な安全在庫量を設定することができる。また、本発明の安全在庫量算出方法は、代表値LLと短納期確率Pbという実績データを用いた算出方式であるため、未来在庫に基づいて物品等のオーダーを行う場合にも対応可能であり、ERPパッケージなどにおいても物品等の安全在庫量を適切に設定できる。
前記安全在庫量算出方法において、前記安全在庫量SSを算出するステップでは、次式によって安全在庫量SSを算出するようにしても良い。
![]()
前記安全在庫量算出方法において、前記在庫調整期間Nを補正するステップでは、定量発注方式の場合には、前記リードタイムLを前記代表値LLに置き換えて在庫調整期間Nを補正し、定期発注方式の場合には、前記リードタイムLを前記代表値LLに発注サイクルMを加えた値に置き換えて在庫調整期間Nを補正するようにしても良い。
また、前記全在庫量算出方法において、補正された前記在庫調整期間Nに出荷頻度Fを乗じても良い。さらに、前記代表値LLとして、前記リードタイムLと前記顧客要求納期との差の平均値を用いても良い。加えて、前記算出方法を将来の在庫量予測値である未来在庫に基づいて在庫管理を行うシステムに適用しても良い。なお、ここで言う在庫管理とは、物品等の調達活動を伴う生産管理業務をも含む概念である。
本発明の安全在庫量算出装置は、ある物品に対する過去の需要の標準偏差σと、前記物品又はその構成物のリードタイムLから算出される在庫調整期間Nと、需要に対するサービス率Sの程度を示す安全係数kに基づいて安全在庫量SSの算出を行う安全在庫量算出装置であって、前記物品に対する顧客の要求納期が、前記リードタイムLよりも短い期間である確率Pbを算出する短納期確率算出部と、前記リードタイムLが前記顧客要求納期を超過した場合について、前記リードタイムLと前記顧客要求納期との差の代表値LLを算出する平均納期超過日数算出部と、前記代表値LLを用いて前記在庫調整期間Nを補正する在庫調整期間補正部と、前記標準偏差σ、補正された前記在庫調整期間N、前記短納期確率Pb及び前記安全係数kに基づいて安全在庫量SSを算出する安全在庫量算出部とを有することを特徴とする。
本発明にあっては、在庫調整期間補正部にて在庫調整期間Nを代表値LLにて補正すると共に、短納期確率算出部にて短納期確率Pbを算出し、これを用いて安全在庫量SSを算出するので、安全在庫にて対応しなければならないケースの発生に即した現実的な安全在庫量を設定することができる。また、本発明の安全在庫量算出装置は、代表値LLと短納期確率Pbという実績データを用いて安全在庫量を算出するため、未来在庫に基づいて物品等のオーダーを行う場合にも対応可能であり、ERPパッケージなどにおいても物品等の安全在庫量を適切に設定できる。
また、本発明の安全在庫量算出装置は、ある物品に対する過去の需要の標準偏差σと、前記物品又はその構成物のリードタイムLから算出される在庫調整期間Nと、需要に対するサービス率Sの程度を示す安全係数kに基づいて安全在庫量SSの算出を行う安全在庫量算出装置であって、前記リードタイムLが前記顧客要求納期を超過した場合の前記物品の需要データに基づいて前記標準偏差σを算出する需要標準偏差算出部と、前記リードタイムLが前記顧客要求納期を超過した場合について、前記リードタイムLと前記顧客要求納期との差の代表値LLを算出する平均納期超過日数算出部と、前記代表値LLを用いて前記在庫調整期間Nを補正する在庫調整期間補正部と、前記標準偏差σと、補正された前記在庫調整期間N及び前記安全係数kに基づいて安全在庫量SSを算出する安全在庫量算出部とを有することを特徴とする。
前記安全在庫量算出装置において、前記リードタイムL及び前記サービス率Sを入力する手段と、前記安全在庫量SSを表示する手段をさらに設けても良い。なお、前記代表値LLとして、前記リードタイムLと前記顧客要求納期との差の平均値を用いても良い。また、前記安全在庫量算出装置において、前記安全在庫量SSに、需要の平均値Aと前記代表値LLとを乗じた値を加えて発注点Oを算出する発注点算出部をさらに設けてもい。また、前記安全在庫量算出装置において、前記安全在庫量SSに、前記代表値LLと発注サイクルMとを加えた期間中の前記物品又はその構成物の予定使用量を加え、その値から現在在庫量及び現在の注文残量を減じて発注量O’を算出する発注量算出部をさらに設けることも可能である。
一方、本発明の安全在庫量算出プログラムは、安全在庫量SSの算出を行うために、コンピュータを、ある物品に対する需要に基づき、前記物品需要の標準偏差σを算出する手段、前記物品に対する顧客の要求納期が、前記物品又はその構成物のリードタイムLよりも短い期間である確率Pbを算出する手段、前記リードタイムLが前記顧客要求納期を超過した場合について、前記リードタイムLと前記顧客要求納期との差の代表値LLを算出する手段、前記代表値LLを用いて在庫調整期間Nを算出する手段、前記標準偏差σ、補正された前記在庫調整期間N、前記確率Pb及び需要に対するサービス率Sの程度を示す安全係数kに基づいて安全在庫量SSを算出する手段、として機能させる。
また、本発明の安全在庫量算出プログラムは、安全在庫量SSの算出を行うために、コンピュータを、ある物品に対する需要に基づき、前記物品需要の標準偏差σを前記物品又はその構成物のリードタイムLが前記顧客要求納期を超過した場合のデータに基づいて算出する手段、前記リードタイムLが前記顧客要求納期を超過した場合について、前記リードタイムLと前記顧客要求納期との差の代表値LLを算出する手段、前記代表値LLを用いて在庫調整期間Nを算出する手段、前記標準偏差σ、補正された前記在庫調整期間N及び需要に対するサービス率Sの程度を示す安全係数kに基づいて安全在庫量SSを算出する手段、として機能させる。
一方、本発明の発注点算出方法は、前記安全在庫量算出方法によって算出された安全在庫量SSに、需要の平均値Aと前記代表値LLとを乗じた値を加えて発注点Oを算出することを特徴とする。さらに、本発明の発注量算出方法は、前記安全在庫量算出方法によって算出された安全在庫量SSに、前記代表値LLと発注サイクルMとを加えた期間中の前記物品又はその構成物の予定使用量を加え、その値から現在在庫量及び現在の注文残量を減じて発注量O’を算出することを特徴とする。
次に、本発明の他の安全在庫量算出方法は、ある物品に対する顧客要求納期とその頻度から納期ごとにその出現確率を算出するステップと、前記物品又はその構成物のリードタイムの発生確率を算出するステップと、前記顧客要求納期と前記リードタイムから、前記物品が発注点を割ることを予測して発注を行った後、当該物品が提供可能となった時点と、前記発注点を割ることが予測された時点との間の期間を示す実効リードタイムTiを算出するステップと、前記顧客要求納期の出現確率と前記リードタイムの発生確率に基づいて、前記実効リードタイムTiごとに前記実効リードタイムTiの出現確率を算出するステップと、前記物品に対する単位期間当たりの需要量の標準偏差σDと、需要に対するサービス率Sの程度を示す安全係数kと、前記実効リードタイムTi及び前記実効リードタイムの出現確率とに基づいて安全在庫量ssを算出するステップとを有することを特徴とする。
また、本発明の他の安全在庫量算出方法は、ある物品に対する顧客要求納期とその頻度から納期ごとにその出現確率を算出し、顧客要求納期の確率分布gjを作成するステップと、前記物品又はその構成物のリードタイムの発生確率を算出し、リードタイムの確率分布hkを作成するステップと、前記顧客要求納期と前記リードタイムから、前記物品が発注点を割ることを予測して発注を行った後、当該物品が提供可能となった時点と、前記発注点を割ることが予測された時点との間の期間を示す実効リードタイムTiを算出するステップと、前記顧客要求納期の確率分布gjと前記リードタイムの確率分布hkに基づいて、前記実効リードタイムTiごとにその出現確率を算出し、実効リードタイムの確率分布fiを作成するステップと、ある物品に対する単位期間当たりの需要量の標準偏差σDと、需要に対するサービス率Sの程度を示す安全係数kと、前記実効リードタイムTi及び前記実効リードタイムの確率分布fiとに基づいて安全在庫量ssを算出するステップとを有することを特徴とする。
本発明の安全在庫量算出方法にあっては、顧客要求納期の出現確率とリードタイムの発生確率を求めると共に、それらを用いて実効リードタイムの出現確率を求め、実効リードタイムとその出現確率に基づいて安全在庫量を算出するので、より一般的な形で未来在庫に基づく在庫管理システムを構築することができる。また、本発明の安全在庫量算出方法は、実績データを用いて確率を算出する方式であるため、未来在庫に基づいて物品等のオーダーを行う場合にも対応可能であり、ERPパッケージなどにおいても物品等の安全在庫量を適切に設定できる。
前記安全在庫量算出方法において、前記安全在庫量ssを算出するステップにて、次式によって安全在庫量ssを算出するようにしても良い。
![]()
本発明の他の安全在庫量算出装置は、ある物品に対する顧客要求納期とその頻度から納期ごとにその出現確率を算出する納期出現確率算出部と、前記物品又はその構成物のリードタイムの発生確率を算出するリードタイム発生確率算出部と、前記顧客要求納期と前記リードタイムから、前記物品が発注点を割ることを予測して発注を行った後、当該物品が提供可能となった時点と、前記発注点を割ることが予測された時点との間の期間を示す実効リードタイムTiを算出する実効リードタイム算出部と、前記顧客要求納期の出現確率と前記リードタイムの発生に基づいて、前記実効リードタイムTiごとにその出現確率を算出する実効リードタイム出現確率算出部と、ある物品に対する単位期間当たりの需要量の標準偏差σDと、需要に対するサービス率Sの程度を示す安全係数kと、前記実効リードタイムTi及び前記実効リードタイムの出現確率とに基づいて安全在庫量ssを算出する安全在庫量算出部とを有することを特徴とする。
また、本発明の他の安全在庫量算出装置は、ある物品に対する顧客要求納期とその頻度から納期ごとにその出現確率を算出し、顧客要求納期の確率分布gjを作成する納期確率分布算出部と、前記物品又はその構成物のリードタイムの発生確率を算出し、リードタイムの確率分布hkを作成するリードタイム確率分布算出部と、前記顧客要求納期と前記リードタイムから、前記物品が発注点を割ることを予測して発注を行った後、当該物品が提供可能となった時点と、前記発注点を割ることが予測された時点との間の期間を示す実効リードタイムTiを算出する実効リードタイム算出部と、前記顧客要求納期の確率分布gjと前記リードタイムの分布確率hkに基づいて、前記実効リードタイムTiごとにその出現確率を算出し、実効リードタイムの確率分布fiを作成する実効リードタイム確率分布算出部と、ある物品に対する単位期間当たりの需要量の標準偏差σDと、需要に対するサービス率Sの程度を示す安全係数kと、前記実効リードタイムTi及び前記実効リードタイムの確率分布fiとに基づいて安全在庫量ssを算出する安全在庫量算出部とを有することを特徴とする。
本発明の安全在庫量算出装置にあっては、顧客要求納期の出現確率とリードタイムの発生確率を求めると共に、それらを用いて実効リードタイムの出現確率を求め、実効リードタイムとその出現確率に基づいて安全在庫量を算出するので、より一般的な形で未来在庫に基づく在庫管理システムを構築することができる。また、本発明の安全在庫量算出方法は、実績データを用いて確率を算出する方式であるため、未来在庫に基づいて物品等のオーダーを行う場合にも対応可能であり、ERPパッケージなどにおいても物品等の安全在庫量を適切に設定できる。
一方、本発明の他の安全在庫量算出プログラムは、ある物品の安全在庫量ssの算出を行うために、コンピュータを、顧客要求納期と前記物品又はその構成物のリードタイムから、前記物品が発注点を割ることを予測して発注を行った後、当該物品が提供可能となった時点と、前記発注点を割ることが予測された時点との間の期間を示す実効リードタイムTiを算出する手段、顧客要求納期とその頻度から算出された顧客要求納期の出現確率と、前記物品又はその構成物のリードタイムの出現確率とから、前記実効リードタイムTiごとにその出現確率を算出する手段、前記物品に対する単位期間当たりの需要量の標準偏差σDと、需要に対するサービス率Sの程度を示す安全係数kと、前記実効リードタイムTi及び前記実効リードタイムの出現確率に基づいて安全在庫量ssを算出する手段、として機能させる。
また、本発明の他の安全在庫量算出プログラムは、ある物品の安全在庫量ssの算出を行うために、コンピュータを、顧客要求納期とその頻度から納期ごとにその出現確率を算出し、顧客要求納期の確率分布gjを作成する手段、前記物品又はその構成物のリードタイムの発生確率を算出し、リードタイムの確率分布hkを作成する手段、前記顧客要求納期と前記リードタイムから、前記物品が発注点を割ることを予測して発注を行った後、当該物品が提供可能となった時点と、前記発注点を割ることが予測された時点との間の期間を示す実効リードタイムTiを算出する手段、前記顧客要求納期の確率分布gjと前記リードタイムの分布確率hkに基づいて、前記実効リードタイムTiごとにその出現確率を算出し、実効リードタイムの確率分布fiを作成する手段、前記物品に対する単位期間当たりの需要量の標準偏差σDと、需要に対するサービス率Sの程度を示す安全係数kと、前記実効リードタイムTi及び前記実効リードタイムの確率分布fiとに基づいて安全在庫量ssを算出する手段、として機能させる。
本発明の他の発注点算出方法は、前記安全在庫量算出方法によって算出された安全在庫量ssと、単位期間当たりの需要量の代表値DAと、前記実効リードタイムTiの累積確率が前記サービス率Sを超えた以後の最小の実効リードタイム値を示す限界リードタイムLMとに基づいて発注点QROを算出することを特徴とする。この場合、前記安全在庫量ss、前記需要量の代表値DA及び前記限界リードタイムLMに加えて、単位期間当たりの需要量がゼロでない期間の出現確率を示す需要頻度FDをさらに用いて発注点QROを算出するようにしても良い。
本発明の他の発注点算出装置は、ある物品に対する顧客要求納期とその頻度がら納期ごとにその出現確率を算出する納期出現確率算出部と、前記物品又はその構成物のリードタイムの発生確率を算出するリードタイム発生確率算出部と、前記顧客要求納期と前記リードタイムから、前記物品が発注点を割ることを予測して発注を行った後、当該物品が提供可能となった時点と、前記発注点を割ることが予測された時点との間の期間を示す実効リードタイムTiを算出する実効リードタイム算出部と、前記顧客要求納期の出現確率と前記リードタイムの発生に基づいて、前記実効リードタイムTiごとにその出現確率を算出する実効リードタイム出現確率算出部と、前記物品に対する単位期間当たりの需要量の標準偏差σDと、需要に対するサービス率Sの程度を示す安全係数kと、前記実効リードタイムTi及び前記実効リードタイムの出現確率に基づいて安全在庫量ssを算出する安全在庫量算出部と、前記安全在庫量ssと、単位期間当たりの需要量の代表値DAと、前記実効リードタイムTiの累積確率が前記サービス率Sを超えた以後の最小の実効リードタイム値を示す限界リードタイムLMとに基づいて発注点QROを算出する発注点算出部とを有することを特徴とする。
また、本発明の他の発注点算出装置は、ある物品に対する顧客要求納期とその頻度から納期ごとにその出現確率を算出し、顧客要求納期の確率分布gjを作成する納期確率分布算出部と、前記物品又はその構成物のリードタイムの発生確率を算出し、リードタイムの確率分布hkを作成するリードタイム確率分布算出部と、前記顧客要求納期と前記リードタイムから、前記物品が発注点を割ることを予測して発注を行った後、当該物品が提供可能となった時点と、前記発注点を割ることが予測された時点との間の期間を示す実効リードタイムTiを算出する実効リードタイム算出部と、前記顧客要求納期の確率分布gjと前記リードタイムの分布確率hkに基づいて、前記実効リードタイムTiごとにその出現確率を算出し、実効リードタイムの確率分布fiを作成する実効リードタイム確率分布算出部と、ある物品に対する単位期間当たりの需要量の標準偏差σDと、需要に対するサービス率Sの程度を示す安全係数kと、前記実効リードタイムTi及び前記実効リードタイムの確率分布fiとに基づいて安全在庫量ssを算出する安全在庫量算出部と、前記安全在庫量ssと、単位期間当たりの需要量の代表値DAと、前記実効リードタイムTiの累積確率が前記サービス率Sを超えた以後の最小の実効リードタイム値を示す限界リードタイムLMとに基づいて発注点QROを算出する発注点算出部とを有することを特徴とする。
前記発注点算出装置において、前記発注点算出部は、前記安全在庫量ss、前記需要量の代表値DA及び前記限界リードタイムLMに加えて、単位期間当たりの需要量がゼロでない期間の出現確率を示す需要頻度FDをさらに用いて発注点QROを算出するようにしても良い。The safety stock quantity calculation method of the present invention is a safety that shows the standard deviation σ of demand for a certain article, the inventory adjustment period N calculated from the lead time L of the article or its component, and the degree of service rate S for demand. A safety stock quantity calculation method for calculating a safety stock quantity SS based on a coefficient k, the step of calculating a probability Pb that a customer's requested delivery date for the article is shorter than the lead time L; Calculating a representative value LL of a difference between the lead time L and the customer required delivery date when the lead time L exceeds the customer requested delivery date, and correcting the inventory adjustment period N using the representative value LL And calculating a safety stock quantity SS based on the standard deviation σ, the corrected inventory adjustment period N, the probability Pb, and the safety coefficient k. It is characterized by having.
In the present invention, the inventory adjustment period N is corrected with the representative value LL, and the safety stock quantity SS is calculated using the short delivery time probability Pb. A realistic safety stock amount can be set accordingly. In addition, since the safety stock quantity calculation method of the present invention is a calculation method using actual data such as the representative value LL and the short delivery probability Pb, it is possible to deal with the case of ordering articles based on the future stock. Even in ERP packages and the like, it is possible to appropriately set the safety stock amount of articles and the like.
In the safety stock quantity calculation method, the safety stock quantity SS may be calculated by the following equation in the step of calculating the safety stock quantity SS.
![]()
In the safety stock quantity calculating method, in the step of correcting the inventory adjustment period N, in the case of a quantitative order method, the lead time L is replaced with the representative value LL to correct the inventory adjustment period N, and the periodic order method In this case, the inventory adjustment period N may be corrected by replacing the lead time L with a value obtained by adding the ordering cycle M to the representative value LL.
In the total inventory amount calculation method, the corrected inventory adjustment period N may be multiplied by the shipping frequency F. Furthermore, an average value of the difference between the lead time L and the customer request delivery date may be used as the representative value LL. In addition, the calculation method may be applied to a system that performs inventory management based on a future inventory that is a future inventory amount prediction value. In addition, the inventory management here is a concept including production management work accompanied by procurement activities for goods and the like.
The safety stock quantity calculation device of the present invention includes the standard deviation σ of past demand for a certain article, the inventory adjustment period N calculated from the lead time L of the article or its component, and the degree of service rate S for demand. A safety stock quantity calculation device that calculates a safety stock quantity SS based on a safety factor k indicated, and a short delivery date for calculating a probability Pb that a customer's requested delivery date for the article is shorter than the lead time L A probability calculating unit, an average overdue days calculating unit for calculating a representative value LL of a difference between the lead time L and the customer requested delivery date when the lead time L exceeds the customer requested delivery date, and the representative value An inventory adjustment period correction unit that corrects the inventory adjustment period N using LL, the standard deviation σ, the corrected inventory adjustment period N, the quick delivery probability Pb, and the safety factor k. And a safety stock amount calculation unit that calculates a safety stock amount SS based on the safety stock amount SS.
In the present invention, the inventory adjustment period correction unit corrects the inventory adjustment period N with the representative value LL, and the short delivery date probability calculation unit calculates the short delivery date probability Pb. Since the SS is calculated, it is possible to set a realistic safety stock amount that matches the occurrence of a case that must be handled by the safety stock. In addition, since the safety stock quantity calculation device according to the present invention calculates the safety stock quantity using the actual data of the representative value LL and the short delivery time probability Pb, it is possible to deal with the case of ordering goods etc. based on the future stock. Thus, the safety stock quantity of articles and the like can be appropriately set even in an ERP package.
In addition, the safety stock quantity calculation device of the present invention includes a standard deviation σ of a past demand for a certain article, an inventory adjustment period N calculated from the lead time L of the article or its component, and a service rate S for the demand. A safety stock quantity calculation device for calculating a safety stock quantity SS based on a safety coefficient k indicating a degree, wherein the standard is based on demand data of the article when the lead time L exceeds the customer requested delivery date. Demand standard deviation calculation unit for calculating deviation σ, and average delivery deadline days for calculating a representative value LL of the difference between the lead time L and the customer required delivery date when the lead time L exceeds the customer requested delivery date A calculation unit; an inventory adjustment period correction unit that corrects the inventory adjustment period N using the representative value LL; the standard deviation σ; the corrected inventory adjustment period N; And having a safety stock amount calculation unit for calculating the safety stock quantity SS based on k.
The safety stock quantity calculating device may further include means for inputting the lead time L and the service rate S and means for displaying the safety stock quantity SS. The average value of the difference between the lead time L and the customer request delivery date may be used as the representative value LL. The safety stock quantity calculation apparatus may further include an order point calculation unit that calculates an order point O by adding a value obtained by multiplying the safety stock quantity SS by the average value A of demand and the representative value LL. . Further, in the safety stock quantity calculation apparatus, the planned use amount of the article or its component during the period obtained by adding the representative value LL and the ordering cycle M is added to the safety stock quantity SS, and the current stock is calculated from the value. It is also possible to further provide an order quantity calculation unit for calculating the order quantity O ′ by reducing the quantity and the current order remaining amount.
On the other hand, in order to calculate the safety stock quantity SS, the safety stock quantity calculation program of the present invention uses a computer to calculate the standard deviation σ of the article demand based on the demand for an article, Means for calculating a probability Pb that the requested delivery date is shorter than the lead time L of the article or its component, and when the lead time L exceeds the customer requested delivery date, the lead time L and the customer request Means for calculating a representative value LL of a difference from a delivery date, means for calculating an inventory adjustment period N using the representative value LL, the standard deviation σ, the corrected inventory adjustment period N, the probability Pb, and a service for demand It functions as a means for calculating the safety stock quantity SS based on the safety coefficient k indicating the degree of the rate S.
In addition, the safety stock quantity calculation program of the present invention uses a computer to calculate the standard stock σ of the demand for goods based on the demand for a certain article in order to calculate the safety stock quantity SS. Means for calculating based on data when L exceeds the customer required delivery date, and representative value LL of the difference between the lead time L and the customer required delivery date when the lead time L exceeds the customer required delivery date Based on the safety factor k indicating the degree of the service rate S with respect to the standard deviation σ, the corrected inventory adjustment period N, and the demand, the means for calculating the inventory adjustment period N using the representative value LL It functions as a means for calculating the safety stock amount SS.
On the other hand, the order point calculation method of the present invention calculates the order point O by adding a value obtained by multiplying the safety stock quantity SS calculated by the safety stock quantity calculation method by the average value A of demand and the representative value LL. It is characterized by doing. Further, the order quantity calculation method of the present invention is a schedule of the article or its component during a period obtained by adding the representative value LL and the order cycle M to the safety stock quantity SS calculated by the safety stock quantity calculation method. The order quantity O ′ is calculated by adding the usage amount and subtracting the current inventory quantity and the current order remaining amount from the values.
Next, another safety stock quantity calculation method of the present invention includes a step of calculating an appearance probability for each delivery date from a customer requested delivery date and a frequency for an article, and an occurrence probability of a lead time of the article or its component. After calculating, predicting that the article will divide the order point from the customer requested delivery date and the lead time, when the article becomes available, and dividing the order point There based on steps and, the probability of occurrence probability and the lead time of the customer request delivery time for calculating the effective lead time T i indicating a period between the time of the predicted, the for each of the effective lead time T i safety illustrating the steps of calculating the occurrence probabilities of the effective lead time T i, and the standard deviation sigma D demand per unit period for the article, the degree of service rate S for demand The number k, is characterized by a step of calculating the safety stock quantity ss based on the occurrence probability of the effective lead time T i and the effective lead time.
According to another safety stock quantity calculation method of the present invention, the appearance probability is calculated for each delivery date from a customer requested delivery date and a frequency of a certain product, and a probability distribution g j of the customer requested delivery date is created. Or, calculating the occurrence probability of the lead time of the component, creating a probability distribution h k of the lead time, and predicting that the article divides the order point from the customer requested delivery date and the lead time. And calculating an effective lead time T i indicating a period between the time when the article can be provided and the time when the ordering point is predicted to be divided; Calculating an appearance probability for each effective lead time T i based on the probability distribution g j and the probability distribution h k of the lead time, and creating a probability distribution f i of the effective lead time And a standard deviation σ D of a demand amount per unit period for a certain article, a safety factor k indicating the degree of the service rate S with respect to the demand, the effective lead time T i and the probability distribution f i of the effective lead time. And calculating a safety stock quantity ss based on the step.
In the safety stock quantity calculation method of the present invention, the occurrence probability of the customer requested delivery date and the occurrence probability of the lead time are obtained, the occurrence probability of the effective lead time is obtained using them, and the effective lead time and the occurrence probability thereof are calculated. Since the safety stock quantity is calculated based on the stock inventory system, an inventory management system based on the future stock can be constructed in a more general form. In addition, since the safety stock quantity calculation method of the present invention is a method of calculating the probability using the actual data, it can also be used when ordering articles etc. based on the future stock, and even in the ERP package etc. The safety stock quantity of goods etc. can be set appropriately.
In the safety stock quantity calculation method, the safety stock quantity ss may be calculated by the following equation in the step of calculating the safety stock quantity ss.
![]()
Another safety stock quantity calculation device of the present invention includes a delivery date appearance probability calculation unit that calculates an appearance probability for each delivery date from a customer requested delivery date and frequency for a certain product, and an occurrence probability of a lead time of the product or its component. A lead time occurrence probability calculation unit that calculates the point, and when the article can be provided after placing an order by predicting that the article will divide the order point from the customer requested delivery date and the lead time; wherein the effective lead time calculation unit dividing the order point is calculating an effective lead time T i indicating a period between the time of the predicted, based on the occurrence of the lead time and the appearance probability of the customer request delivery, the effective lead time occurrence probability calculation unit for calculating the occurrence probability for each of the effective lead time T i, and the standard deviation sigma D demand per unit period for certain articles, versus demand A safety factor k indicating the degree of service rate S that, and characterized in that it has a safety stock amount calculation unit for calculating the safety stock quantity ss based on the occurrence probability of the effective lead time T i and the effective lead time To do.
Further, another safety stock quantity calculating device of the present invention calculates a probability of appearance for each delivery date from a customer requested delivery date and frequency of an article, and creates a probability distribution g j of the customer requested delivery date. A lead time probability distribution calculating unit for calculating a lead time probability of the article or its component and creating a lead time probability distribution h k , and the article is ordered from the customer requested delivery date and the lead time. calculated after an order to predict dividing point, and the time in which the article has become possible to provide, the effective lead time T i indicating a period between the time when dividing the order point is predicted to the effective lead time calculation unit, based on the distribution probability h k of the lead time and the probability distribution g j of the customer request delivery, calculates the probability of occurrence for each of the effective lead time T i, the effective re The effective lead time probability distribution calculating unit for creating a probability distribution f i of Dotaimu, and the standard deviation sigma D demand per unit period for certain articles, and a safety coefficient k indicating the degree of service rate S for demand, the effective And a safety stock quantity calculation unit that calculates a safety stock quantity ss based on the lead time T i and the probability distribution f i of the effective lead time.
In the safety stock quantity calculation device of the present invention, the occurrence probability of the customer requested delivery date and the occurrence probability of the lead time are obtained, the occurrence probability of the effective lead time is obtained using them, and the effective lead time and the occurrence probability thereof are calculated. Since the safety stock quantity is calculated based on the stock inventory system, an inventory management system based on the future stock can be constructed in a more general form. In addition, since the safety stock quantity calculation method of the present invention is a method of calculating the probability using the actual data, it can also be used when ordering articles etc. based on the future stock, and even in the ERP package etc. The safety stock quantity of goods etc. can be set appropriately.
On the other hand, another safety stock quantity calculation program of the present invention orders a computer from a customer requested delivery date and a lead time of the article or its component in order to calculate a safety stock quantity ss of a certain article. calculated after an order to predict dividing point, and the time in which the article has become possible to provide, the effective lead time T i indicating a period between the time when dividing the order point is predicted to means calculates customer request delivery time and the probabilities of occurrence of customer requests delivery calculated from the frequency, from said article or probability of occurrence of lead time of the composition, the appearance probability for each of the effective lead time T i means, and the standard deviation sigma D demand per unit period for the article, and a safety coefficient k indicating the degree of service rate S for demand, the effective lead time T i and the effective lead time Means for calculating the safety stock quantity ss based on the occurrence probability, to function as a.
Further, another safety stock quantity calculation program of the present invention calculates a probability of appearance for each delivery date from a customer demand delivery date and its frequency in order to calculate a safety stock quantity ss of a certain article, From the means for creating a delivery probability distribution g j , calculating the lead time probability of the article or its component, and creating the lead time probability distribution h k, from the customer requested delivery date and the lead time, An effective lead time T indicating a period between the time when the article can be provided and the time when the article is predicted to be divided after the article is predicted to be divided into order points. means for calculating a i, based on the distribution probability h k of the lead time and the probability distribution g j of the customer request delivery time, to calculate the probability of occurrence for each of the effective lead time T i, the effective lead time Means for creating a probability distribution f i, and the standard deviation sigma D demand per unit period for the article, and a safety coefficient k indicating the degree of service rate S for demand, the effective lead time T i and the effective lead time means for calculating the safety stock quantity ss based on the probability distribution f i of, to function as a.
Another order point calculation method of the present invention, the a safety stock amount calculation method safety stock quantity ss calculated by the representative value DA of demand per unit period, the cumulative probability of the effective lead time T i is the and calculates the reorder point Q RO based on the limitations lead time L M indicating the service rate minimum effective lead time value subsequent beyond S. In this case, the safety stock quantity ss, in addition to the representative values DA and the limit lead time L M of the demand, further using a demand frequency F D indicating the probability of occurrence of periods demand per unit period is not zero The order point QRO may be calculated.
Another order point calculation device according to the present invention includes a delivery date appearance probability calculation unit for calculating an appearance probability for each delivery date based on a customer requested delivery date and frequency for a certain product, and an occurrence probability of a lead time of the product or its component. The lead time occurrence probability calculating unit to calculate, and from the customer request delivery date and the lead time, after predicting that the article divides the order point, and placing the order, the article can be provided, An effective lead time calculating unit for calculating an effective lead time T i indicating a period between when the order point is predicted to be divided, based on the occurrence probability of the customer requested delivery date and the occurrence of the lead time, the effective lead time occurrence probability calculation unit for calculating the occurrence probability for each effective lead time T i, and the standard deviation sigma D demand per unit period for the article, for the demand A safety factor k indicating the degree of-bis ratio S, a safety stock amount calculation unit for calculating the safety stock quantity ss based on the appearance probability of the effective lead time T i and the effective lead time, and the safety stock quantity ss, a representative value DA of demand per unit period, the effective lead time T i order point on the basis of the limit lead time L M of the cumulative probability exhibit minimal effective lead time value subsequent exceeding the service rate S of It has an order point calculation part which calculates QRO , It is characterized by the above-mentioned.
Another order point calculation device of the present invention includes a delivery date probability distribution calculating unit that calculates a probability of appearance for each delivery date from a customer requested delivery date and a frequency thereof for a certain article and creates a probability distribution g j of the customer requested delivery date. A lead time probability distribution calculating unit for calculating a lead time probability of the article or its component and creating a lead time probability distribution h k , and from the customer requested delivery date and the lead time, the article is an order point. after an order in anticipation of dividing, calculates the time when the article becomes possible to provide, the effective lead time T i indicating a period between the time when dividing the order point is predicted and the effective lead time calculation unit, on the basis of the probability distribution g j of customer demand delivery to distribution probability h k of the lead time, to calculate the probability of occurrence for each of the effective lead time T i, the effective lead The effective lead time probability distribution calculating unit for creating a probability distribution f i Im, and the standard deviation sigma D demand per unit period for certain articles, and a safety coefficient k indicating the degree of service rate S for demand, the effective A safety inventory quantity ss for calculating a safety inventory quantity ss based on the lead time T i and the probability distribution f i of the effective lead time, the safety inventory quantity ss, and a representative value DA of the demand quantity per unit period , and order point calculation unit which cumulative probability of the effective lead time T i is calculated reorder point Q RO based on the limitations lead time L M indicating the minimum of the effective lead time value subsequent exceeding the service rate S It is characterized by having.
In the reorder point calculation device, the order point calculation unit, the safety stock quantity ss, wherein in addition to the demand for the representative value DA and the limit lead time L M, the appearance period demand per unit period is not zero further using a demand frequency F D indicates the probability may be calculated reorder point Q RO.
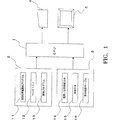
図1は、本発明の実施の形態1である安全在庫量算出装置のシステム構成図である。
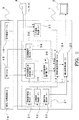
図2は、図1の算出装置における制御ブロック図である。
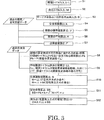
図3は、図1の算出装置にて実行される安全在庫量算出方法の手順を示すフローチャートである。
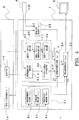
図4は、本発明の実施の形態2である安全在庫量算出装置の制御ブロック図である。
図5は、図4の算出装置にて実行される安全在庫量算出方法の手順を示すフローチャートである。
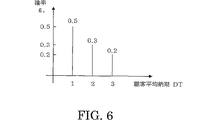
図6は、顧客要求納期の離散確率分布gjの一例を示す説明図である。
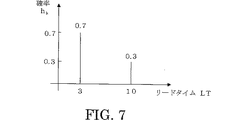
図7は、リードタイムの離散確率分布hkの一例を示す説明図である。
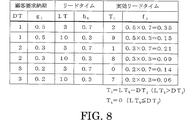
図8は、図6,7の場合における実効リードタイムTiの算出結果を示す表である。
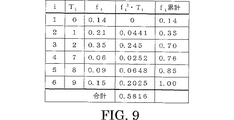
図9は、図8に求めた実効リードタイムTiの離散確率分布fiを用いた各種計算結果を示した表である。FIG. 1 is a system configuration diagram of a safety stock quantity calculation apparatus according to
FIG. 2 is a control block diagram of the calculation apparatus of FIG.
FIG. 3 is a flowchart showing a procedure of a safety stock quantity calculation method executed by the calculation apparatus of FIG.
FIG. 4 is a control block diagram of the safety stock quantity calculating apparatus according to the second embodiment of the present invention.
FIG. 5 is a flowchart showing the procedure of the safe stock quantity calculation method executed by the calculation apparatus of FIG.
FIG. 6 is an explanatory diagram showing an example of the discrete probability distribution g j of the customer request delivery date.
FIG. 7 is an explanatory diagram showing an example of a discrete probability distribution h k of lead times.
Figure 8 is a table showing the calculation results of the effective lead time T i in the case of FIGS.
FIG. 9 is a table showing various calculation results using the discrete probability distribution f i of the effective lead time T i obtained in FIG.
(実施の形態1)
以下、本発明の実施の形態を図面に基づいて詳細に説明する。図1は本発明の実施の形態1である安全在庫量算出装置のシステム構成図である。図2は図1の算出装置における制御ブロック図、図3は図1の算出装置にて実行される安全在庫量算出方法の手順を示すフローチャートである。
図1に示すように、当該算出装置は、CPU1とメモリ2、記憶装置3、入力装置(入力手段)4及び出力装置(出力手段)5をバス6にて接続した構成となっている。メモリ2には、安全在庫量算出プログラム11、ワークエリア12及び制御プログラム13が格納されている。安全在庫量算出プログラム11はCPU1にて実行され、図3に示した手順に従って安全在庫量を算出する。安全在庫量算出プログラム11は、ERPパッケージ中に内在又は外部プログラムとしてアドオンされ、コンピュータにて読み取り可能な記憶媒体上に格納され、駆動装置を介してメモリ2に読み込まれ実行される。なお、安全在庫量算出プログラム11は、ERPパッケージとは独立して使用することも可能である。
ワークエリア12は、安全在庫量算出プログラム11に基づく処理の途中結果を格納する作業領域である。制御プログラム13はシステム全体を統御するプログラムであり、記憶装置3や入力装置4、出力装置5を制御し、安全在庫量算出プログラム11を実行する際に、それらを統括的に制御する。
記憶装置3には、販売/出荷実績データベース(以下、データベースはDBと略記する)14、受注DB15及び安全係数テーブル16が格納されている。販売/出荷実績DB14には、ある物品(製品・商品)やその構成物(部品・材料等)(以下、物品等と称する)に関する過去の販売量及び出荷量の実績が格納される。受注DB15には、各物品等について過去の受注実績が格納される。安全係数テーブル16には、サービス率Sと安全係数kの相関関係を示すデータ又は関数が格納される。
入力装置4はキーボードやマウス等であり、各種データの入力や、CPU1に対する指示を行うための装置である。出力装置5はディスプレイやプリンタ等であり、算出された安全在庫量や発注点、発注量等を表示するための装置である。なお、当該算出装置を、パーソナルコンピュータ及びその周辺機器類によって実現することも可能である。
次に、CPU1は、図2に示すような機能手段を有しており、大別すると、基本データ演算部21、補正データ演算部22、安全係数算出部23、安全在庫量算出部24、発注点等算出部25によって構成されている。CPU1には、入力装置4を介して、リードタイムLや発注サイクルM、サービス率(又は許容欠品率)S等が入力される。なお、リードタイムLとしては、物品等の発注から入荷までの期間を示す調達リードタイムのみならず、調達リードタイムに部品の組立や加工期間を示す加工・組立リードタイム等を加えた期間、その他、運搬、検査等を含めた期間など、物品等の性質によって種々の形態を採知し得る。
基本データ演算部21は、販売/出荷実績DB14のデータに基づいて、需要の標準偏差σ、需要の平均値A、出荷頻度Fを算出する。需要の標準偏差σは需要標準偏差算出部31、需要の平均値Aは需要平均値算出部32、出荷頻度Fは出荷頻度算出部33にてそれぞれ算出される。なお、標準偏差σとして、データの最大値と最小値の差に、試料数によって決まる所定係数(1/d2)を乗じて算出した近似値を用いることもできる。
補正データ演算部22は、入力データや受注DB15のデータに基づいて、従来の安全係数算出方法では使用されていない補正データを算出する。すなわち、そこでは、顧客の要求納期がその製品に使用される部品・材料のリードタイムLよりも短い注文である確率(以下、短納期確率と略記する)Pbが短納期確率算出部34にて算出される。また、リードタイムLが顧客要求納期を超過した分について、リードタイムLと顧客要求納期との差の代表値LLとして、両者の差の平均値である平均リードタイム超過日数(以下、平均納期超過日数と略記する)が平均納期超過日数算出部35にて算出される。
さらに、在庫調整期間Nが在庫調整期間補正部36にて算出される。在庫調整期間Nは、前述のように従来の計算方式では、発注点方式の場合はリードタイムL、定期発注方式の場合はリードタイムLに発注サイクルMを加えた期間となる。これに対し本発明による方式では、在庫調整期間Nを先に算出した平均納期超過日数LLによって補正し、その値をNとして使用する。すなわち、在庫調整期間Nとして、定量発注方式の場合には平均納期超過日数LL(N=LL)を用い、定期発注方式の場合には平均納期超過日数LLに発注サイクルMを加えた値(N=LL+M)を用いる。
安全係数算出部23では、入力装置4を介して入力されたサービス率Sに基づき、安全係数テーブル16を参照して安全係数kを算出する。前述のように、サービス率Sとして95%を入力すると、安全係数算出部23では正規分布表に従って作成された安全係数テーブル16からk=1.67を算出する。なお、本発明は、需要量が正規分布とならない場合にも適用可能であり、その際には、例えば、需要量の分布関数を求め、そこから所望のサービス率Sを満たす安全係数kを求めるなどの処理を行う。
安全在庫量算出部24では、基本データ演算部21や補正データ演算部22にて算出されたデータと、安全係数算出部23にて算出された安全係数kに基づいて安全在庫量SSを算出する。ここでは、安全在庫量SSは次式によって計算される。
![]()
このような算出装置では、次のような手順で安全在庫量SSが算出され、発注点O等が求められる。図3に示すように、ここではまずステップS1〜S3にて、リードタイムL、発注サイクルM、サービス率(又は許容欠品率)Sを入力する。リードタイムLは発注から納品までの期間であり、例えば10日などと入力する。発注サイクルMは、定期発注方式を採る場合の発注間隔であり、これも例えば30日などと入力する。サービス率Sは前述のように95%などと入力する。
次に、CPU1はこれらの値が入力されると、制御プログラム13に従って、安全在庫量算出プログラム11にアクセスし、これに基づいて各種基本データが算出される。安全在庫量算出プログラム11は、安全在庫量SSを算出するために、CPU(コンピュータ)1を、需要標準偏差算出部31、短納期確率算出部34、平均納期超過日数算出部35、在庫調整期間補正部36、安全在庫量算出部24として機能させる。
CPU1ではまず、ステップS3〜S7にて、安全係数k、需要の標準偏差σ、需要の平均値A、出荷頻度Fが算出される。これらの値は、ワークエリア12に格納され、その後の演算に使用される。
安全係数kは、前述のように、安全係数算出部23によって、入力されたサービス率Sから安全係数テーブル16を参照して算出される。需要の標準偏差σ、需要の平均値A、出荷頻度Fはそれぞれ、販売/出荷実績DB14のデータに基づいて、基本データ演算部21にて算出される。なお、これらの値(k,σ,A,F)を入力装置4から直接入力することも可能である。
基本データを算出した後、CPU1では各種補正データが算出される。まず、ステップS8にて、短納期確率Pbが短納期確率算出部34によって算出される。短納期確率Pbは物品等の調達が間に合わない可能性を示しており、「顧客の要求納期<リードタイムL」となる場合が、過去の受注データによれば全体の30%である場合には、Pb=0.3のように算出される。この短納期確率Pbは、ユーザーの経験値を入力装置4から直接入力しても良い。例えば、システム立ち上げ当初のように受注DB15のデータ数が少ない場合には、確率を正確に算出できないため手動入力を行う。この場合、受注データが徐々に蓄積した段階で、適宜自動計算に切り替えることもできる。なお、短納期確率Pbに対し、注文1件当たりの注文数量によって重み付けを行っても良い。例えば、注文数量100個を基準とし、90個の短納期注文が2回、110個の短納期注文が3回あった場合には、0.92×1.13=1.08をPBに乗ずる。
次にステップS9に進み、平均納期超過日数LLが平均納期超過日数算出部35によって算出される。平均納期超過日数LLは、安全在庫にて面倒を見なければならない日数の平均を示しており、次のステップS10にて在庫調整期間Nの算出に使用される。平均納期超過日数LLもまた受注DB15のデータによって算出されるが、ユーザーの経験値を入力装置4から直接入力させることも可能である。
ステップS10では、在庫調整期間Nが在庫調整期間補正部36にて算出される。この際、発注方式によってNの算出式が異なるのは前述のとおりであり、これも入力装置4から直接入力させることも可能である。在庫調整期間Nを算出した後ステップS11に進み、安全在庫量算出部24によって前述の[式2]を用いて安全在庫量SSが算出される。なお、需要の標準偏差σは、個々のデータ値と平均値との偏差の平方を取り、その平均値の平方根によってσを求める方法に代えて、個々のデータ値と予測値との差の平方の平均の平方根を用いても良い。
ところで、[式2]中におけるF(出荷頻度)の乗算は省略することも可能であるが、出荷頻度Fの適用の有無に際し、需要の平均値A及び標準偏差σの算出方式を変更する必要がある。すなわち、出荷頻度Fを使用する場合には、データ中、出荷0の日はデータとして「0」を用いるのではなく、そのデータはないものとしてAやσの計算を行う。つまり、ここで言う需要の平均値A及び標準偏差σには、出荷頻度Fの適用の有無により、データの取り扱いを異にする異なった値が採用される。
ここで、「式2」は、[式1]に対し、▲1▼Nの算出に際し、リードタイムLに代えて平均納期超過日数LLが使用される点、▲2▼短納期確率Pbが乗じられている点が異なっている。まず▲1▼の点に関し、従来の計算方式では、現時点からの調達期間に基づいて安全在庫量が算出される。これに対し、本発明による方式では、平均納期超過日数LL、つまり安全在庫による実際の対応期間を用いてその算出が行われる。例えば、顧客の平均要求納期が7日で在庫調整期間が10日の場合、現実には平均3日分の安全在庫が必要であるが、従来の方式によれば、10日分の安全在庫を持つ必要がある。すなわち、本発明の方式では、単純にリードタイムLを用いた計算方式よりも現実的な安全在庫量を算出することが可能となり、前述の例で言えば、7日分の在庫を省くことができ、在庫削減によるコストダウンを図ることが可能となる。
一方、▲2▼に関しては、平均納期超過日数LLを用いて求めたNを使用して算出した値にPbを乗じることにより、安全在庫にて対応せざるを得ない場合が実際にはどの程度あるのかを加味して安全在庫量を設定することができる。この場合、「顧客の要求納期<リードタイムL」となることが皆無の場合には、Pb=0→SS=0となり、安全在庫を持つ必要はない。また、常に「顧客の要求納期<リードタイムL」である場合には、Pb=1.0となり、平均納期超過日数LLに対応できる安全在庫を持つ必要がある。そして、その中間、例えばPb=0.3などの場合には、その30%の事態に対応できる安全在庫量を持てば良く、従来の方式に比してPB(≦1.0)を乗じた分、安全在庫量を減じることができる。
このように本発明による方式では、リードタイムLに代えて平均納期超過日数LLを使用することで、より現実的な安全在庫量の算出が可能となると共に、短納期確率Pbを用いることにより、安全在庫にて対応しなければならないケースの発生に即した安全在庫量を設定することができる。そして、平均納期超過日数LLと短納期確率Pbという実績データを用いた算出方式であるため、未来在庫に基づいて物品等のオーダーを行う場合にも対応可能であり、ERPパッケージなどにおいても物品等の安全在庫量を適切に設定することが可能となる。
このようにして安全在庫量SSを求めた後、ステップS12に進み、発注点等算出部25にて発注点Oや発注量が算出される。この際、発注点O等の演算では安全在庫量SSが使用されるため、本発明による方式では、より正確で無駄のない発注点等を得ることができる。算出された発注点O等は、安全在庫量SSと共に出力装置5に表示され、ユーザーはそれを参照して物品等の発注指示を行う。
なお、前述の実施の形態では短納期確率Pbを用いて安全在庫量SSを求める例を示したが、短納期確率Pbを用いることなく、リードタイムLが顧客要求納期を超過した場合の需要に基づいて標準偏差σを算出して安全在庫量SSを算出することもできる。この場合には、実際にリードタイムLが顧客要求納期を超過した場合のデータを用いて、あるいはそのデータのみによって標準偏差σを求めているため、短納期確率Pbは求める必要がなく、[式2]からPbを省いた形の式を用いてSSを算出できる。
この際、需要標準偏差算出部31は、リードタイムLが顧客要求納期を超過した場合の需要データのみによって標準偏差σを算出する。また、安全在庫量算出部24は、ここで算出された標準偏差σと、補正された在庫調整期間N、出荷頻度F及び安全係数kに基づいて安全在庫量SSを算出する。
(実施の形態2)
次に、本発明の実施の形態2である安全在庫量算出装置について説明する。図4は本発明の実施の形態2である安全在庫量算出装置の制御ブロック図、図5は図4の算出装置にて実行される安全在庫量算出方法の手順を示すフローチャートである。なお、実施の形態1と同様の部分、手段等には同一の符号を使用し、その説明は省略する。
実施の形態2の算出装置及び算出方法は、実施の形態1をより一般的な形に展開したものであり、実施の形態1は、実施の形態2において条件を特定した言わば特殊解にに相当する。当該算出装置も実施の形態1の算出装置と同様に、CPU1とメモリ2、記憶装置3、入力装置4及び出力装置5をバス6にて接続した構成となっている。CPU1には、入力装置4を介して、許容欠品率α(又はサービス率S)や発注サイクルM等が入力される。CPU1は、図4に示すような機能手段を有しており、基本データ演算部21、演算データ算出部26、安全係数算出部23、安全在庫量算出部24、発注点等算出部25を備えている。
基本データ演算部21は、販売/出荷実績DB14のデータに基づいて、単位期間当たりの需要量の標準偏差σD、単位期間当たりの需要量の平均値(代表値)DA、需要頻度FDを算出する。需要の標準偏差σDは需要標準偏差算出部41、需要の平均値DAは需要平均値算出部42にて算出され、そこでは単位期間として、例えば、1日,1ヶ月等の期間が設定される。
需要頻度FDは単位期間当たりの需要量がゼロでない期間の出現確率であり、需要頻度算出部43にて算出される。需要頻度FDは、出荷量で見るときは出荷頻度Fとなり、出荷量がゼロでない日の出現確率がそれに相当する。また、生産量で見るときは、需要頻度FDは生産頻度となり、生産量がゼロでない日の出現確率がそれに相当する。なお、FD=1と置き、需要量がゼロとなる期間も含めてDAやσDの算出を行っても良い。
演算データ算出部26は、入力データや受注DB15のデータに基づいて、各種演算データを算出する。演算データ算出部26にはまず、顧客の要求納期の離散確率分布を算出する納期確率分布算出部44が設けられている。顧客が注文時に要求する納期は当日から数ヶ月,数年先まで種々の期間があるが、ある物品等について言えば、ある程度のバラツキの中に収まる。そこで、在庫管理の対象となる物品等の顧客要求納期DTjとその要求回数から、その出現確率をgjで規定される離散確率分布の形で表すことができる。図6は、顧客要求納期の離散確率分布gjの一例を示す説明図である。ここでは、顧客要求納期DTが1日である確率が0.5、2日である確率が0.3、3日である確率が0.2の場合を示しており、確率gjの総和は1となっている。
演算データ算出部26にはまた、リードタイムの離散確率分布hkを算出するリードタイム確率分布算出部(リードタイム発生確率算出部)45が設けられている。リードタイムは、物が必要になることが分かって注文や生産指示等を出した後、当該物が納品されたり生産完了したりして出荷あるいは使用可能となるまでの期間の長さを示しており、物を購買する場合は調達期間、生産する場合は生産リードタイムがそれに該当する。
リードタイムもまた種々の期間があるが、ある物品等について言えば、ある程度のバラツキの中に収まる。そこで、在庫管理の対象となる物品等のリードタイムLTkの発生頻度から、その発生確率をhkで規定される離散確率分布の形で表すことができる。図7は、リードタイムの離散確率分布hkの一例を示す説明図である。ここでは、リードタイムLTが3日である確率が0.7、10日である確率が0.3の場合を示しており、確率hkの総和は1となっている。
演算データ算出部26にはさらに、リードタイムLTkが顧客要求納期DTjから実効リードタイムTiを求める実効リードタイム算出部46が設けられている。実効リードタイムTiは、物が発注点を割ることを予測して注文や生産指示等を出した後、当該物が納品されたり生産完了したりして出荷あるいは使用可能となった時点が、発注点を割ることが予測された時点からどれぐらいの期間が経過したのかを示す値である。
ここでは、リードタイムLTkが顧客要求納期DTjよりも長い場合には、その差が実効リードタイムTiとなる。一方、リードタイムLTkが顧客要求納期DTjを超えない場合には、顧客の要求納期よりもリードタイムが短く、常に顧客要求納期に対応できる状態を示しており、実効リードタイムTiは0となる。すなわち、LTk>DTjの場合は、Ti=LTk−DTjとなり、LTk≦DTjの場合はTi=0となり、実効リードタイムTiは納期超過日数を示すことになる。なお、実施の形態1の平均納期超過日数LLは、実効リードタイムTiの平均値に相当する。
このように実効リードタイムTiはLTkとDTjから求められ、LTk,DTjはそれぞれ離散確率分布hkと離散確率分布gjに従うことから、実効リードタイムTiもまたfiで規定される離散確率分布に従う。そこで、演算データ算出部26には、この実効リードタイムTiの離散確率分布fiを算出する実効リードタイム確率分布算出部47が設けられている。離散確率分布fiは、実効リードタイムTiごとに、要求納期の離散確率分布gjとリードタイムの離散分布確率hkを乗じて算出される。
図8は、図6,7の場合における実効リードタイムTiの算出結果を示す表である。実効リードタイムTiは、1〜3日のDTと、3,10日のLTとの組み合わせにより6通りの場合が生じる。そそて、各実効リードタイムTiについて、それぞれhkとgjを乗じることにより、実効リードタイムTiの離散確率分布fiが求められる。すなわち、離散確率分布fiは次の式で表すことができる。
加えて、演算データ算出部26には、実効リードタイムTiと許容欠品率αに基づき、限界リードタイムLMを求める算出する限界リードタイム算出部48が設けられている。限界リードタイムLMは、実効リードタイムTiの発生確率fiの累積値が1−α(=サービス率S)を超えた以後の最小の実効リードタイムTiの値である。すなわち、限界リードタイムLMは、次式のように表すことができる。
このような累積密度関数の逆関数は、需要量の出現確率から需要量を導くものであり、v(α)は、出現確率がαとなる需要量を示す。従って、αとして許容欠品率を用いれば、許容欠品率がαとなるような需要量が導かれる。一方、安全係数算出部23は、販売/出荷実績データに基づき、需要量の標準偏差σ0を算出する。そして、累積密度関数v(α)をこの標準偏差σ0にて除すことにより、許容欠品率αとなる需要量が標準偏差σ0の何倍に相当するかが求められ、これが安全係数kとなる(k=v(α)/σ0)。なお、許容欠品率αに代えてサービス率S(S=1−α)を用いることも可能である。
安全在庫量算出部24では、基本データ演算部21や演算データ算出部26にて算出されたデータと、安全係数算出部23にて算出された安全係数kに基づいて安全在庫量ssを算出する。ここでは、安全在庫量ssは次式によって計算される。
![]()
発注点等算出部25では、安全在庫量算出部24にて算出された安全在庫量ssに基づき、発注点や発注量を算出する。定量発注方式の場合には、発注点等算出部25は発注点算出部として機能し、そこで発注点QROが次式により算出される。
![]()
このような算出装置では、次のような手順で安全在庫量ssが算出され、発注点O等が求められる。図5に示すように、ここではまずステップS11,S12にて、許容欠品率α(又はサービス率S)と発注サイクルMを入力する。発注サイクルMは、定期発注方式を採る場合の発注間隔であり、例えば30日などと入力するが、定量発注方式の場合には入力は不要である。許容欠品率αは5%などと入力する。
CPU1はこれらの値が入力されると、制御プログラム13に従って、安全在庫量算出プログラム11にアクセスし、これに基づいて各種基本データが算出される。安全在庫量算出プログラム11は、安全在庫量ssの算出を行うために、CPU1を、納期確率分布算出部44、リードタイム確率分布算出部45、実効リードタイム算出部46、実効リードタイム確率分布算出部47、安全在庫量算出部24として機能させる。
CPU1ではまず、ステップS13〜S16にて、安全係数k、単位期間当たりの需要量の標準偏差σD、単位期間当たりの需要量の平均値DA、需要頻度FDが算出される。これらの値は、ワークエリア12に格納され、その後の演算に使用される。
安全係数kは、前述のように、安全係数算出部23によって、累積密度関数v(α)と標準偏差σ0から求められる(k=v(α)/σ0)。なお、実施の形態1のように安全係数テーブルを参照しても良い。単位期間当たりの需要量の標準偏差σD、単位期間当たりの需要量の平均値DA、需要頻度FDはそれぞれ、販売/出荷実績DB14のデータに基づいて、基本データ演算部21にて算出される。
基本データを算出した後、CPU1はステップS17,S18にて、受注DB15から顧客要求納期DTjとリードタイムLTkを読み込む。そして、これらの値を用いて各種演算データが算出される。まず、ステップS19にて、図6に一れを示したような、顧客要求納期の離散確率分布gjが算出される。また、ステップS20にて、図7に示したような、リードタイムの離散確率分布hkが算出される。
次に、CPU1はステップS21に進み、要求納期の離散確率分布gjとリードタイムの離散分布確率hkを用いて実効リードタイムTiを算出する。前述のように、LTk>DTjの場合はTi=LTk−DTjとなり、LTk≦DTjの場合はTi=0となる。そして、要求納期の離散確率分布gj、リードタイムの離散分布確率hk及び実効リードタイムTiから、[式3]を用いて実効リードタイムTiの離散確率分布fiが求められる(ステップS22)
このようにして、実効リードタイムTiやその離散確率分布fiを求めた後、離散確率分布fiと許容欠品率αを用いて、[式4]に示すような限界リードタイムLMが算出される(ステップS23)。そして、ステップS24に進み、安全在庫量算出部24によって前述の[式5]に基づき安全在庫量ssが算出される。図9は、図8に求めた実効リードタイムTiの離散確率分布fiを用いて、[式5]の平方根内にある(fi 2・Ti)を計算結果と、離散確率分布fiの累計を示した表である。
まず、限界リードタイムLMに関しては、図9の例では、許容欠品率α=5%とすると、fiの累計が1−α=0.95を超えた以後の最小の実効リードタイムTiは9であり、限界リードタイムLM=9となる。次に、この例における安全在庫量ssは、需要頻度FD=0.5,安全係数k=1.65,単位期間当たりの需要量の標準偏差σD=30と算出された場合、これらを[式5]に代入して、
ss=1.65×(0.5×0.5816)1/2×30=26.693 となる。
このようにして安全在庫量ssを求めた後、ステップS25に進み、発注点等算出部25によって前述の[式12]を用いて発注点QROや発注量が算出される。先の例で言えば、単位期間当たりの需要量の平均値DA=100とすると、
QRO=100×9×0.5+26.693=476.693
となる。これらの結果は、許容欠品率αを5%以内とする安全在庫量ssが26.693個であり、それを前述の条件にて維持するには476.693個が発注点となる。つまり、在庫が476個を割ったときに当該製品を発注すれば良いことが分かる。
これに対して、従来の安全在庫量算出方式(式1:ss=k×σ’)によれば、
ss=1.65×(0.5×10)1/2×30=110.69となる。すなわち、[式5]を用いることにより、安全在庫量を約1/4に減らすことができる。また、発注点QROも従来の算出方式では、QRO=10×100+110.69=1110.69となり、[式5]を用いることにより、これも1/2以下となる。
このように、実施の形態2の安全在庫量算出方法及び装置によれば、顧客要求納期の出現確率とリードタイムの発生確率を求めると共に、それらを用いて実効リードタイムの出現確率を求め、実効リードタイムとその出現確率に基づいて安全在庫量を算出する。このため、実施の形態1に比してより一般的な形で未来在庫に基づく在庫管理システムを構築することができる。
一方、前述の場合、要求納期の離散確率分布gjやリードタイムの離散分布確率hkが不明な場合、次式によって安全在庫量ssを求めても良い。
![]()
この[式13]は、[式5]において、(T1=L,f1=M)、(T2=0,f2=1−M)とした場合に相当する。これは、実効リードタイムがLの場合の確率がMで、それ以外の場合は納期よりもリードタイムの方が短い(納期遅れがない)場合である。そして、L=maxTiに代えて、平均リードタイム超過日数LLを用いたものが実施の形態1の[式2]である。すなわち、[式2]や[式13]は、[式5]の特殊解に相当する。
本発明は前記実施の形態に限定されるものではなく、その要旨を逸脱しない範囲で種々変更可能であることは言うまでもない。
例えば、前述の実施の形態で示したPb等の数値や実施の形態2にて示した図6〜図9の例などはあくまでも一例であり、本発明による算出方法・算出装置がそれらに限定されないのは言うまでもない。また、前述の例では、ERPパッケージの一部として本発明の方法が活用される場合を示したが、当該方法・装置を単独で使用することも可能である。
さらに、本発明は「定期発注」「定量発注」以外の発注方式にも適用可能である。例えば、予め在庫の最大量と最小量を設定しておき、発注点(最小量)を割った時点で、そのときの在庫量と最大量との差を発注するような両者の中間的な発注方式など、種々の発注方式に適用できる。
加えて、前述の実施の形態では、リードタイムLと顧客要求納期との差の代表値LLとして、両者の差の算術平均値(相加平均)である平均納期超過日数を用いたが、それに代えて、リードタイムLと顧客要求納期との差の幾何平均値(相乗平均)や調和平均値等の種々の平均値や、中央値(メディアン)や最頻値(モード)、さらに、経験値等を用いることも可能である。同様に、需要の平均値A,DAについても、分布を代表する他の代表値を使用しても良い。すなわち、A,DAの値として、算術平均値のみならず、幾何平均値や調和平均値を用いても良く、平均値に代えて中央値(メディアン)や最頻値(モード)を用いることもできる。また、この場合も経験値を用いることもできる。
また、本発明は、需要量が正規分布とならない場合にも適用可能であり、その際には、例えば、需要量の分布関数を求め、そこから所望のサービス率Sを満たす安全係数kを求めるようにしても良い。
さらに、前述の実施の形態2では、リードタイムLTkの出現確率と顧客要求納期DTjの発生確率を共に離散分布とした例を示したが、何れか一方が連続分布であっても良い。また、リードタイムLTkや顧客要求納期DTjのサンプル日数が多くなる場合には、実効リードタイムTiの組み合わせが膨大となり、離散確率分布fiの算出負担が大きくなるため、適宜代表値を用いて離散確率分布fiを算出しても良い。その際、乱数表等を用いていわゆるモンテカルロシュミレーションを実行させても良い。
一方、前述の実施の形態では、需要の標準偏差(単位期間当たりの需要量の標準偏差)を用いて安全在庫等を算出する例を示したが、標準偏差として、統計学上の標準偏差のみならず、需要の不確実性を表現する他の値を用いることも可能である。例えば、個々の需要と需要の予測値の予測誤差の平方和をn−1(データ個数−1)で割った値の平方根などの値を使用することもできる。(Embodiment 1)
Hereinafter, embodiments of the present invention will be described in detail with reference to the drawings. FIG. 1 is a system configuration diagram of a safety stock quantity calculation apparatus according to
As shown in FIG. 1, the calculation device has a configuration in which a
The
The
The
Next, the
The basic
The correction
Further, the inventory adjustment period N is calculated by the inventory adjustment
The safety
The safety
![]()
In such a calculation device, the safety stock quantity SS is calculated by the following procedure, and the order point O and the like are obtained. As shown in FIG. 3, first, in steps S1 to S3, the lead time L, the ordering cycle M, and the service rate (or allowable shortage rate) S are input. The lead time L is a period from ordering to delivery, and is input as 10 days, for example. The ordering cycle M is an ordering interval when the regular ordering method is adopted, and this is also input, for example, 30 days. The service rate S is input as 95% as described above.
Next, when these values are input, the
First, in step S3 to S7, the
As described above, the safety factor k is calculated by the
After calculating the basic data, the
Next, the process proceeds to step S <b> 9, and the average delivery date excess days LL is calculated by the average delivery date excess days calculation unit 35. The average delivery deadline surplus LL indicates the average number of days that must be taken care of in the safety stock, and is used for calculating the inventory adjustment period N in the next step S10. The average overdelivery days LL is also calculated from the data in the
In step S <b> 10, the inventory adjustment period N is calculated by the inventory adjustment
By the way, multiplication of F (shipment frequency) in [Equation 2] can be omitted, but the calculation method of the average value A and the standard deviation σ needs to be changed when the shipment frequency F is applied. There is. That is, when the shipping frequency F is used, “0” is not used as the data for the date of
Here, “
On the other hand, with regard to (2), how much is actually the case where it is necessary to deal with safety stock by multiplying the value calculated using N obtained using the average overdue days LL by Pb? The safety stock quantity can be set considering whether there is any. In this case, if there is no “customer required delivery date <lead time L”, Pb = 0 → SS = 0, and there is no need to have a safety stock. Further, when “customer required delivery date <lead time L” is satisfied, Pb = 1.0, and it is necessary to have a safety stock that can correspond to the average delivery date exceeding days LL. And in the middle case, for example, Pb = 0.3, it is sufficient to have a safety stock amount that can cope with 30% of the situation, and multiplied by PB (≦ 1.0) compared to the conventional method. Min, safety stock can be reduced.
As described above, in the method according to the present invention, by using the average delivery deadline days LL instead of the lead time L, it becomes possible to calculate a more realistic safety stock quantity, and by using the short delivery probability Pb, It is possible to set a safety stock amount in accordance with the occurrence of a case that must be dealt with by safety stock. And since it is a calculation method using actual data such as the average delivery deadline days LL and the short delivery date probability Pb, it is possible to deal with orders for articles based on future inventory, etc. It is possible to appropriately set the safety stock amount.
After obtaining the safety stock quantity SS in this way, the process proceeds to step S12, and the order point O and the order quantity are calculated by the order
In the above-described embodiment, an example in which the safety stock quantity SS is obtained using the short delivery date probability Pb has been shown. However, the demand when the lead time L exceeds the customer requested delivery date without using the short delivery date probability Pb is shown. The standard deviation σ can be calculated based on the safety stock amount SS. In this case, since the standard deviation σ is obtained using data when the lead time L actually exceeds the customer requested delivery date or only by the data, the short delivery probability Pb does not need to be obtained. SS can be calculated using an equation in which Pb is omitted from [2].
At this time, the demand standard
(Embodiment 2)
Next, a safety stock quantity calculating apparatus according to the second embodiment of the present invention will be described. FIG. 4 is a control block diagram of the safety stock quantity calculation apparatus according to the second embodiment of the present invention, and FIG. 5 is a flowchart showing the procedure of the safety stock quantity calculation method executed by the calculation apparatus of FIG. In addition, the same code | symbol is used for the part, means, etc. similar to
The calculation device and calculation method of the second embodiment are obtained by expanding the first embodiment into a more general form, and the first embodiment corresponds to a special solution that specifies the conditions in the second embodiment. To do. Similar to the calculation device of the first embodiment, the calculation device has a configuration in which the
Basic
Demand frequency F D is the probability of occurrence of periods demand per unit period is not zero, is calculated by the demand
The calculation
The calculation
The lead time also has various periods, but a certain article or the like falls within a certain degree of variation. Therefore, from the occurrence frequency of the lead time LT k of the article or the like that is subject to inventory management, the occurrence probability can be expressed in the form of a discrete probability distribution defined by h k . FIG. 7 is an explanatory diagram showing an example of a discrete probability distribution h k of lead times. Here, a case is shown where the probability that the lead time LT is 3 days is 0.7, and the probability that the lead time LT is 10 days is 0.3, and the sum of the probabilities h k is 1.
Furthermore the calculation
Here, in case the lead time LT k is longer than the customer request delivery time DT j is, the difference is the effective lead time T i. On the other hand, when the lead time LT k does not exceed the customer requested delivery date DT j , the lead time is shorter than the customer requested delivery date, and the customer requested delivery date is always shown, and the effective lead time T i is 0. It becomes. That is, when LT k > DT j , T i = LT k −DT j , and when LT k ≦ DT j , T i = 0, and the effective lead time T i indicates the number of days overdue. The average delivery time Days Past LL of the first embodiment corresponds to the mean value of the effective lead time T i.
Thus the effective lead time T i is calculated from LT k and DT j, LT k, since according to the DT j each discrete probability distribution h k a discrete probability distribution g j, the effective lead time T i also in f i Follows the specified discrete probability distribution. Therefore, the calculation
Figure 8 is a table showing the calculation results of the effective lead time T i in the case of FIGS. Effective lead time T i is a 1 to 3 day DT, 3, the case of six occurs by a combination of the 10th LT. Su Su and, for each effective lead time T i, by multiplying h k and g j, respectively, the discrete probability distribution f i of the effective lead time T i is determined. That is, the discrete probability distribution f i can be expressed by the following equation.
In addition, the operation
Such an inverse function of the cumulative density function derives the demand amount from the appearance probability of the demand amount, and v (α) indicates the demand amount having the appearance probability α. Therefore, if the allowable shortage rate is used as α, a demand amount such that the allowable shortage rate becomes α is derived. On the other hand, the safety
The safety stock
![]()
The order
![]()
In such a calculation device, the safety stock quantity ss is calculated by the following procedure, and the order point O and the like are obtained. As shown in FIG. 5, first, in steps S11 and S12, an allowable shortage rate α (or service rate S) and an ordering cycle M are input. The ordering cycle M is an ordering interval when the regular ordering method is adopted, and is input as, for example, 30 days. The allowable shortage rate α is input as 5%.
When these values are input, the
In CPU1 First, at step S13 to S16, the safety factor k, the standard deviation sigma D demand amount per unit period, the average value DA of the demand per unit period, the demand frequency F D is calculated. These values are stored in the
As described above, the safety coefficient k is obtained from the cumulative density function v (α) and the standard deviation σ 0 by the safety coefficient calculation unit 23 (k = v (α) / σ 0 ). Note that the safety coefficient table may be referred to as in the first embodiment. Standard deviation sigma D demand amount per unit period, the average value DA of the demand per unit period, the demand frequency F D, respectively, based on the data of the sales /
After calculating the basic data, the
Next, the
After obtaining the effective lead time T i and its discrete probability distribution f i in this way, the limit lead time LM as shown in [Formula 4] is calculated using the discrete probability distribution f i and the allowable shortage rate α. Calculated (step S23). In step S24, the safety stock
First, with regard to limit lead time LM, in the example of FIG. 9, the allowable when shortage ratio alpha = 5% to, f i effective lead time T i minimum the total is subsequently exceeded 1-α = 0.95 for 9 and the limit lead time LM = 9. Next, when the safety stock quantity ss in this example is calculated as demand frequency F D = 0.5, safety coefficient k = 1.65, standard deviation of demand quantity per unit period σ D = 30, Substituting into [Formula 5]
ss = 1.65 × (0.5 × 0.5816) 1/2 × 30 = 26.693
After obtaining the safe stock quantity ss in this way, the process proceeds to step S25, and the order
Q RO = 100 × 9 × 0.5 + 26.693 = 476.693
It becomes. These results show that the safe stock quantity ss with an allowable shortage rate α within 5% is 26.693 pieces, and 476.693 pieces are the order points to maintain it under the above-mentioned conditions. That is, it can be understood that the product should be ordered when the inventory is divided into 476 pieces.
On the other hand, according to the conventional safety stock calculation method (formula 1: ss = k × σ ′),
ss = 1.65 × (0.5 × 10) 1/2 × 30 = 110.69. That is, by using [Formula 5], the safety stock quantity can be reduced to about ¼. Further, in the conventional calculation method, the ordering point Q RO is Q RO = 10 × 100 + 10.69 = 1110.69, and this is also reduced to ½ or less by using [Expression 5].
As described above, according to the safety inventory amount calculation method and apparatus of the second embodiment, the occurrence probability of the customer requested delivery date and the occurrence probability of the lead time are obtained, and the occurrence probability of the effective lead time is obtained using them, and the effective The safety stock quantity is calculated based on the lead time and its appearance probability. Therefore, an inventory management system based on the future inventory can be constructed in a more general form as compared with the first embodiment.
On the other hand, in the above-described case, when the discrete probability distribution g j of the required delivery date and the discrete distribution probability h k of the lead time are unknown, the safety stock quantity ss may be obtained by the following equation.
![]()
This [Formula 13] corresponds to the case where (T 1 = L, f 1 = M) and (T 2 = 0, f 2 = 1-M) in [Formula 5]. This is a case where the probability when the effective lead time is L is M, and in other cases, the lead time is shorter than the delivery date (no delivery time delay). Then, instead of L = maxT i , an expression using the average lead time excess days LL is [Formula 2] of the first embodiment. That is, [Expression 2] and [Expression 13] correspond to the special solution of [Expression 5].
It goes without saying that the present invention is not limited to the above-described embodiment, and various modifications can be made without departing from the scope of the invention.
For example, the numerical values such as Pb shown in the above-described embodiment and the examples of FIGS. 6 to 9 shown in
Furthermore, the present invention can be applied to ordering methods other than “periodic ordering” and “quantitative ordering”. For example, when the maximum quantity and the minimum quantity of inventory are set in advance and the order point (minimum quantity) is divided, an intermediate order between the two is placed, where the difference between the inventory quantity and the maximum quantity at that time is ordered. It can be applied to various ordering systems such as the system.
In addition, in the above-described embodiment, as the representative value LL of the difference between the lead time L and the customer requested delivery date, the average overdue days, which is the arithmetic average value (arithmetic mean) of the difference between the two, is used. Instead, various average values such as geometric mean value (synergistic mean) and harmonic mean value of the difference between lead time L and customer request delivery date, median value (median), mode value (mode), and experience value Etc. can also be used. Similarly, for the average values A and DA of demand, other representative values representing the distribution may be used. That is, as the values of A and DA, not only the arithmetic mean value but also the geometric mean value or the harmonic mean value may be used, and the median value (median) or the mode value (mode) may be used instead of the mean value. it can. Also in this case, experience values can also be used.
The present invention can also be applied to cases where the demand amount does not have a normal distribution. In this case, for example, a distribution function of the demand amount is obtained, and a safety coefficient k satisfying a desired service rate S is obtained therefrom. You may do it.
Furthermore, in the above-described second embodiment, an example in which the appearance probability of the lead time LT k and the occurrence probability of the customer request delivery date DT j are both discrete distributions has been shown, but either one may be a continuous distribution. In addition, when the number of sample days of the lead time LT k and the customer request delivery date DT j increases, the combination of the effective lead times T i becomes enormous and the calculation burden of the discrete probability distribution f i increases. The discrete probability distribution f i may be calculated by using it. At that time, so-called Monte Carlo simulation may be executed using a random number table or the like.
On the other hand, in the above-described embodiment, an example of calculating safety stock etc. using the standard deviation of demand (standard deviation of demand per unit period) has been shown. However, as the standard deviation, only the statistical standard deviation is shown. Rather, other values expressing the uncertainty of demand can be used. For example, it is also possible to use a value such as a square root of a value obtained by dividing the sum of squares of prediction errors between individual demands and demand forecast values by n-1 (number of data-1).
本発明の安全在庫量算出方法によれば、ある物品に対する需要の標準偏差σと、該物品又はその構成物のリードタイムLから算出される在庫調整期間Nと、需要に対するサービス率Sの程度を示す安全係数kに基づいて安全在庫量SSの算出を行う安全在庫量算出方法において、在庫調整期間Nを平均納期超過日数LLにて補正すると共に、短納期確率Pbを用いて安全在庫量SSを算出するので、安全在庫にて対応しなければならないケースの発生に即した現実的な安全在庫量を設定することができる。また、平均納期超過日数LLと短納期確率Pbという実績データを用いて安全在庫量を算出するので、未来在庫に基づいて物品等のオーダーを行う場合にも対応可能であり、ERPパッケージなどにおいても物品等の安全在庫量を適切に設定できる。
また、本発明の安全在庫量算出方法によれば、顧客要求納期の出現確率とリードタイムの発生確率を求めると共に、それらを用いて実効リードタイムの出現確率を求め、実効リードタイムとその出現確率に基づいて安全在庫量を算出するので、より一般的な形で未来在庫に基づく在庫管理システムを構築することができる。また、本発明の安全在庫量算出方法は、実績データを用いて確率を算出する方式であるため、未来在庫に基づいて物品等のオーダーを行う場合にも対応可能であり、ERPパッケージなどにおいても物品等の安全在庫量を適切に設定できる。According to the safety stock quantity calculation method of the present invention, the standard deviation σ of demand for a certain article, the inventory adjustment period N calculated from the lead time L of the article or its component, and the degree of service rate S for demand are calculated. In the safety inventory quantity calculation method for calculating the safety inventory quantity SS based on the indicated safety factor k, the inventory adjustment period N is corrected with the average delivery deadline LL, and the safety inventory quantity SS is calculated using the short delivery date probability Pb. Since the calculation is performed, it is possible to set a realistic safety stock amount in accordance with the occurrence of a case that must be handled by the safety stock. In addition, since the safety stock amount is calculated using the actual data of the average delivery deadline days LL and the short delivery probability Pb, it is possible to deal with the ordering of goods etc. based on the future stock. The safety stock quantity of goods etc. can be set appropriately.
In addition, according to the safety stock quantity calculation method of the present invention, the occurrence probability of the customer requested delivery date and the occurrence probability of the lead time are obtained, and the occurrence probability of the effective lead time is obtained using them, and the effective lead time and the occurrence probability thereof. Therefore, an inventory management system based on future inventory can be constructed in a more general form. In addition, since the safety stock quantity calculation method of the present invention is a method of calculating the probability using the actual data, it can also be used when ordering articles etc. based on the future stock, and even in the ERP package etc. The safety stock quantity of goods etc. can be set appropriately.
【0003】
庫量と発注点を参照して発注を行う場合の安全在庫量を算出する方式であり、未来在庫に基づくシステムには必ずしも適応しない。このため、ERPパッケージのように未来在庫に基づいて在庫管理を行うシステムでは、従来方式による算出値を用いると安全在庫量が過小や過大となるおそれがあり、適正な発注点や発注量を設定するのが難しいという問題があった。そこで、ERPソフトウエア上では、安全在庫量として、精度低下を承知で従来方式の算出値を入力したり、担当者の勘や経験に基づいて適宜修正した値を入力したりしており、システムの能力を十分生かしきれず、その改善が求められていた。
本発明の目的は、未来在庫に基づいて在庫管理を行うシステムに対応した安全在庫量の算出方法及び装置を提供することにある。
発明の開示
本発明の安全在庫量算出方法は、ある物品に対する需要の標準偏差σと、前記物品又はその構成物のリードタイムLから算出される在庫調整期間Nと、需要に対するサービス率Sの程度を示す安全係数kに基づいて安全在庫量SSの算出を行う安全在庫量算出方法であって、前記物品に対する顧客の要求納期が、前記リードタイムLよりも短い期間である確率Pbを算出するステップと、前記リードタイムLが前記顧客要求納期を超過した場合について、前記リードタイムLと前記顧客要求納期との差の代表値LLとして、前記リードタイムLと前記顧客要求納期との差の平均値、中央値、最頻値、経験値及び前記リードタイムLの最大値から前記顧客要求納期の最小値を減じた値の何れかを算出するステップと、前記在庫調整期間Nを前記代表値LL又は前記代表値LLに前記物品の発注サイクルMを加えた値に補正するステップと、前記標準偏差σ、補正された前記在庫調整期間N、前記確率Pb及び前記安全係数kに基づいて安全在庫量SSを算出するステップとを有することを特徴とする。
本発明にあっては、在庫調整期間Nを代表値LLにて補正すると共に、短納期確率Pbを用いて安全在庫量SSを算出するので、安全在庫にて対応しなければならないケースの発生に即した現実的な安全在庫量を設定することができる。また、本発明の安全在庫量算出方法は、代表値LLと短納期確率Pbという実績[0003]
This is a method for calculating the amount of safety stock when placing an order with reference to the warehouse quantity and the ordering point, and is not necessarily applicable to a system based on future inventory. For this reason, in a system that performs inventory management based on future inventory, such as the ERP package, the safety stock amount may be too small or too large when using the calculated value based on the conventional method, and appropriate order points and order quantities are set. There was a problem that it was difficult to do. Therefore, on the ERP software, as the safety stock quantity, the calculated value of the conventional method is input with knowledge of the accuracy drop, or the value appropriately corrected based on the intuition and experience of the person in charge is input. I couldn't make full use of my ability, and I needed to improve it.
An object of the present invention is to provide a safety inventory quantity calculation method and apparatus corresponding to a system that performs inventory management based on future inventory.
DISCLOSURE OF THE INVENTION The safety stock quantity calculation method of the present invention is based on the standard deviation σ of demand for a certain article, the inventory adjustment period N calculated from the lead time L of the article or its component, and the degree of service rate S for demand. A safety stock quantity calculation method for calculating a safety stock quantity SS based on a safety coefficient k indicating a probability Pb that a customer's requested delivery date for the article is shorter than the lead time L And the average value of the difference between the lead time L and the customer requested delivery date as a representative value LL of the difference between the lead time L and the customer requested delivery date when the lead time L exceeds the customer requested delivery date Calculating a median value, a mode value, an experience value, and a value obtained by subtracting the minimum value of the customer request delivery date from the maximum value of the lead time L, and the inventory adjustment period Correcting N to the representative value LL or the value obtained by adding the order cycle M of the article to the representative value LL, the standard deviation σ, the corrected inventory adjustment period N, the probability Pb, and the safety factor k. And calculating a safety stock quantity SS based on the above.
In the present invention, the inventory adjustment period N is corrected with the representative value LL, and the safety stock quantity SS is calculated using the short delivery time probability Pb. A realistic safety stock amount can be set accordingly. In addition, the safety stock calculation method of the present invention has a track record of representative value LL and quick delivery probability Pb.
【0004】
データを用いた算出方式であるため、未来在庫に基づいて物品等のオーダーを行う場合にも対応可能であり、ERPパッケージなどにおいても物品等の安全在庫量を適切に設定できる。
前記安全在庫量算出方法において、前記安全在庫量SSを算出するステップでは、次式によって安全在庫量SSを算出するようにしても良い。
![]()
前記安全在庫量算出方法において、前記在庫調整期間Nを補正するステップでは、定量発注方式の場合には、前記リードタイムLを前記代表値LLに置き換えて在庫調整期間Nを補正し、定期発注方式の場合には、前記リードタイムLを前記代表値LLに発注サイクルMを加えた値に置き換えて在庫調整期間Nを補正するようにしても良い。
また、前記全在庫量算出方法において、補正された前記在庫調整期間Nに出荷頻度Fを乗じても良い。さらに、前記代表値LLとして、前記リードタイムLと前記顧客要求納期との差の平均値を用いても良い。加えて、前記算出方法を将来[0004]
Since this is a calculation method using data, it is possible to deal with orders for articles based on future inventory, and the safety stock quantity of articles can be appropriately set even in an ERP package.
In the safety stock quantity calculation method, the safety stock quantity SS may be calculated by the following equation in the step of calculating the safety stock quantity SS.
![]()
In the safety stock quantity calculating method, in the step of correcting the inventory adjustment period N, in the case of a quantitative order method, the lead time L is replaced with the representative value LL to correct the inventory adjustment period N, and the periodic order method In this case, the inventory adjustment period N may be corrected by replacing the lead time L with a value obtained by adding the ordering cycle M to the representative value LL.
In the total inventory amount calculation method, the corrected inventory adjustment period N may be multiplied by the shipping frequency F. Furthermore, an average value of the difference between the lead time L and the customer request delivery date may be used as the representative value LL. In addition, the calculation method will be
【0005】
の在庫量予測値である未来在庫に基づいて在庫管理を行うシステムに適用しても良い。なお、ここで言う在庫管理とは、物品等の調達活動を伴う生産管理業務をも含む概念である。
本発明の安全在庫量算出装置は、ある物品に対する過去の需要の標準偏差σと、前記物品又はその構成物のリードタイムLから算出される在庫調整期間Nと、需要に対するサービス率Sの程度を示す安全係数kに基づいて安全在庫量SSの算出を行う安全在庫量算出装置であって、前記物品に対する顧客の要求納期が、前記リードタイムLよりも短い期間である確率Pbを算出する短納期確率算出部と、前記リードタイムLが前記顧客要求納期を超過した場合について、前記リードタイムLと前記顧客要求納期との差の代表値LLとして、前記リードタイムLと前記顧客要求納期との差の平均値、中央値、最頻値、経験値及び前記リードタイムLの最大値から前記顧客要求納期の最小値を減じた値の何れかを算出する平均納期超過日数算出部と、前記在庫調整期間Nを前記代表値LL又は前記代表値LLに前記物品の発注サイクルMを加えた値に補正する在庫調整期間補正部と、前記標準偏差σ、補正された前記在庫調整期間N、前記短納期確率Pb及び前記安全係数kに基づいて安全在庫量SSを算出する安全在庫量算出部とを有することを特徴とする。
本発明にあっては、在庫調整期間補正部にて在庫調整期間Nを代表値LLにて補正すると共に、短納期確率算出部にて短納期確率Pbを算出し、これを用いて安全在庫量SSを算出するので、安全在庫にて対応しなければならないケースの発生に即した現実的な安全在庫量を設定することができる。また、本発明の安全在庫量算出装置は、代表値LLと短納期確率Pbという実績データを用いて安全在庫量を算出するため、未来在庫に基づいて物品等のオーダーを行う場合にも対応可能であり、ERPパッケージなどにおいても物品等の安全在庫量を適切に設定できる。
また、本発明の安全在庫量算出装置は、ある物品に対する過去の需要の標準偏差σと、前記物品又はその構成物のリードタイムLから算出される在庫調整期間Nと、需要に対するサービス率Sの程度を示す安全係数kに基づいて安全在庫量SSの算出を行う安全在庫量算出装置であって、前記リードタイムLが前記顧客[0005]
The present invention may be applied to a system that performs inventory management based on the future inventory that is the predicted inventory amount. In addition, the inventory management here is a concept including production management work accompanied by procurement activities for goods and the like.
The safety stock quantity calculation device of the present invention includes a standard deviation σ of a past demand for a certain article, an inventory adjustment period N calculated from the lead time L of the article or its component, and a service rate S for the demand. A safety stock quantity calculation device that calculates a safety stock quantity SS based on a safety factor k shown, wherein a short delivery date for calculating a probability Pb that a customer's requested delivery date for the article is shorter than the lead time L The difference between the lead time L and the customer required delivery date as a representative value LL of the difference between the lead time L and the customer required delivery date when the lead time L exceeds the customer requested delivery date The average overdue days calculation unit that calculates any one of the average value, median value, mode value, experience value, and the maximum value of the lead time L minus the minimum value of the customer requested delivery date An inventory adjustment period correction unit that corrects the inventory adjustment period N to the representative value LL or a value obtained by adding the order cycle M of the article to the representative value LL, the standard deviation σ, and the corrected inventory adjustment period N And a safety stock quantity calculation unit for calculating a safety stock quantity SS based on the short delivery date probability Pb and the safety coefficient k.
In the present invention, the inventory adjustment period correction unit corrects the inventory adjustment period N with the representative value LL, and the short delivery date probability calculation unit calculates the short delivery date probability Pb. Since the SS is calculated, it is possible to set a realistic safety stock amount that matches the occurrence of a case that must be handled by the safety stock. In addition, since the safety stock quantity calculation device according to the present invention calculates the safety stock quantity using the actual data of the representative value LL and the short delivery time probability Pb, it is possible to deal with the case of ordering goods etc. based on the future stock. Thus, the safety stock quantity of articles and the like can be appropriately set even in an ERP package.
In addition, the safety stock quantity calculation device of the present invention includes a standard deviation σ of a past demand for a certain article, an inventory adjustment period N calculated from the lead time L of the article or its component, and a service rate S for the demand. A safety stock quantity calculation device for calculating a safety stock quantity SS based on a safety coefficient k indicating a degree, wherein the lead time L is the customer
【0006】
要求納期を超過した場合の前記物品の需要データに基づいて前記標準偏差σを算出する需要標準偏差算出部と、前記リードタイムLが前記顧客要求納期を超過した場合について、前記リードタイムLと前記顧客要求納期との差の代表値LLとして、前記リードタイムLと前記顧客要求納期との差の平均値、中央値、最頻値、経験値及び前記リードタイムLの最大値から前記顧客要求納期の最小値を減じた値の何れかを算出する平均納期超過日数算出部と、前記在庫調整期間Nを前記代表値LL又は前記代表値LLに前記物品の発注サイクルMを加えた値に補正する在庫調整期間補正部と、前記標準偏差σと、補正された前記在庫調整期間N及び前記安全係数kに基づいて安全在庫量SSを算出する安全在庫量算出部とを有することを特徴とする。
前記安全在庫量算出装置において、前記リードタイムL及び前記サービス率Sを入力する手段と、前記安全在庫量SSを表示する手段をさらに設けても良い。なお、前記代表値LLとして、前記リードタイムLと前記顧客要求納期との差の平均値を用いても良い。また、前記安全在庫量算出装置において、前記安全在庫量SSに、需要の平均値Aと前記代表値LLとを乗じた値を加えて発注点Oを算出する発注点算出部をさらに設けてもい。また、前記安全在庫量算出装置において、前記安全在庫量SSに、前記代表値LLと発注サイクルMとを加えた期間中の前記物品又はその構成物の予定使用量を加え、その値から現在在庫量及び現在の注文残量を減じて発注量O’を算出する発注量算出部をさらに設けることも可能である。
一方、本発明の安全在庫量算出プログラムは、安全在庫量SSの算出を行うために、コンピュータを、ある物品に対する需要に基づき、前記物品需要の標準偏差σを算出する手段、前記物品に対する顧客の要求納期が、前記物品又はその構成物のリードタイムLよりも短い期間である確率Pbを算出する手段、前記リードタイムLが前記顧客要求納期を超過した場合について、前記リードタイムLと前記顧客要求納期との差の代表値LLとして、前記リードタイムLと前記顧客要求納期との差の平均値、中央値、最頻値、経験値及び前記リードタイムLの最大値から前記顧客要求納期の最小値を減じた値の何れかを算出する手段、前記在庫調整期間Nを前記代表値LL又は前記代表値LLに前記物品の発注サイクルMを加えた値に補正する手段、前記標準偏差σ、補正された前記在庫調整期間N、前記確率Pb及び需要に対するサービス率Sの程度を示す安全係数kに基づいて安全在庫量SSを算出する手段、として機能させる。
また、本発明の安全在庫量算出プログラムは、安全在庫量SSの算出を行うために、コンピュータを、ある物品に対する需要に基づき、前記物品需要の標準偏差σを前記物品又はその構成物のリードタイムLが前記顧客要求納期を超過した場合のデータに基づいて算出する手段、前記リードタイムLが前記顧客要求納期を超過した場合について、前記リードタイムLと前記顧客要求納期との差の代表値LLとして、前記リードタイムLと前記顧客要求納期との差の平均値、中央値、最頻値、経験値及び前記リードタイムLの最大値から前記顧客要求納期の最小値を減じた値の何れかを算出する手段、前記在庫調整期間Nを前記代表値LL又は前記代表値LLに前記物品の発注サイクルMを加えた値に補正する手段、前記標準偏差σ、補正された前記在庫調整期間N及び需要に対するサービス率Sの程度を示す安全係数kに基づいて安全在庫量SSを算出する手段、として機能させる。
一方、本発明の発注点算出方法は、前記安全在庫量算出方法によって算出された安全在庫量SSに、需要の平均値Aと前記代表値LLとを乗じた値を加えて発注点Oを算出することを特徴とする。さらに、本発明の発注量算出方法は、前記安全在庫量算出方法によって算出された安全在庫量SSに、前記代表値LLと発[0006]
A demand standard deviation calculating unit that calculates the standard deviation σ based on demand data of the article when the required delivery date is exceeded, and the lead time L and the lead time L when the lead time L exceeds the customer requested delivery date As the representative value LL of the difference from the customer requested delivery date, the customer requested delivery date is calculated from the average value, median value, mode value, experience value and the maximum value of the lead time L of the difference between the lead time L and the customer requested delivery date. The average overdue days calculation unit for calculating one of the values obtained by subtracting the minimum value of the item, and the inventory adjustment period N is corrected to the representative value LL or the representative value LL plus the order cycle M of the article. An inventory adjustment period correction unit; and a safety inventory quantity calculation unit that calculates a safety inventory quantity SS based on the standard deviation σ, the corrected inventory adjustment period N, and the safety coefficient k. .
The safety stock quantity calculating device may further include means for inputting the lead time L and the service rate S and means for displaying the safety stock quantity SS. The average value of the difference between the lead time L and the customer request delivery date may be used as the representative value LL. The safety stock quantity calculation apparatus may further include an order point calculation unit that calculates an order point O by adding a value obtained by multiplying the safety stock quantity SS by the average value A of demand and the representative value LL. . Further, in the safety stock quantity calculation apparatus, the planned use amount of the article or its component during the period obtained by adding the representative value LL and the ordering cycle M is added to the safety stock quantity SS, and the current stock is calculated from the value. It is also possible to further provide an order quantity calculation unit for calculating the order quantity O ′ by reducing the quantity and the current order remaining amount.
On the other hand, in order to calculate the safety stock quantity SS, the safety stock quantity calculation program of the present invention uses a computer to calculate the standard deviation σ of the article demand based on the demand for an article, Means for calculating a probability Pb that the requested delivery date is shorter than the lead time L of the article or its component, and when the lead time L exceeds the customer requested delivery date, the lead time L and the customer request As the representative value LL of the difference with the delivery date, the minimum value of the customer demand delivery date from the average value, median value, mode value, experience value and the maximum value of the lead time L of the difference between the lead time L and the customer demand delivery date. Means for calculating one of the values obtained by subtracting the value, and correcting the inventory adjustment period N to the representative value LL or a value obtained by adding the order cycle M of the article to the representative value LL. The standard deviation sigma, corrected the inventory adjustment period N, means for calculating the safety stock quantity SS based on the safety factor k indicating the degree of service rate S for the probability Pb and demand, to function as a.
In addition, the safety stock quantity calculation program of the present invention uses a computer to calculate the standard stock σ of the demand for goods based on the demand for a certain article in order to calculate the safety stock quantity SS. Means for calculating based on data when L exceeds the customer required delivery date, and representative value LL of the difference between the lead time L and the customer required delivery date when the lead time L exceeds the customer required delivery date Any one of an average value, a median value, a mode value, an experience value, and a value obtained by subtracting the minimum value of the customer request delivery date from the maximum value of the lead time L as the difference between the lead time L and the customer request delivery date. Means for correcting the inventory adjustment period N to the representative value LL or a value obtained by adding the ordering cycle M of the article to the representative value LL, the standard deviation σ, corrected It functions as a means for calculating a safety stock quantity SS based on a safety coefficient k indicating the stock adjustment period N and the degree of service rate S with respect to demand.
On the other hand, the order point calculation method of the present invention calculates the order point O by adding a value obtained by multiplying the safety stock quantity SS calculated by the safety stock quantity calculation method by the average value A of demand and the representative value LL. It is characterized by doing. The order quantity calculation method of the present invention further includes the representative value LL and the safety stock quantity SS calculated by the safety stock quantity calculation method.
【0010】
記実効リードタイムの出現確率に基づいて安全在庫量ssを算出する手段、として機能させる。
また、本発明の他の安全在庫量算出プログラムは、ある物品の安全在庫量ssの算出を行うために、コンピュータを、顧客要求納期とその頻度から納期ごとにその出現確率を算出し、顧客要求納期の確率分布gjを作成する手段、前記物品又はその構成物のリードタイムの発生確率を算出し、リードタイムの確率分布hkを作成する手段、前記顧客要求納期と前記リードタイムから、前記物品が発注点を割ることを予測して発注を行った後、当該物品が提供可能となった時点と、前記発注点を割ることが予測された時点との間の期間を示す実効リードタイムTiを算出する手段、前記顧客要求納期の確率分布gjと前記リードタイムの分布確率hkに基づいて、前記実効リードタイムTiごとにその出現確率を算出し、実効リードタイムの確率分布fiを作成する手段、前記物品に対する単位期間当たりの需要量の標準偏差σDと、需要に対するサービス率Sの程度を示す安全係数kと、前記実効リードタイムTi及び前記実効リードタイムの確率分布fiとに基づいて安全在庫量ssを算出する手段、として機能させる。
本発明の他の発注点算出方法は、前記安全在庫量算出方法によって算出された安全在庫量ssと、単位期間当たりの需要量の平均値、中央値、最頻値及び経験値のうちから選択される代表値DAと、前記実効リードタイムTiの累積確率が前記サービス率Sを超えた以後の最小の実効リードタイム値を示す限界リードタイムLMに基づいて発注点QROを算出することを特徴とする。この場合、前記安全在庫量ss、前記需要量の代表値DA及び前記限界リードタイムLMに加えて、単位期間当たりの需要量がゼロでない期間の出現確率を示す需要頻度FDをさらに用いて発注点QROを算出するようにしても良い。
本発明の他の発注点算出装置は、ある物品に対する顧客要求納期とその頻度から納期ごとにその出現確率を算出する納期出現確率算出部と、前記物品又はその構成物のリードタイムの発生確率を算出するリードタイム発生確率算出部と、前記顧客要求納期と前記リードタイムから、前記物品が発注点を割ることを予測して発注を行った後、当該物品が提供可能となった時点と、前記発注点を割ることが予測された時点との間の期間を示す実効リードタイムTiを算出する実効リー[0010]
It functions as a means for calculating the safety stock quantity ss based on the appearance probability of the effective lead time.
Further, another safety stock quantity calculation program of the present invention calculates a probability of appearance for each delivery date from a customer demand delivery date and its frequency in order to calculate a safety stock quantity ss of a certain article, From the means for creating a delivery probability distribution g j , calculating the lead time probability of the article or its component, and creating the lead time probability distribution h k, from the customer requested delivery date and the lead time, An effective lead time T indicating a period between the time when the article can be provided and the time when the article is predicted to be divided after the article is predicted to be divided into order points. means for calculating a i, based on the distribution probability h k of the lead time and the probability distribution g j of the customer request delivery time, to calculate the probability of occurrence for each of the effective lead time T i, the effective lead time Means for creating a probability distribution f i, and the standard deviation sigma D demand per unit period for the article, and a safety coefficient k indicating the degree of service rate S for demand, the effective lead time T i and the effective lead time means for calculating the safety stock quantity ss based on the probability distribution f i of, to function as a.
Another order point calculation method of the present invention is selected from the safety stock amount ss calculated by the safety stock amount calculation method, and the average value, median value, mode value, and experience value of the demand amount per unit period. a representative value DA is, the cumulative probability of the effective lead time T i is calculated reorder point Q RO based on the limit lead time L M indicating the minimum of the effective lead time value subsequent exceeding the service rate S It is characterized by. In this case, the safety stock quantity ss, in addition to the representative values DA and the limit lead time L M of the demand, further using a demand frequency F D indicating the probability of occurrence of periods demand per unit period is not zero The order point QRO may be calculated.
Another order point calculation device according to the present invention includes a delivery date appearance probability calculation unit for calculating an appearance probability for each delivery date from a customer requested delivery date and a frequency thereof for an article, and an occurrence probability of a lead time of the article or its component. A lead time occurrence probability calculating unit to calculate, and from the customer request delivery date and the lead time, after predicting that the article will divide the order point, and placing the order, the article can be provided; and An effective lead time T i for calculating an effective lead time T i indicating a period between when the order point is predicted to be divided.
【0011】
ドタイム算出部と、前記顧客要求納期の出現確率と前記リードタイムの発生に基づいて、前記実効リードタイムTiごとにその出現確率を算出する実効リードタイム出現確率算出部と、前記物品に対する単位期間当たりの需要量の標準偏差σDと、需要に対するサービス率Sの程度を示す安全係数kと、前記実効リードタイムTi及び前記実効リードタイムの出現確率に基づいて安全在庫量ssを算出する安全在庫量算出部と、前記安全在庫量ssと、単位期間当たりの需要量の平均値、中央値、最頻値及び経験値のうちから選択される代表値DAと、前記実効リードタイムTiの累積確率が前記サービス率Sを超えた以後の最小の実効リードタイム値を示す限界リードタイムLMとに基づいて発注点QROを算出する発注点算出部とを有することを特徴とする。
また、本発明の他の発注点算出装置は、ある物品に対する顧客要求納期とその頻度から納期ごとにその出現確率を算出し、顧客要求納期の確率分布gjを作成する納期確率分布算出部と、前記物品又はその構成物のリードタイムの発生確率を算出し、リードタイムの確率分布hkを作成するリードタイム確率分布算出部と、前記顧客要求納期と前記リードタイムから、前記物品が発注点を割ることを予測して発注を行った後、当該物品が提供可能となった時点と、前記発注点を割ることが予測された時点との間の期間を示す実効リードタイムTiを算出する実効リードタイム算出部と、前記顧客要求納期の確率分布gjと前記リードタイムの分布確率hkに基づいて、前記実効リードタイムTiごとにその出現確率を算出し、実効リードタイムの確率分布fiを作成する実効リードタイム確率分布算出部と、ある物品に対する単位期間当たりの需要量の標準偏差σDと、需要に対するサービス率Sの程度を示す安全係数kと、前記実効リードタイムTi及び前記実効リードタイムの確率分布fiとに基づいて安全在庫量ssを算出する安全在庫量算出部と、前記安全在庫量ssと、単位期間当たりの需要量の平均値、中央値、最頻値及び経験値のうちから選択される代表値DAと、前記実効リードタイムTiの累積確率が前記サービス率Sを超えた以後の最小の実効リードタイム値を示す限界リードタイムLMとに基づいて発注点QROを算出する発注点算出部とを有することを特徴とする。
前記発注点算出装置において、前記発注点算出部は、前記安全在庫量ss、前記需要量の代表値DA及び前記限界リードタイムLMに加えて、単位期間当たりの需要量がゼロでない期間の出現確率を示す需要頻度FDをさらに用いて発注点QROを算出するようにしても良い。[0011]
And Dotaimu calculator, on the basis the occurrence probability of the customer request delivery time to the occurrence of the lead time, the effective lead time occurrence probability calculation unit for calculating the occurrence probability for each of the effective lead time T i, the unit periods for the article Safety for calculating the safety stock quantity ss based on the standard deviation σ D of the per-demand quantity, the safety coefficient k indicating the degree of the service rate S with respect to the demand, the effective lead time Ti, and the appearance probability of the effective lead time a stock amount calculation unit, and the safety stock quantity ss, demand for the average value per unit time, the median, and the representative value DA selected from among the most frequent and experience, the effective lead time T i the order point calculation unit cumulative probability to calculate the reorder point Q RO based on the limitations lead time L M indicating the minimum of the effective lead time value subsequent exceeding the service rate S Characterized in that it.
Another order point calculation device of the present invention includes a delivery date probability distribution calculating unit that calculates a probability of appearance for each delivery date from a customer requested delivery date and a frequency thereof for a certain article and creates a probability distribution g j of the customer requested delivery date. A lead time probability distribution calculating unit for calculating a lead time probability of the article or its component and creating a lead time probability distribution h k , and from the customer requested delivery date and the lead time, the article is an order point. after an order in anticipation of dividing, calculates the time when the article becomes possible to provide, the effective lead time T i indicating a period between the time when dividing the order point is predicted and the effective lead time calculation unit, on the basis of the probability distribution g j of customer demand delivery to distribution probability h k of the lead time, to calculate the probability of occurrence for each of the effective lead time T i, the effective lead The effective lead time probability distribution calculating unit for creating a probability distribution f i Im, and the standard deviation sigma D demand per unit period for certain articles, and a safety coefficient k indicating the degree of service rate S for demand, the effective A safety inventory quantity ss for calculating a safety inventory quantity ss based on the lead time T i and the probability distribution f i of the effective lead time; the safety inventory quantity ss; an average value of demand quantity per unit period; value, mode value and a representative value DA chosen among experience, the effective lead time T i limit lead time L the cumulative probability exhibit minimal effective lead time value subsequent exceeding the service rate S of And an order point calculation unit for calculating an order point QRO based on M.
In the reorder point calculation device, the order point calculation unit, the safety stock quantity ss, wherein in addition to the demand for the representative value DA and the limit lead time L M, the appearance period demand per unit period is not zero further using a demand frequency F D indicates the probability may be calculated reorder point Q RO.
Claims (30)
前記物品に対する顧客の要求納期が、前記リードタイムLよりも短い期間である確率Pbを算出するステップと、
前記リードタイムLが前記顧客要求納期を超過した場合について、前記リードタイムLと前記顧客要求納期との差の代表値LLを算出するステップと、
前記代表値LLを用いて前記在庫調整期間Nを補正するステップと、
前記標準偏差σ、補正された前記在庫調整期間N、前記確率Pb及び前記安全係数kに基づいて安全在庫量SSを算出するステップとを有することを特徴とする安全在庫量算出方法。Based on the standard deviation σ of demand for a certain item, the inventory adjustment period N calculated from the lead time L of the item or its component, and the safety factor k indicating the degree of the service rate S for the demand, A safety inventory calculation method for calculating,
Calculating a probability Pb that a customer requested delivery date for the article is shorter than the lead time L;
Calculating a representative value LL of a difference between the lead time L and the customer request delivery date when the lead time L exceeds the customer request delivery date;
Correcting the inventory adjustment period N using the representative value LL;
And calculating a safety stock amount SS based on the standard deviation σ, the corrected inventory adjustment period N, the probability Pb, and the safety coefficient k.
前記リードタイムLが前記顧客要求納期を超過した場合の前記物品の需要データに基づいて前記標準偏差σを算出するステップと、
前記リードタイムLが前記顧客要求納期を超過した場合について、前記リードタイムLと前記顧客要求納期との差の代表値LLを算出するステップと、
前記代表値LLを用いて前記在庫調整期間Nを補正するステップと、
前記標準偏差σと、補正された前記在庫調整期間N及び前記安全係数kに基づいて安全在庫量SSを算出するステップとを有することを特徴とする安全在庫量算出方法。Based on the standard deviation σ of demand for a certain item, the inventory adjustment period N calculated from the lead time L of the item or its component, and the safety factor k indicating the degree of the service rate S for the demand, A safety inventory calculation method for calculating,
Calculating the standard deviation σ based on demand data of the article when the lead time L exceeds the customer required delivery date;
Calculating a representative value LL of a difference between the lead time L and the customer request delivery date when the lead time L exceeds the customer request delivery date;
Correcting the inventory adjustment period N using the representative value LL;
A method for calculating a safety stock quantity, comprising: calculating a safety stock quantity SS based on the standard deviation σ, the corrected inventory adjustment period N, and the safety coefficient k.
前記物品に対する顧客の要求納期が、前記リードタイムLよりも短い期間である確率Pbを算出する短納期確率算出部と、
前記リードタイムLが前記顧客要求納期を超過した場合について、前記リードタイムLと前記顧客要求納期との差の代表値LLを算出する平均納期超過日数算出部と、
前記代表値LLを用いて前記在庫調整期間Nを補正する在庫調整期間補正部と、
前記標準偏差σ、補正された前記在庫調整期間N、前記短納期確率Pb及び前記安全係数kに基づいて安全在庫量SSを算出する安全在庫量算出部とを有することを特徴とする安全在庫量算出装置。A safety stock quantity based on a standard deviation σ of a past demand for an article, an inventory adjustment period N calculated from the lead time L of the article or its component, and a safety coefficient k indicating the degree of the service rate S for the demand. A safety stock quantity calculation device for calculating SS,
A short delivery time probability calculation unit that calculates a probability Pb that a requested delivery date of the customer for the article is a period shorter than the lead time L;
When the lead time L exceeds the customer requested delivery date, an average delivery date exceeding days calculation unit that calculates a representative value LL of the difference between the lead time L and the customer requested delivery date;
An inventory adjustment period correction unit that corrects the inventory adjustment period N using the representative value LL;
A safety stock quantity calculating unit that calculates a safety stock quantity SS based on the standard deviation σ, the corrected inventory adjustment period N, the quick delivery probability Pb, and the safety coefficient k. Calculation device.
前記リードタイムLが前記顧客要求納期を超過した場合の前記物品の需要データに基づいて前記標準偏差σを算出する需要標準偏差算出部と、
前記リードタイムLが前記顧客要求納期を超過した場合について、前記リードタイムLと前記顧客要求納期との差の代表値LLを算出する平均納期超過日数算出部と、
前記代表値LLを用いて前記在庫調整期間Nを補正する在庫調整期間補正部と、
前記標準偏差σと、補正された前記在庫調整期間N及び前記安全係数kに基づいて安全在庫量SSを算出する安全在庫量算出部とを有することを特徴とする安全在庫量算出装置。A safety stock quantity based on a standard deviation σ of a past demand for an article, an inventory adjustment period N calculated from the lead time L of the article or its component, and a safety coefficient k indicating the degree of the service rate S for the demand. A safety stock quantity calculation device for calculating SS,
A demand standard deviation calculating unit that calculates the standard deviation σ based on demand data of the article when the lead time L exceeds the customer requested delivery date;
When the lead time L exceeds the customer requested delivery date, an average delivery date exceeding days calculation unit that calculates a representative value LL of the difference between the lead time L and the customer requested delivery date;
An inventory adjustment period correction unit that corrects the inventory adjustment period N using the representative value LL;
A safety stock quantity calculation apparatus comprising: a safety stock quantity calculation unit that calculates a safety stock quantity SS based on the standard deviation σ, the corrected inventory adjustment period N, and the safety coefficient k.
ある物品に対する需要に基づき、前記物品需要の標準偏差σを算出する手段、
前記物品に対する顧客の要求納期が、前記物品又はその構成物のリードタイムLよりも短い期間である確率Pbを算出する手段、
前記リードタイムLが前記顧客要求納期を超過した場合について、前記リードタイムLと前記顧客要求納期との差の代表値LLを算出する手段、
前記代表値LLを用いて在庫調整期間Nを算出する手段、
前記標準偏差σ、補正された前記在庫調整期間N、前記確率Pb及び需要に対するサービス率Sの程度を示す安全係数kに基づいて安全在庫量SSを算出する手段、
として機能させるための安全在庫量算出プログラム。In order to calculate the safety stock quantity SS,
Means for calculating the standard deviation σ of the demand for goods based on the demand for the goods;
Means for calculating a probability Pb that a customer's required delivery date for the article is shorter than a lead time L of the article or its component;
Means for calculating a representative value LL of a difference between the lead time L and the customer request delivery date when the lead time L exceeds the customer request delivery date;
Means for calculating an inventory adjustment period N using the representative value LL;
Means for calculating a safety stock quantity SS based on the standard deviation σ, the corrected inventory adjustment period N, the probability Pb, and a safety coefficient k indicating the degree of the service rate S with respect to demand;
Safety inventory calculation program to function as
ある物品に対する需要に基づき、前記物品需要の標準偏差σを前記物品又はその構成物のリードタイムLが前記顧客要求納期を超過した場合のデータに基づいて算出する手段、
前記リードタイムLが前記顧客要求納期を超過した場合について、前記リードタイムLと前記顧客要求納期との差の代表値LLを算出する手段、
前記代表値LLを用いて在庫調整期間Nを算出する手段、
前記標準偏差σ、補正された前記在庫調整期間N及び需要に対するサービス率Sの程度を示す安全係数kに基づいて安全在庫量SSを算出する手段、
として機能させるための安全在庫量算出プログラム。In order to calculate the safety stock quantity SS,
Means for calculating a standard deviation σ of the demand for goods based on demand for a certain article based on data when a lead time L of the article or a component thereof exceeds the delivery date requested by the customer;
Means for calculating a representative value LL of a difference between the lead time L and the customer request delivery date when the lead time L exceeds the customer request delivery date;
Means for calculating an inventory adjustment period N using the representative value LL;
Means for calculating a safety stock quantity SS based on the standard deviation σ, the corrected inventory adjustment period N, and a safety factor k indicating the degree of the service rate S with respect to demand;
Safety inventory calculation program to function as
前記物品又はその構成物のリードタイムの発生確率を算出するステップと、
前記顧客要求納期と前記リードタイムから、前記物品が発注点を割ることを予測して発注を行った後、当該物品が提供可能となった時点と、前記発注点を割ることが予測された時点との間の期間を示す実効リードタイムTiを算出するステップと、
前記顧客要求納期の出現確率と前記リードタイムの発生確率に基づいて、前記実効リードタイムTiごとに前記実効リードタイムTiの出現確率を算出するステップと、
前記物品に対する単位期間当たりの需要量の標準偏差σDと、需要に対するサービス率Sの程度を示す安全係数kと、前記実効リードタイムTi及び前記実効リードタイムの出現確率とに基づいて安全在庫量ssを算出するステップとを有することを特徴とする安全在庫量算出方法。Calculating an appearance probability for each delivery date from a customer requested delivery date and frequency for an article;
Calculating an occurrence probability of the lead time of the article or its component;
From the customer-requested delivery date and the lead time, when the product is expected to divide the order point, and after the order is placed, when the product can be provided, and when the order point is predicted to be divided Calculating an effective lead time T i indicating a period between
A step wherein the occurrence probability of the customer request delivery time based on the probability of occurrence of lead time, and calculates the occurrence probabilities of the effective lead time T i for each of the effective lead time T i,
Based on the standard deviation σ D of the demand amount per unit period for the article, the safety coefficient k indicating the degree of the service rate S with respect to the demand, the effective lead time Ti, and the appearance probability of the effective lead time. And a step of calculating the quantity ss.
前記物品又はその構成物のリードタイムの発生確率を算出し、リードタイムの確率分布hkを作成するステップと、
前記顧客要求納期と前記リードタイムから、前記物品が発注点を割ることを予測して発注を行った後、当該物品が提供可能となった時点と、前記発注点を割ることが予測された時点との間の期間を示す実効リードタイムTiを算出するステップと、
前記顧客要求納期の確率分布gjと前記リードタイムの分布確率hkに基づいて、前記実効リードタイムTiごとにその出現確率を算出し、実効リードタイムの確率分布fiを作成するステップと、
ある物品に対する単位期間当たりの需要量の標準偏差σDと、需要に対するサービス率Sの程度を示す安全係数kと、前記実効リードタイムTi及び前記実効リードタイムの確率分布fiとに基づいて安全在庫量ssを算出するステップとを有することを特徴とする安全在庫量算出方法。Calculating an appearance probability for each delivery date from a customer requested delivery date and frequency for an article, and creating a probability distribution g j of the customer requested delivery date;
Calculating an occurrence probability of the lead time of the article or its component, and creating a lead time probability distribution h k ;
From the customer-requested delivery date and the lead time, when the product is expected to divide the order point, and after the order is placed, when the product can be provided, and when the order point is predicted to be divided Calculating an effective lead time T i indicating a period between
Calculating an appearance probability for each effective lead time T i based on the probability distribution g j of the customer demand delivery date and the distribution probability h k of the lead time, and creating a probability distribution f i of the effective lead time; ,
Based on the standard deviation σ D of the demand amount per unit period for a certain article, the safety coefficient k indicating the degree of the service rate S with respect to the demand, the effective lead time T i and the probability distribution f i of the effective lead time. And a safety stock quantity calculation method, comprising: calculating a safety stock quantity ss.
前記物品又はその構成物のリードタイムの発生確率を算出するリードタイム発生確率算出部と、
前記顧客要求納期と前記リードタイムから、前記物品が発注点を割ることを予測して発注を行った後、当該物品が提供可能となった時点と、前記発注点を割ることが予測された時点との間の期間を示す実効リードタイムTiを算出する実効リードタイム算出部と、
前記顧客要求納期の出現確率と前記リードタイムの発生に基づいて、前記実効リードタイムTiごとにその出現確率を算出する実効リードタイム出現確率算出部と、
ある物品に対する単位期間当たりの需要量の標準偏差σDと、需要に対するサービス率Sの程度を示す安全係数kと、前記実効リードタイムTi及び前記実効リードタイムの出現確率とに基づいて安全在庫量ssを算出する安全在庫量算出部とを有することを特徴とする安全在庫量算出装置。A delivery date appearance probability calculating unit that calculates an appearance probability for each delivery date from a customer requested delivery date and frequency for an article;
A lead time occurrence probability calculating unit for calculating an occurrence probability of the lead time of the article or its component;
From the customer-requested delivery date and the lead time, when the product is expected to divide the order point, and after the order is placed, when the product can be provided, and when the order point is predicted to be divided the effective lead time calculation unit for calculating the effective lead time T i which indicates the period between,
On the basis the occurrence probability of the customer request delivery time to the occurrence of the lead time, the effective lead time occurrence probability calculation unit for calculating the occurrence probability for each of the effective lead time T i,
A safety stock based on a standard deviation σ D of the demand amount per unit period for a certain article, a safety coefficient k indicating the degree of the service rate S with respect to the demand, the effective lead time Ti, and the appearance probability of the effective lead time. A safety stock quantity calculation device comprising a safety stock quantity calculation unit for calculating an amount ss.
前記物品又はその構成物のリードタイムの発生確率を算出し、リードタイムの確率分布hkを作成するリードタイム確率分布算出部と、
前記顧客要求納期と前記リードタイムから、前記物品が発注点を割ることを予測して発注を行った後、当該物品が提供可能となった時点と、前記発注点を割ることが予測された時点との間の期間を示す実効リードタイムTiを算出する実効リードタイム算出部と、
前記顧客要求納期の確率分布gjと前記リードタイムの確率分布hkに基づいて、前記実効リードタイムTiごとにその出現確率を算出し、実効リードタイムの確率分布fiを作成する実効リードタイム確率分布算出部と、
ある物品に対する単位期間当たりの需要量の標準偏差σDと、需要に対するサービス率Sの程度を示す安全係数kと、前記実効リードタイムTi及び前記実効リードタイムの確率分布fiとに基づいて安全在庫量ssを算出する安全在庫量算出部とを有することを特徴とする安全在庫量算出装置。A delivery date probability distribution calculating unit that calculates an appearance probability for each delivery date from a customer requested delivery date and frequency for an article, and creates a probability distribution g j of the customer requested delivery date;
A lead time probability distribution calculating unit for calculating the occurrence probability of the lead time of the article or its component, and creating a lead time probability distribution h k ;
From the customer-requested delivery date and the lead time, when the product is expected to divide the order point, and after the order is placed, when the product can be provided, and when the order point is predicted to be divided the effective lead time calculation unit for calculating the effective lead time T i which indicates the period between,
Wherein the probability distribution g j of the customer request delivery time based on a probability distribution h k of lead time, said to calculate the probability of occurrence for each of the effective lead time T i, the effective lead to create a probability distribution f i of the effective lead time A time probability distribution calculator,
Based on the standard deviation σ D of the demand amount per unit period for a certain article, the safety factor k indicating the degree of the service rate S with respect to the demand, the effective lead time T i and the probability distribution f i of the effective lead time. A safety stock quantity calculation device comprising a safety stock quantity calculation unit for calculating a safety stock quantity ss.
顧客要求納期と前記物品又はその構成物のリードタイムから、前記物品が発注点を割ることを予測して発注を行った後、当該物品が提供可能となった時点と、前記発注点を割ることが予測された時点との間の期間を示す実効リードタイムTiを算出する手段、
顧客要求納期とその頻度から算出された顧客要求納期の出現確率と、前記物品又はその構成物のリードタイムの出現確率とから、前記実効リードタイムTiごとにその出現確率を算出する手段、
前記物品に対する単位期間当たりの需要量の標準偏差σDと、需要に対するサービス率Sの程度を示す安全係数kと、前記実効リードタイムTi及び前記実効リードタイムの出現確率に基づいて安全在庫量ssを算出する手段、
として機能させるための安全在庫量算出プログラム。In order to calculate the safe stock quantity ss of an article,
After placing an order by predicting that the article will divide the order point from the customer requested delivery date and the lead time of the article or its component, divide the order point when the article becomes available Means for calculating an effective lead time T i indicating a period between
Means for calculating a customer request delivery time and the probabilities of occurrence of customer requests delivery calculated from the frequency, and a probability of the article or lead time of the composition, the appearance probability for each of the effective lead time T i,
Based on the standard deviation σ D of the demand amount per unit period for the article, the safety coefficient k indicating the degree of the service rate S with respect to the demand, the effective lead time Ti, and the appearance probability of the effective lead time. means for calculating ss;
Safety inventory calculation program to function as
顧客要求納期とその頻度から納期ごとにその出現確率を算出し、顧客要求納期の確率分布gjを作成する手段、
前記物品又はその構成物のリードタイムの発生確率を算出し、リードタイムの確率分布hkを作成する手段、
前記顧客要求納期と前記リードタイムから、前記物品が発注点を割ることを予測して発注を行った後、当該物品が提供可能となった時点と、前記発注点を割ることが予測された時点との間の期間を示す実効リードタイムTiを算出する手段、
前記顧客要求納期の確率分布gjと前記リードタイムの分布確率hkに基づいて、前記実効リードタイムTiごとにその出現確率を算出し、実効リードタイムの確率分布fiを作成する手段、
前記物品に対する単位期間当たりの需要量の標準偏差σDと、需要に対するサービス率Sの程度を示す安全係数kと、前記実効リードタイムTi及び前記実効リードタイムの確率分布fiとに基づいて安全在庫量ssを算出する手段、
として機能させるための安全在庫量算出プログラム。In order to calculate the safe stock quantity ss of an article,
Means for calculating the appearance probability for each delivery date from the customer requested delivery date and its frequency, and creating a probability distribution g j of the customer requested delivery date;
Means for calculating an occurrence probability of the lead time of the article or a component thereof and creating a probability distribution h k of the lead time;
From the customer-requested delivery date and the lead time, when the product is expected to divide the order point, and after the order is placed, when the product can be provided, and when the order point is predicted to be divided Means for calculating an effective lead time T i indicating a period between
Means for calculating an appearance probability for each effective lead time T i based on the probability distribution g j of the customer demand delivery date and the distribution probability h k of the lead time, and creating a probability distribution f i of the effective lead time;
Based on the standard deviation σ D of the demand amount per unit period for the article, the safety coefficient k indicating the degree of the service rate S with respect to the demand, the effective lead time T i and the probability distribution f i of the effective lead time. Means for calculating the safety stock quantity ss,
Safety inventory calculation program to function as
前記物品又はその構成物のリードタイムの発生確率を算出するリードタイム発生確率算出部と、
前記顧客要求納期と前記リードタイムから、前記物品が発注点を割ることを予測して発注を行った後、当該物品が提供可能となった時点と、前記発注点を割ることが予測された時点との間の期間を示す実効リードタイムTiを算出する実効リードタイム算出部と、
前記顧客要求納期の出現確率と前記リードタイムの発生に基づいて、前記実効リードタイムTiごとにその出現確率を算出する実効リードタイム出現確率算出部と、
前記物品に対する単位期間当たりの需要量の標準偏差σDと、需要に対するサービス率Sの程度を示す安全係数kと、前記実効リードタイムTi及び前記実効リードタイムの出現確率に基づいて安全在庫量ssを算出する安全在庫量算出部と、
前記安全在庫量ssと、単位期間当たりの需要量の代表値DAと、前記実効リードタイムTiの累積確率が前記サービス率Sを超えた以後の最小の実効リードタイム値を示す限界リードタイムLMとに基づいて発注点QROを算出する発注点算出部とを有することを特徴とする発注点算出装置。A delivery date appearance probability calculating unit that calculates an appearance probability for each delivery date from a customer requested delivery date and frequency for an article;
A lead time occurrence probability calculating unit for calculating an occurrence probability of the lead time of the article or its component;
From the customer-requested delivery date and the lead time, when the product is expected to divide the order point, and after the order is placed, when the product can be provided, and when the order point is predicted to be divided the effective lead time calculation unit for calculating the effective lead time T i which indicates the period between,
On the basis the occurrence probability of the customer request delivery time to the occurrence of the lead time, the effective lead time occurrence probability calculation unit for calculating the occurrence probability for each of the effective lead time T i,
Based on the standard deviation σ D of the demand amount per unit period for the article, the safety coefficient k indicating the degree of the service rate S with respect to the demand, the effective lead time Ti, and the appearance probability of the effective lead time. a safety stock calculation unit for calculating ss;
Said safety stock quantity ss, the representative value DA of demand per unit period, the effective lead time T i limit lead time L the cumulative probability exhibit minimal effective lead time value subsequent exceeding the service rate S of An order point calculation apparatus comprising: an order point calculation unit that calculates an order point QRO based on M.
前記物品又はその構成物のリードタイムの発生確率を算出し、リードタイムの確率分布hkを作成するリードタイム確率分布算出部と、
前記顧客要求納期と前記リードタイムから、前記物品が発注点を割ることを予測して発注を行った後、当該物品が提供可能となった時点と、前記発注点を割ることが予測された時点との間の期間を示す実効リードタイムTiを算出する実効リードタイム算出部と、
前記顧客要求納期の確率分布gjと前記リードタイムの分布確率hkに基づいて、前記実効リードタイムTiごとにその出現確率を算出し、実効リードタイムの確率分布fiを作成する実効リードタイム確率分布算出部と、
ある物品に対する単位期間当たりの需要量の標準偏差σDと、需要に対するサービス率Sの程度を示す安全係数kと、前記実効リードタイムTi及び前記実効リードタイムの確率分布fiとに基づいて安全在庫量ssを算出する安全在庫量算出部と、
前記安全在庫量ssと、単位期間当たりの需要量の代表値DAと、前記実効リードタイムTiの累積確率が前記サービス率Sを超えた以後の最小の実効リードタイム値を示す限界リードタイムLMとに基づいて発注点QROを算出する発注点算出部とを有することを特徴とする発注点算出装置。A delivery date probability distribution calculating unit that calculates an appearance probability for each delivery date from a customer requested delivery date and frequency for an article, and creates a probability distribution g j of the customer requested delivery date;
A lead time probability distribution calculating unit for calculating the occurrence probability of the lead time of the article or its component, and creating a lead time probability distribution h k ;
From the customer-requested delivery date and the lead time, when the product is expected to divide the order point, and after the order is placed, when the product can be provided, and when the order point is predicted to be divided the effective lead time calculation unit for calculating the effective lead time T i which indicates the period between,
Based on the probability distribution g j of the customer demand delivery date and the distribution probability h k of the lead time, the appearance probability is calculated for each effective lead time T i and the effective lead time probability distribution f i is created. A time probability distribution calculator,
Based on the standard deviation σ D of the demand amount per unit period for a certain article, the safety factor k indicating the degree of the service rate S with respect to the demand, the effective lead time T i and the probability distribution f i of the effective lead time. A safety stock quantity calculation unit for calculating the safety stock quantity ss;
Said safety stock quantity ss, the representative value DA of demand per unit period, the effective lead time T i limit lead time L the cumulative probability exhibit minimal effective lead time value subsequent exceeding the service rate S of An order point calculation apparatus comprising: an order point calculation unit that calculates an order point QRO based on M.
Applications Claiming Priority (5)
| Application Number | Priority Date | Filing Date | Title |
|---|---|---|---|
| JP2002260784 | 2002-09-06 | ||
| JP2002260784 | 2002-09-06 | ||
| JP2003105053 | 2003-04-09 | ||
| JP2003105053 | 2003-04-09 | ||
| PCT/JP2003/010245 WO2004022463A1 (en) | 2002-09-06 | 2003-08-12 | Safe stock amount calculation method, safe stock amount calculation device, order making moment calculation method, order making moment calculation device, and order making amount calculation method |
Publications (2)
| Publication Number | Publication Date |
|---|---|
| JP3698433B2 JP3698433B2 (en) | 2005-09-21 |
| JPWO2004022463A1 true JPWO2004022463A1 (en) | 2005-12-22 |
Family
ID=31980587
Family Applications (1)
| Application Number | Title | Priority Date | Filing Date |
|---|---|---|---|
| JP2004534101A Expired - Fee Related JP3698433B2 (en) | 2002-09-06 | 2003-08-12 | Safety stock quantity calculation device, safety stock quantity calculation program and order point calculation device |
Country Status (4)
| Country | Link |
|---|---|
| US (3) | US7933805B2 (en) |
| JP (1) | JP3698433B2 (en) |
| AU (1) | AU2003255003A1 (en) |
| WO (1) | WO2004022463A1 (en) |
Cited By (2)
| Publication number | Priority date | Publication date | Assignee | Title |
|---|---|---|---|---|
| JP2014130466A (en) * | 2012-12-28 | 2014-07-10 | Mitsubishi Electric Corp | Item demand prediction device, item demand prediction method and program |
| JP2014170375A (en) * | 2013-03-04 | 2014-09-18 | Mitsubishi Heavy Ind Ltd | Simulation device, simulation method, and simulation program |
Families Citing this family (29)
| Publication number | Priority date | Publication date | Assignee | Title |
|---|---|---|---|---|
| JP3831328B2 (en) * | 2002-10-11 | 2006-10-11 | Tdk株式会社 | Inventory management method, inventory management system, and inventory management program |
| WO2006010044A2 (en) * | 2004-07-09 | 2006-01-26 | Gapyx, Llc | System and method for behavioral finance |
| US8671031B2 (en) | 2005-09-02 | 2014-03-11 | Flowvision, Llc | Inventory management system |
| US8209242B1 (en) | 2005-09-02 | 2012-06-26 | Flowvision, Llc | Inventory management system |
| US8515834B2 (en) * | 2005-09-02 | 2013-08-20 | Flowvision, Llc | Inventory management system |
| US7840454B2 (en) * | 2005-09-07 | 2010-11-23 | Sap Ag | Methods and systems for dynamic calculation of safety stock quantity |
| US20080215180A1 (en) * | 2007-03-02 | 2008-09-04 | Rao Kota | Arrangement for dynamic lean replenishment and methods therefor |
| US8600843B2 (en) * | 2007-05-18 | 2013-12-03 | Logistics Management Institute (Lmi) | Method and computer system for setting inventory control levels from demand inter-arrival time, demand size statistics |
| JP2009104359A (en) * | 2007-10-23 | 2009-05-14 | Mitsubishi Chemicals Corp | Proper inventory calculation method and device, tendency decision method and device for demand of brand and program |
| US8311870B1 (en) * | 2008-08-22 | 2012-11-13 | Airbus Sas | Computer-implemented method and computer program to assist in managing supplier capacity |
| EP2172897A1 (en) * | 2008-09-25 | 2010-04-07 | Amadeus | Improvements in or relating to the management of e-tickets |
| JP5792527B2 (en) * | 2011-06-27 | 2015-10-14 | 三菱電機株式会社 | Standard inventory setting device and standard inventory setting method |
| JP5830409B2 (en) * | 2012-02-21 | 2015-12-09 | 株式会社日立製作所 | Base configuration determination apparatus and base configuration determination method |
| JP5988929B2 (en) * | 2013-07-18 | 2016-09-07 | オムロンオートモーティブエレクトロニクス株式会社 | Vehicle control apparatus and vehicle control method |
| JP6326630B2 (en) * | 2014-08-18 | 2018-05-23 | パナソニックIpマネジメント株式会社 | How to determine component placement |
| US9990597B2 (en) * | 2015-03-27 | 2018-06-05 | Oracle International Corporation | System and method for forecast driven replenishment of merchandise |
| JP6436584B2 (en) * | 2016-04-28 | 2018-12-12 | 三菱重工業株式会社 | Arrangement method selection system, arrangement method selection method and program |
| CA2981748A1 (en) * | 2016-10-12 | 2018-04-12 | Wal-Mart Stores, Inc. | Dynamic supply chain management systems and methods |
| US10373117B1 (en) * | 2016-11-15 | 2019-08-06 | Amazon Technologies, Inc. | Inventory optimization based on leftover demand distribution function |
| US20190034944A1 (en) * | 2017-07-26 | 2019-01-31 | Walmart Apollo, Llc | Systems and methods for predicting buffer value |
| CN107527115A (en) * | 2017-08-14 | 2017-12-29 | 震坤行工业超市(上海)有限公司 | Intelligent storage management method, device, system and unmanned intelligent storage equipment |
| CN110033222B (en) * | 2019-04-17 | 2023-08-11 | 东莞市糖酒集团美宜佳便利店有限公司 | Goods supplementing method |
| US11348047B2 (en) * | 2019-06-20 | 2022-05-31 | Walmart Apollo, Llc | Systems and methods for safety stock settings using a parallel processing computing architecture |
| CN110276492A (en) * | 2019-06-24 | 2019-09-24 | 深圳前海微众银行股份有限公司 | A kind of node data prediction technique and device |
| CN110322203B (en) * | 2019-07-05 | 2022-05-03 | 江苏云脑数据科技有限公司 | Retail industry inventory optimization analysis method |
| CN113537861B (en) * | 2020-04-16 | 2024-03-05 | 北京京东振世信息技术有限公司 | Goods supplementing method and goods supplementing device |
| CN113361105B (en) * | 2021-06-07 | 2023-09-19 | 杭州未名信科科技有限公司 | Order distribution method, order distribution device, storage medium and terminal |
| CN113850448B (en) * | 2021-12-01 | 2022-04-05 | 广东立升数字技术有限公司 | Management method and system for consumption and scheduling of spare parts |
| WO2024071528A1 (en) * | 2022-09-27 | 2024-04-04 | 현대자동차주식회사 | Component ordering system and method therefor |
Family Cites Families (4)
| Publication number | Priority date | Publication date | Assignee | Title |
|---|---|---|---|---|
| JP2798299B2 (en) | 1990-11-14 | 1998-09-17 | 積水化学工業株式会社 | Inventory simulation system |
| JPH07306894A (en) | 1994-05-16 | 1995-11-21 | Hitachi Ltd | Inventory management method |
| JP3371706B2 (en) | 1995-08-24 | 2003-01-27 | トヨタ自動車株式会社 | Product sales and production system |
| JP2000094276A (en) | 1998-09-24 | 2000-04-04 | Sekisui Chem Co Ltd | Stockpile plan making device and stockpile plan making method in stock-supply type production system |
-
2003
- 2003-08-12 AU AU2003255003A patent/AU2003255003A1/en not_active Abandoned
- 2003-08-12 WO PCT/JP2003/010245 patent/WO2004022463A1/en active Application Filing
- 2003-08-12 US US10/526,545 patent/US7933805B2/en not_active Expired - Fee Related
- 2003-08-12 JP JP2004534101A patent/JP3698433B2/en not_active Expired - Fee Related
-
2011
- 2011-03-11 US US13/045,765 patent/US20110161208A1/en not_active Abandoned
- 2011-03-11 US US13/045,917 patent/US8140396B2/en not_active Expired - Fee Related
Cited By (2)
| Publication number | Priority date | Publication date | Assignee | Title |
|---|---|---|---|---|
| JP2014130466A (en) * | 2012-12-28 | 2014-07-10 | Mitsubishi Electric Corp | Item demand prediction device, item demand prediction method and program |
| JP2014170375A (en) * | 2013-03-04 | 2014-09-18 | Mitsubishi Heavy Ind Ltd | Simulation device, simulation method, and simulation program |
Also Published As
| Publication number | Publication date |
|---|---|
| US20060026072A1 (en) | 2006-02-02 |
| US8140396B2 (en) | 2012-03-20 |
| JP3698433B2 (en) | 2005-09-21 |
| AU2003255003A1 (en) | 2004-03-29 |
| WO2004022463A1 (en) | 2004-03-18 |
| US7933805B2 (en) | 2011-04-26 |
| US20110161196A1 (en) | 2011-06-30 |
| US20110161208A1 (en) | 2011-06-30 |
Similar Documents
| Publication | Publication Date | Title |
|---|---|---|
| JP3698433B2 (en) | Safety stock quantity calculation device, safety stock quantity calculation program and order point calculation device | |
| Minner | Strategic safety stocks in supply chains | |
| US7552066B1 (en) | Method and system for retail store supply chain sales forecasting and replenishment shipment determination | |
| US6415195B1 (en) | Method and system for providing sufficient availability of manufacturing resources to meet unanticipated demand | |
| US6393332B1 (en) | Method and system for providing sufficient availability of manufacturing resources to meet unanticipated demand | |
| US7343315B2 (en) | System and method of efficient scheduling and processing of purchase orders | |
| US20120054076A1 (en) | Systems And Methods For Multi-Echelon Inventory Planning With Lateral Transshipment | |
| JP5643502B2 (en) | How to create production schedules for multiple factories | |
| JP2009187151A (en) | Inventory management system and order quantity calculation program | |
| US20030050870A1 (en) | Capacity-driven production planning tools | |
| van der Heijden | Multi-echelon inventory control in divergent systems with shipping frequencies | |
| Tavaghof-Gigloo et al. | Planning approaches for stochastic capacitated lot-sizing with service level constraints | |
| AU769097B2 (en) | System and method of scheduling manufacturing resources | |
| US6415194B1 (en) | Method and system for providing sufficient availability of manufacturing resources to meet unanticipated demand | |
| JP2005015140A (en) | Order quantity calculation system | |
| Dominguez et al. | Model for integrating the supply chain of an appliance company: a value of information approach | |
| US6397118B1 (en) | Method and system for providing sufficient availability of manufacturing resources to meet unanticipated demand | |
| Holden | Inventory Optimization Using a SimPy Simulation Model | |
| JP2020119029A (en) | Order information calculation program, device, and method | |
| JPH11353368A (en) | Profit management system, profit managing method, and record medium | |
| Yan et al. | Managing backlog variation in order fulfillment: The case of Internet retailers | |
| JP5650510B2 (en) | Inventory planning device, inventory planning program, and computer-readable recording medium storing inventory planning program | |
| JP2007279998A (en) | Inventory balance simulation system of type taking change to prior plan into account | |
| JP2008165597A (en) | Business parameter determination system | |
| JPH0756987A (en) | Commodity ordering system |
Legal Events
| Date | Code | Title | Description |
|---|---|---|---|
| TRDD | Decision of grant or rejection written | ||
| A01 | Written decision to grant a patent or to grant a registration (utility model) |
Free format text: JAPANESE INTERMEDIATE CODE: A01 Effective date: 20050630 |
|
| A61 | First payment of annual fees (during grant procedure) |
Free format text: JAPANESE INTERMEDIATE CODE: A61 Effective date: 20050704 |
|
| R150 | Certificate of patent or registration of utility model |
Free format text: JAPANESE INTERMEDIATE CODE: R150 Ref document number: 3698433 Country of ref document: JP Free format text: JAPANESE INTERMEDIATE CODE: R150 |
|
| FPAY | Renewal fee payment (event date is renewal date of database) |
Free format text: PAYMENT UNTIL: 20080715 Year of fee payment: 3 |
|
| FPAY | Renewal fee payment (event date is renewal date of database) |
Free format text: PAYMENT UNTIL: 20090715 Year of fee payment: 4 |
|
| R250 | Receipt of annual fees |
Free format text: JAPANESE INTERMEDIATE CODE: R250 |
|
| FPAY | Renewal fee payment (event date is renewal date of database) |
Free format text: PAYMENT UNTIL: 20110715 Year of fee payment: 6 |
|
| R250 | Receipt of annual fees |
Free format text: JAPANESE INTERMEDIATE CODE: R250 |
|
| FPAY | Renewal fee payment (event date is renewal date of database) |
Free format text: PAYMENT UNTIL: 20110715 Year of fee payment: 6 |
|
| FPAY | Renewal fee payment (event date is renewal date of database) |
Free format text: PAYMENT UNTIL: 20140715 Year of fee payment: 9 |
|
| R250 | Receipt of annual fees |
Free format text: JAPANESE INTERMEDIATE CODE: R250 |
|
| FPAY | Renewal fee payment (event date is renewal date of database) |
Free format text: PAYMENT UNTIL: 20140715 Year of fee payment: 9 |
|
| S533 | Written request for registration of change of name |
Free format text: JAPANESE INTERMEDIATE CODE: R313533 |
|
| FPAY | Renewal fee payment (event date is renewal date of database) |
Free format text: PAYMENT UNTIL: 20140715 Year of fee payment: 9 |
|
| R350 | Written notification of registration of transfer |
Free format text: JAPANESE INTERMEDIATE CODE: R350 |
|
| R250 | Receipt of annual fees |
Free format text: JAPANESE INTERMEDIATE CODE: R250 |
|
| R250 | Receipt of annual fees |
Free format text: JAPANESE INTERMEDIATE CODE: R250 |
|
| R250 | Receipt of annual fees |
Free format text: JAPANESE INTERMEDIATE CODE: R250 |
|
| S531 | Written request for registration of change of domicile |
Free format text: JAPANESE INTERMEDIATE CODE: R313531 |
|
| R350 | Written notification of registration of transfer |
Free format text: JAPANESE INTERMEDIATE CODE: R350 |
|
| R250 | Receipt of annual fees |
Free format text: JAPANESE INTERMEDIATE CODE: R250 |
|
| R250 | Receipt of annual fees |
Free format text: JAPANESE INTERMEDIATE CODE: R250 |
|
| R250 | Receipt of annual fees |
Free format text: JAPANESE INTERMEDIATE CODE: R250 |
|
| R250 | Receipt of annual fees |
Free format text: JAPANESE INTERMEDIATE CODE: R250 |
|
| S111 | Request for change of ownership or part of ownership |
Free format text: JAPANESE INTERMEDIATE CODE: R313113 |
|
| S531 | Written request for registration of change of domicile |
Free format text: JAPANESE INTERMEDIATE CODE: R313531 |
|
| R250 | Receipt of annual fees |
Free format text: JAPANESE INTERMEDIATE CODE: R250 |
|
| R350 | Written notification of registration of transfer |
Free format text: JAPANESE INTERMEDIATE CODE: R350 |
|
| LAPS | Cancellation because of no payment of annual fees |