JP6986010B2 - Equipment, systems and methods for Talbot-type spectrometers - Google Patents
Equipment, systems and methods for Talbot-type spectrometers Download PDFInfo
- Publication number
- JP6986010B2 JP6986010B2 JP2018511413A JP2018511413A JP6986010B2 JP 6986010 B2 JP6986010 B2 JP 6986010B2 JP 2018511413 A JP2018511413 A JP 2018511413A JP 2018511413 A JP2018511413 A JP 2018511413A JP 6986010 B2 JP6986010 B2 JP 6986010B2
- Authority
- JP
- Japan
- Prior art keywords
- talbot
- grid
- images
- wavelength
- detector array
- Prior art date
- Legal status (The legal status is an assumption and is not a legal conclusion. Google has not performed a legal analysis and makes no representation as to the accuracy of the status listed.)
- Active
Links
- 238000000034 method Methods 0.000 title claims description 41
- LFEUVBZXUFMACD-UHFFFAOYSA-H lead(2+);trioxido(oxo)-$l^{5}-arsane Chemical compound [Pb+2].[Pb+2].[Pb+2].[O-][As]([O-])([O-])=O.[O-][As]([O-])([O-])=O LFEUVBZXUFMACD-UHFFFAOYSA-H 0.000 claims description 169
- 230000000694 effects Effects 0.000 claims description 40
- 230000005855 radiation Effects 0.000 claims description 18
- 238000010183 spectrum analysis Methods 0.000 claims description 6
- 238000001514 detection method Methods 0.000 claims description 4
- 238000001228 spectrum Methods 0.000 description 34
- 230000003595 spectral effect Effects 0.000 description 18
- 239000011295 pitch Substances 0.000 description 16
- 238000003384 imaging method Methods 0.000 description 12
- 230000000750 progressive effect Effects 0.000 description 11
- 230000000737 periodic effect Effects 0.000 description 10
- 239000006185 dispersion Substances 0.000 description 9
- 238000005070 sampling Methods 0.000 description 8
- 238000004458 analytical method Methods 0.000 description 7
- 230000005540 biological transmission Effects 0.000 description 7
- 230000035945 sensitivity Effects 0.000 description 7
- 238000004088 simulation Methods 0.000 description 6
- 230000009471 action Effects 0.000 description 5
- 239000000463 material Substances 0.000 description 5
- 238000012545 processing Methods 0.000 description 5
- 238000005259 measurement Methods 0.000 description 4
- 230000001902 propagating effect Effects 0.000 description 4
- 238000006243 chemical reaction Methods 0.000 description 3
- 238000009792 diffusion process Methods 0.000 description 3
- 238000002474 experimental method Methods 0.000 description 3
- 230000008859 change Effects 0.000 description 2
- 239000000835 fiber Substances 0.000 description 2
- 238000001914 filtration Methods 0.000 description 2
- 230000002452 interceptive effect Effects 0.000 description 2
- 230000003287 optical effect Effects 0.000 description 2
- 230000008569 process Effects 0.000 description 2
- 230000002123 temporal effect Effects 0.000 description 2
- 238000012935 Averaging Methods 0.000 description 1
- 230000004075 alteration Effects 0.000 description 1
- 238000003491 array Methods 0.000 description 1
- 230000009286 beneficial effect Effects 0.000 description 1
- 230000015572 biosynthetic process Effects 0.000 description 1
- 238000004364 calculation method Methods 0.000 description 1
- 238000012937 correction Methods 0.000 description 1
- 238000000354 decomposition reaction Methods 0.000 description 1
- 238000011161 development Methods 0.000 description 1
- 238000006073 displacement reaction Methods 0.000 description 1
- 239000011521 glass Substances 0.000 description 1
- 238000001093 holography Methods 0.000 description 1
- 238000011835 investigation Methods 0.000 description 1
- 239000011159 matrix material Substances 0.000 description 1
- 230000007246 mechanism Effects 0.000 description 1
- 239000000203 mixture Substances 0.000 description 1
- 238000012986 modification Methods 0.000 description 1
- 230000004048 modification Effects 0.000 description 1
- 238000012549 training Methods 0.000 description 1
- 238000013519 translation Methods 0.000 description 1
Images


Classifications
-
- G—PHYSICS
- G01—MEASURING; TESTING
- G01J—MEASUREMENT OF INTENSITY, VELOCITY, SPECTRAL CONTENT, POLARISATION, PHASE OR PULSE CHARACTERISTICS OF INFRARED, VISIBLE OR ULTRAVIOLET LIGHT; COLORIMETRY; RADIATION PYROMETRY
- G01J3/00—Spectrometry; Spectrophotometry; Monochromators; Measuring colours
- G01J3/28—Investigating the spectrum
- G01J3/45—Interferometric spectrometry
- G01J3/453—Interferometric spectrometry by correlation of the amplitudes
-
- G—PHYSICS
- G01—MEASURING; TESTING
- G01J—MEASUREMENT OF INTENSITY, VELOCITY, SPECTRAL CONTENT, POLARISATION, PHASE OR PULSE CHARACTERISTICS OF INFRARED, VISIBLE OR ULTRAVIOLET LIGHT; COLORIMETRY; RADIATION PYROMETRY
- G01J3/00—Spectrometry; Spectrophotometry; Monochromators; Measuring colours
- G01J3/02—Details
- G01J3/0256—Compact construction
- G01J3/0259—Monolithic
-
- G—PHYSICS
- G01—MEASURING; TESTING
- G01J—MEASUREMENT OF INTENSITY, VELOCITY, SPECTRAL CONTENT, POLARISATION, PHASE OR PULSE CHARACTERISTICS OF INFRARED, VISIBLE OR ULTRAVIOLET LIGHT; COLORIMETRY; RADIATION PYROMETRY
- G01J3/00—Spectrometry; Spectrophotometry; Monochromators; Measuring colours
- G01J3/28—Investigating the spectrum
- G01J3/45—Interferometric spectrometry
- G01J3/453—Interferometric spectrometry by correlation of the amplitudes
- G01J3/4531—Devices without moving parts
-
- G—PHYSICS
- G01—MEASURING; TESTING
- G01J—MEASUREMENT OF INTENSITY, VELOCITY, SPECTRAL CONTENT, POLARISATION, PHASE OR PULSE CHARACTERISTICS OF INFRARED, VISIBLE OR ULTRAVIOLET LIGHT; COLORIMETRY; RADIATION PYROMETRY
- G01J3/00—Spectrometry; Spectrophotometry; Monochromators; Measuring colours
- G01J3/28—Investigating the spectrum
- G01J3/45—Interferometric spectrometry
- G01J3/453—Interferometric spectrometry by correlation of the amplitudes
- G01J3/4532—Devices of compact or symmetric construction
Description
関連出願に対する相互参照
本出願は、「MINIATURE SPECTROMETER BASED ON MID−FIELD DIFFRACTION IMAGING」と題する、2015年9月1日に出願された米国仮出願シリアル番号62/212,636号の下に優先権を主張しており、この出願は、その全体が参照により本明細書に組み込まれる。
Cross-reference to related applications This application has priority under US provisional application serial number 62/212,636, filed September 1, 2015, entitled "MINIATURE SPECTROMETER BASED ON MID-FIELD DIFFRACTION IMAGING". Allegedly, this application is incorporated herein by reference in its entirety.
本出願は、「MINIATURE SPECTROMETER BASED ON MID−FIELD DIFFRACTION IMAGING」と題する、2015年9月2日に出願された米国仮出願シリアル番号62/213,158号の下に優先権を主張しており、この出願は、その全体が参照により本明細書に組み込まれる。 This application claims priority under US Provisional Application Serial No. 62 / 213,158, filed September 2, 2015, entitled "MINIATURE SPECTROMETER BASED ON MID-FIELD DIFFRACTION IMAGING". This application is incorporated herein by reference in its entirety.
本出願は、「MINIATURE,SUB−NANOMETER RESOLUTION TALBOT SPECTROMETER」と題する、2016年2月2日に出願された米国仮出願シリアル番号62/290,120号の下に優先権を主張しており、この出願は、その全体が参照により本明細書に組み込まれる。 This application claims priority under US Provisional Application Serial Nos. 62 / 290,120, filed February 2, 2016, entitled "MINIATURE, SUB-NANOMETER RESOLUTION TALBOT SPECTROMETER". The entire application is incorporated herein by reference in its entirety.
従来の自由空間光学スペクトロメータは通常、光周波数をファーフィールドにおいて分離するのに、例えば格子などの回折素子の分散特性に依拠している。しかしながら高いスペクトル分解能を達成するために、スペクトロメータは典型的には、極めて大きなサイズを有する、または入力光を空間的に絞る小さな入力開口を有する。したがって分解能と、サイズと、「集光能力」(これはエテンデュとも呼ばれ、開口の有効面積と開口数の2乗に比例する)の間に兼ね合いが生じる場合がある。 Conventional free space optical spectrometers usually rely on the dispersion characteristics of a diffractive element, such as a grating, to separate the optical frequencies in the farfield. However, in order to achieve high spectral resolution, the spectrometer typically has a very large size or has a small input aperture that spatially throttles the input light. Therefore, there may be a trade-off between resolution, size, and "condensing capacity" (also called etendu, which is proportional to the effective area of the aperture and the square of the numerical aperture).
上記の制約を克服するための1つの方法は、オンチップスペクトロメータを利用することであり、これは数百ミクロンほどの横方向の寸法を有することがあり、かつ極めて高分解能である。但しこのようなオンチップスペクトロメータは、その小さな入力開口のために、低エテンデュを欠点として持つことがある。 One way to overcome the above limitations is to utilize an on-chip spectrometer, which can have lateral dimensions as large as a few hundred microns and has extremely high resolution. However, such on-chip spectrometers may have a drawback of low etendum due to their small input aperture.
別の方法は、多くのフィルタを使用して入力信号をスペクトル的に分解する。例えば狭帯域の共振フィルタを利用することで高い分解能を達成することができる、または広帯域のフィルタを利用し、かつスペクトル再構成技術を採用してフィルタの帯域幅より小さいフィーチャーを分解することができる。 Another method uses many filters to spectrally decompose the input signal. High resolution can be achieved, for example by using a narrow band resonant filter, or a wide band filter can be used and spectral reconstruction techniques can be used to decompose features smaller than the filter bandwidth. ..
従来式の回折スペクトロメータに関するスループットと分解能の兼ね合いに対処することができる3番目の手法は、小さい入力開口を、いわゆる「コード化された開口」によって置き換えることであり、これによりスループットを増加させることが可能になる。但しこの手法も通常、スペクトラムを構築するために逆計算の問題を解決することを含んでおり、これは複雑であり得る。 A third technique that can address the throughput and resolution trade-offs for traditional diffraction spectrometers is to replace the small input aperture with a so-called "coded aperture", thereby increasing the throughput. Will be possible. However, this technique also usually involves solving the problem of inverse computation to build the spectrum, which can be complicated.
本明細書に記載される装置、システム及び方法は一般に非近軸領域におけるタルボ効果を利用するスペクトロメータに関する。一例において、スペクトロメータは、格子に直交する方向に沿って間隔を置いて複数のタルボ画像を形成するために入射放射を回折させるための格子を含む。格子は、入射放射の波長λよりおよそ1からおよそ3倍大きな格子周期dを有する。スペクトロメータはまた、複数のタルボ画像のうちの少なくとも一部を検出するために、格子に対して特定の角度で配設された検出器アレイを含む。 The devices, systems and methods described herein generally relate to spectrometers that utilize the Talbot effect in the non-paraxial region. In one example, the spectrometer includes a grid for diffracting incident radiation to form multiple Talbot images spaced apart along a direction orthogonal to the grid. The grid has a grid period d approximately 1 to approximately 3 times larger than the wavelength λ of the incident radiation. The spectrometer also includes a detector array disposed at a particular angle to the grid to detect at least a portion of the Talbot image.
別の例では、スペクトル分析の方法は、複数のタルボ画像を生成するために入射放射を格子に透過させることを含む。格子は、入射放射の波長よりおよそ1からおよそ3倍大きな格子周期を有する。方法はまた、格子に対して傾斜させた検出器アレイによってタルボ画像を検出し、複数のタルボ画像に少なくとも幾分基づいて波長を推定することを含む。 In another example, the method of spectral analysis involves transmitting incident radiation through a grid to generate multiple Talbot images. The grid has a grid period that is approximately 1 to approximately 3 times greater than the wavelength of the incident radiation. The method also involves detecting the Talbot image with a detector array tilted with respect to the grid and estimating the wavelength based on at least some of the Talbot images.
さらに別の例では、スペクトロメータは、格子に直交する方向に沿って間隔を置いて複数のタルボ画像を形成するように入射放射を回折させるための格子を含む。格子は、入射放射の波長λよりおよそ1からおよそ3倍大きな格子周期dを有する。スペクトロメータはまた、複数のタルボ画像のうちの少なくとも一部を検出するために、格子に対して特定の角度で配設された検出器アレイを含む。検出器アレイは近位端と、遠位端とを有する。近位端は、格子から1mm以上離れておらず、遠位端は、格子から10mm以上離れていない。検出器アレイはまた、(2m+1)d/2にほぼ等しいピクセルピッチを有し、この場合mは、正の整数である。 In yet another example, the spectrometer includes a grid for diffracting incident radiation to form multiple Talbot images at intervals along directions orthogonal to the grid. The grid has a grid period d approximately 1 to approximately 3 times larger than the wavelength λ of the incident radiation. The spectrometer also includes a detector array disposed at a particular angle to the grid to detect at least a portion of the Talbot image. The detector array has a proximal end and a distal end. The proximal end is no more than 1 mm away from the grid and the distal end is no more than 10 mm away from the grid. The detector array also has a pixel pitch approximately equal to (2m + 1) d / 2, where m is a positive integer.
上述の概念と、以下でより詳細に考察される追加の概念の全ての組み合わせは(そのような概念が互いに矛盾しないという条件で)、本明細書に開示される進歩的な主題の一部であるように意図されていることを理解すべきである。詳細には、本開示の終わりに見られるクレーム主張される主題の全ての組み合わせは、本明細書に開示される進歩的な主題の一部であるように意図されている。参照により組み込まれる任意の開示の中に現れる場合もある、本明細書において明確に採用される専門用語は、本明細書に開示される特定の概念と最も一致する意味が与えるべきであることも理解すべきである。 All combinations of the above concepts and the additional concepts discussed in more detail below (provided that such concepts are consistent with each other) are part of the progressive subject matter disclosed herein. It should be understood that it is intended to be. In particular, all combinations of claimed subject matter found at the end of this disclosure are intended to be part of the progressive subject matter disclosed herein. The terminology specifically adopted herein, which may appear in any disclosure incorporated by reference, should also be given meaning that is most consistent with the particular concept disclosed herein. Should be understood.
当業者は、図面が主に例示の目的であり、本明細書に記載される進歩的な主題の範囲を限定することは意図されていないことを理解するであろう。図面は、必ずしも縮尺通りではなく、一部の例では、本明細書に開示される進歩的な主題の種々の態様は、様々な特徴の理解を促進するために、図面に誇張されてまたは拡大されて示される場合もある。図面において、同様の参照符号は概ね、同様の特徴(例えば機能的に同様の及び/または構造的に同様の要素)を指している。 Those skilled in the art will appreciate that the drawings are primarily for illustrative purposes and are not intended to limit the scope of the progressive subject matter described herein. The drawings are not necessarily on scale and, in some examples, various aspects of the progressive subject matter disclosed herein are exaggerated or enlarged in the drawings to facilitate understanding of the various features. May be shown. In the drawings, similar reference numerals generally refer to similar features (eg, functionally similar and / or structurally similar elements).
非近軸領域におけるタルボ型スペクトロメータの作動 Operation of Talbot-type spectrometer in non-paraxial region
従来式のスペクトロメータにおける問題に対処するために、本明細書に記載される装置、システム及び方法は、透過型格子によって生成されるタルボ効果を利用して、透過型格子に入射光のスペクトル情報を再構成する。一例のタルボ型スペクトロメータは、入射光を受光するために透過型格子を含む。タルボ型スペクトロメータが近軸限界の外で作動することを可能にするために、透過型格子の格子周期は、対象の波長に匹敵する。透過型格子を通って透過された光は、周期的な回折パターン(この出願ではタルボ画像または自己像とも呼ばれる)を含む光照射野を形成する。タルボ型スペクトロメータはまた、様々な距離において光照射野を同時に測定することができる傾斜した検出器を含む。入射光のスペクトル情報は、測定した光照射野のフーリエ変換を利用することによって、または測定した回折パターンを、既知の波長を有する光源によって取得された強度パターンのライブラリと比較することによって計算することができる。 To address problems with conventional spectrometers, the devices, systems and methods described herein utilize the Talbot effect produced by a transmission grid to provide spectral information of incident light into a transmission grid. To reconstruct. An example Talbot-type spectrometer includes a transmissive grid to receive incident light. To allow the Talbot-Lagometer to operate outside the paraxial limit, the lattice period of the transmissive lattice is comparable to the wavelength of interest. The light transmitted through the transmissive lattice forms a light field containing a periodic diffraction pattern (also referred to as a Talbot image or self-image in this application). Talbot-type spectrometers also include a tilted detector that can simultaneously measure the light field at various distances. Spectral information of incident light can be calculated by utilizing the Fourier transform of the measured light field or by comparing the measured diffraction pattern with a library of intensity patterns obtained by a light source with a known wavelength. Can be done.
タルボ型スペクトロメータにおける検出器は、ミッドフィールドの回折パターンを測定するために透過型格子に極めて近づけて(例えば格子から10mm以上離れないで)配置されるため、全体のシステムを有意に小型化することができる。透過型格子と、検出器の間の距離が短いことによって、タルボ型スペクトロメータが、低い時間的干渉性でスペクトルを測定することを可能にすることもできる。換言すると、本明細書に記載されるスペクトロメータは、入射光の時間的干渉性の要件を緩和する。これに加えて、検出器のピクセルピッチは、タルボ画像を測定する効率を高めるために、格子周期の1/2の奇数倍数であるようにさらに構成することができる。 The detector in the Talbot-Lagometer is placed very close to the transmission grid (eg, not more than 10 mm away from the grid) to measure the diffraction pattern in the midfield, significantly reducing the overall system. be able to. The short distance between the transmission grid and the detector can also allow the Talbot-Lagoscope to measure the spectrum with low temporal coherence. In other words, the spectrometers described herein relax the requirement for temporal coherence of incident light. In addition to this, the pixel pitch of the detector can be further configured to be an odd multiple of 1/2 of the grid period to increase the efficiency of measuring the Talbot image.
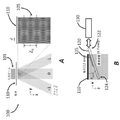
図1A及び図1Bは、非近軸領域で作動するタルボ型スペクトロメータ100のそれぞれ上面図と、側面図を示す。スペクトロメータ100は、入力ビーム101を受光するために格子110(例えば1Dバイナリ透過型格子)を含む。入力ビーム101は、例えば標的(光源とも呼ばれる)から放射される、散乱される、または拡散される場合がある。格子110による回折の際、入射光101は、複数のタルボ画像105(自己像105とも呼ばれる)を含む光照射野を形成する。格子110は、格子周期dを有し、その溝がy軸と整列され、入射光101がz軸に沿って伝播するように位置決めされる。タルボ画像105は、ミッドフィールド回折パターンで配置される。これに加えてタルボ画像105は、周期d(格子周期dと同じ)を有してx方向において周期的であり、y方向では一定であり、z方向では周期ZSIを有して周期的である。ピクセルピッチpを有する検出器アレイ120(例えば2D撮像装置)は、図1Bに示されるように、y軸に対して角度θdetでz軸に沿って傾斜される。検出器アレイ120は、タルボ画像105をz方向における種々の位置において標本化するために使用される。作業中、検出器120は、測定のためにピクセルの一部125のみを使用することができる。プロセッサ130が、検出器アレイ120に作動可能に結合されて、検出器120によって標本化されたタルボ画像105に基づいて入射光101のスペクトルを計算する。
1A and 1B show a top view and a side view of the Talbot-
図1Cは、図1A〜図1Bに示されるスペクトロメータ100の写真である。この装置が小型であることを示すために、比較のために25セント硬貨がスペクトロメータの脇に置かれている。スペクトロメータは、10mmx10mmx6mmの寸法を有し、サブナノメータ分解能を達成することができる。これとは対照的に既存のタルボ型スペクトロメータは通常、およそ20nmからおよそ50nmの分解能を有し、そのサイズは、ホログラフィックシステムにおける多くの光学素子に起因して、数10センチメートルもの大きさであり得る。自己像を検出器上で拡大するのにレンズが使用される場合、より小さいサイズ(例えばおよそ40mm)も可能である。
1C is a photograph of the
特定の理論に拘泥することなく、スペクトロメータ100の作動は、フレネルの回折原理を用いて理解することができる。当分野で理解されるように、格子120からのフレネル回折は、タルボ画像105の周期的パターンを生成することができ、これは観察可能であり、格子120のすぐ裏側から始まっている。自己撮像面の間の中間は、位相が反転した撮像面であり、ここで光と影の領域が交換される(例えば図1Aに示される点線を参照されたい)。したがって所定の位置の特定の地点(x、y)に関する強度は、格子120からz方向に離れるように移動するにつれて、明から暗に交互に並ぶことができる。特定の理論または作動の態様に拘泥することなく、このような繰り返しのパターンは、回折ビームからの干渉から生じる。近軸近似、d≫λを満たす脆弱な分散の格子の場合、自己像は、タルボ距離ZTだけ離れたタルボ画像面に現れる。
![]()
この場合mは、干渉する回折次数に相当する整数であり、λは動作波長であり、dは回折格子の周期である。タルボ効果が観察され得る範囲の距離はW/tanφであり、この場合Wは格子120の幅であり、φは回折ビームの角度である。格子の後のこの距離を超える領域は通常、ファーフィールド領域と呼ばれ、ここでは回折ビームはもはや重ならない。
Without being bound by a particular theory, the operation of the
![]()
In this case, m is an integer corresponding to the interfering diffraction order, λ is the operating wavelength, and d is the period of the diffraction grating. The distance in which the Talbot effect can be observed is W / tan φ, where W is the width of the
タルボ画像105の繰り返しのパターンは波長に反比例するため、タルボ画像105を使用してスペクトルの再構成を行うことができる。タルボ型スペクトロメータ100は、複数のタルボ画像面において同時に、格子110からの距離を関数として照射野の強度を測定することによってタルボ効果を利用することができる。入射光101のスペクトルはその後、周期的パターンのフーリエ変換を利用することによって再構成することができる。あるいは格子110からの距離を使用して波長を導き出すこともできる。
Since the repeating pattern of the
照射野を測定するために可動部品を利用することを避けるために、タルボパターンを構成するのに、デジタルホログラフィーが利用される場合がある、または傾斜した検出器(スペクトロメータ100において使用される際)を使用することで、様々な距離のところで照射野を同時に測定することができる。
Digital holography may be used to construct the Talbot pattern to avoid using moving parts to measure the field of irradiation, or when used in a tilted detector (in the
図1A〜図1Bに示されるスペクトロメータ100は、可動部品なしで、z方向に沿った複数のタルボ画像面における回折パターン105の標本化を可能にする傾斜した検出器アレイ120を使用する。検出されたタルボパターン105の高速フーリエ変換(FFT)を行うことによってスペクトラムを得ることができる。z方向における各々のピクセルの長さは、zpix=psinθdetであり、撮像装置が及ぶzにおける全体の距離は、z_spec=Nzzpixであり、この場合、NZは、撮像装置の一方向におけるピクセルの数である。zpix≪zTである場合、ピクセルは、タルボ画像105を標本化するデルタ関数としてモデル化することができ、スペクトロメータの分解能及び波長スパンはそれぞれΔkT=2π/zspecと、kT,max=π/zpixであり、この場合kT=2π/zTである。
The
所与の検出器アレイ120に関して、スペクトロメータ100の波長スパンと分解能の間には兼ね合いが存在する場合がある。一方で検出器アレイ120の傾斜角を拡大させることで、スペクトロメータの分解能を高めることができ、これは標本化される自己像の数が増加するためである。一方で傾斜角を拡大させることは、エイリアシングが生じる前に検出され得る最大波長を低下させる場合もあり、これは標本化の時間が増加するためである。
For a given
従来のタルボ型スペクトロメータは、近軸限界の下でのタルボ効果のみを利用しており、この場合格子周期dは、動作波長λよりかなり大きい(すなわちd≫λ)。これにより、格子の自己像の厳密な複製の取得を可能にすることができる。しかしながら近軸限界における作動は、結果として生じるスペクトロメータの最小サイズを制限する場合がある。近軸限界において、タルボ距離は通常、波長より少なくとも百倍大きい。FFTを利用するスペクトル再構成は通常、高いスペクトル分解能のために撮像装置によって標本化されるタルボ自己像の多くの周期を利用する。波長δλを別々に分解するために、撮像装置が標本化する最小距離は、フーリエ理論に従っておよそ2d2/δλである。例えば格子周期d=10λであり、λ=500nmで動作するスペクトロメータは、1nmのスペクトル分解能を有するのに、少なくとも5cmの長さであり得る。 Conventional Talbot-type spectrometers utilize only the Talbot effect under paraxial limits, where the lattice period d is significantly larger than the operating wavelength λ (ie d >> λ). This makes it possible to obtain an exact duplicate of the self-image of the grid. However, operation at paraxial limits may limit the minimum size of the resulting spectrometer. At the paraxial limit, the Talbot distance is usually at least 100 times greater than the wavelength. Spectral reconstruction utilizing the FFT typically utilizes many periods of the Talbot self-image sampled by the imager for high spectral resolution. To separate the wavelengths δλ, the minimum distance sampled by the imager is approximately 2d 2 / δλ according to Fourier theory. For example, a spectrometer with a grid period d = 10λ and operating at λ = 500 nm can be at least 5 cm long while having a spectral resolution of 1 nm.
これとは対照的に、格子110は、動作波長λに匹敵する周期dを有し、すなわちd〜λであり、このケースでは、+1、0及び1回折次数のみにおいて有意に回折されるパワーが存在する。このようなケースは、本出願を通して非近軸領域と呼ばれる。タルボ画像105は、格子110のパターンの厳密な複製ではない場合がある。代わりにタルボ画像は、滑らかな正弦曲線を含んでおり(例えば図1Aを参照)、周期
![]()
を有してzにおいて周期的に現れる。
In contrast, the
![]()
And appear periodically in z.
非近軸領域におけるタルボ画像105は、−1及び/または+1回折ビームと0次回折ビームとの干渉から生じることができる。近軸限界において、式(2)は、式(1)におけるタルボ距離に簡約される。
The
波長は、
![]()
より、自己像(zSI)の周期性から計算することができる。非近軸領域において作動する際、自己像の間の距離は、ほぼ波長の大きさであり、そのため匹敵する分解能のスペクトロメータは、百倍薄くなり得る。
The wavelength is
![]()
Therefore, it can be calculated from the periodicity of the self-image (z SI). When operating in the non-paraxial region, the distance between self-images is approximately wavelength magnitude, so a spectrometer with comparable resolution can be 100 times thinner.
非近軸のミッドフィールドタルボ型スペクトロメータの性能をさらに改善するために、検出器アレイ120を、例えばレンズなどの自由空間光学機器なしでタルボ画像105を分解するように構成することができる。一例において、検出器アレイ120のピクセルピッチpは、格子周期dの整数の倍数と異なる場合があり、すなわちp≠ndであり、この場合nは正の整数である。そうでなければ、検出器アレイ120が、自己撮像面と、位相が反転した自己撮像面における強度の差を検出することができない可能性があり、記録されるパターンは、zにおいて一定であり得る。別の例では、格子周期dの1/2の奇数倍数であるピクセルピッチpを利用することによってタルボ信号を増大させる、または最大にすることができ、すなわちp=(2m+1)d/2であり、この場合mは正の整数である。
To further improve the performance of the non-paraxial midfield Talbot-type spectrometer, the
上記の記載に基づいて、スペクトロメータ100における構成要素をこれに従って構成することができる。格子110周期dと、入射ビーム101の波長λの比が、スペクトロメータ100の領域を決定する(例えば近軸領域または非近軸領域)。一例において、比d/λは、およそ1からおよそ3であってよい(例えばおよそ1、およそ1.5、およそ2およそ2.5またはおよそ3、その間の任意の値及びサブレンジを含める)。別の例では、格子周期dは、回折作用をさらに高めるために波長λより小さい場合がある(例えばd/λは1未満、0.9未満、0.8未満、0.7未満、0.6未満、0.5未満、0.4未満または0.3未満であってよく、その間の任意の値、及びサブレンジを含める)。
Based on the above description, the components in the
一例において、格子110は、格子110全体にわたって一定の周期dを有する。別の例では、格子110は、格子110にわたって変動する周期を有する場合もある。例えば格子110の周期は、格子の一端におけるd1から格子の他端におけるd2まで段階的に変化する場合がある。このような変動周期の格子(変動ピッチの格子とも呼ばれる)は、タルボ画像105を生成することに加えて、分散補償器としても機能し得る。
In one example, the
格子周期dの絶対値は、用途に固有であってよい。例えば医療用途の場合、スペクトロメータ100は、電磁スペクトルの可視及び近赤外波長(IR)領域内で機能することができ、そのため格子周期dは、およそ0.8μmからおよそ2μmまでであってよい。別の例では、スペクトロメータ100は、機械視覚に関する電磁スペクトルの短波長赤外(SWIR)領域において使用される際、格子周期dは、およそ1.2μmからおよそ4μmまでであってよい。実際には、格子周期dは、およそ0.5μmからおよそ5μmまでであってよい(例えばおよそ0.5μm、およそ0.8μm、およそ1.0μm、およそ1.2μm、およそ1.4μm、およそ1.6μm、およそ1.8μm、およそ2μm、およそ3μm、およそ4μmまたはおよそ5μmであり、その間の任意の値及びサブレンジを含む)。
The absolute value of the grid period d may be application specific. For example, for medical applications, the
格子110に対する検出器120の傾斜角θdetは、スペクトロメータ100の分解能に影響を与える可能性がある。一般に、より大きな傾斜角θdetは、スペクトロメータ100のより高い分解能につながる可能性がある(以下のより詳細な記載を参照されたい)。実際には、傾斜角θdetは、およそ10度からおよそ40度であってよい(例えばおよそ10度、およそ15度、およそ20度、およそ25度、およそ30度、およそ35度またはおよそ40度であり、その間の任意の値及びサブレンジを含む)。例えばピクセルピッチp(またはそれに応じたピクセルサイズ)が小さい場合(例えば1μm未満)、40度を超える傾斜角θdetを使用することもできる。
The tilt angle θ date of the
傾斜角θdetは、検出器アレイ120の全長Lを考慮して構成することができる。例えば傾斜角θdet及び検出器アレイ120の全長は、少なくとも1つのタルボ画像を標本化するために、検出器アレイ120がタルボ長zSI(式(2)を参照されたい)を超える、z方向に沿った(すなわちLsin(θdet))投影長さを有するように設置することができる。実際には、検出器アレイ120の投影長さは、タルボ長より少なくとも3倍大きくてよい(例えば3倍より大きい、4倍より大きい、5倍より大きい、8倍より大きい、10倍より大きい、12倍より大きい、20倍より大きい、50倍より大きい、100倍より大きい、または150倍より大きく、その間の任意の値及びサブレンジを含む)。換言すると、検出器アレイ120によって数百のタルボ画像を標本化することができる。
The tilt angle θ date can be configured in consideration of the total length L of the
図1Bに示されるように、検出器アレイ120は、近位端122と、遠位端124とを有する。タルボ画像105は、格子110のすぐ後ろに現れる場合があるため、検出器アレイ120の近位端122は、格子110に極めて近接してよい(例えば2mm未満、1mm未満、0.8mm未満、0.7mm未満または0.6mm未満であり、その間の任意の値及びサブレンジを含む)。検出器アレイ120の遠位端124は、格子110からおよそ15mm以上離れることはない(例えば15mm未満、12mm未満、10mm未満、9mm未満、8mm未満、7mm未満、6mm未満、5mm未満または4mm未満であり、その間の任意の値及びサブレンジを含む)。
As shown in FIG. 1B, the
図1Aに示されるタルボ画像105は、例示の目的で格子110に直交する方向(すなわちz方向)に沿って周期的である。実際には、タルボ画像105は、格子110に対する法線に沿って成分を有する任意の方向に沿って周期的であってよい。
The
スペクトロメータ100におけるプロセッサ130は、入射光101の波長(複数可)を推定するのに利用される。一例において、プロセッサ130は、測定したタルボ画像105のフーリエ変換を行うことで、入射光ビーム105のスペクトル情報を導き出すことができる。フーリエ変換は、1つの列に沿って測定された強度に対して行われる一次元高速フーリエ変換(1D−FFT)であってよい。2D撮像装置はまた、この撮像装置の複数の列からのスペクトルを平均化することによってノイズを削減する手段を提供する。
The
別の例では、プロセッサ130は、検出されたタルボ画像を、既知の範囲の波長に関して予測される強度パターンのライブラリと比較することによるトレーニングモデルを利用して入射光ビーム101のスペクトル情報を計算することができる。予測される強度パターンのライブラリは、較正プロセスを通して作成することができる。この較正プロセスにおいて、特定の範囲の既知の波長(例えばλ1、λ2、・・・λNまで)の光ビームが格子110を照らし、対応する強度パターン(例えばI1、I1、・・・INまで)を検出器120によって記録することができる。スペクトロメータ100の作動中、既知の波長における光ビーム101が格子110を照らす際、記録されるパターンIukがパターンのシーケンス(I1、I1、・・・INまで)と比較されて、どの波長(λ1、λ2、・・・λNまで)が同様のパターンを生成するかを判定することができる。あるいはこのようなライブラリと、未知の光源からのスペクトロメータ100の反応を仮定すると、逆行列問題を解くことによって光源の分光組成を判定することができる。ライブラリの成分は、確実に分解されるために互いに対して少なくとも幾分直交してよい。
In another example,
タルボ画像を用いるスペクトル分析の方法 Method of spectral analysis using Talbot image
図2は、タルボ画像を用いるスペクトル分析のための方法200を示している。方法200におけるステップ210において、入射放射が、入射放射のスペクトル成分の少なくとも1つの波長λに匹敵する格子周期dを有する非近軸格子を照らす。例えば格子周期dと波長λの比(すなわちd/λ)は、およそ1からおよそ3である、または上に記載した任意の他の範囲であってよい。格子の回折は、z方向に沿って格子の後に周期的に配置される複数のタルボ画像を生成する。
FIG. 2 shows
方法200のステップ220において、検出器は、z方向に沿った様々な位置でタルボ画像を標本化する。一例では、検出器は、格子に対してほぼ平行であってよく、格子の後ろの一カ所で1つのタルボ画像を測定することができる。タルボ画像を標本化するために、可動ステージを利用して検出器をz方向に沿って移動させることができる(例えば図3Bを参照されたい)。別の例では、検出器を格子に対して傾斜させることによって(例えば図1Bを参照されたい)、検出器がz方向に沿った様々な位置でタルボ画像を標本化する場合もある。このような構成は、可動ステージなしで機能することができ、これによりシステムの複雑さをさらに低下させることができる。
In
方法200のステップ230において、プロセッサは、ステップ220において取得したタルボ画像に基づいて入射放射のスペクトル情報(ピーク波長またはスペクトル密度など)を推定する。一例において、プロセッサは、1D−FFTを行うことでスペクトル情報を導き出すことができる。別の例では、プロセッサは、タルボ画像を予測される強度パターンのライブラリと比較することで、入射放射におけるスペクトル成分の波長(複数可)を判定することができる。
In
非近軸領域におけるタルボ型スペクトロメータの性能の分析 Analysis of Talbot-Lagometer performance in non-paraxial region
図3A及び図3Bはそれぞれ、ミッドフィールド回折パターンでタルボ画像305を生成するためにバイナリ1D透過型格子310を含む分光システム300の斜視図と、側面図を示す。格子310の溝は、y方向に沿っており、タルボ画像304は、z方向に沿って周期的である。検出器320は、z方向に沿った様々な位置でタルボ画像305を標本化するために格子310に対して特定の角度で配置される。検出器320は、作動装置325によってx方向を中心として回転させることができ、これにより、傾斜角を関数としたスペクトロメータの性能の分析が可能になる。別の例では、作動装置325はまた、可動ステージ(平行移動ステージとも呼ばれる)を含むことで、検出器320をz方向に移動させる場合もある。システム300を使用して、非近軸領域において作動するタルボ型スペクトロメータの性能に対する他のパラメータ、例えば格子の周期性、傾斜角及び光ビームの入射角などの影響を調査することもできる。
3A and 3B show perspective views and side views of a
格子の周期性 Lattice periodicity
1D透過型格子310の裏側にタルボ画像305を含むミッドフィールドパターンが図3Bに示されている。タルボ距離毎に生じる自己像305は、高い強度ラインと、低い強度ラインが交互になる縞として現れ、これは格子310の歯に相当する。自己像の各々の間には、位相が反転した自己像があり、これは反転した高い強度ラインと低い強度ラインとを有する。したがってタルボの周期性を測定する場合、xに沿った1つの地点のみを見るだけで、伝播距離zに伴って強度がどのように変化するかを観察することができる。
A midfield pattern including a
特定の理論に拘泥することなく、格子の周期性dの格子の裏側の照射野は、タルボ効果のレーリー卿の近似法を利用して、
![]()
のように表すことができ、この場合A0は、m=0回折次数の回折効率であり、A1は、1、−1回折次数の回折効率である。
Without being bound by a particular theory, the irradiation field behind the lattice of the lattice periodicity d utilizes Sir Rayleigh's approximation of the Talbot effect,
![]()
In this case, A 0 is the diffraction efficiency of m = 0 diffraction order, and A 1 is the diffraction efficiency of 1, -1 diffraction order.
ピクセル長pを有する正方ピクセルによって検出されるパワーは、

によって与えられると仮定することができる。タルボ距離に関する情報を提供するこの式の項は、cos(2πz/zT)項である。
The power detected by a square pixel with pixel length p is
Can be assumed to be given by. The term of this equation that provides information about the Talbot distance is the cos (2πz / z T ) term.
z=zTにおいて、検出されるタルボ効果のパワーとピクセル長pの関係は、
![]()
である。この式は、検出器がx及びy方向において有することができるz依存を無視していることに留意されたい。このz依存は、z=z0+xtan(θdet)またはz=z0+ytan(θdet)を利用して考慮することができ、この場合、θdetは、検出器320がx及び/またはy軸に対して傾斜される角度である。
At z = z T , the relationship between the detected power of the Talbot effect and the pixel length p is
![]()
Is. Note that this equation ignores the z dependence that the detector can have in the x and y directions. This z dependence can be considered using z = z 0 + xtan (θ det ) or z = z 0 + ytan (θ det ), in which case the θ det can be seen by the
一例において、x方向において検出器に沿ってコントラストを分析する場合、検出器は、透過型格子に対して平行であってよく(θdet=0)、式(5)は、この目的に関して十分であり得る。 In one example, when analyzing contrast along the detector in the x direction, the detector may be parallel to the transmission grid (θ det = 0) and equation (5) is sufficient for this purpose. possible.
まず、自己像がx0=p/2+mpであり、この場合mは任意の整数であるようにピクセル上の中心に置かれると仮定する。次にピクセル幅pが格子の周期性dの1/2の奇数倍数である場合、このとき、タルボ自己像を測定するピクセルは、n個のピークと、n−1個のゼロを見ることができ、反転した自己像を測定するピクセルは、n−1個のピークとn個のゼロを見ることができる。これは、自己像からのピークがピクセルの中心に置かれると仮定することに留意されたい。対照的にピクセル幅が格子の周期性の倍数である場合、各々のピクセルはn個のピークと、n個のゼロを見ることができる。結果として、各々のピクセルによって検出される強度は同一であるように見えてよく、タルボ距離は全く測定されない場合がある。 First, it is assumed that the self-image is x 0 = p / 2 + mp, in which case m is centered on the pixel so that it is an arbitrary integer. Next, if the pixel width p is an odd multiple of 1/2 of the periodicity d of the lattice, then the pixel measuring the Talbot self-image may see n peaks and n-1 zeros. Pixels that can measure the inverted self-image can see n-1 peaks and n zeros. Note that this assumes that the peak from the self-image is centered on the pixel. In contrast, if the pixel width is a multiple of the periodicity of the grid, each pixel can see n peaks and n zeros. As a result, the intensities detected by each pixel may appear to be the same and the Talbot distance may not be measured at all.
一例において、n=1に設定することで、ピクセル幅は格子の周期性の1/2であり、各々のピクセルが1つのピークまたはゼロを測定することが有利であり得る。しかしながら格子310が、800nmより長い波長に関して伝播するゼロ及び第1回折次数のみを有する場合、格子の周期性は最大で1600nmであり得る。各々のピークまたはゼロの幅は、およそ800nmであってよく、対応する検出器320のピクセルピッチはおよそちょうど800nmであり、これは作製するのが難題である可能性がある。
In one example, by setting n = 1, the pixel width is half the periodicity of the grid, and it may be advantageous for each pixel to measure one peak or zero. However, if the
別の例では、n=2を設定し、1つのピクセルに対して自己像の1.5周期を適合させることができる。これは、最大でも2400nmのピクセル幅に相当してよく、これは現行のCMOS検出器における妥当なサイズである。 In another example, n = 2 can be set to fit 1.5 periods of self-image to one pixel. This may correspond to a pixel width of up to 2400 nm, which is a reasonable size for current CMOS detectors.
例えばタルボ効果の振幅を拡大するために、画像センサをx方向に移動させるなどによって、x0にわたって(すなわちタルボパターンからの撮像装置ピクセルの偏位)優れた制御を有することも有利であり得る。一方で、x0に関わらず、pがdの整数の倍数である場合、タルボ効果を観察することは難しい問題であり得る。p≠m(d/2)であり、この場合mが任意の整数であるケースでは、タルボ効果の測定される振幅は、検出器にわたって変動する場合がある。これは検出器に対する格子の位置の正確な制御が面倒である、または得られない場合に有利であってよく、その理由は、それが、一部の信号を検出することができることを保証することができるためである。 For example in order to enlarge the amplitude of the Talbot effect, such as by moving the image sensor in the x-direction, for x 0 (i.e. deviation of the imaging device pixels from Talbot pattern) may also be advantageous to have an excellent control. On the other hand, regardless of x 0 , when p is a multiple of an integer of d, it can be a difficult problem to observe the Talbot effect. In the case where p ≠ m (d / 2), where m is an arbitrary integer, the measured amplitude of the Talbot effect may vary across the detector. This may be advantageous when precise control of the grid position with respect to the detector is cumbersome or not available, because it ensures that it can detect some signals. This is because it can be done.
格子310とピクセルの周期性の間に所望される関係が得られない場合、格子310を入射ビームに対して回転させることで、有効な格子の周期性をdcosθまで低下させることができるが、これは格子の回折効率を変える場合がある。
If the desired relationship is not obtained between the
検出器の傾斜方向 Detector tilt direction
一例において、検出器320は、格子310の歯に対して平行に傾斜させることができる。別の例では、検出器320は、格子310の歯に直交するように傾斜させることができる。システム300の性能をさらに改善させるために、これら2つの構成の違いを研究することは有益であり得る。
In one example, the
図3Aにおいて、格子310の歯は、y軸にそって垂直方向に配向されており、検出器320は、x軸を中心として回転されて、各々の列に沿ったタルボ距離と、各々の行に沿った格子の周期性とを標本化する。検出器320が代わりにy軸の周りで傾斜された場合、この場合検出器は、各々の行に沿ってタルボ距離と、格子の周期性を同時に標本化するが、情報は各々の列に沿って全く収集されない。したがって、タルボ距離における強度が独立して標本化され、そのようなケースでは、計算を簡素化することができるため、最初の選択肢がより魅力的であり得る。
In FIG. 3A, the teeth of the
一例において、検出器320はx軸を中心として回転され、その後検出器320のy軸は、z=ytanθdetにおいてミッドフィールド回折パターンを標本化することができる。psinθdet<<zTの場合、測定されたタルボ信号のコントラストは、先のセクションにおいて導き出されたコントラストに匹敵し得る。検出器の傾斜が大きくなるにつれて、コントラストは小さくなる。psinθdet=zTの場合、コントラストはゼロであり得る。
In one example, the
別の例において、検出器320はy軸を中心として回転され、その後検出器320は、ラインsに沿ってミッドフィールド回折パターンを標本化することができ、この場合s=xcosθdet=zsinθdetである。したがってθdet=0の場合、検出器はx軸のみに沿って標本化することができ、θdet=90°の場合、検出器はz軸のみに沿って標本化することができる。xにおける有効なピクセル長はこの場合、peff=pcosθdetである。
In another example, the
このような傾斜によって、光照射野のピークとゼロが、ピクセルの特定の行に沿って1つのピクセルに相当することを可能にし、これにより検出されたタルボ信号を増大させることができる。例えば各々のピクセルに関して検出器320のところで光照射野にわたって統合することによって(この場合z=xtanθdetである)、検出器320の傾斜に応じて、信号のコントラストが相対的に大きな傾斜において増大し得ることを見ることができる。しかしながらθdetが0度または90度に近くない限り、検出器において測定される信号は、タルボ距離を関数として明らかに周期的にならない場合がある(この分析はまた、拡大された傾斜角において、場合によって低下する検出器の効率を考慮に入れていない)。
Such an inclination allows the peaks and zeros of the light field to correspond to one pixel along a particular row of pixels, thereby increasing the detected Talbot signal. For example, by integrating over the light field at the
タルボ型スペクトロメータの分解能 Talbot-type spectrometer resolution
上に記載したように、フーリエ変換を利用して、スペクトル情報を判定することができ、このようなケースでは、スペクトロメータ300の分解能は、検出器320が標本化する周期の数に左右される場合がある。スペクトロメータ300の帯域幅は、標本化の周波数に左右される場合があり、これは検出器320のピクセルピッチによって近似値を求めることができる。
As described above, the Fourier transform can be used to determine the spectral information, in such cases the resolution of the
検出器320は、デルタ関数の有限級数としてモデル化することができる。デルタ関数の間隔は、有効ピクセルピッチaに相当し、級数の長さは、ピクセルの数Nまたは検出器の長さによって決められる。このモデルは、大きな矩形関数が掛けられた一連のデルタ関数として表すことができる。フーリエ空間において、システムは、狭いsinc関数によって畳み込まれる間隔2π/aを有する一連のデルタ関数である(各々のピクセルの有限範囲は、ピクセルの有効面積がそのピッチに対して十分に小さければ無視され得る、フーリエドメイン内にsincに似たアポダイゼーションを生成する)。標本化窓は、検出器320の全体の長さであってよい。スペクトル分解能を判定することができるパラメータは、標本化窓の全体の長さ(または格子に対して垂直の方向に沿った撮像装置の長さ)と、フーリエドメイン内での標本化窓に対応付けられたsinc関数である。この標本化窓は、タルボ距離と比較して、極めて大きくてよい。
The
作動中、検出器320上の信号は、タルボ距離ZTを有する。この信号は、リアルな空間において検出器320に対して増倍され、そのためそれは、フーリエ空間内の検出器320と共に畳み込まれる。フーリエ空間内の−π/aから+π/aまでの1つの周期を考えると、搬送周波数kT=±2π/ZTにおいて2つのsinc関数が見られることが予測される。システムの帯域幅は、エイリアシングを回避するためにkT=π/aとして定義することができ、この作用の分解能は、sinc関数の幅によって判定することができる。
During operation, the signal on the
レーリー基準によると、次の分解可能なピークはsinc関数のゼロのところにある。N個の離散要素を有する中心にあるボックスの離散時間フーリエ変換(DTFT)は、sin(Ω(N/2+1/2))/sin(Ω/2)であり、この場合Ω=ωaである。したがってsincは、ω(N/2+1/2)=π/aにおいてゼロを有し、検出器320の各々の列におけるピクセルの数の関数である。
According to the Rayleigh criterion, the next decomposable peak is at zero in the sinc function. The Discrete Time Fourier Transform (DTFT) of the central box with N discrete elements is sin (Ω (N / 2 + 1/2)) / sin (Ω / 2), in which case Ω = ωa. Sinc therefore has zero at ω (N / 2 + 1/2) = π / a and is a function of the number of pixels in each column of the
有効ピクセル長は、z方向におけるピクセルの長さとして定義することができ、psin(θ)と等しく、この場合pは実際のピクセル長であり、θは、検出器320が垂直軸から傾斜される角度である。したがって分解能は、
![]()
である。
また帯域幅は、
![]()
である。
The effective pixel length can be defined as the length of the pixel in the z direction, equal to pin (θ), where p is the actual pixel length and θ is the tilt of the
![]()
Is.
And the bandwidth is
![]()
Is.
d≫λであり、dが格子310の周期であることを思い起こすと、近似zT=2d2/λを行うことができる。このようなケースでは、波長分解能は、
![]()
である。
Recalling that d >> λ and d is the period of the
![]()
Is.
最小の分解可能なフィーチャーは、pの増加に伴って低下するように思われるため、大きなピクセルサイズが望ましい場合がある。より長いピクセルサイズは、システム300がタルボ効果のより多くの周期を標本化することを可能にし得るため、これは道理にかなっている。しかしながらピクセルピッチpは、格子周期dによって制限される場合があり、格子周期dは、今度は動作波長λに左右される。非近軸領域において、格子周期dは、動作波長λに匹敵し、分解能は、数値的に解明することができる。
Larger pixel sizes may be desirable, as the smallest decomposable features appear to decrease with increasing p. This makes sense because the longer pixel size may allow the
図4A〜図4Bは、検出器の角度を関数とした、所与のピクセル長pと、格子周期dに関するタルボ型スペクトロメータの計算された分解能と帯域幅とを示す。これに加えて、帯域幅を近似なしで分析により解明することができる。
![]()
サブナノメータ分解能をシステム300において容易に達成することができることを見ることができる。2μmを超える帯域幅もまた実用的であり、これによりシステム300の電磁スペクトルの可視赤外放射域におけるスペクトル分析を含む種々の用途での利用を可能にする。
4A-4B show a given pixel length p and the calculated resolution and bandwidth of the Talbot-Lagoscope with respect to the grid period d, with the angle of the detector as a function. In addition to this, bandwidth can be elucidated by analysis without approximation.
![]()
It can be seen that sub-nanometer resolution can be easily achieved in
幾何学的議論を利用して、長さL及び幅Wの検出器に適合する格子サイズを決定することもできる。+1、0及び−1回折次数が重なる際、タルボ自己像305が生じる。但し、+1及び0回折次数が存在する、または−1及び0回折次数が存在するいずれかの場合、タルボ距離の測定はより確実なものになり得るが、信号の強度は、より脆弱になる可能性がある。
Geometric discussions can also be used to determine the grid size that fits the length L and width W detectors. When the +1, 0 and -1 diffraction orders overlap, the Talbot self-
最小格子サイズは、タルボ効果が検出器320の最も遠い地点においてちょうど終わるようなサイズとして規定することができる。このようなケースでは、格子サイズは、G=2Lsin(θ)tan(θdiff)であり、この場合θdiffは、ファーフィールド回折角である。理想的な格子サイズは、検出器320全体が、+1、0及び−1回折次数が全て存在する領域内にあるようなサイズとして規定することができる。このようなケースでは、格子サイズは、G=2(Lsinθ+W/(2tanθdiff))tanθdiffである。格子の最小の高さは、Lcosθであるが、実際には、エッジ効果を避けるためにこれより大きい場合がある。
The minimum grid size can be defined as the size such that the Talbot effect just ends at the farthest point of the
このような種々の制約式を用いて、特定の分解能を得るためのパラメータを判定することができる。ピクセル長及び格子周期は、最適な性能のために緊密に関連しているため、全ての制約は、ピクセル長の観点で表すことができる。 Using such various constraint equations, it is possible to determine the parameters for obtaining a specific resolution. All constraints can be expressed in terms of pixel length, as pixel length and grid period are closely related for optimal performance.
図5Aは、異なる分解能を達成するためにピクセルピッチを検出器の傾斜に関連付ける曲線を示す。格子の周期性は、d=2/3pであると推定される。図5Bは、このような分解能を達成するためのパラメータを有するシステムの対応する帯域幅を示す。dとGの所与の関係に関して、より小さなピクセルサイズを有する検出器を使用してより高い分解能を達成することができることを見ることができる。 FIG. 5A shows a curve that associates the pixel pitch with the tilt of the detector to achieve different resolutions. The periodicity of the lattice is estimated to be d = 2 / 3p. FIG. 5B shows the corresponding bandwidth of a system with parameters to achieve such resolution. It can be seen that higher resolution can be achieved using a detector with a smaller pixel size for a given relationship between d and G.
タルボ効果の一般化 Generalization of the Talbot effect
上記の分析は、その理想の形態(例えば平面波入射、対称のバイナリ格子)においてタルボ効果を利用する。非対称格子及び角感度などの実際の考慮すべき事柄を含め、タルボ効果の強靭さを調査することは有益であり得る。 The above analysis utilizes the Talbot effect in its ideal form (eg plane wave incident, symmetric binary grid). It may be useful to investigate the toughness of the Talbot effect, including actual considerations such as asymmetric grids and angular sensitivity.
非対称格子 Asymmetric grid
各々の回折次数の回折効率mは、Amによって提供することができる。非対称格子の場合、A1≠A-1である。3つの回折次数が干渉する格子の背後の照射野は、
である。
Diffraction efficiency m the diffraction order of each can be provided by A m. In the case of an asymmetric lattice, A 1 ≠ A -1 . The irradiation field behind the grid where the three diffraction orders interfere is
Is.
照射野の振幅Amが実際であると仮定すると、照射野の強度は、
である。
Assuming that the amplitude Am of the irradiation field is actual, the intensity of the irradiation field is
Is.
照射野の強度は、zにおいてなおも周期的であり、zTの周期を伴う。上記で考察した対称的な格子の場合(この場合A1=A-1である)、自己像は、一定の横方向の位置に留まる。一方で完全に非対称の格子の場合、この場合A1(またはA-1)は、ゼロであり、他方の項はゼロ以外であり、自己像は、それらがz方向に伝播するにつれてx方向にシフトする。 Intensity of the radiation field are still periodic in z, involving cycles of z T. In the case of the symmetric grid considered above (in this case A 1 = A- 1 ), the self-image remains in a fixed lateral position. On the one hand, for a completely asymmetric grid, in this case A 1 (or A- 1 ) is zero, the other term is non-zero, and the self-image is in the x direction as they propagate in the z direction. shift.
1=A0 2+A1 2+A-1 2という制約を伴って、コサイン項を最大化するためには、A1=A-1=1/2である限り、A0は1/√2であってよい。コサインの振幅はこのとき√2であり、サイン項は0になる。DC項は1に等しく、そのためDCバックグラウンドに対するタルボ効果の比は√2である。これを達成するには、完全なコサイン格子が望ましい場合がある。 To maximize the cosine term with the constraint of 1 = A 0 2 + A 1 2 + A- 1 2 , A 0 is 1 / √2 as long as A 1 = A- 1 = 1/2. It may be there. The amplitude of the cosine is √2 at this time, and the sine term becomes 0. The DC term is equal to 1, so the ratio of the Talbot effect to the DC background is √2. A complete cosine grid may be desirable to achieve this.
サイン項を最大化するために、A0=1/√2、及びA1=1/√2、及びA-1=0を有する完全に非対称の格子が有益であり得る(A1とA-1は相互に入れ替え可能である)。これは、コサイン項が、1の振幅を有し、サイン項が1の振幅を有することを意味している。DC項もまた1に等しい。したがってタルボ効果から測定された信号は、最適な対称的な格子を伴う場合により大きくなり得る。しかしながら最適化されない回折格子を仮定すると、回折効果は、入射の角度に応じて変化し得る。タルボ信号は、ビームに対する角度の向きを調節することによって改善することができる。
To maximize
角感度 Angular sensitivity
タルボ効果に関する上記の分析は、入射光が完璧な平面波であると仮定している。実際には、光源は完全に平行化されない場合もあり、そのためビームの角度付きの拡散に対するタルボ効果の感度を調査することが有益であり得る。特定の理論に拘泥することなく、タルボ効果のレーリー卿の定理の展開からの洞察は、自己像が0番目の回折次数ビームの方向に向いていることを示唆している。これは、格子において位相exp(-jφ)を適用することによってシミュレートすることができ、この場合φは入射の角度である。このシミュレーションは、自己像を特定の角度で傾斜させることができることを示している。より高い回折次数を有する領域では、自己像の内のテクスチャ組織を観察することができる。 The above analysis of the Talbot effect assumes that the incident light is a perfect plane wave. In practice, the light sources may not be perfectly parallelized, so it may be useful to investigate the sensitivity of the Talbot effect to the angled diffusion of the beam. Without being bound by any particular theory, insights from the development of Sir Rayleigh's theorem of the Talbot effect suggest that the self-image points in the direction of the 0th diffraction order beam. This can be simulated by applying the phase exp (-jφ) in the grid, where φ is the angle of incidence. This simulation shows that the self-image can be tilted at a specific angle. In the region with higher diffraction order, the texture structure in the self-image can be observed.
k−空間(すなわち波数ベクトル空間)において、回折媒質において伝播するビームに関するkの成分の有効な組み合わせは、球体の表面によって表すことができ、その原点は伝播するkベクトルの値に位置決めされる。例えばビームが
![]()
![]()
格子は、伝播するビームが有することができるkx値に対して制約を与える。結果として、ビームは特定のkzを有することができ、これは実際にタルボ距離に相当する。しかしながら格子に対して角度を成す入射のビームの場合、円の原点は、別の場所であってよく、同一のkx制約は、回折ビームがkzに関して2つの異なる値を有するようにすることができる。入射ビームが特定の範囲の角度を有する場合、回折ビームは、特定の範囲のkzを有することができ、そのためタルボ画像は一緒になってぼやけ始める場合があり、これによりミッドフィールド回折パターンから何らかの情報を引き出すことを難しくする。 The grid constrains the kx value that the propagating beam can have. As a result, the beam can have a specific k z, which corresponds to the actual Talbot distance. However, for incident beams that are at an angle to the grid, the origin of the circle may be at a different location, and the same k x constraint allows the diffracted beam to have two different values with respect to k z. Can be done. If the incident beam has an angle in a specific range, the diffraction beam may have a k z in a specific range, therefore Talbot image may begin to blur together, thereby some of midfield diffraction pattern Make it difficult to retrieve information.
平行化されない光源を有するシステムの挙動をよりよく理解するために、格子が特定の受容角を有するように任意の距離だけ離れた点光源によって格子を照らすことができる(例えばシミュレーションにおいて)。受容角は、格子の縁部に対して点光源が形成する通常の入射からの角度として規定することができる。光源が小さく、そのため反応が1つの点光源によって表される場合があることをさらに想定することができる。小さな受容角の場合、複数の点光源を有することは、検出されるパターンに大きく影響を与えることはないことがわかるが、これは、格子の位相面が、各々の点光源に関してほとんど同一であるように見えるためである。 To better understand the behavior of systems with non-parallelized light sources, the grid can be illuminated by point light sources at arbitrary distances so that the grid has a particular receiving angle (eg in a simulation). The receiving angle can be defined as the angle from the normal incident formed by the point light source with respect to the edge of the grid. It can be further assumed that the light source is small and therefore the reaction may be represented by a single point light source. For small reception angles, it can be seen that having multiple point sources does not significantly affect the detected pattern, which is because the phase planes of the grid are almost identical for each point source. Because it looks like.
図6A〜図6Dは、およそ2〜5度の異なる受容角を有するタルボ型スペクトロメータの計算された性能を示している。図6Aは、10度の受容角を有する格子の場合のタルボ自己像の拡大撮影した画像を示す。このレベルでは、目によってすぐに明らかになる違いはない。図6Bから図6Dは、0度、4度及び10度の受容角を想定するシミュレートされた回折パターンのFFTを示している。 6A-6D show the calculated performance of Talbot-type spectrometers with different reception angles of approximately 2-5 degrees. FIG. 6A shows a magnified image of the Talbot self-image in the case of a grid having a reception angle of 10 degrees. At this level, there is no immediate difference between the eyes. 6B to 6D show FFTs of simulated diffraction patterns assuming acceptance angles of 0, 4 and 10 degrees.
図7A〜図7Dは、タルボ型スペクトロメータにおいておよそ2〜5度の分散角を有する平行化されない入射光ビームに関する計算された分解能の限界を示す。図7Aは、10度の受容角を有する格子の場合のタルボ自己像の拡大撮影した画像を示す。自己像のはっきりとしたゆがみの形成が目に見える。図7Bは、様々な受容角を有するN=500(すなわち周期の数)の格子に関する分解能を示す。このデータは、格子の中心付近の1つの列のピクセルのフーリエ変換から取得される。図7Cは、格子及び検出器のサイズを関数とした分解能の限界を示す。図7Dは、格子サイズを関数とした分解能の限界を示す。同一地点では、分解能は、格子のサイズによってもはや決められるのではなく、代わりに受容角によって決められることを示している。 7A-7D show the calculated resolution limits for a non-parallelized incident light beam with a dispersion angle of approximately 2-5 degrees in a Talbot-type spectrometer. FIG. 7A shows a magnified image of the Talbot self-image in the case of a grid having a reception angle of 10 degrees. The formation of a clear distortion of the self-image is visible. FIG. 7B shows the resolution for a grid of N = 500 (ie, the number of cycles) with various acceptance angles. This data is obtained from the Fourier transform of one column of pixels near the center of the grid. FIG. 7C shows the limit of resolution with the size of the grid and the detector as a function. FIG. 7D shows the limit of resolution with the grid size as a function. At the same point, the resolution is no longer determined by the size of the grid, but instead by the angle of acceptance.
図6A〜図6D及び図7A〜図7Dから、受容角が増大すると、波長ピークの幅が増大し得ることを見ることができる。詳細には、ピークは、より短い波長に向かって広くなる傾向がある。検出器の面全体のFFT画像は、球面波からの反応が明確に規定されることを示している。したがって、画像を修正することで、球面の位相面を取り除き、これによりFFT信号のピーク幅を縮小することが可能であり得る。 From FIGS. 6A-6D and 7A-7D, it can be seen that as the acceptance angle increases, the width of the wavelength peak can increase. In particular, the peaks tend to widen towards shorter wavelengths. The FFT image of the entire surface of the detector shows that the reaction from the spherical wave is clearly defined. Therefore, by modifying the image, it may be possible to remove the phase plane of the spherical surface, thereby reducing the peak width of the FFT signal.
非近軸領域におけるタルボ型スペクトロメータの実験に基づく調査 Investigation based on experiments of Talbot-type spectrometer in non-paraxial region
非近軸領域におけるタルボ型スペクトロメータの実験に基づく調査は、2つのタルボ型スペクトロメータを利用する。第1のスペクトロメータは、格子周期d=1.6077ミクロンを有する透過型位相格子(例えばIbsen Photonicsによって製造される)を含む。検出器は、ピクセルピッチp=2.2ミクロンを有するモノクロームCMOS撮像センサ(例えばAptina MT9P031)を含む。検出器は、2592×1944ピクセルと、5.70mm(H)×4.28mm(V)の有効撮像装置サイズを有する。検出器の頂部は、マイクロレンズアレイであり、ガラス窓によって保護されている。検出器はまた、撮像ソースからの読み取りボードを含む。 Experimental-based studies of Talbot-type spectrometers in the non-paraxial region utilize two Talbot-type spectrometers. The first spectrometer includes a transmissive phase grid (eg, manufactured by Ibsen Photonics) having a grid period d = 1.6077 microns. The detector includes a monochrome CMOS image sensor (eg, Aptina MT9P031) having a pixel pitch p = 2.2 microns. The detector has an effective imager size of 2592 x 1944 pixels and 5.70 mm (H) x 4.28 mm (V). The top of the detector is a microlens array, protected by a glass window. The detector also includes a reading board from the imaging source.
第2のスペクトロメータは、格子周期d=1.035ミクロンを有する透過型格子(例えばこれもまたIbsen Photonicsからの)を利用する。検出器は、ピクセルピッチp=1.67ミクロンを有するモノクロームCMOS撮像センサ(例えばAptina MT9J003)を含む。検出器は、3872×2764ピクセルと、6.440mm(H)×4.616mm(V)の有効撮像装置サイズを有する。上に記載したように、タルボ信号は、1.11ミクロンの周期を有する格子の場合に最大であってよく、0.835または1.67ミクロンの周期を有する格子の場合、タルボ信号は全く検出されない場合がある。この第2のスペクトロメータは、以下に記載するようにサブナノメータの分解能を達成する。 The second spectrometer utilizes a transmissive grid (eg, also from Ibsen Photonics) with a grid period d = 1.035 microns. The detector includes a monochrome CMOS image sensor (eg, Aptina MT9J003) having a pixel pitch p = 1.67 microns. The detector has an effective imager size of 3872 × 2764 pixels and 6.440 mm (H) × 4.616 mm (V). As mentioned above, the Talbot signal may be maximal for grids with a period of 1.11 microns, and for lattices with a period of 0.835 or 1.67 microns, the Talbot signal is completely detected. It may not be done. This second spectrometer achieves sub-nanometer resolution as described below.
2つのケースにおいて、チューナブルTi:サファイアレーザまたは固定波長レーザが、単一モードファイバに結合され、平行化された出力が、10×ビームエクスパンダ(例えばThorlabs GBE10−B)に通される。最終的な平行化されたビームは、直径が3cmを上回り、格子に対して垂直に入射する。撮像される領域がタルボ区域内であることを保証するために、撮像装置の一方の縁部は、格子にかろうじて触れるように位置決めされる。イメージセンサの最も遠い地点は、格子表面の頂部から6mm未満であってよい。 In two cases, a tunable Ti: sapphire laser or fixed wavelength laser is coupled to a single mode fiber and the parallelized output is passed through a 10x beam expander (eg Thorlabs GBE10-B). The final parallelized beam is larger than 3 cm in diameter and is incident perpendicular to the grid. To ensure that the area to be imaged is within the Talbot area, one edge of the imaging device is positioned to barely touch the grid. The farthest point of the image sensor may be less than 6 mm from the top of the grid surface.
図8A〜図8Dは、第1のスペクトロメータを利用して取得した実験結果のデータ処理を例示している。図8Aは、818.20nmの波長で検出器から取得した画像を示している。検出器は、格子に対して45度の傾斜で配置される。上部左手の角にある三角形は、全ての3つの回折次数が存在する領域である。それはまたタルボ効果が存在する領域でもある。図8Bは、検出器の各々の列(または図8Aに示される画像の行)に沿って取得した1D−FFTの結果を示している。およそ1300nmの波長に相当するラインが、画像の上部半分に現れており、ここにタルボ自己像が存在する。図8Cは、検出器の全ての列にわたる1D−FFTデータの平均値を示している。図8Dは、この周波数ドメインにおいて非対称性を見せる画像の2D−FFTを示す。2D−FFT画像におけるピーク特徴は、1D−FFT画像上にマップする。 8A-8D illustrate the data processing of experimental results acquired using the first spectrometer. FIG. 8A shows an image taken from the detector at a wavelength of 818.20 nm. The detector is arranged at an inclination of 45 degrees with respect to the grid. The triangle in the upper left corner is the area where all three diffraction orders are present. It is also the area where the Talbot effect exists. FIG. 8B shows the results of the 1D-FFTs obtained along each column of the detector (or the row of images shown in FIG. 8A). A line corresponding to a wavelength of approximately 1300 nm appears in the upper half of the image, where the Talbot self-image is present. FIG. 8C shows the average value of 1D-FFT data across all columns of detectors. FIG. 8D shows a 2D-FFT of an image showing asymmetry in this frequency domain. Peak features in the 2D-FFT image are mapped onto the 1D-FFT image.
図8A〜図8Dに示されるように、取得したタルボ画像の分析は、各々の検出器の列の1DFFTを含むことができ、その後全ての列の平均値を採ることで、1DFFT信号におけるノイズを削減することができる。FFTデータのx軸をkzからλに変換するために、式(13)を使用することができる。
![]()
![]()
高速フーリエ変換を画像の各々の列に沿って採用する際、ピークを入射光の波長に対応するように特定することができる。測定される波長の分解能は、検出器の角度と共に増大するが、これは検出器がタルボ効果のより多くの周期を標本化することが可能になるためである。 When the Fast Fourier Transform is adopted along each column of the image, the peak can be specified to correspond to the wavelength of the incident light. The resolution of the measured wavelength increases with the angle of the detector because it allows the detector to sample more periods of the Talbot effect.
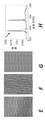
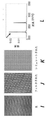
図9A〜図9Lは、異なる角度で傾斜した検出器を有する第2のスペクトロメータ(d=1.035ミクロン、p=1.67ミクロン)を利用した、生画像、バンドパスフィルタ後のフィルタ画像、シミュレートされた画像及び対応するスペクトルを示す。図9A〜図9Dは、6度傾斜された検出器による、生画像(図9A)、バンドパスフィルタ後の画像(図9B)、シミュレートされた画像(図9C)、及び対応するスペクトル(図9D;100列のサブセクションについて取得された)を示す。図9E〜図9Hは、12度傾斜された検出器による、生画像(図9E)、バンドパスフィルタ後の画像(図9F)、シミュレートされた画像(図9G)及び対応するスペクトル(図9H)を示す。図9I〜図9Lは、21度傾斜された検出器による、生画像(図9I)、バンドパスフィルタ後の画像(図9J)、シミュレートされた画像(図9K)及び対応するスペクトル(図9L)を示す。動作波長は、830.15nmである。矢印はメインピークを指している。画像中で、x及びz軸は、行及び列にそれぞれ沿っている。 9A-9L are raw images and filter images after bandpass filtering using a second spectrometer (d = 1.035 micron, p = 1.67 micron) with detectors tilted at different angles. , A simulated image and a corresponding spectrum. 9A-9D show the raw image (FIG. 9A), the image after bandpass filtering (FIG. 9B), the simulated image (FIG. 9C), and the corresponding spectrum (FIG. 9C) from the detector tilted by 6 degrees. 9D; obtained for subsections in column 100) is shown. 9E-9H show the raw image (FIG. 9E), the image after bandpass filter (FIG. 9F), the simulated image (FIG. 9G) and the corresponding spectrum (FIG. 9H) by the detector tilted 12 degrees. ) Is shown. 9I-9L show the raw image (FIG. 9I), the image after bandpass filter (FIG. 9J), the simulated image (FIG. 9K) and the corresponding spectrum (FIG. 9L) by the detector tilted 21 degrees. ) Is shown. The operating wavelength is 830.15 nm. The arrow points to the main peak. In the image, the x and z axes are along the rows and columns, respectively.
図9A、図9E及び図9Iは、生画像における自画像の周期的パターンを示す。簡素なバンドパスフィルタを適用して、画像の2Dフーリエ変換における主要な周波数成分を隔離した後、図9B、図9F及び図9Jにおいて自己像をはっきりと見ることができる。バンドパスフィルタは、DCバックグラウンド成分、及び撮像装置自体における望ましくない人工物から生じる場合のある偽ピークを除去することができる。示される全ての画像は、画像全体の50ピクセルx50ピクセルのサブセクションである。 9A, 9E and 9I show the periodic pattern of the self-portrait in the raw image. After applying a simple bandpass filter to isolate the major frequency components in the 2D Fourier transform of the image, the self-image can be clearly seen in FIGS. 9B, 9F and 9J. Bandpass filters can remove DC background components and false peaks that may result from unwanted artifacts in the imager itself. All images shown are 50 pixels x 50 pixels subsections of the entire image.
図9D、図9H及び図9Lに示されるスペクトルを得るために、フルレングスの画像の100列のサブセクションを使用して、フーリエ変換を実行する。撮像装置の異なる列に関してピークの中心周波数にはわずかなずれが存在しており、これは入力の波面収差によって、または撮像用途に関する主光線角度補正のために撮像装置にわたる不均一なマイクロレンズアレイによって生じる可能性がある。信号の1D FFTが、このサブセクションにおける各々の検出器の列に沿って取得され、その後FFTのマグニチュードの平均値が取得されてノイズを削減する。 A Fourier transform is performed using 100 columns of subsections of a full-length image to obtain the spectra shown in FIGS. 9D, 9H and 9L. There is a slight deviation in the center frequency of the peaks for different rows of imagers, either due to input wavefront aberrations or due to non-uniform microlens arrays across the imager for principal ray angle correction for imaging applications. It can occur. A 1D FFT of the signal is obtained along the sequence of each detector in this subsection, after which the average magnitude of the FFT is obtained to reduce noise.
図9A〜図9Lにおける実験結果は、理論上のモデルと概ね一致する。図9D、図9H及び図9Lに示されるスペクトルは各々2つのメインピークを含んでおり、これらは、この実験において撮像されたパターンの回転によって説明されてよい。回折パターンは、cos(ax)cos(bz)の形態である。撮像装置が小さな角度φだけ回転される状況下では、照射野の画像はこのとき、z方向に2つの空間周波数を呈する、すなわちb(1-φ)±aφ。したがって撮像装置の列に沿った信号の測定は、予測される波長に近い2つのピークを有するスペクトルを生成することができる。いかなる特定の理論によっても、またはいかなる特定の作動の態様によっても束縛されずに、回転した回折パターンは、格子と撮像装置がx−y面内で互いからわずかに回転され、そのため撮像装置の列が格子の溝と完璧に平行にならない場合があるという可能性によって生じる可能性がある。 The experimental results in FIGS. 9A-9L are generally in agreement with the theoretical model. The spectra shown in FIGS. 9D, 9H and 9L each contain two main peaks, which may be explained by the rotation of the pattern imaged in this experiment. The diffraction pattern is in the form of cos (ax) cos (bz). Under the condition that the image pickup device is rotated by a small angle φ, the image of the irradiation field then exhibits two spatial frequencies in the z direction, that is, b (1-φ) ± aφ. Therefore, measurement of a signal along a row of imagers can produce a spectrum with two peaks close to the expected wavelength. Unconstrained by any particular theory or by any particular mode of operation, the rotated diffraction pattern causes the grid and the imager to rotate slightly from each other in the xy plane, thus the sequence of imager. Can be caused by the possibility that may not be perfectly parallel to the grooves in the grid.
図9D、図9H及び図9Lに示されるスペクトルにおいて測定される波長もまた、830.15nmにおける動作波長からわずかに外れる。これは1つには上記で考察したように観察される回折パターンの回転が原因であるが、ビームの入射の角度に対するピーク位置の高い感度のためでもあり得る。予想される波長における偏差は、一セットの測定値に関して一定であるため(例えば図11を参照されたい)、波長の正確な検出は、スペクトロメータを較正することによって達成することができる。 The wavelengths measured in the spectra shown in FIGS. 9D, 9H and 9L also deviate slightly from the operating wavelength at 830.15 nm. This is partly due to the rotation of the diffraction pattern observed as discussed above, but also due to the high sensitivity of the peak position to the angle of incidence of the beam. Accurate detection of wavelengths can be achieved by calibrating the spectrometer, as the deviations at the expected wavelengths are constant with respect to a set of measurements (see, eg, FIG. 11).
図9D、図9H及び図9Lにおけるピーク自体はまた、低カメラ傾斜角に関して小さい分裂を有する。これはたいがい、入射ビームが格子に対して完璧に直角ではないことがその理由である。x方向における直角以外の入射は、+1及び−1ビームに関してわずかに異なる回折角となる可能性があり、これにより、それらが0番目の回折ビームと干渉する際、2つのわずかな差zSI が生じることになるであろう。+1及び−1ビームも互いに干渉する場合があるが、zにおける周期性は、zSIよりずっと大きくなるため、それは無視される場合もある。小さいな角度の入射に関するピーク分裂の範囲と、波数ベクトルのx成分、kxとの関係は、およそ、
![]()
であり、この場合、kg=2π/dは、格子ベクトルであり、λpは中心波長であり、λ±は2つの分割したピークの波長である。幾何学的理由のために、θdetは、このピーク分裂が観察されるかどうかに影響を及ぼす。
The peaks themselves in FIGS. 9D, 9H and 9L also have small splits with respect to the low camera tilt angle. This is usually because the incident beam is not perfectly perpendicular to the grid. Non-right angle incidents in the x direction can result in slightly different diffraction angles for the +1 and -1 beams, which results in two slight differences zSI when they interfere with the 0th diffraction beam. Will be. The +1 and -1 beams may also interfere with each other, but they may be ignored because their periodicity at z is much greater than at z SI. The relationship between the range of peak splitting with respect to the incident at a small angle and the x component of the wave vector, kx, is approximately.
![]()
In this case, kg = 2π / d is the lattice vector, λ p is the center wavelength, and λ ± is the wavelength of the two divided peaks. For geometric reasons, θ det influences whether this peak splitting is observed.
小さいθdetの場合、撮像装置は、3つの回折次数(−1、0、1)の全てが存在する領域をおおかた標本化することができ、そのため2つのzSIを測定することができ、式(14)に従ってピーク分裂を観察することができる。大きなθdetの場合、撮像装置は、3つの回折次数(±1、0)のうちの2つが存在する領域をおおかた標本化することができる。画像のサブセクションを利用する場合、1つのZSIが測定され、ピーク分裂は全く観察されない。ピークの小さい分裂は、獲得され得る分解能を制限する場合がある。図9Dにおいて、ピークはおよそ3nmだけ分割され、これは0.03度の入射角に相当する。しかしながら修正された格子を利用することによって、または0と1(または−1)の回折次数のみが存在するより高い入射角で作動することによってこの問題に対処する場合もある。一例では、格子は、+1次と比べて−1次に関して極めて小さい回折を有するように(または−1次に比べて+1次に関して極めて小さい回折を有するように)修正することができる。別の例では、十分に大きな回折を利用して、回折次数の全てが同時に重なる問題を緩和することができる。 For small θ det , the imager can roughly sample the region where all three diffraction orders (-1, 0, 1) are present, so that two z SIs can be measured and the equation. Peak splitting can be observed according to (14). In the case of a large θ date , the image pickup apparatus can roughly sample the region where two of the three diffraction orders (± 1, 0) are present. When utilizing the subsections of the image, one Z SI is measured and no peak splitting is observed. Small peak splits may limit the resolution that can be obtained. In FIG. 9D, the peak is split by approximately 3 nm, which corresponds to an incident angle of 0.03 degrees. However, this problem may be addressed by utilizing a modified grid or by operating at a higher angle of incidence where only 0 and 1 (or -1) diffraction orders are present. In one example, the grid can be modified to have very small diffraction with respect to -1st order compared to +1 order (or to have very small diffraction with respect to +1 order compared to -1st order). In another example, sufficiently large diffraction can be utilized to alleviate the problem of overlapping diffraction orders at the same time.
図10は、検出器の角度を関数としたタルボ型スペクトロメータの計算された実験による分解能を示している。動作波長は830.15nmである。図10における差し込み図は、θdet=20度における第2のスペクトロメータシステムを用いて実現された2つの組み合わされたレーザ源のスペクトルを示している。固定波長レーザは、829.95nmで作動し、チューナブルレーザは829.05nmである。スペクトロメータは、0.9nm離れた波長をはっきりと分解することができる。 FIG. 10 shows the calculated experimental resolution of a Talbot-Lagoscope with the angle of the detector as a function. The operating wavelength is 830.15 nm. The inset in FIG. 10 shows the spectra of two combined laser sources realized using a second spectrometer system at θ det = 20 degrees. Fixed wavelength lasers operate at 829.95 nm and tunable lasers are 829.05 nm. The spectrometer can clearly decompose wavelengths separated by 0.9 nm.
分解能は、ピークの半値全幅(FWHM)を見つけることによって判定することができる。図10に示されるように、より大きな格子周期を有するスペクトロメータは、理論上の分解能に近い実験による分解能を示す。より小さい格子周期を有するスペクトロメータは、正確な傾向を示すが、ピーク分割が理由で低いθdetにおいては予測されるものより低い分解能を有する。 The resolution can be determined by finding the full width at half maximum (FWHM) of the peak. As shown in FIG. 10, a spectrometer with a larger lattice period exhibits experimental resolution close to theoretical resolution. Spectrometers with smaller grid periods show an accurate trend, but have lower resolution than expected at low θ det due to peak splits.
図10はまた、2つの(互いに非干渉性の)レーザからの光を同時に分解することができることも示している(図10における挿入図を参照されたい)。50/50の光ファイバ結合器が使用されて、829.95nmで作動する固定波長ダイオードレーザからの光を、チューナブルレーザから光と交わらせる。組み合わされた光は平行化され、ビームエクスパンダに通される。 FIG. 10 also shows that light from two (non-interfering with each other) lasers can be decomposed simultaneously (see inset in FIG. 10). A 50/50 fiber optic coupler is used to cross the light from a fixed wavelength diode laser operating at 829.95 nm with the light from a tunable laser. The combined light is parallelized and passed through the beam expander.
図11Aは、1.035ミクロンの格子周期dと、1.67ミクロンのピクセルピッチと、20度の格子とセンサの角度(θdet)とを有するスペクトロメータを利用して得られた、レーザが10nmのステップサイズにおいて780から950nmまで掃引される際に測定されるスペクトルを示している。スペクトルが2つのピークを示す際、データは、青い方のピークに正規化される。図11Bは、測定された波長と、実際のレーザ波長との比例関係を示すグラフを示している。 FIG. 11A shows a laser obtained using a spectrometer with a grid period d of 1.035 microns, a pixel pitch of 1.67 microns, and a grid of 20 degrees and a sensor angle (θ det). The spectra measured when swept from 780 to 950 nm at a step size of 10 nm are shown. When the spectrum shows two peaks, the data is normalized to the blue peak. FIG. 11B shows a graph showing the proportional relationship between the measured wavelength and the actual laser wavelength.
理論では、第2のスペクトロメータ(d=1.035ミクロン、p=1.67ミクロン、θdet=20度)は、およそ520nmから1.03ミクロンまでの波長を測定することができる。より低い範囲は、第2の回折次数が存在し始める波長であってよく、より高い範囲は、エイリアシングが生じるまでの波長であってよい。実験データは、第2のスペクトロメータが、少なくとも170nmの動作スパン(より短い波長におけるTi:サファイアレーザの範囲、及びより長い波長における撮像装置の感度によって制限される)と、1nm未満の分解能を達成することができることを示している。 In theory, the second spectrometer (d = 1.035 microns, p = 1.67 microns, theta det = 20 degrees) can measure the wavelength of approximately 520nm to 1.03 microns. The lower range may be the wavelength at which the second diffraction order begins to exist, and the higher range may be the wavelength until aliasing occurs. Experimental data show that the second spectrometer achieves an operating span of at least 170 nm (limited by the Ti: sapphire laser range at shorter wavelengths and the sensitivity of the imager at longer wavelengths) and a resolution of less than 1 nm. It shows that it can be done.
図11Bは、測定された波長(λ)とレーザ波長(λ0)の関係が、およそλ[nm]=0.96λ0[nm]+34[nm]であることを示している。950nmラインに関するバックグラウンドのノイズが顕著に高いのは、より長い波長において撮像装置の感度が低下するためである。820nmラインに関するバックグラウンドノイズが高いのは、偽ピークにおけるより大きな信号出力のためである。 FIG. 11B shows that the relationship between the measured wavelength (λ) and the laser wavelength (λ 0 ) is approximately λ [nm] = 0.96λ 0 [nm] + 34 [nm]. The background noise for the 950 nm line is significantly higher because the sensitivity of the imager is reduced at longer wavelengths. The high background noise for the 820 nm line is due to the larger signal output at the false peaks.
上に記載した実験データは、高い分解能を有するコンパクトなスペクトロメータを構築するために、非近軸タルボ効果を分散機構として使用することができることを示している。また、そのようなスペクトロメータの分解能に対する空間的非干渉性の影響を調査することも有利であり得る。理論上の特徴は、タルボ型スペクトロメータに関する格子上の極線及び方位角方向にわたる入射角の広がりを有する光ビームを利用して遂行することができる。 The experimental data described above show that the non-paraxial Talbot effect can be used as a dispersion mechanism to build a compact spectrometer with high resolution. It may also be advantageous to investigate the effect of spatial incoherence on the resolution of such spectrometers. A theoretical feature can be accomplished by utilizing a light beam with polar lines on the grid for the Talbot-type spectrometer and a spread of incident angles over the azimuth direction.
図12A〜図12Cは、シミュレーションモデルを示している。図12Aは、垂直入射の下での格子による波数ベクトルの散乱を示しており、図12Bは、斜め入射の下での格子による波数ベクトルの散乱を示している。図12Cは、格子表面上での入射角の広がりを示している。 12A-12C show simulation models. FIG. 12A shows the wave vector scattering by the grid under vertical incidence, and FIG. 12B shows the wave vector scattering by the grid under oblique incidence. FIG. 12C shows the spread of the angle of incidence on the surface of the grid.
図12A〜図12Cに見られるように、0番目の次数の回折ビームを有する+1次回折ビームと、−1次回折ビームの干渉によりタルボ波ベクトルkTが生じる。斜め入射ビームは、垂直入射の場合と比べて、タルボ波ベクトルkTにずれが生じる場合があり、このずれは、θ(x−z面内)と、φ(y−z面内)の両方に依存する。入射ビームが角度広がりを有する場合、このずれの事実上の集合は、kTをぼやけさせ、スペクトロメータの分解能を低下させる場合がある。格子によって取り込まれる波ベクトルの偏向の非対称性により、スペクトロメータの有効な分解能は、θ広がりと、φ広がりに関して別々に影響を被る。 As seen in FIGS. 12A to 12C, the Talbot wave vector k T is generated by the interference between the + 1st order diffracted beam having the 0th order diffracted beam and the -1st order diffracted beam. The obliquely incident beam may have a deviation in the Talbot wave vector k T as compared with the case of vertical incident, and this deviation is both in θ (in the x−z plane) and φ (in the y—z plane). Depends on. If the incident beam has an angle spread, virtually set on the this displacement, blurs k T, which may reduce the resolution of the spectrometer. Due to the asymmetry of the deflection of the wave vector captured by the grid, the effective resolution of the spectrometer is affected separately with respect to θ spread and φ spread.
図12Dは、30°のカメラ傾斜角に関するθ広がり及びφ広がりを関数として計算された有効分解能を示している。垂直入射の下での分解能は、λ=830nmにおいて0.5nmを下回る。このグラフは、この理想モデルにおいて分解能を1ナノメータ前後に維持するために、角度広がりθは1度前後の範囲内になるように、φは1度の百分の1前後の範囲内になるように制限され得ることを示唆している。タルボットスペクトロメータに関するθ広がり及びφ広がりに対する有効分解能の依存性のこのような非対称性は、従来のスペクトロメータのものと同様であり、この場合スペクトロメータの分解能は、1D格子からの非対称性の分散に起因してスリットの長さ方向より、スリットの幅方向にわたってより感度が高くなる。 FIG. 12D shows the effective resolution calculated by using the θ spread and the φ spread as a function with respect to the camera tilt angle of 30 °. The resolution under vertical incidence is below 0.5 nm at λ = 830 nm. In this graph, in order to maintain the resolution around 1 nanometer in this ideal model, the angular spread θ should be within the range of around 1 degree, and φ should be within the range of around 1/100 degree. It suggests that it can be limited to. Such asymmetry of the effective resolution dependence on the Talbot spectrometer for θ spread and φ spread is similar to that of conventional spectrometers, in which case the resolution of the spectrometer is the dispersion of the asymmetry from the 1D grid. Due to this, the sensitivity becomes higher in the width direction of the slit than in the length direction of the slit.
高い分解能に加えて、本明細書に記載されるタルボ型スペクトロメータはまた、大抵のスペクトル信号を測定するために大きなエテンデュ(etendue)を有することもできる。従来のスペクトロメータは、10-4から10-3mm2ほどのエテンデュを有することができる。上に記載した2つのタルボットスペクトロメータは、およそ1.3×10⁻⁴mm2のエテンデュを有することでき、これは1nmの分解能に関して、21度の傾斜角と、x方向に0.007度及びy軸方向に0.5度の受容角許容値を有する第2のスペクトロメータを利用して推定されている。これはzSIにおける非垂直入射の作用を計算することによって行うことができる。したがって、信号が最初に平行化されるならば、ほとんどの近赤外線(NIR)感知用途に関して本明細書に記載されるタルボットスペクトロメータを使用することができることが予測される。 In addition to the high resolution, the Talbot-type spectrometers described herein can also have a large etendue for measuring most spectral signals. Conventional spectrometers can have an etendu of as much as 10-4 to 10-3 mm 2. The two Talbot spectrometers described above can have an etendu of approximately 1.3 × 10 -4 mm 2 , which has a tilt angle of 21 degrees and 0.007 degrees in the x direction with respect to a resolution of 1 nm. Estimated using a second spectrometer with a tolerance of 0.5 degrees in the y-axis direction. This can be done by calculating the effect of non-vertical incidence on z SI. Therefore, it is expected that the Talbot spectrometers described herein can be used for most near infrared (NIR) sensing applications if the signal is first parallelized.
結論 Conclusion
種々の進歩的実施形態が本明細書に記載され例示されてきたが、当業者は、機能を果たす、及び/または結果を得るための多様な種類の他の手段及び/または構造及び/または本明細書に記載される1つまたは複数の利点、ならびに本明細書に記載される進歩的実施形態の範囲内にあると思われるそのような変形形態及び/または修正形態の各々を容易に想像するであろう。より一般的には、当業者は、本明細書に記載される全てのパラメータ、寸法、材料及び構成が例示であることを意味すること、ならびに実際のパラメータ、寸法、材料及び/または構成は、本発明の教示が利用される特有の1つまたは複数の用途に依存することを容易に理解するであろう。当業者は、慣例に過ぎない実験を利用して本明細書に記載される特有の進歩的実施形態に対する多くの等価物に気づく、またはそれを確認することができるであろう。したがって上述の実施形態は、単なる一例として提示されており、添付の特許請求の範囲及びその等価物の範囲内で、進歩的実施形態が、具体的に説明され特許請求されるのとは別のやり方で実施される場合もあることを理解されたい。本開示の進歩的な実施形態は、本明細書に記載される各々の個々の特徴、システム、製品、材料、キット及び/または方法を対象としている。これに加えて、2つ以上のそのような特徴、システム、製品、材料、キット及び/または方法の任意の組み合わせは、そのような特徴、システム、製品、材料、キット及び/または方法が互いに矛盾しなければ、本開示の進歩的範囲の中に含まれる。 Although various progressive embodiments have been described and exemplified herein, those skilled in the art will have various types of other means and / or structures and / or books for performing and / or obtaining results. It is easy to imagine one or more of the advantages described herein, as well as each of such variants and / or modifications that appear to be within the scope of the progressive embodiments described herein. Will. More generally, one of ordinary skill in the art will mean that all parameters, dimensions, materials and configurations described herein are exemplary, as well as actual parameters, dimensions, materials and / or configurations. It will be readily appreciated that the teachings of the present invention depend on one or more unique uses in which they are utilized. One of ordinary skill in the art will be able to notice or confirm many equivalents to the particular progressive embodiments described herein using experiments that are merely conventional. Therefore, the above-described embodiment is presented as an example only, and within the scope of the appended claims and its equivalents, the progressive embodiment is separately described and patented. Please understand that it may be done in a way. The progressive embodiments of the present disclosure are directed to each individual feature, system, product, material, kit and / or method described herein. In addition to this, any combination of two or more such features, systems, products, materials, kits and / or methods inconsistent with each other such features, systems, products, materials, kits and / or methods. Otherwise, it is within the progressive scope of this disclosure.
また、その一例が提供されている種々の進歩的概念が1つまたは複数の方法として具現化されてよい。方法の一部として行われる行為は、任意の好適な方法において順序付けられてよい。したがって、行為が例示されるものとは異なる順番で行われる実施形態が構成される場合もあり、これはたとえ例示の実施形態において連続して起こる行為として示されていても、一部の行為を同時に行うことを含む場合もある。 Also, the various progressive concepts for which an example is provided may be embodied as one or more methods. The actions performed as part of the method may be ordered in any suitable method. Therefore, embodiments may be configured in which the actions are performed in a different order than the examples, which may include some actions, even if they are shown as consecutive actions in the illustrated embodiments. It may include doing things at the same time.
本明細書で定義され使用される際の全ての定義は、辞書の定義、参照により組み込まれる文献における定義及び/または定義される用語の通常の意味を規制するものと理解すべきである。 All definitions as defined and used herein should be understood to regulate the definitions of dictionaries, the definitions in the literature incorporated by reference and / or the usual meanings of the terms defined.
明細書及びクレーム中において本明細書で使用される不定冠詞「a」及び「an」は、反対のことが明確に指摘されない限り、「少なくとも1つの」を意味するものと理解すべきである。 The indefinite articles "a" and "an" used herein in the specification and claims should be understood to mean "at least one" unless the opposite is explicitly pointed out.
明細書及びクレーム中において本明細書で使用されるフレーズ「及び/または」は、そのように結合された要素、すなわち、あるケースでは接続するように提示され、別のケースでは選言的に提示される要素の「いずれかまたは両方」を意味するものと理解すべきである。「及び/または」によって列挙される複数の要素は、同じようにして解釈すべきであり、すなわちそのように連結された要素の「1つまたは複数」と解釈されるべきである。具体的に特定されるそのような要素に関連しても、関連しなくとも、「及び/または」節によって具体的に特定される要素以外の他の要素が任意選択で存在し得る。よって非制限的な例として、例えば「comprising(備える)」などのオープンエンドな言い回しと組み合わせて使用される際、「A及び/またはB」に対する言及は、一実施形態ではAのみを指す(任意選択でB以外の要素を含む)、他の一実施形態ではBのみを指す(任意選択でA以外の要素を含む)、さらに別の実施形態ではAとBの両方を指す(任意選択で他の要素を含む)などを指すことができる。 The phrases "and / or" used herein in the specification and claims are such combined elements, i.e., presented to connect in one case and selectively in another. It should be understood to mean "either or both" of the elements to be made. The elements listed by "and / or" should be interpreted in the same way, i.e., as "one or more" of the elements so concatenated. Other elements than those specifically specified by the "and / or" clause may optionally be present, whether or not they are related to such elements specifically identified. Thus, as a non-limiting example, when used in combination with an open-ended phrase such as "comprising", the reference to "A and / or B" refers only to A in one embodiment (optional). The selection includes elements other than B), in another embodiment it refers only to B (optional selection includes elements other than A), and in yet another embodiment it refers to both A and B (optionally other). (Including the element of) etc. can be pointed out.
明細書及びクレーム中において本明細書で使用される際、「または」は、上記で定義したように「及び/または」と同じ意味を有するものと理解すべきである。例えばリスト中の項目を区別するために、「または」もしくは「及び/または」は、包括的であるように解釈されることになり、すなわち要素の数またはリストのうちの少なくとも1つを含むが、2つ以上も含む、及び任意選択で追加のリストにない項目も含んでいる。もっぱら「〜のうちのただ1つ」もしくは「〜のうちの正に1つ」など反対のことを明確に指摘する用語、またはクレーム中で使用される場合の「〜から成る」に限っては、要素の数またはリストのうちの正に1つの要素を含むことを指すことになる。一般に、本明細書で使用される際の用語「または」は、「いずれか」、「〜のうちの1つ」「〜のうちの1つのみ」もしくは「〜のうちの正に1つ」などの排他的な用語が先行する場合、排他的な代替形態(すなわち「一方または他方、但し両方ではない」)を指示するものと解釈されるべきである。「基本的に〜から成る」は、クレーム中で使用される際、特許法の分野において使用されるその通常の意味を有することになる。 As used herein in the specification and claims, "or" should be understood to have the same meaning as "and / or" as defined above. For example, to distinguish items in a list, "or" or "and / or" will be interpreted as inclusive, i.e., including the number of elements or at least one of the list. Includes more than one, and optionally includes items not in the additional list. Only for terms that clearly point out the opposite, such as "only one of" or "exactly one of", or "consisting of" when used in a claim. , The number of elements or the inclusion of exactly one element in the list. In general, the term "or" as used herein is "any", "one of", "only one of" or "exactly one of". When preceded by an exclusive term such as, it should be construed to indicate an exclusive alternative form (ie, "one or the other, but not both"). "Basically consisting of" will have its usual meaning as used in the field of patent law when used in a claim.
明細書及びクレーム中において本明細書で使用される際フレーズ「少なくとも1つの」は、1つまたは複数の要素のリストに関連して、要素のリスト内の任意の1つ、または複数の要素から選択された少なくとも1つの要素を意味するものと理解すべきであるが、要素のリスト内に具体的に列記された各々の、及び全ての要素のうちの少なくとも1つを含む必要はなく、要素のリスト内の要素の何らかの組み合わせを排除するものでもない。この定義はまた、具体的に特定されるそのような要素に関連しても、関連しなくても、フレーズ「少なくとも1つの」が指す要素のリスト内で具体的に特定される要素以外に要素が任意選択で存在し得ることを可能にする。よって非制限的な例として、「A及びBのうちの少なくとも1つ(または同様な意味合いで「AまたはBの少なくとも一方」または同様な意味合いで「A及び/またはBのうちの少なくとも一方」)は、一実施形態において、Bが存在しない状態で少なくとも1つ、任意選択で2つ以上を含めたA(及び任意選択でB以外の要素を含む)、別の実施形態では、Aが存在しない状態で、少なくとも1つ、任意選択で2つ以上を含めたB(及び任意選択でA以外の要素を含む)、さらに別の実施形態では、少なくとも1つ、任意選択で2つ以上を含めたAと、少なくとも1つ、任意選択で2つ以上を含めたB(及び任意選択で他の要素を含む)などを指すことができる。 As used herein in the specification and claims, the phrase "at least one" is from any one or more elements in the list of elements in relation to the list of one or more elements. It should be understood to mean at least one element selected, but it is not necessary to include at least one of each and all elements specifically listed in the list of elements. Nor does it exclude any combination of elements in the list of. This definition is also related to or not related to such elements that are specifically identified, other than those specifically identified in the list of elements that the phrase "at least one" points to. Allows to exist at will. Thus, as a non-limiting example, "at least one of A and B (or" at least one of A or B "in a similar sense or" at least one of A and / or B "in a similar sense)). In one embodiment, A including at least one in the absence of B, two or more in the optional option (and including elements other than B in the optional option), and in another embodiment, A does not exist. In the state, at least one, B including two or more in the optional choice (and including elements other than A in the optional choice), and in yet another embodiment, include at least one, two or more in the optional choice. It can refer to A and B (and optional elements including other elements) including at least one and two or more arbitrarily selected.
クレーム中ならびに上記の明細書において、「comprising(有する)」、「including(含む)」、「carrying(担持する)」、「having(有する)」、「containing(包含する)」、「involving(伴う)」、「holding(保持する)」、「composed of(から成る)」などの全ての移行句は、オープンエンドであるように理解すべきであり、すなわち包含することを意味しており、限定するものではない。移行句「consisting of(〜から成る)」及び「consisting essentially of(基本的に〜から成る)」のみがそれぞれ、米国特許審査手続便覧、セクション2111.03に記載されるように、クローズドまたはセミクローズドな移行句となる。 In the claims and in the above specification, "comprising", "included", "carrying", "having", "contining", "involving". ) ”,“ Holding ”,“ coupled of ”, etc., all transitional phrases should be understood to be open-ended, meaning inclusion, and limitation. It's not something to do. Only the transitional phrases "consisting of" and "consisting essentially of", respectively, are closed or semi-closed, as described in the US Patent Examination Procedures Handbook, Section 2111.03, respectively. It becomes a transitional phrase.
Claims (34)
前記複数のタルボ画像のうちの少なくとも一部を検出するために、前記格子に対して特定の角度で配設された検出器アレイとを備えるスペクトロメータ。 A grid that diffracts incident radiation so as to form multiple Talbot images via the non-near-axis Talbot effect at intervals along directions perpendicular to the grid, approximately 1 to approximately 3 times the wavelength λ of the incident radiation. A grid with a large grid period d and
A spectrometer comprising a detector array disposed at a particular angle with respect to the grid to detect at least a portion of the plurality of Talbot images.
前記格子に対して傾斜させた検出器アレイによって前記タルボ画像を検出することと、
前記複数のタルボ画像に少なくとも幾分基づいて前記波長を推定することとを含む、スペクトル分析の方法。 In order to generate multiple Talbot images via the non-near-axis Talbot effect, the incident radiation is transmitted through a grid having a grid period approximately 1 to approximately 3 times larger than the wavelength of the incident radiation.
Detecting the Talbot image with a detector array tilted with respect to the grid
A method of spectral analysis comprising estimating the wavelength based at least somewhat on the plurality of Talbot images.
前記検出器アレイの近位端によって、前記格子から1mm未満の第1の距離のところで前記複数のタルボ画像の中の第1のタルボ画像の一部を検出することと、
前記検出器アレイの遠位端によって、前記格子から10mm未満の第2の距離のところで前記複数のタルボ画像の中の第2のタルボ画像の一部を検出することとを含む、請求項11に記載の方法。 Detecting the multiple Talbot images can
The proximal end of the detector array detects a portion of the first Talbot image in the plurality of Talbot images at a first distance of less than 1 mm from the grid.
11. The 11. The method described.
前記複数のタルボ画像のうちの少なくとも一部を検出するために、前記格子に対して特定の角度で配設された検出器アレイとを備えるスペクトロメータであって、
前記検出器アレイが、近位端と、遠位端とを有し、前記近位端は、前記格子から1mm以上離れておらず、前記遠位端は、前記格子から10mm以上離れておらず、
前記検出器アレイが、(2m+1)d/2にほぼ等しいピクセルピッチを有し、この場合mは正の整数である、前記スペクトロメータ。 A grid for diffracting incident radiation so as to form multiple Talbot images via the non-near-axis Talbot effect at intervals along directions perpendicular to the grid, approximately 1 to approximately 1 to approximately from the wavelength λ of the incident radiation. A grid with a grid period d three times larger and
A spectrometer comprising a detector array disposed at a particular angle with respect to the grid in order to detect at least a portion of the plurality of Talbot images.
The detector array has a proximal end and a distal end, the proximal end not more than 1 mm away from the grid and the distal end not more than 10 mm away from the grid. ,
The spectrometer in which the detector array has a pixel pitch approximately equal to (2m + 1) d / 2, where m is a positive integer.
第1の波長と第2の波長との間の一連の動作波長を用いて前記チューナブル光源を段階的にすることにより光ビームを生成すること、
前記第2の波長のおよそ1倍〜およそ2倍の格子周期を有する格子を通して前記光ビームを透過させて、前記非近軸タルボ効果を介して複数のタルボ画像を生成すること、
前記格子に対して傾斜した検出器アレイで複数のタルボ画像を検出すること、及び
各々の動作波長について、前記複数のタルボ画像に少なくとも幾分基づいて前記光ビームの対応する測定される波長を推定すること
を含む、前記方法。 A method of characterizing a tunable light source using the non-paraxial Talbot effect.
Generating a light beam by stepping the tunable light source using a series of operating wavelengths between a first wavelength and a second wavelength.
To transmit the light beam through a grid having a grid period of about 1 to about 2 times the second wavelength to generate a plurality of Talbot images via the non-paraxial Talbot effect.
Detecting multiple Talbot images with a detector array tilted relative to the grid, and estimating the corresponding measured wavelength of the light beam based on at least some of the Talbot images for each operating wavelength. The method described above, comprising:
検出器アレイの近位端で、格子から1mm未満の第1の距離で前記複数のタルボ画像において第1のタルボ画像の一部を検出すること、及び
前記検出器アレイの遠位端で、前記格子から10mm未満の第2の距離で前記複数のタルボ画像において第2のタルボ画像の一部を検出すること
を含む、請求項21に記載の方法。 Detection of multiple Talbot images,
To detect a portion of the first Talbot image in the plurality of Talbot images at a first distance of less than 1 mm from the grid at the proximal end of the detector array, and at the distal end of the detector array, said. 21. The method of claim 21, comprising detecting a portion of the second Talbot image in the plurality of Talbot images at a second distance of less than 10 mm from the grid.
を含む、請求項21に記載の方法。 21. The method of claim 21, wherein detecting the plurality of Talbot images comprises detecting the plurality of Talbot images in a detector array tilted at an angle of about 10 degrees to about 40 degrees with respect to the grid.
非近軸タルボ効果を介して前記光ビームから複数のタルボ画像を生成するための、前記チューナブル光源によって生成された光ビームを受信する格子であって、前記第2の波長のおよそ1倍〜およそ2倍の格子周期を有する前記格子と、
前記複数のタルボ画像を検出するための、前記格子に対して傾斜した検出器アレイと、
各々の動作波長について、前記複数のタルボ画像に少なくとも幾分基づいて前記光ビームの対応する測定される波長を推定するための、前記検出器アレイに作動可能に結合されたプロセッサと
を備えるシステム。 A tunable light source for generating a light beam, stepped over using a series of operating wavelengths between the first and second wavelengths.
A grid that receives a light beam generated by the tunable light source for generating a plurality of Talbot images from the light beam via the non-near-axis Talbot effect, and is approximately 1 times to the second wavelength. With the lattice having approximately twice the lattice period,
A detector array tilted with respect to the grid for detecting the plurality of Talbot images,
A system comprising a processor operably coupled to the detector array for estimating the corresponding measured wavelength of the light beam on the basis of at least some of the Talbot images for each operating wavelength.
前記検出器アレイの近位端で、格子から1mm未満の第1の距離で複数のタルボ画像において第1のタルボ画像の一部を検出し、かつ、
前記検出器アレイの遠位端で、前記格子から10mm未満の第2の距離で前記複数のタルボ画像において第2のタルボ画像の一部を検出するように構成されている、請求項28に記載のシステム。 The detector array is
At the proximal end of the detector array, a portion of the first Talbot image is detected in a plurality of Talbot images at a first distance of less than 1 mm from the grid, and
28. System.
を含む、請求項28に記載のシステム。 28. The system of claim 28, wherein each Talbot image in a plurality of Talbot images comprises a grid pattern represented by a sinusoidal curve.
Applications Claiming Priority (7)
| Application Number | Priority Date | Filing Date | Title |
|---|---|---|---|
| US201562212636P | 2015-09-01 | 2015-09-01 | |
| US62/212,636 | 2015-09-01 | ||
| US201562213158P | 2015-09-02 | 2015-09-02 | |
| US62/213,158 | 2015-09-02 | ||
| US201662290120P | 2016-02-02 | 2016-02-02 | |
| US62/290,120 | 2016-02-02 | ||
| PCT/US2016/049960 WO2017040826A1 (en) | 2015-09-01 | 2016-09-01 | Apparatus, systems, and methods for talbot spectrometers |
Publications (3)
| Publication Number | Publication Date |
|---|---|
| JP2018532105A JP2018532105A (en) | 2018-11-01 |
| JP2018532105A5 JP2018532105A5 (en) | 2019-11-07 |
| JP6986010B2 true JP6986010B2 (en) | 2021-12-22 |
Family
ID=58097747
Family Applications (1)
| Application Number | Title | Priority Date | Filing Date |
|---|---|---|---|
| JP2018511413A Active JP6986010B2 (en) | 2015-09-01 | 2016-09-01 | Equipment, systems and methods for Talbot-type spectrometers |
Country Status (4)
| Country | Link |
|---|---|
| US (3) | US10215639B2 (en) |
| EP (1) | EP3344947A4 (en) |
| JP (1) | JP6986010B2 (en) |
| WO (1) | WO2017040826A1 (en) |
Families Citing this family (18)
| Publication number | Priority date | Publication date | Assignee | Title |
|---|---|---|---|---|
| EP3344947A4 (en) | 2015-09-01 | 2019-04-17 | Massachusetts Institute Of Technology | Apparatus, systems, and methods for talbot spectrometers |
| WO2018102990A1 (en) * | 2016-12-06 | 2018-06-14 | SZ DJI Technology Co., Ltd. | System and method for rectifying a wide-angle image |
| GB201710100D0 (en) * | 2017-06-23 | 2017-08-09 | Keit Ltd | Noise suppression in spectrometers |
| CN107655859A (en) * | 2017-09-06 | 2018-02-02 | 西安交通大学 | Cycle material imaging method and its device |
| US10656012B2 (en) | 2017-12-22 | 2020-05-19 | Massachusetts Institute Of Technology | Swept-source Raman spectroscopy systems and methods |
| US10760969B1 (en) | 2019-02-28 | 2020-09-01 | Biospex, Inc. | Fluorescence and systemic noise reduction in time-gated spectroscopy |
| WO2020243828A1 (en) | 2019-06-05 | 2020-12-10 | Airy3D Inc. | Light field imaging device and method for 3d sensing |
| US11326944B2 (en) | 2019-07-12 | 2022-05-10 | Biospex, Inc. | Wearable spectrometer with filtered sensor |
| US11454540B2 (en) * | 2019-07-12 | 2022-09-27 | Biospex, Inc. | Wearable spectroscopy using filtered sensor |
| US20220283028A1 (en) * | 2019-08-23 | 2022-09-08 | Answeray Inc. | Spectrometer and imaging device |
| US11329730B2 (en) | 2019-09-26 | 2022-05-10 | Eagle Technology, Llc | Quantum communication system having time to frequency conversion and associated methods |
| US11418330B2 (en) | 2019-10-21 | 2022-08-16 | Eagle Technology, Llc | Quantum communication system that switches between quantum key distribution (QKD) protocols and associated methods |
| US11240018B2 (en) | 2019-10-30 | 2022-02-01 | Eagle Technology, Llc | Quantum communications system having quantum key distribution and using a talbot effect image position and associated methods |
| US11082216B2 (en) * | 2019-10-30 | 2021-08-03 | Eagle Technology, Llc | Quantum communication system having quantum key distribution and using a midpoint of the talbot effect image position and associated methods |
| US11050559B2 (en) | 2019-11-19 | 2021-06-29 | Eagle Technology, Llc | Quantum communications system using Talbot effect image position and associated methods |
| CN111103685B (en) * | 2019-12-12 | 2022-05-10 | 中山大学 | Non-paraxial self-acceleration light beam generation method and device based on Wegener function |
| CN111274533B (en) * | 2020-02-24 | 2023-04-07 | 杭州电子科技大学 | Light domain cross-correlation operation method and device based on Talbot effect |
| US11558123B2 (en) | 2021-02-19 | 2023-01-17 | Eagle Technology, Llc | Quantum communications system having stabilized quantum communications channel and associated methods |
Family Cites Families (9)
| Publication number | Priority date | Publication date | Assignee | Title |
|---|---|---|---|---|
| US6525815B2 (en) | 2000-11-10 | 2003-02-25 | The Board Of Trustees Of The Leland Stanford Junior University | Miniaturized Talbot spectrometer |
| US6654124B2 (en) * | 2001-09-21 | 2003-11-25 | Agilent Technologies, Inc. | Signal modulation compensation for wavelength meter |
| US7313299B2 (en) * | 2006-03-09 | 2007-12-25 | Lockheed Martin Coherent Technologies, Inc. | Laser beam transformation and combination using tapered waveguides |
| US8809758B2 (en) | 2008-07-25 | 2014-08-19 | Cornell University | Light field image sensor with an angle-sensitive pixel (ASP) device |
| CN103299166B (en) * | 2010-10-27 | 2015-09-23 | 康奈尔大学 | Light field image sensor, methods and applications |
| WO2012145566A2 (en) | 2011-04-20 | 2012-10-26 | California Institute Of Technology | Talbot-illuminated imaging devices, systems, and methods for focal plane tuning |
| NL2009015C2 (en) * | 2012-04-10 | 2013-10-15 | Biosparq B V | Method for classification of a sample on the basis of spectral data, method for creating a database and method for using this database, and corresponding computer program, data storage medium and system. |
| WO2015177784A2 (en) * | 2014-05-18 | 2015-11-26 | Adom, Advanced Optical Technologies Ltd. | System for tomography and/or topography measurements of a layered object |
| EP3344947A4 (en) | 2015-09-01 | 2019-04-17 | Massachusetts Institute Of Technology | Apparatus, systems, and methods for talbot spectrometers |
-
2016
- 2016-09-01 EP EP16843003.1A patent/EP3344947A4/en active Pending
- 2016-09-01 US US15/254,855 patent/US10215639B2/en active Active
- 2016-09-01 WO PCT/US2016/049960 patent/WO2017040826A1/en active Application Filing
- 2016-09-01 JP JP2018511413A patent/JP6986010B2/en active Active
-
2019
- 2019-01-10 US US16/244,207 patent/US10533895B2/en active Active
- 2019-12-05 US US16/704,444 patent/US10732044B2/en active Active
Also Published As
| Publication number | Publication date |
|---|---|
| US10215639B2 (en) | 2019-02-26 |
| JP2018532105A (en) | 2018-11-01 |
| EP3344947A4 (en) | 2019-04-17 |
| US20190323892A1 (en) | 2019-10-24 |
| US10732044B2 (en) | 2020-08-04 |
| US20200103281A1 (en) | 2020-04-02 |
| US10533895B2 (en) | 2020-01-14 |
| US20170059412A1 (en) | 2017-03-02 |
| EP3344947A1 (en) | 2018-07-11 |
| WO2017040826A1 (en) | 2017-03-09 |
Similar Documents
| Publication | Publication Date | Title |
|---|---|---|
| JP6986010B2 (en) | Equipment, systems and methods for Talbot-type spectrometers | |
| US20170023472A1 (en) | Apparatus and method for quantitive phase tomography through linear scanning with coherent and non-coherent detection | |
| JP5339535B2 (en) | Digital holography device and phase plate array | |
| JP5241806B2 (en) | Apparatus and method for surface contour measurement | |
| US10139284B2 (en) | Temperature distribution measuring apparatus and method | |
| JP2006523847A (en) | Method and system for static multimode multiplex spectroscopy | |
| US9207122B2 (en) | Fourier-transform interferometer with staircase reflective element | |
| JP6385288B2 (en) | Spectral characteristic measuring device | |
| JP2012108098A (en) | Imaging device using talbot interference and adjustment method of imaging device | |
| JP2017083411A (en) | X-ray Talbot interferometer and Talbot interferometer system | |
| JP7373399B2 (en) | Method and apparatus for analyzing electromagnetic waves with high definition | |
| McMackin et al. | Design of a multi-spectral imager built using the compressive sensing single-pixel camera architecture | |
| KR101547459B1 (en) | Phase reduction imaging system and imaging method of using the same | |
| WO2020241334A1 (en) | Diffraction element and imaging device | |
| JP6984736B2 (en) | Imaging device and imaging method | |
| Barducci et al. | Simulation of the performance of a stationary imaging interferometer for high-resolution monitoring of the Earth | |
| Saetiew et al. | Real-time assessment of spectrometer alignment using modulation transfer function (MTF) measurement | |
| de Beurs et al. | Rotational diffractive shear interferometry for extreme ultraviolet imaging | |
| US10267684B1 (en) | Device, system, and technique for characterizing a focal plane array modulation transfer function | |
| WO2022185720A1 (en) | Imaging device, imaging device operation method, and program | |
| Kudenov et al. | Compact spatial heterodyne interferometer using polarization gratings | |
| Park | Towards the measurement of surfaces on a large scale: synthetic aperture interferometry | |
| Vandervlugt | Computed tomographic imaging spectrometry | |
| Sandoz | Frequency-domain processing in high-performing optical measurements | |
| Han et al. | Non-paraxial talbot effect for building compact spectrometers |
Legal Events
| Date | Code | Title | Description |
|---|---|---|---|
| A621 | Written request for application examination |
Free format text: JAPANESE INTERMEDIATE CODE: A621 Effective date: 20190830 |
|
| A521 | Written amendment |
Free format text: JAPANESE INTERMEDIATE CODE: A523 Effective date: 20190920 |
|
| A977 | Report on retrieval |
Free format text: JAPANESE INTERMEDIATE CODE: A971007 Effective date: 20200923 |
|
| A131 | Notification of reasons for refusal |
Free format text: JAPANESE INTERMEDIATE CODE: A131 Effective date: 20201005 |
|
| A521 | Written amendment |
Free format text: JAPANESE INTERMEDIATE CODE: A523 Effective date: 20210104 |
|
| A131 | Notification of reasons for refusal |
Free format text: JAPANESE INTERMEDIATE CODE: A131 Effective date: 20210607 |
|
| A521 | Written amendment |
Free format text: JAPANESE INTERMEDIATE CODE: A523 Effective date: 20210903 |
|
| TRDD | Decision of grant or rejection written | ||
| A01 | Written decision to grant a patent or to grant a registration (utility model) |
Free format text: JAPANESE INTERMEDIATE CODE: A01 Effective date: 20211004 |
|
| A601 | Written request for extension of time |
Free format text: JAPANESE INTERMEDIATE CODE: A601 Effective date: 20211029 |
|
| A61 | First payment of annual fees (during grant procedure) |
Free format text: JAPANESE INTERMEDIATE CODE: A61 Effective date: 20211126 |
|
| R150 | Certificate of patent or registration of utility model |
Ref document number: 6986010 Country of ref document: JP Free format text: JAPANESE INTERMEDIATE CODE: R150 |