JP4875240B2 - Polygon road network data creation device, road map display device and method - Google Patents
Polygon road network data creation device, road map display device and method Download PDFInfo
- Publication number
- JP4875240B2 JP4875240B2 JP2000595305A JP2000595305A JP4875240B2 JP 4875240 B2 JP4875240 B2 JP 4875240B2 JP 2000595305 A JP2000595305 A JP 2000595305A JP 2000595305 A JP2000595305 A JP 2000595305A JP 4875240 B2 JP4875240 B2 JP 4875240B2
- Authority
- JP
- Japan
- Prior art keywords
- road
- polygon
- data
- intersection
- map
- Prior art date
- Legal status (The legal status is an assumption and is not a legal conclusion. Google has not performed a legal analysis and makes no representation as to the accuracy of the status listed.)
- Expired - Fee Related
Links
Images


Classifications
-
- G—PHYSICS
- G06—COMPUTING; CALCULATING OR COUNTING
- G06T—IMAGE DATA PROCESSING OR GENERATION, IN GENERAL
- G06T1/00—General purpose image data processing
-
- G—PHYSICS
- G06—COMPUTING; CALCULATING OR COUNTING
- G06T—IMAGE DATA PROCESSING OR GENERATION, IN GENERAL
- G06T17/00—Three dimensional [3D] modelling, e.g. data description of 3D objects
- G06T17/05—Geographic models
-
- G—PHYSICS
- G01—MEASURING; TESTING
- G01C—MEASURING DISTANCES, LEVELS OR BEARINGS; SURVEYING; NAVIGATION; GYROSCOPIC INSTRUMENTS; PHOTOGRAMMETRY OR VIDEOGRAMMETRY
- G01C21/00—Navigation; Navigational instruments not provided for in groups G01C1/00 - G01C19/00
- G01C21/38—Electronic maps specially adapted for navigation; Updating thereof
- G01C21/3804—Creation or updating of map data
- G01C21/3807—Creation or updating of map data characterised by the type of data
- G01C21/3815—Road data
- G01C21/3819—Road shape data, e.g. outline of a route
-
- G—PHYSICS
- G01—MEASURING; TESTING
- G01C—MEASURING DISTANCES, LEVELS OR BEARINGS; SURVEYING; NAVIGATION; GYROSCOPIC INSTRUMENTS; PHOTOGRAMMETRY OR VIDEOGRAMMETRY
- G01C21/00—Navigation; Navigational instruments not provided for in groups G01C1/00 - G01C19/00
- G01C21/38—Electronic maps specially adapted for navigation; Updating thereof
- G01C21/3863—Structures of map data
- G01C21/3867—Geometry of map features, e.g. shape points, polygons or for simplified maps
-
- G—PHYSICS
- G06—COMPUTING; CALCULATING OR COUNTING
- G06T—IMAGE DATA PROCESSING OR GENERATION, IN GENERAL
- G06T11/00—2D [Two Dimensional] image generation
- G06T11/20—Drawing from basic elements, e.g. lines or circles
- G06T11/203—Drawing of straight lines or curves
-
- G—PHYSICS
- G09—EDUCATION; CRYPTOGRAPHY; DISPLAY; ADVERTISING; SEALS
- G09B—EDUCATIONAL OR DEMONSTRATION APPLIANCES; APPLIANCES FOR TEACHING, OR COMMUNICATING WITH, THE BLIND, DEAF OR MUTE; MODELS; PLANETARIA; GLOBES; MAPS; DIAGRAMS
- G09B29/00—Maps; Plans; Charts; Diagrams, e.g. route diagram
Description
技 術 分 野
本発明は、道路地図データを扱う地図画像処理技術に関わり、特に道路データの作成装置及び方法に関する。
技 術 背 景
電子的な地図画像データをコンピュータを用いて画面に表示する電子地図技術は、カーナビゲーションを始め様々なアプリケーションで活用されている。さて、地図一般において、道路を表示する場合、広域地図のような小縮尺の地図では、道路はその幅員を無視した単なる線として描いて問題はない。しかし、詳細市街地図のような大縮尺の地図では、道路は正確な幅員をもった領域として表示される必要がある。当然、電子地図においても、道路に幅員を持たせて表現するための道路データの作成方法や表示方法が色々と開発されている。例えば、特開昭62−80774号公報、特開平4−303271号公報、特開平4−303272号及び特開平6−83931号公報に記載のものなどが知られている。
特開昭62−80774号公報に記載の図形処理装置は、幅員をもつ道路地図を作成する際に、人が道路輪郭を構成する直線を1本ずつ設定し描画するという面倒をなくすために、人が始点と終点と道幅を設定すると、その始点から終点へ道幅相当の間隔をもって走る平行線のペアを描画し、且つ、或る平行線ペアが他の平行線ペアと交差する場合には、その交点部分で平行線を自動的に消去する。従って、交差点を含む幅員をもった道路地図が簡易に作成できる。
特開平4−303271号公報に記載の装置は、人が道幅を設定してカーソルで基準線を描くと、その基準線に沿って道幅相当の間隔もって走る平行線のペアを描画する。
特開平4−303272号公報に記載の装置は、平行直線のペアとしてそれぞれ表現された2つの道路同士が角度をもって部分的に重なり合うとき、その重なり部分で平行線を修正して曲がり角を描画する。
特開平6−83931号公報に記載の装置は、平行線ペアでそれぞれ表現された2つの道路同士を連結する場合に、平行直線のペアと弧状線とを用いて道路間の連結部分を描画する。
このように、従来技術によれば道路データは平行線のペアによって表現されている。しかし、実際の道路形状は非常に複雑であり、平行線ペアだけではこれを正確に表現することは到底できない。特に、中央分離帯や歩道や車線等を正確に描いた極めて大縮尺の詳細市街地図では、従来の平行線ペアを用いた道路データの作成技術は全く役に立たない。
さらに電子化された市街地図において、道路を色又はテクスチャで自動的に塗りつぶせるようにしたいという要求がある。紙ベースの市街地図では、道路を他の領域とは異なる色で着色することで見易くしたものが存在し、電子地図でも道路が特定色で塗りつぶされていれば当然に見易い。道路の塗りつぶしを自動的に行うためには、道路が閉ループの多角形データで表現されていなければならない。しかし、従来の道路データは平行線や弧状線などの単なる線分の集まり過ぎないから、道路の塗りつぶしを自動的に行うことはできない。従って、従来の電子的な市街地図では、多角形で表現された建物などは特定色で塗られているが、道路は単にその輪郭線が描かれているだけであって、特別の着色はなされていない。
また、電子地図は、縮尺の変更や、経路探索などの便利な機能を提供することができる。例えば、カーナビゲーション装置で経路探索を行なって地図上に経路を表示した上で、その経路に沿って自動車を走らせつつ、高速道路を走行中は小縮尺の広域地図を表示しておき、市街地に入ると大縮尺の市街地図に表示を切替えるというような使い方ができる。この場合、探索された経路が例えばA道路を通っているならば、広域地図上でも市街地図上でも、同じA道路に経路が表示されていなければならない。そのためには、広域地図上の各道路と、市街地図上の同じ道路とが論理的に関連付けられている必要がある。一般に、広域地図では、道路は単純な線として表示すればよいから、道路データは交差点をノードとし道路をノード間を結ぶベクトルデータで表現した道路ネットワークデータである。一方、市街地図では、道路データは上述のように道路の輪郭を示す平行線ペアや弧状線などの道路輪郭線分データの集合である。従来は、市街地図上の交差点の中心座標を、広域地図の道路ネットワークデータのノードに対応付けることで、市街地図上の道路と広域地図上の道路とを関連付けている。しかし、その結果、探索された経路は、市街地図上でも交差点の中心点間を結んだ折れ線で単純に表現され、これでは、道路形状を詳細に示した市街地図の利点を十分に生かしているとは言えない。
従って、本発明の目的は、複雑な道路形状に正確に一致する道路データを自動作成することにある。
本発明の別の目的は、幅員をもった道路を塗りつぶせるよう多角形データを用いた道路データを自動作成することにある。
本発明の更に別の目的は、広域地図で用いられる道路ネットワークデータと関連付けて、市街地図用の道路形状を正確に表した道路データを自動作成することにある。
本発明の更にまた別の目的は、上記目的を達成するための実用的な技術を開発する上で発生してくる、後述するような幾つかの具体的な技術的問題を解決することにある。
発 明 の 開 示
本発明に従う道路データ作成装置は、(1)交差点をノードとし道路をノード間を結ぶリンクにモデル化した道路ネットワークデータから、市街地図データ上の幅員をもった道路を内包する簡易道路多角形を生成し、(2)市街地図データから道路の輪郭線を規定する鋏データを作成し、そして、(3)鋏データが規定する輪郭線に沿って簡易道路多角形をトリミングすることにより、市街地図データ上の道路形状に整形された道路多角形データを作成する。結果として、市街地図上の複雑な形状をもった道路が多角形として表現される。
好適な実施形態では、簡易道路多角形を作成する際、一つのリンクについて独立した複数の簡易道路多角形が作成された場合、それら複数の簡易多角形を道路の外形に相当する外形多角形と、道路の中抜き面に相当する中抜き多角形とに識別する。これにより、中抜き面をもった閉ループ様の形状の道路も良好に多角形化できる。
好適な実施形態では、道路ネットワークデータのノードとリンクを市街地図データ上の道路の幅員よりも大きく膨張させることにより、市街地図上の道路を内包する簡易道路多角形を作成する。その際、ノードはリンクよりも大きく膨張させる。また、リンクの屈曲点も大きめに膨張させる。これにより、交差点や道路の曲がり角のような多少面積の広めの場所も確実に内包した簡易道路多角形が作成される。このように道路を完全に内包した簡易道路多角形を作成した上で、これを道路の輪郭線を示す鋏データでトリミングして余分な部分を削除することにより、道路の輪郭形状と良好に一致する道路多角形が得られる。
好適な実施形態では、鋏データを作成する場合、市街地図データ上の道路付近の形状線を選び出し、選び出した形状線のうち端点が互いに一致又は近接している形状線同士を連結し、連結により得られた線分データを鋏データとする。これにより、道路輪郭線を良好に示した鋏データが得られる。
好適な実施形態は、整形された道路多角形データから、複数の車線を表す複数の車線多角形データを作成する車線データ作成部と、上記車多角形データの各々の内部に誘導線を設定する誘導線設定部とを更に備える。
好適な実施形態は、前記道路ネットワークデータがカバーする全体地図領域の中の一部の地域の道路地図を表示する必要が生じたとき、前記一部の地域にのみ含まれる道路について前記整形された道路多角形データを動的に作成する。
本発明に従う道路地図表示装置は、表示しようとする道路の各々を多角形で表現した道路多角形データを含む多角形道路地図データと、上記道路多角形データを用いて前記道路を表示する表示部とを備える。
この道路表示装置の好適な実施形態では、多角形道路地図データは、道路内の各車線を多角形で表現した車線多角形データと、各車線内に設定された誘導線を表す誘導線データと更に含み、上記表示部は、道路を表示するだけでなく、上記車線多角形データを用いて道路内の各車線をも表示し、更に、上記誘導線データを用いて、選択された一つの車線内に位置した誘導マークをも表示する。
この道路表示装置の好適な実施形態は、道路ネットワークデータと、市街地図データと、上記道路ネットワークデータがカバーする全体地図領域の中の一部の地域の道路地図を表示する必要が生じたとき、道路ネットワークデータと市街地図データとに基づいて、表示すべき地域にのみ含まれる道路について道路多角形データを動的に作成する道路多角形データ作成部とを更に備える。
本発明に従う交差点多角形の作成装置は、交差点を表すノードと交差点間の道路を表すノード間のリンクとを持つ道路ネットワークデータと、地図要素の形状を形状要素点のセットで表現した線分データを持つ市街地図データとを受ける。そして、この装置は、道路ネットワークデータを市街地図データに投影し、道路ネットワークデータの注目ノードを内包する所定の検索領域を市街地図データ上で決定し、決定した検索領域内において、所定の位置的条件を満たすように位置する前記形状要素点を検索する。次に、この装置は、検索した形状要素点を用いて、注目ノードについての交差点多角形データを作成する。この装置によれば、道路ネットワークデータと線分ベースの市街地図データとから、交差点多角形データを自動的に作ることができる。作成された交差点多角形データは、道路ネットワークデータにノードへのデータ関連を必然的に有する。
好適な実施形態では、この装置は、上記検索領域を決定した後、注目ノードに接続するリンクを用いてその検索領域を複数のサブ検索領域に分割し、サブ検索領域の各々に対して固有の固有位置的条件を位置的条件として決定する。そして、この装置は、サブ検索領域の各々において、固有位置的条件を持たす前記形状要素点を検索し、それら複数のサブ検索領域で検索した形状要素点を集めて交差点多角形データを作成する。各サブ領域は交差点の各コーナ部の形状要素点を含んでいる。注目ノードと各コーナ部との位置関係は各コーナー部毎に異なるので、各サブ領域毎に各コーナ部に適合した固有の位置的条件を決定することによって、各コーナ部の形状要素点を的確に抽出できる。よって、正確な交差点多角形データが得られる。
好適な実施形態では、この装置は、前記検索領域内の複数のサブ検索領域の各々において、形状要素点の中で注目ノードに最も近い最近点を決定し、そして、注目ノードと最近点までの第1の距離と、第1の距離に所定の許容幅を加えた第2の距離との間の距離範囲だけ注目点から離れているバンド領域を設定する。そして、この装置は、各サブ検索領域において、そのバンド領域内に存在する形状要素点だけを、交差多角形を構成する点としてピックアップする。この方法により、高い精度で正確な交差点多角形が得られる。
好適な実施形態では、この装置は、市街地図データがカバーする市街地図領域をそれぞれ多数の小さいセルに分割し、それらのセルの中から、注目ノードに対応する位置に近接する少なくとも1個のセル(例えば、注目ノードが位置するセルと、それに隣接するセル)を対象セルとして選択し、この対象セル内で上記検索領域を決定する。この方法により、各交差点多角形作成処理で扱うデータの量が削減され、計算機の負担が軽減する。
好適な実施形態では、この装置は、更に、道路多角形データを持つ道路地図データを受け、そして、その道路多角形データと上述した交差点多角形データとが重複する領域をもつ場合には、その交差点多角形データを用いて道路多角形データから前記重複領域を除去して、交差点多角形データと重複しない純粋な道路多角形データを作成する。
好適な実施形態では、この装置は更に、交差点多角形データから、複数の道路に接する複数の接線を決定し、決定した複数の接線の中から2本の接線を抽出する。そして、この装置は、交差点多角形データがカバーする多角形領域内で、抽出した2本の接線同士を滑らかに結ぶ略セクタ状又は略矩形状の誘導用交差点多角形を作成する。
本発明に従う別の道路地図表示装置は、道路多角形データと誘導用交差点多角形データとを持つ道路地図データを受け、この道路地図データから、表示しようとする複数の道路の道路多角形データと、それら複数の道路を繋げるための誘導用交差点多角形データとを選択して、選択した道路多角形データと誘導用交差点多角形データを用いて、上記道路及び交差点表示する。
本発明のまた別の道路地図表示装置は、道路多角形データと交差点多角形データとを持つ道路地図データを受け、また、渋滞列の終端位置を示す渋滞情報を受ける。そして、この装置は、道路地図データから、渋滞列の終端位置が存在する道路又は交差点についての道路多角形データ又は交差点多角形データを選択し、選択した道路多角形データ又は交差点多角形データを前記終端位置で上流側領域部分と下流側領域部分とに分割する。そして、この装置は、分割した道路多角形データ又は交差点多角形データの下流側領域と、この下流側領域よりも渋滞列に沿って下流に存在する道路及び交差点についての道路多角形データ及び交差点多角形データを用いて、渋滞列の存在する道路及び交差点の領域を表示する。これにより、交通渋滞になっている道路の領域を正確に表示できる。
本発明のコンピュータ読取可能なデータ記録媒体は、道路ネットワークを構成するように相互に関連付けられたノードデータとリンクデータとを有し、各ノードデータは各ノードの交差点の形状を多角形で表現した交差点多角形データを含み、各リンクの道路の形状を多角形で表現した道路多角形データを含んでいるポリゴン道路ネットワークデータを格納している。
このポリゴン道路ネットワークデータを用いることで、コンピュータの地図アプリケーションは、市街地図に描かれている道路や交差点と形状及び位置が良好に一致したポリゴン道路地図画像を作成して表示することができるようになる。加えて、地図アプリケーションは、上記ポリゴン道路ネットワークデータを用いて経路探索又はマップマッチングなどの処理を行う場合、従来の道路ネットワークデータを用いた従来の経路探索又はマップマッチングのアルゴリズムの基本部分を利用することができる。
本発明の更に別の地図画像表示装置は、上述したポリゴン道路ネットワークデータと、このポリゴン道路ネットワークデータを受け、交差点を表現した多角形と道路を表現した多角形とからなるポリゴン道路画像を作成し表示する表示部とを備える。
好適な実施形態では、この道路地図表示装置は、更に市街地図データを備え、上記表示部が、その市街地図データを用いて市街地図画像を作成し、その市街地図画像に上記ポリゴン道路画像を重ねて表示する。また、表示部は、上記ポリゴン道路ネットワークデータを用いて経路探索又はマップマッチングなどの処理を行う機能をもつ。
本発明は典型的にはコンピュータを利用して実施することができるが、そのためのコンピュータプログラムは、各種ディスク型ストレージ、半導体メモリ、通信ネットワーク信号などの各種媒体を用いてコンピュータにインストール又はロードすることができる。本発明は、1台のコンピュータで実施することばかりでなく、複数台のコンピュータを用いた分散処理によって実施することができる。
発明を実施するための最良の形態
以下、本発明の一実施形態を図面を参照して具体的に説明する。
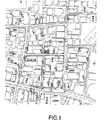
図1は、家枠や歩道形状などが詳細かつ正確に描かれた市街地図の一例を示している。図2は、交差点をノードとし道路をノード間を結ぶ方向付きベクトル(リンク)にモデル化して表現した道路ネットワークデータの一例を示している。
本発明の原理に従えば、図2に示したような道路ネットワークデータを図1に示したような市街地図に重ね合わせて以下に詳述するような処理を行うことにより、市街地図の道形形状を良好に再現した道路多角形データを生成することができる。図3は、そのようにして完成した道路多角形データをハッチングで塗りつぶした上で、図1に示した市街地図データに重ねて表示した例を示している。図3から分かるように、市街地図の複雑な道路形状に精度良く一致した道路多角形データが得られている。しかも、図示のように、道路の塗りつぶしが可能であるから、見やすい市街地図が提供できる。また、図2に示した道路ネットワークデータの各道路(交差点間のリンク)を、図3にハッチングで塗りつぶして示した道路多角形データの各道路多角形(交差点から交差点までの道路多角形)に1対1で関連付けることができる。その結果、例えば経路探索を行った場合、探索された経路を、市街地図上で、従来のような交差点中心を結ぶ単純な折れ線ではなく、塗りつぶされた道路それ自体で表現することができる。
図4は、本発明の一実施形態にかかる道路データ作成装置のシステム構成を示す。
この道路データ作成装置は、典型的にはプログラムされた汎用的なコンピュータである。このコンピュータの中央処理装置1は、プログラムに従って簡易道路多角形作成処理3、鋏データ作成処理6、及び道路多角形作成処理8を行う。このコンピュータの記憶装置上には、原料データとして、図2に例示したような交差点と道路をノードとリンクでモデル化した道路ネットワークデータを保存した道路ネットワークデータベース2と、図1に例示したような家枠や歩道形状等が詳細に描かれた市街地図データを保存した市街地図データベース5とが格納されている。
中央処理装置1は、まず簡易道路多角形作成処理3を行なう。この処理3では、道路ネットワークデータベース2に保存されている道路ネットワークデータに含まれている各道路の線分データ(各交差点間のリンクデータ)を市街地図データ5上の各道路幅員よりも大きく幅員方向へ膨張させることにより、市街地図データ5上の各道路の領域をそれより大き目にカバーする各道路毎の簡易道路多角形データを作成する。作成された各道路の簡易道路多角形データは記憶装置上の簡易道路多角形データベース4に集められ保存される。
中央処理装置1は、次に鋏データ作成処理6を行う。この処理6では、市街地図データベース5に保存されている市街地図データに含まれている道路輪郭や家枠などの線分データを基に、各道路の簡易道路多角形データをトリミングして正しい道路形状に生計するための鋏データ(トリミングのカッティングラインを示したデータ)を作成する。作成された各道路の鋏データは記憶装置上の鋏データベース7に集められ保存される。
中央処理装置1は、次に道路多角形作成処理8を行う。この処理8では、簡易道路多角形データベース4に保存されている各道路の簡易道路多角形データを、鋏データベース7からの各鋏データでトリミングして、各道路の正確な道路形状を表した道路多角形データを作成する。作成された道路多角形データは、記憶装置上の道路多角形データベース9に集められ保存される。
以下に、簡易道路多角形作成処理3、鋏データ作成処理6、及び道路多角形作成処理8を詳細に説明する。
図5は、簡易道路多角形作成処理3の手順を示す。
簡易道路多角形作成処理3は、まず、道路ネットワークデータベース2から対象地域の道路ネットワークデータを読み込む。一般的に道路ネットワークデータは交差点と道路をそれぞれノードとリンクにモデル化したものである。図5(a)に示すように、一つのリンク(道路)11は、隣り合う2つのノード(交差点)13,15を結ぶ折れ線であり、始端のノード13と途中の各形状要素点(屈曲点)17、17、…と終端のノード15を順に結ぶ複数の直線分L1、…、Lnを用いて表現されている。因みに、このような道路ネットワークデータは、例えば2万5千分の1縮尺の全国道路データから作成される。
簡易道路多角形作成処理3は、次に、図5(a)に示した各リンクの各線分L1、…、Lnを、図5(b)に示すように幅員方向(線分と直角の方向)に膨張させて、各線分Liを内包した要素多角形(例えば長方形)21iを作成する。また、図5(c)に示すように、各線分Liの始終点(両端の形状要素点)23i,23i+1を全方向へ各線分Liより大きく膨張させて、各終始点23i,23i+1を内包した要素多角形(例えば、円形に近い多角形)25i、25i+1を作成する。その際、図5(d)に示すように、特にノードに対応する要素多角形251、25n+1は、他の形状要素点より更に大きく膨張させる。このようにリンクの各要素(ノード、線分、形状要素点)を膨張させて要素多角形を作る処理を、当該リンクの全ての要素について順番に行っていく。その結果、図5(d)に示すように、当該リンクの全体を内包する多数の要素多角形251、211、…、21n、25n+1のセットが出来上がる。次に、これらの要素多角形251、211、…、21n、25n+1の領域和を計算することによって、図5(e)に示すような当該リンクを内包した1つの簡易道路多角形27を作成する。
この簡易道路多角形27は、幅員をもった一つの道路の形状を大雑把に表現している。後に、この簡易道路多角形27は、トリミングされることよって(つまり、余計な部分を切り取られることによって)、市街地図データが示す正確な道路の形状に整形されることになる。そのため、この簡易道路多角形27は、市街地図データが示す正確な道路よりも大きい幅員を有して、正確な道路の領域を完全に内包している必要がある。この理由から、上述した膨張処理では、各線分Liの要素多角形21iは、市街地図データが示す正確な道路の幅員より若干大きい幅員をもつように膨張される。その膨張量は、例えば図6に示すような方法で決定することができる。すなわち、図6に示すように、道路ネットワークデータの各リンクの線分Liを市街地図データ31に重ね合わせ、そして、線分Liの複数地点から矢印で示すように両側へ垂線を伸ばし、それらの垂線が市街地図上の線分と最初に交わる点までの垂線の長さd1、d2、…を測定する。これらの垂線の長さd1、d2、…はそれぞれの地点付近の道路区間での当該道路の中心線から各側の縁線までの幅を代表した値であるとみなせる。そこで、道路の各側毎に、それら垂線の長さd1、d2、…をそれぞれの地点が代表する道路区間の距離で重み付けて荷重平均を計算し、それを当該道路の中心線から各側の幅とみなす。最も簡単な計算例を示せば、図6の例の場合、図中上側の道路幅W1は、
W1=(d1*D1+d2*D2+d3*D3+d4*D4)÷(D1+D2+D3+D4)
で決定され、下側の道路幅W2は、
W2=(d5*D5+d6*D6+d7*D7+d8*D8)÷(D5+D6+D7+D8)
で決定される。こうして決定した道路幅W1、W2よりも適当程度さらに大きい距離W3、W4だけ、線分Liを上下方向に膨張させることにより、市街地図上の当該道路を完全に包含する要素多角形を作成することができる。更に、前述したように、線分Liの終始点やノードでは線分Liより大きく膨張させた要素多角形を作成するが、その理由は、その要素多角形内に道路の曲がり角や交差点(これらは、道路のまっすぐな箇所より大きい幅をもつこと多い)を確実に内包させるためである。
また、図5(d)に示した複数の要素多角形251、211、252、212、…を図5(e)に示す1リンクの簡易道路多角形27へ変化させるための領域和の計算は、図7に示すような方法で行うことができる。例えば図7(a)に示すように、ある要素多角形G1が閉ループにされた多角形線分(f11,f12,…,f16)からなり、別の要素多角形G2が閉ループにされた多角形線分(f21,f22,…,f25)からなり、要素多角形G1とG2が部分的に重なっているとする。まず、図7(b)に示すように、第1の要素多角形G1の線分で第2の要素多角形G2を切断する。その結果、第2の要素多角形G2の線分f22が切断され、新たに線分f22’と線分f22”が発生する。同様に線分f25も切断されて、新たに線分f25’と線分f25”が発生する。これら新たに発生した線分と切断されていない線分とを連結関係でグループ分けすると、複数グループに別れる。図7の例では、2つの線分グループ、つまり、第1グループF21(=f25’+f21+f22’)と第2グループF22(=f22”+f23+f24+f25”)に分かれる。次に図7(c)に示すように、第2の要素多角形G2の線分で第1の要素多角形G1を切断する。先ほどと同様に連結関係でグループ分けすると、図7の例では、第1の線分グループF11(=f11+f12+f13+f14+f15)と、第2の線分グループF12(=f16)に分かれる。
次に第1の多角形G1から発生した線分グループF11及びF12の各々について、第2の多角形G2の領域内に内包されているか否かを調べる内外判定を行う。内外判定の手法自体は公知である。その結果、第1の線分グループF11は、第2の多角形G2の外領域に存在することが判明し、これは新多角形の外周線分とするために残す。一方、第2の線分グループF12は多角形G2の内領域に存在することが判明し、これは破棄する。同様に第2の多角形G2から発生した線分グループF21及びF22についても、多角形G1に対する内外判定を行う。その結果、第1の線分グループF21は、多角形G1の内領域に存在するので破棄し、第2の線分グループF22は多角形G1の外領域に存在するので、新多角形の外周線分として残す。
最後に、図7(d)に示すように、残った外周線分グループF11とF22を連結する。なお、図7では、F11の終始点とF22の終始点は離れた場所に描かれているが、実際は同一座標に存在するので、F11とF22は互いに連結することができる。このように残った外周線分グループを連結することで、新多角形Gが完成する。このような領域和処理を、図5(d)に示した一つのリンクを構成する隣り合う全ての要素多角形間に適用することにより、図5(e)に示した1つの簡易道路多角形27が得られる。
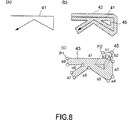
ところで、例えば高速道路への螺旋状の進入道のように、地図上で閉ループ様の形状を呈する道路は、その簡易道路多角形はその領域内に中抜き面を有するものとなる。このようなケースでは、簡易道路多角形を作成する過程で、その簡易道路多角形の外形状を規定する外形多角形と、中抜き面を規定する中抜き多角形とを正しく識別する必要がある。図8は、このような場合の外形多角形と中抜き多角形の識別方法を示している。例えば、図8(a)に示すような形状をもつ道路リンク41から図5及び図7に示した処理を行っていくと、図7(d)に示した外周線分グループの連結が終わった段階で、図8(b)に示すように、複数の独立した(つまり、互いに連結できない)簡易道路多角形43、45が発生することになる。なお、説明の単純化の為に2個の簡易道路多角形が発生した例を図8では示すが、道路形状によっては3個以上の独立した多角形が発生することもある。
さて、この例では、図8(c)に示すように、第1の線分グループA(a1,…,a9)からなる簡易道路多角形43と、第2の線分グループB(b1,…,b3)からなる簡易道路多角形45が発生する。これらの独立した簡易道路多角形43、45のうち、いずれか一つは当該道路の外形多角形であり、他は中抜き多角形である。そこで、これらの簡易道路多角形43、45の内のどれが外形多角形であるかを決定するための処理を行う。すなわち、まず、それらの簡易道路多角形43、45の各々から線分上の代表点を1点づつ選び出す。次いで、各代表点について、当該代表点と他の全ての多角形との間で内外判定を行う。その結果、当該多角形の代表点が他の全ての多角形の領域外に存在する唯一の多角形を、当該道路の外形多角形と決定し、他の全ての多角形を中抜き多角形と決定する。例えば、図8において、多角形43の代表点をa1、多角形45の代表点をb1とすると、多角形45の代表点b1は他の多角形43の内部に存在し、多角形43の代表点a1は他の全ての多角形45の外部に存在する。従って、多角形43が外形多角形であり、多角形45が中抜き多角形である。このような外形多角形と中抜き多角形との識別は、図7に示すような方法で隣接する要素多角形のペアの領域和の計算を行う都度に実行する。そして、この要領で、1つの道路の始点ノードから終点ノードまで、隣接し合う要素多角形の領域和計算を繰り返すことによって、最終的に図5(e)に示すような当該道路を内包する簡易道路多角形が完成される。これを道路ネットワークデータの全てのリンクデータについて行い、その結果を簡易道路多角形データベース4に記憶する。
次に、鋏データ作成処理6を説明する。
前述したように、鋏データは、実際の道路形状より大きめに作った簡易道路多角形をトリミングして正確な道路形状に整形するための、カットラインを規定するものである。従って、鋏データつまりカットラインは、道路の正確な外形状に沿って走っていて、道路内の領域には侵入していないことが理想的である。鋏データ作成処理6は、できるだけ理想に近い鋏データを作成するための処理である。
図9は、鋏データ生成処理6の手順を示している。
まず、図9(a)に示すように、市街地図データ51の中から、各道路毎に、当該道路付近に存在する道路枠53、57、家枠59、橋枠55、水系線61、62、…、等さまざまな属性の形状線を抽出する。その際、抽出対象を各道路付近の形状線だけに絞り込むために(つまり、各道路の輪郭形状に関係のない形状線を除外するために)、例えば、市街地図を適当に細かいメッシュで多数のセグメントに区分しておき、道路ネットワークデータの各リンクを市街地図に重ねたときに、各リンクが通過するセグメント内に存在する形状線だけに抽出対象を絞り、更に、各リンクのxy座標の最大値と最初値とで定義される矩形領域に含まれる形状線だけに抽出対象を絞るというような方法を採ることができる。
一般に市街地図データ51上で道路の外形線を構成しているさまざまな属性の形状線は、互いに連結してない独立した線分データである。換言すれば、道路の輪郭線は、市街地図データ上では一線分ではなく、バラバラの独立した多数の線分の寄せ集めで構成されている。そこで、次に、抽出したさまざまな形状線の中から連結可能な線分53、55、57、59を選び出し、これらの線分を相互に連結して、図9(b)に示すように1線分63を作成する。ここで、連結可能な線分とは、ある線分の一端点(終点または始点)と他の線分の一端点の座標が完全に一致している線分同士、及び、図9(c)に示す線分65、67のように、ある線分の一端点と他の線分の一端点との距離が所定の許容値γの範囲内にある線分同士(要するに、一線分を構成するとみなせる程度に十分近接している線分同士)を指す。従って、図9(d)に示す例では、線分67と線分69の端点67a、69a間の距離は許容値γ以下であるから、線分67と線分69は連結される。一方、線分67と線分71の端点67a、71a間の距離は許容値γを超えているから、線分67と線分71は連結されない。
このようにして各道路付近の形状線を抽出し、それら形状線の中から連結可能な形状線を選んで一線分に連結することにより、その連結された線分データの中に、各道路の輪郭線データがかなり精度良く含まれることになる。この処理を市街地図データ中の各道路について行い、その結果として得られた各道路毎の連結された線分データを、各道路の簡易道路多角形に対する鋏データとして、鋏データベース7に記憶する。
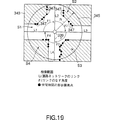
ところで、近接した形状線同士を連結する際、たった2本の線分の端点同士が近接し合っているケースだけでなく、3本以上の線分の端点同士が近接し合っていているケースも多々がある。例えば、図10(a)に示すように、線分73、75、77、79が同じ道路付近に存在し、2本の線分73と75の端点同士が一つの個所Aで近接し合い、また、3本の線分75と77と79の端点同士が別の個所Bで近接し合っているとする。この場合、最初の近接個所Aでは、すでに説明した通り2本の線分73と75が単純に一本の線分に連結される。一方、2番目の近接個所Bでは、3本の線分75と77と79を同時に連結して1本の線分にすることはできない。そこで、図10(b)、(c)、(d)に示すように、この1箇所Bに集まった3本以上の線分の端点を一つのノードとして扱い、このノードを介して1本の線分に連結できる2本の線分の組み合わせを全部ピックアップして、各組み合わせ毎に連結する。図10の例では、3種類の組み合わせV1、V2、V3が存在するので、3本の連結線分H1、H2、H3が得られる。このようにした得た複数本の連結線分H1、H2、H3の全てを当該道路についての鋏データとして、鋏データベース7に記憶する。
次に、道路多角形作成処理8を説明する。
道路多角形作成処理8は、各道路毎に、その道路の簡易道路多角形をその道路の鋏データを用いてトリミングすることにより、その道路の正確な輪郭形状を表した道路多角形を作成する処理である。すなわち、簡易道路多角形データベース4から各道路の簡易道路多角形データを読み込み、鋏データベース7から各道路の鋏データを読み込み、各道路毎に、その道路の全ての鋏データの各々が、その道路の簡易道路多角形データを貫通しているかを調べる。例えば、図11(a)に示す例では、簡易道路多角形81を5本の鋏データ91、93、95、97が貫通している。次に、貫通している鋏データの各々を用いて、簡易道路多角形81を切断する。
各鋏データ毎に、その鋏データの線分で簡易道路多角形を切断すると、簡易道路多角形は2つの線分グループに分かれる。そのうち、道路ネットワークデータのノードを内包している方(つまり、道路内側)の線分グループを残し、他方(つまり、道路外側)の線分グループは破棄する。同様にその鋏データも簡易道路多角形の線分で切断し、それにより分かれた鋏データの複数の線分グループのうち、簡易道路多角形に内包されている方の線分グループのみを残す。そして、残した簡易道路多角形の線分グループと、残した鋏データの線分グループとを連結することにより、その鋏データに沿って道路外側の部分が切除された新しい簡易道路多角形が得られる。
このような各鋏データによるトリミングを、貫通する全て鋏データについて繰り返すことにより、最終的に道路の輪郭形状にかなりの精度で一致した道路多角形が得られる。例えば、図11(a)に示した大雑把な形状の簡易道路多角形81を、それを貫通する全ての鋏データ91、93、95、97でトリミングすると、その結果、図11(b)に示すように、市街地図上の道路形状に精度良く整形された道路多角形101が得られる。このようなトリミングを全ての簡易道路多角形とそれを貫通する全ての鋏データとの間で行い、そうして作成された道路多角形データを道路多角形データベース9に記憶する。
以上の一連の処理により、市街地図上で表現される道路の形状に精度良く一致する道路多角形を自動的に作成できる。このデータはその特性上、道路ネットワークデータとの相性も良く、道路ネットワークデータから作成される広域地図などとのリンク関係も明確になる。また道路ネットワークデータの保持している道路関連情報も、道路多角形に関連付けて保持することが可能になる。
ところで、上述した道路多角形を用いた道路地図データでは、各交差点から隣の交差点までの各道路の領域が1つの多角形で表現される。この道路地図データの構成例を図12(A)に示し、この道路地図データに基づき画面に表示された道路画像を図12(B)に示す。図12(A)に示すように、この道路地図データは複数の道路多角形201、203、205のデータから構成される。ここで、交差点の領域は、道路多角形201、203、205から区別されてはおらず、道路多角形201、203、205に含まれている。表示された道路画像上では、図12(B)に示すように、複数の道路多角形201、203、205同士が重なり合った領域207を、人間が視覚的に交差点だと認識する。しかし、道路地図データを利用する計算機上のアプリケーションは、道路地図データ上で交差点の領域と道路の領域とを正確に区別して認識したり指し示したりするができない。
道路地図データを、従来の用途より高度な用途に利用したいという要求がある。例えば、カーナビゲーションにおける目的地までのルート誘導において、従来は、そのルートを交差点間を直線で結ぶ単なる折れ線分で表示している。しかし、それよりも、そのルートを構成する道路及び交差点の領域そのものを強調して表示する方法の方が、ユーザにとってより見易い。後者のルート表示を行う場合、ルートの交差点部分を見栄良く表示するためには、多角形ベースの道路地図データ上で交差点が道路多角形から正確に区別された独立した多角形として表現されている方が望ましい。図12(A)に示したように交差点が道路多角形に含まれていると、例えば道路多角形201から道路多角形203へ折れるルートを表示する場合、この2つの道路多角形201、203が重なる領域207が交差点として不自然な形状をもつため、見栄えが悪い。
また、出発地から目的地までルートを決定するルート探索処理は、従来から存在する例えば1/2.5万縮尺の道路ネットワークデータ(交差点はノード(座標点)で表現され、道路はノード間を結ぶ方向付きベクトルで表現されている)に基づいて行われる。そのため、上述した多角形を用いたルート表示を行うためには、道路地図データの交差点多角形及び道路多角形が、道路ネットワークデータの交差点ノード及び道路ベクトルとデータ関連をもっていることも必要である。
さらに、誘導ルートの交差点部分の表示に関し、図13(A)に示すように交差点209の全領域を誘導ルート211として表示するよりも、図13(B)に示すように、交差点209内の走行路線だけを誘導ルート213として表示した方が分かり易い。しかし、交差点の領域全体を1つの多角形として定義した交差点多角形データだけでは、このような図13(B)に示したような分かり易いルート表示を行うことはできない。
これらの課題を解決するには、道路だけでなく交差点もそれぞれ独立した多角形で表現された道路地図データを作成することが望ましい。
図14は、道路と交差点をそれぞれ多角形を表現した道路地図データを作成するための本発明の一実施形態にかかる装置のシステム構成を示す。
この道路地図データ作成装置は、典型的にはプログラムされた汎用的なコンピュータである。このコンピュータの中央処理装置301は、プログラムに従って前処理304、交差点多角形作成処理305、道路多角形補正処理308、及び誘導用交差点多角形作成処理310を行う。このコンピュータの記憶装置上には、原料データとして、交差点と道路をノードとリンクでモデル化した道路ネットワークデータを保存した道路ネットワークデータベース302と、家枠や歩道形状等が詳細に描かれた線分ベースの市街地図データを保存した市街地図データベース303と、道路ネットワークデータと市街地図データに基づいて例えば図4〜図11を参照して既に説明した方法で作成された道路多角形データ(図12に例示したように交差点領域を含む)を保存した道路多角形データベース307、が存在する。
中央処理装置301は、まず前処理304を行なう。この前処理304は、道路ネットワークデータと市街地図データをメモリに展開し、道路ネットワークデータと市街地図データの地図空間座標を一致させ、そして、道路ネットワークデータと市街地図データをそれぞれ多数のセル(均等な小サイズの多数の矩形領域)に分割して、セル単位の各地図データを管理できるようにする。
次に、中央処理装置301は交差点多角形作成処理305を行う。この処理305は、前処理304の後の道路ネットワークデータと市街地図データに基づいて交差点多角形データを作成して、作成した交差点多角形データを交差点多角形データベース306に蓄積する。
次に、中央処理装置301は道路多角形補正処理308を行う。この処理30は、道路多角形データベース307から読み込んだ道路多角形データ(交差点領域を含む)を、交差点多角形データベース306からの交差点多角形データを用いて補正することにより、交差点領域を含まない道路多角形データ(以下、「純粋道路多角形データ」という)を作成して、作成した純粋道路多角形データを純粋道路多角形データベース309に蓄積する。
次に、中央処理装置301は誘導用交差点多角形作成処理310を行う。この処理310は、交差点多角形データベース306からの交差点多角形データと、純粋道路多角形データベース309からの純粋道路多角形データとに基づいて、同じ交差点に接続する2つの道路多角形データ間を図13(B)に例示したようにスムーズに連結するような誘導用の交差点多角形データを作成して、作成した誘導用交差点多角形データを誘導用交差点多角形データ311に蓄積する。
以下に、前処理304、交差点多角形作成処理305、道路多角形補正処理308、及び誘導用交差点多角形作成処理310を詳細に説明する。まず、図15〜図17を参照して、前処理304を説明する。
前処理304では、中央処理装置301内のメモリに、データベース302からの道路ネットワークデータとデータベース303からの市街地図データを展開する。しかし、一般に、図15に示すように、道路ネットワークデータが表す地図領域313と、市街地図データが表す地図領域315とは、座標空間(例えば、左下端の座標原点の緯度経度)において不一致である。そこで、この2つの地図領域313、315の座標空間を次のようにして一致させる。すなわち、両座標空間の位置ずれ(Δx、Δy)を
Δx=道路ネットワーク地図領域原点経度−市街地図領域原点経度
Δy=道路ネットワーク地図領域原点緯度−市街地図領域原点緯度
で計算する。そして、元の市街地図座標(x1、y1)と道路ネットワーク座標(x1、y2)は、それぞれ以下のように、共通座標空間上の市街地図座標(x′1、y′1)と道路ネットワーク座標(x′1、y′2)に変換される。
(x′1、y′1)=(F1x(x1)、F1y(x1))
(x′1、y′2)=(F2x(x1)、F2y(x1))
ここに、変換関数Fix(),Fiy()は(Δx、Δy)及び各地図領域313、315の右上端の最大座標(Xi,Yi)を使用したリニア変換関数である。
このような座標変換を道路ネットワークデータと市街地図データに施すことで、両データの座標空間が一致し、それにより、図16に示すように、道路ネットワークデータ317の各ノード319を市街地図データ321の対応する位置323に投影することが可能になる(この投影は、後の交差点多角形作成処理305で行われる)。
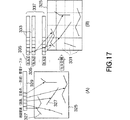
前処理304では、次に、後の交差点多角形作成処理305での幾何計算量を減らすために、メモリ上に展開した市街地図データと道路ネットワークデータを、それぞれ、多数のセル(小さい矩形領域)に分割してセル単位で管理する。すなわち、当初、図17(A)に示すように、各地図データは、それがカバーする全体の地図領域325内に存在する全ての地図要素327へのポインタが登録された地図要素管理テーブル329を有している。前処理304では、図17(B)に示すように、各地図データの全体地図領域325を均等サイズの多数のセル331に分割する。そして、地図要素管理テーブル329内の地図要素へのポインタの集合を、各セル331内に存在する地図要素へのポインタの集合に分類して、各セル毎のポインタ集合333に各セルのインデックス335を付す。これにより、各セル内に存在する地図要素だけが、各セルから指されるようになる。もし1つの地図要素が複数のセルに跨る場合は、それら複数のセルからその地図要素が指されるようにしておく。このようにして作成された、地図要素をセル別に管理したテーブル337を、以下「インデックステーブル」という。インデックステーブル337は、道路ネットワークデータ及び市街地図データの各々について作成さえる。セルのサイズは小さくすればするほど、幾何計算の対象データ数が少なく絞り込まれるが、管理しなければならないセル数が増加する。よって、セルのサイズは、ケースバイケースで最適値に決定する。
次に、図18〜図25を参照して、交差点多角形作成処理305を説明する。
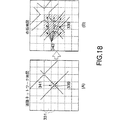
交差点多角形作成処理305では、まず、道路ネットワークデータ内の全ノードデータを順番に取り出す。そして、取り出した個々のノードに注目し、図18(A)に示すように、注目ノード339が属するセル341を、前処理304で作成されたインデックステーブル337を利用して決定する。そして、図18(B)に示すように、注目ノード339が属するセル341と同じセル番号を持つ市街地図のセルと、これに隣接する全てのセルを、対象領域343として選択する。
このように注目ノードに対する対象領域343が絞りこまれたら、次に、図19に示すように、道路ネットワーク地図内の注目ノード339とこの注目ノード339に接続するリンクL1〜L4を、市街地図の対象領域343内の家枠や道路枠や歩道境界等の地図要素に重ねる。そして、ノード重心を中心とした所定半径Rの円形領域(検索範囲)345から、市街地図の地図要素の形状要素点347を探す。ここで、「ノード重心」とは、注目ノード339そのもの、又は注目ノード339から所定距離範囲内に存在する全ての形状要素点から計算される重心(これは、注目ノード339が実際の交差点の中心からかなりずれているときに、有利である)である。図19の例では、分かりやすくするために、注目ノード339をノード重心としている。また、「形状要素点」とは、線分ベースの市街地図の地図要素(折れ線分)の端点やコーナ点である。
検索範囲345から形状要素点347を検索する際、まず、注目ノード339に接続するリンクL1〜L4間の角度θ1〜θ4を求める(要するに、検索領域345を、リンクL1〜L4で複数のセクタS1〜S4に区分する)。ここで、θ1はL1とL2間の角度、θ2はL2とL3間の角度、θ3は3とL4間の角度、θ4はL4とL1間の角度である。そして、各角度θi(i=1,2,3,4)の範囲(つまり各セクタSi)ごとに、形状要素点347を検索する。
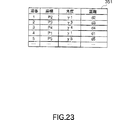
図20は、最初の角度θ1の範囲(最初のセクタS1)での検索結果の例を示している。このセクタS1から検索した全ての形状要素点P1,P2,P3…の各々について、ノード重心339からの距離d1、d2、d3、…を計算し、その結果を、図21に示すように、検索結果テーブル349に蓄積していく。セクタS1内の全ての形状要素点について距離算出が終了したら、図21の検索結果テーブル349を距離の昇順にソートし、セクタS1内で最小距離を持つ形状要素点Pjを見つける。例えば、図20において、形状要素点P3の距離d3が最小であったとする。次に、図22に示すように、その最小距離d3からそれに所定の許容幅εだけ加えた距離d3+εまでの円弧状のベルト範囲B1を設定し、このベルト範囲B1内に存在する形状要素点P1〜P5を、交差点多角形を構成する形状要素点として抽出する。そして、抽出した形状要素点P1〜P5を、図23に示すように、交差点多角形要素テーブル351に登録する。このとき、形状要素点P1〜P5の各々の角度(ノード重心339を回転中心にして、例えばx軸方向を角度0として例えば右回りに角度を測ったときの、各形状要素点の角度)γ1〜γ5も、交差点多角形要素テーブル351に登録する。
以上の処理を他のセクタS2,S3,S4についても同様に繰り返す。すると、図24に示すように、全てのセクタS1〜S4のバンド範囲B1〜B4から抽出された交差点多角形を構成する形状要素点353のデータが、図23に示した交差点多角形要素テーブル351に蓄積される。次に、交差点多角形要素テーブル351に登録された形状要素点353を角度γの昇順にソートする。角度γの順番に形状要素点353を並べと、図25に示すような交差点多角形355が定義される。こうして作成された交差点多角形データを、図14に示した交差点多角形データベース306に蓄積する。
以上の交差点多角形データの作成処理を、道路ネットワークデータの全てのノードについて繰り返す。
次に、図26及び図27を参照して、道路多角形補正処理308を説明する。
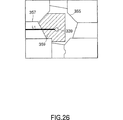
道路多角形補正処理308では、交差点多角形データベース306に蓄積された交差点多角形データを用いて、道路多角形データベース307に蓄積されている交差点領域を含む道路多角形データから交差点領域を除去する。図26に示すように、注目ノード339についての交差点多角形データベース306からのデータが表す交差点多角形355と、注目ノード339に接続するリンクL1についての道路多角形データベース307からのデータが表す道路多角形データ357とは、ハッチングで示した領域359にて重なり合っている。そこで、道路多角形355と交差点多角形357との間で領域差分の幾何演算を行うことにより、道路多角形355から重なり領域359を取り除く。
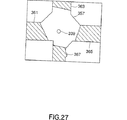
この交差点多角形357による領域差分演算を、注目ノード339に接続する全てのリンクの道路多角形に関して繰り返す。その結果、図27に示すように、交差点多角形357と重ならずに接した純粋道路多角形361、363、365、367が得られる。この純粋道路多角形361、363、365、367のデータを純粋道路多角形データベース309に登録する。
次に、図28〜図33を参照して、誘導用交差点多角形作成処理310を説明する。
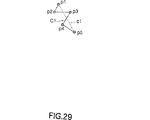
誘導用交差点多角形作成処理310では、まず、図28に示すように、注目ノード339の交差点多角形357と、リンクL1の純粋道路多角形361との接線C1を抽出する。接線C1は、図29に示すような折れ線であり、
C1=(p1、p2、p3、…)
と表現できる。接線C1の始点p1と終点p5だけを取り出して、始点p1と終点p5を結ぶ直線である仮想接線c1を作る。つまり、
c1=(p1、p5)
である。
同様にして、交差点多角形357に接する他の道路多角形361、363、365、367についても、接線C2,C3,C4を抽出し、仮想接線c2、c3、c4を求める。次に、これらの仮想接線c1、c2、c3、c4の中から、任意に2つの仮想接線を取り出す。例えば仮想接線c1とc2を取り出したとすると、次に、図30に示すように、仮想接線c1と仮想接線c2の延長線の交点K1を求める。この交点K1にて仮想接線c1とc2のなす角度をθとする。この角度θが所定値以上である場合は、交点K1から仮想接線c1とc2の外側端点p12とp22までの距離d1とd2を算出する。そして、長い方の距離d1をもつ仮想接線c1の外側端点p12から、他方の仮想接線c2へ向けて、交点K1を中心にした円弧a1を伸ばし、この円弧a1と仮想接線c2の延長線との交点K2で円弧a1を止める。こうして求まった外側端点p12から交点K2までの円弧a1を、誘導用交差点多角形の一つの輪郭線とする。同じ誘導用交差点多角形の他の輪郭線として、交差点多角形355の輪郭線をそのまま利用する。つまり、交差点多角形355を円弧a1で2つの領域に切ったときの、交点K1に近い側の領域を、誘導用交差点多角形とする。結果として、図31に示すような誘導用交差点多角形371が完成する。
図30に示した処理で、交点K1での仮想接線c1とc2のなす角度θが所定値より小さい(つまり、仮想接線c1とc2が平行に近い)場合は、図32に示すように、仮想接線c1の端点p11、p12と仮想接線c2の端点p21、p22を矩形ができるように直線b1、b2で接続する。この2本の直線b1、b2と、元の接線C1,C2とから構成される多角形を、誘導用交差点多角形373とする。
以上の誘導用多角形を作成する処理を、N差路の交差点の場合、N個の道路多角形の集合から選ぶことのできる2個の道路多角形の組合せの全部に関して行う。すると、例えば図33(A)に示すような4差路の交差点の場合、図33(B)〜(G)に示すような6個の誘導用交差点多角形381、383、385、387、388、389が作成される。作成された誘導用交差点多角形のデータを、誘導用交差点多角形データベース311へ格納する。全ての交差点について、上記の誘導用交差点多角形作成処理310を繰り返す。
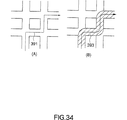
以上のようにして作成された交差点多角形データ、純粋道路多角形データ及び誘導用交差点多角形データは、様々な用途に利用することができる。その一つは、カーナビゲーションにおけるルート誘導である。図34(A)に示すように、従来のルート誘導では、折れ線391でルートを示していた。これに対し、純粋道路多角形データと誘導用交差点多角形データとを用いると、図34(B)に示すように、純粋道路多角形データと誘導用交差点多角形データとを繋いだ実際のルート形状に近いルート多角形393で、ルートを表示することができる。
別の一つの用途は、カーナビゲーションにおける道路渋滞表示である。図35〜図37を参照して、道路渋滞表示の方法を説明する。
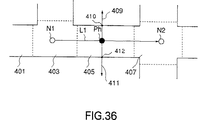
例えば日本の財団法人道路交通情報通信システムセンターのVICS(Vehicle Information and Communication System)(登録商標)から提供される渋滞情報は、上り車線と下り車線の各々について、渋滞列の始端と終端の位置を、最初と最後の交差点からの距離をそれぞれ用いて指定する。その一例を図35に示す。図35では、上り車線(ノードN2からノードN1へ向かって走行する車線)について、渋滞列の終端がノードN1の交差点からHメートルと指定された場合を示している。この場合、図36に示すように、その上り車線が通るノードN1に接続したリンクL1(折れ線である)に沿って距離Hだけ、ノードN1から離れた渋滞列終端点Phの座標を計算する。
次に、渋滞列終端点PhからリンクL1の両側へ、リンクL1に垂直な直線409、411を伸ばす。そして、それら垂線409、411と、ノードN1の交差点多角形403、リンクL1の純粋道路多角形405及びノードN2の交差点多角形407との交点を求める。そして、次の処理(1)〜(3)をこの順序で行う。
(1) 起点ノードN1の交差点多角形403と垂線409、411との交点が有る場合(つまり、渋滞列終端点Phが交差点多角形403内に存在する場合)、交差点多角形403を垂線409、411で2つの領域に切って、ノードN1に近い方の(つまり、車の流れで下流側の)領域だけを渋滞列であると判断する。交差点多角形403と垂線409、411との交点が無い場合(つまり、渋滞列終端点Phが交差点多角形403より上流側に存在する場合)、交差点多角形403の全域を渋滞列であると判断し、次の(2)のステップへ進む。
(2) リンクL1の道路多角形405と垂線409、411との交点(例えば410、412)が有る場合(つまり、渋滞列終端点Phが道路多角形405内に存在する場合)、道路多角形405を垂線409、411で2つの領域に切って、ノードN1に近い方の(つまり、下流側の)領域だけを渋滞列であると判断する。道路多角形405と垂線409、411との交点が無い場合(つまり、渋滞列終端点Phが道路多角形405より上流側に存在する場合)、道路多角形405の全域を渋滞列であると判断し、次の(3)のステップへ進む。
(3) 終点ノードN2の交差点多角形407と垂線409、411との交点が有る場合(つまり、渋滞列終端点Phが交差点多角形407内に存在する場合)、交差点多角形407を垂線409、411で2つの領域に切って、ノードN1に近い方の(つまり、下流側の)領域だけを渋滞列であると判断する。交差点多角形407と垂線409、411との交点が無い場合(つまり、渋滞列終端点Phが交差点多角形407より上流側に存在する場合)、交差点多角形407の全域を渋滞列であると判断する。
次に、図37に示すように、渋滞列と判断された多角形領域、つまり、渋滞列終端点Phでの垂線409、411より下流側の道路及び交差点多角形の領域405A、403、401を、ハッチングで示すように、渋滞列を示す色又はテクスチャで塗りつぶして表示する。渋滞列の始端についても、上記と同様の処理で、始端より上流側の多角形領域だけを渋滞列を示す色又はテクスチャで塗りつぶして表示する。つまり、上記の処理を渋滞列の終端と始端について行うことで、渋滞列の始端から終端までの正確な道路領域が強調表示される。
なお、図38に示すように、個々の車線を1つの道路と捉えて車線で区別された道路及び交差点の多角形データ411〜433を作成することもでき、その場合には、渋滞表示やルート表示を車線別に行なうことができる。例えば、図38では、片方の車線の渋滞部分がハッチングで示されている。
個々の車線を表した多角形データを作成することは、上述したように地図上の渋滞している車線を識別して示したり、カーナビゲーションでドライバーを正しい車線に誘導したりするために、とても有用である。図39〜図45は、個々の車線を表した多角形データを作成するための一方法例を示している。
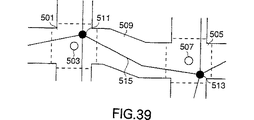
図39に示すように、道路ネットワークデータのノード511、513及びリンク515の位置は、市街地図から作成した交差点ポリゴン501、505及び純粋道路ポリゴン509と、必ずしも位置的に整合しているとは限らない。そこで、まず、交差点ポリゴンの幾何重心503、507をそれぞれ求め、その各幾何重心503、507を各交差点ポリゴン501、505の新しいノードと定義する。
次に、図40に示すように、交差点ポリゴン501、505と純粋道路ポリゴン509との間の接線521、523、並びに純粋道路ポリゴン509を貫くリンク515に注目する。そして、その接線521、523とそのリンク515との交点531、533を抽出する。
次に、図41に示すように、リンク515上の一方の交点531から他方の交点533までの間の適当間隔の複数位置から、リンク515に垂直な線541〜544をリンク515の両側へ延ばす。そして、それらの垂線541〜544と、純粋道路ポリゴン509の上記接線521、523以外の輪郭線551、553との交点561〜568を求める。
次に、図42に示すように、上のように求めた交点561〜568を、垂線541〜544の端点とする。そして、それらの垂線541〜544と上記接線521、523の各々を、この道路のもつ車線の本数Nで等分する。ここで、この道路のもつ車線の本数Nは、道路ネットワークデータに含まれるリンク515の属性データから得ることができ、1以上の整数である(N=1の場合は、当然ながら、その純粋道路ポリゴン自体が既にその単一の車線を表している)。図42の例では、車線本数Nは2であり、そのため、各垂線541〜544と各接線521、523は、各々の中点572〜575、571、576で2等分される。そして、これらの中点を順番に通る線分581を求め、この線分581で、この純粋道路ポリゴン509を2つのサブ道路ポリゴン591、593に分割する。得られた2つのサブ道路ポリゴン591、593を、この道路のもつ2本の車線を表した車線ポリゴンとして、道路地図データに登録する。
更に、図42に示すように、各車線ポリゴン591、593の中に、カーナビゲーションのための車両誘導線を設定する(N>1の場合だけでなく、N=1の場合も行う)。車両誘導線は、上述した車線ポリゴン591、593を区分する線分581を求めたときの方法と同様の方法で求めることができる(N=1の場合、線分581が車両誘導線となる)。すなわち、車線ポリゴン591、593の各々の内側で、上記垂線541〜544と上記接線521、523の各々の中点(図42では白抜き丸印で示す)を求め、それらの中点を順番に通る線分(図42では破線で示す)を求め、この線分を各車線ポリゴン591、593の車両誘導線として、道路地図データに登録する。
さらに、2本以上の車線を持つ道路に接する各交差点ポリゴンの中にも、複数の車線ポリゴンと誘導線を設定する。
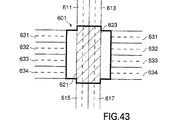
図43は、交差点ポリゴン601内に、図中の上の道路の2本の車線ポリゴン611、613と、下の道路の2本の車両ポリゴン615、617とを結ぶ、直進用の2本の交差店内車線ポリゴン621、623を設定した例を示している。図示してないが、同様に、左の道路の複数本の車線631〜634と右の道路の複数の車線641〜644とを結ぶ直進用の複数本の交差店内車線ポリゴンも設定される。図中の破線は、各車線ポリゴン内に設定された車両誘導線を示している。
図44は、交差点ポリゴン601内に、左側通行の場合の左折(右側通行の場合の右折)用の車線ポリゴン651〜654を作成した例を示す。この例では、図中で左右に走る道路の最外側の車線ポリゴン631、641、634、644と、上下に走る道路の最外側の車線ポリゴン611、613、615、617とが、交差点内車線ポリゴン651〜654によってそれぞれ結ばれている。交差点内車線ポリゴン651〜654のカーブした輪郭線は、クロソイド曲線、円弧、楕円弧、放物線、双曲線または折れ線などで表現することができる。図中の破線は、各車線ポリゴン内に設定された車両誘導線を示している。
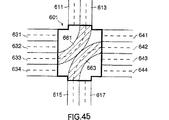
図45は、交差点ポリゴン601内に、左側通行の場合の右折(右側通行の場合の左折)用の車線ポリゴン661、663を作成した例を示す。この例では、図中で左右に走る道路の内側の車線ポリゴン633、642と、上下に走る道路の内側の車線ポリゴン613、617とが、交差点内車線ポリゴン661、663によってそれぞれ結ばれている。交差点内車線ポリゴン661、663のカーブした輪郭線は、クロソイド曲線、円弧、楕円弧、放物線、双曲線または折れ線などで表現することができる。図中の破線は、各車線ポリゴン内に設定された車両誘導線を示している。
このように各交差点ポリゴン内に直進や右左折に必要な車線ポリゴンを予め用意しておき、各車線ポリゴン内に誘導線を設定しておくことにより、交差点での車両の誘導を正確に行うことができる。図43〜図45に示した交差点内の車線ポリゴンは、説明のための例示に過ぎない。交差する道路の車線本数、各車線の走行方向(固定的に定まっている場合もあるし、時間帯によって切換わる場合もある)、適用される交通法規などに応じて、用意するべき交差点内車線ポリゴンの種類は異なる。
さて、以上説明した交差点ポリゴン、純粋道路ポリゴン及び車線ポリゴンの作成は、静的な方法と動的な方法のいずれ方法でも行うことができる。静的な方法とは、地図の全域にわたり全ての交差点ポリゴン、純粋道路ポリゴン及び車線ポリゴンを先に作成して地図データベースに格納しておく方法である。道路地図を表示する際には、データベースから表示すべき地域のポリゴンを読み出して表示することができる。一方、動的な方法とは、前もって全てのポリゴンを作成しておくことはせずに、道路地図を表示する都度に、必要な区域の必要なポリゴンだけを、市街地図データと道路ネットワークデータから作成する方法である。静的な方法は、ふんだんに大きい記憶容量をもつ道路地図表示装置に適している。一方、動的な方法は、カーナビゲーション装置のような、十分大きい記憶容量が確保し難い地図表示装置に適している。
カーナビゲーション装置などで動的にポリゴン地図データを作成する場合、ポリゴンデータの作成に使える時間が短く限られているため、ポリゴンデータ化する道路の取捨選択が重要になる。図46は、カーナビゲーション装置で動的にポリゴン地図データを作成する際のポリゴン作成の対象の地域的範囲をどこに限定するかという点についての、一つの原理を示している。
図46に示すように、ポリゴン作成の対象の地域は、自動車が停止しているか超低速で走行しているときは、その自動車の位置701(図示の三角マークは図中上方へ向いて走行していることを示す)をほぼ中心とした、所定半径のほぼ円形の地域711とする。自動車が中速で走行しているときは、その自動車の位置701を後端部に含む、その自動車の進行方向へより長く延びたほぼ楕円形または卵形の地域713を、その対象地域とする。自動車の速度がより上がると、その自動車の位置701を後端部に含む、その自動車の進行方向へより一層細長く延びたほぼ楕円形または卵形の地域715を、その対象地域とする。
図47〜図49は、上記の原理の下での具体的なポリゴン作成対象地域の選定方法を示す。
カーナビゲーション用の地図は、一般に、多数の小面積の矩形の区域(メッシュ)に分割されて管理されている。そのため、道路や交差点のポリゴンを動的に生成する対象の地域は、複数のメッシュの集合となる。
図47に示すように、停止時または超低速走行時には、自動車の現在位置701(三角マークは図中上方へ走行していることを示す)を含むメッシュM0と、このメッシュM0を包囲する例えば隣接の8個のメッシュM1〜M8を、ポリゴン作成の対象とする。そして、自動車の進行方向(停止時は、指向している方向)に応じて、その自動車が次の時点で存在する可能性(つまり、ドライバーが必要とする可能性)のより高いメッシュほどを先順位にするという順序で、これらのメッシュM0〜M8を処理していく。すなわち、最初に、現在位置701を含むメッシュM0を処理して道路や交差点のポリゴンを作成する。次に、現在位置のメッシュM0の前方にあるメッシュM2を処理する。その次が、進行方向の左右斜め前方のメッシュM1とM3(順不同)であり、その次が、現在位置のメッシュM0の左右のメッシュM4とM5(順不同)であり、その次が、現在位置のメッシュM0の左右斜め後方のメッシュM6とM7(順不同)であり、最後が、現在位置のメッシュM0の後方のメッシュM7である。
図48に示すように、中速走行時には、現在位置701の後方は無視し、進行方向に存在するより多くのメッシュを、ポリゴン作成の対象とする。例えば、現在位置のメッシュM0と、その前方及び左右の8個のメッシュM1〜M8を対象とする。そして、やはり、進行方向に応じて、その自動車が次の時点で存在する可能性(つまり、ドライバーが必要とする可能性)のより高いメッシュほどを先順位にするという順序で、これらのメッシュM0〜M8を処理していく。すなわち、最初が、現在位置のメッシュM0であり、次が、現在位置のメッシュM0の前方にあるメッシュM5、その次が、更に前方及び左右斜め前方にあるメッシュM2とM4とM6(順不同)、その次が、左右斜め更に前方にあるメッシュM1とM3(順不同)、最後が、左右隣のメッシュM7とM8(順不同)である。
図49に示すように、高速走行時には、自動車の現在位置701から進行方向前方に存在するより一層多くの数のメッシュ(走行速度によって増減するであろうが、例えば18個のメッシュM0〜M17)を処理対象とする必要がある。この場合、中速以下のときのように、対象のメッシュ内の全ての道路及び交差点をポリゴン化するのは、装置の性能及びドライバー安全性の観点から、得策ではない。そこで、ドライバーにとって必要性が或る程度以上高い道路及び交差点を選択して、その選択した道路及び交差点のみをポリゴン化する。例えば、その自動車が現在走行している道路の種別と同じ種別の道路及び交差点のみを選択するとか、或いは、その同じ種別の道路及び交差に加えて、予め決めておいた優先順位が高い種別の道路及び交差点を選択するというようにである。ここで、道路の種別とは、例えば「国道10号線」とか「靖国通り」といった道路固有名称、及び「国道」、「県道」、「市道」、「自動車専用道路」、「高速道路」などといった道路分類名称のことであり、道路ネットワークデータに含まれるリンクの属性データから得られる。
ポリゴン化する道路及び交差点の数又は種別は、自動車の走行速度vに応じて、増減することができる。例えば次の原理に従った増減方法を採用することができる。すなわち、現在の走行速度vでポリゴン化処理を行う必要のあるメッシュの個数をNとし、1メッシュのサイズ(一辺の長さ)をXとし、1メッシュ内で作成すべきポリゴンの平均的個数をmとしたとき、1メッシュの処理に要する平均的時間S(m)が次式を充たすように、1メッシュ当たりの作成ポリゴン数mを決定する。
S(m)・N=X/v
つまり、自動車が1メッシュ分の距離を通過するのに要する時間X/v内に、処理対象のN個のメッシュの全てのポリゴン化処理を終えるように、1メッシュ当たりの作成すべき平均的ポリゴン数mを決定する。そして、1メッシュ当たりの実際に作成する平均的ポリゴン数が、上記のmを超えないように、ポリゴン化対象の道路種別を選定する。
以上のような方法で動的に道路及び交差点ポリゴンを作成することにより、自動車の走行速度に応じた適切なドライバ誘導を行うことができる。
図50は、本発明の一実施形態にかかる道路地図表示装置を示す。
この道路地図表示装置800は、市街地図データ801と、ポリゴン道路ネットワークデータ803と、表示部805とを有する。ポリゴン道路ネットワークデータ803は、従来のノードとリンクから構成される道路ネットワークデータにおけるノードの形状データを点データから本発明の方法で作成した交差点ポリゴンデータに置き換え、リンクの形状データを線分データから本発明の方法で作成された純粋道路ポリゴンデータに置き換えたものである。更に、このポリゴン道路ネットワークデータ803には、上述したような純粋道路ポリゴンを分割したレーンポリゴンデータや交差点ポリゴン内に設定した交差点内レーンポリゴンデータを含むこともできる。表示部805は、市街地図データ801から市街地図画像を描画し、ポリゴン道路ネットワークデータ803から市街地図上の道路と交差点の形状に合致した形状をもつ道路ポリゴンと交差点ポリゴンの画像を描画し(必要あれば、それらポリゴンを特定の色で塗りつぶし)、そして、市街地図画像上に道路ポリゴンと交差点ポリゴンの画像を重ねて表示する。これにより、市街地図上の道路と交差点の形状に良好に合致した領域が道路及び交差点として表示される。また、例えばこの装置800がカーナビゲーションに用いられる場合、表示部805は、ポリゴン道路ネットワークデータ803を用いて出発地から目的地までの道路経路を探索する経路探索機能や、ポリゴン道路ネットワークデータ803を用いて自動車の現在位置を或る道路ポリゴン又は或る交差点ポリゴン内に入るように修正したりする。
図51は、ポリゴン道路ネットワークデータ803の構造を示す。
ポリゴン道路ネットワークデータ803には、個々のノード(交差点)を表すノードデータ901と、個々のリンク(道路)を表すリンクデータ903と、ノードとリンクの関連性を表す関連データ905とが含まれている。関連データ905は、例えば、特定の一つのノードのノードデータ901に、特定のn本のリンクのリンクデータ903が接続しているというような、ノードとリンクの接続関係を示している。
各ノードデータ901は、そのノードの属性を示す属性データ913と、そのノードの形状を示す形状データ915とを含む。各リンクデータ903は、そのノードの属性を示す属性データ917と、そのノードの形状を示す形状データ919とを含む。ここで、関連データ905及び属性データ913、917としては、道路ポリゴンデータや交差点ポロゴンデータを作成する最に用いた従来の道路ネットワークデータのそれを流用することができる。一方、ノードの形状データ915は、そのノードの交差点ポリゴンデータであり、リンクの形状データ919は、そのリンクの純粋道路ポリゴンデータである。
要するに、このポリゴン道路ネットワークデータ803は、先述したように、従来の道路ネットワークデータにおいて、各ノードの形状データとして従来の点データを交差点ポリゴンデータに置き換え、かつ、各リンクの形状データとして従来の線分データを純粋ポリゴンデータに置き換えたものである。そのため、例えばカーナビゲーションシステムなどで、このポリゴン道路ネットワークデータ803を用いて経路探索やマップマッチングなどの処理を行う場合、従来の道路ネットワークデータを用いた従来の経路探索アルゴリズムや従来のマップマッチングの基本部分を流用することができる。また、このポリゴン道路ネットワークデータ803を用いて作成した道路地図画像は、道路及び交差点の形状と位置において、市街地図画像と良好にマッチするので、ユーザにとって見やすいものとなる。
上述した実施形態は本発明の説明のための例示に過ぎず、本発明をこの実施形態のみに限定する趣旨ではない。本発明は、上述の実施形態以外の様々な形態で実施することができる。
【図面の簡単な説明】
図1は、家枠や歩道形状等々の詳細に描かれた市街地図データの例を示す図。
図2は、交差点をノードとし道路をノード間を結ぶ方向付きベクトルにモデル化して持つ道路ネットワークデータの例を示す図。
図3は、本発明の原理に従って完成した道路多角形データを、市街地図データに重ねて表示した例を示す図。
図4は、本発明の一実施形態にかかる道路多角形作成装置のシステム構成を示すブロック図。
図5は、簡易道路多角形作成処理の手順を示す説明図。
図6は、道路幅員を測る方法を示す説明図。
図7は、要素多角形の領域和を計算する手順を示す説明図。
図8は、外形多角形と中抜き多角形を示す説明図。
図9は、鋏データ作成処理の手順を示す説明図。
図10は、3本以上の線分が近接する場合の鋏データの作成方法を示す説明図。
図11は、道路多角形作成処理の手順を示す説明図。
図12は、道路多角形による交差点の表現を示す図。
図13は、道路多角形と交差点多角形を用いたルート誘導の例を示す図。
図14は、本発明の別の実施形態にかかる道路多角形作成装置の概略構成を示すブロック図。
図15は、市街地図と道路ネットワーク地図の座標空間における不一致を説明する図。
図16は、道路ネットワークデータを市街地図データへ投影した図。
図17は、セル分割を説明する図。
図18は、対象セルを説明する図。
図19は、道路ネットワーク地図と市街地図を重ねた状態での形状要素点の検索を説明した図。
図20は、θ1のセクタS1での検索を説明した図。
図21は、セクタS1内の最小距離を持つ要素点を見つける為のテーブルを示す図。
図22は、交差点多角形を構成する要素点を説明する図。
図23は、交差点多角形を構成する要素点を蓄積したテーブルを示す図。
図24は、全てのセクタから交差点多角形を構成する要素点を検索した結果を示す図。
図25は、交差点多角形が完成を示す図である
図26は、道路多角形と交差点多角形の重なりを示す図。
図27は、交差点多角形と重ならない純粋な道路多角形を示す図。
図28は、道路多角形と交差点多角形との接線を示す図。
図29は、実際の接線と仮想の接線の関係を説明した図。
図30は、2つの仮想接線から、誘導用交差点多角形の一つの輪郭線となる円弧を作る方法を説明した図。
図31は、図30に示した円弧を用いて作った誘導用交差点多角形を示す図。
図32は、ほぼ平行な2本の仮想接線から誘導用交差点多角形を作る方法を説明した図。
図33は、四差路交差点の場合に作成される6種類の誘導用交差点多角形を示す図。
図34は、従来のルート誘導の表示例と、誘導用交差点多角形を利用したルート誘導の表示例とを示した図。
図35は、渋滞を通知する情報の内容を説明した図。
図36は、渋滞列の終端の位置を決める方法を説明した図。
図37は、渋滞列を表示した例を示す図。
図38は、車線別に渋滞列を表示した例を示す図。
図39は、純粋道路内に車線ポリゴンを作成する第1のステップを示す図。
図40は、純粋道路内に車線ポリゴンを作成する第2のステップを示す図。
図41は、純粋道路内に車線ポリゴンを作成する第3のステップを示す図。
図42は、純粋道路内に車線ポリゴンを作成する第4のステップを示す図。
図43は、交差点内の直進用車線ポリゴンの例を示す図。
図44は、交差点内の左側通行の左折用の車線ポリゴンの例を示す図。
図45は、交差点内の左側通行の右折用の車線ポリゴンの例を示す図。
図46は、カーナビゲーション装置で動的にポリゴン地図データを作成する際のポリゴン化対象の地域的範囲をどこに限定するかという点の原理を示した図。
図47は、停止時または超低速走行時のポリゴン作成対象地域の選定方法を示す図。
図48は、中速走行時のポリゴン作成対象地域の選定方法を示す図。
図49は、高速走行時のポリゴン作成対象地域の選定方法を示す図。
図50は、本発明の一実施形態にかかる道路地図表示装置を示すブロック図。
図51は、交差点及び道路の形状をポリゴンで表現したポリゴン道路ネットワークデータの構造を示す図。Technical field
The present invention relates to a map image processing technique for handling road map data, and more particularly to an apparatus and method for creating road data.
Technical background
Electronic map technology for displaying electronic map image data on a screen using a computer is used in various applications including car navigation. Now, in general, when displaying roads in a map, in a small scale map such as a wide area map, there is no problem if the road is drawn as a simple line ignoring its width. However, in a large scale map such as a detailed city map, the road needs to be displayed as an area having an accurate width. Naturally, various methods of creating and displaying road data for expressing a road with a width are also developed in the electronic map. For example, those described in JP-A-62-80774, JP-A-4-303271, JP-A-4-303272, and JP-A-6-83931 are known.
The graphic processing apparatus described in Japanese Patent Application Laid-Open No. Sho 62-80774 eliminates the hassle of setting and drawing one straight line constituting a road outline one by one when creating a road map having a width. When a person sets a start point, an end point, and a road width, a pair of parallel lines running at an interval equivalent to the road width is drawn from the start point to the end point, and when a certain parallel line pair intersects with another parallel line pair, The parallel lines are automatically deleted at the intersection. Therefore, a road map having a width including an intersection can be easily created.
When a person sets a road width and draws a reference line with a cursor, the apparatus described in Japanese Patent Application Laid-Open No. 4-303271 draws a pair of parallel lines that run along the reference line with an interval corresponding to the road width.
The apparatus described in Japanese Patent Application Laid-Open No. 4-303272, when two roads each expressed as a pair of parallel straight lines partially overlap each other with an angle, draws a corner by correcting the parallel lines at the overlapping portion.
The apparatus described in Japanese Patent Laid-Open No. 6-83931 draws a connecting portion between roads using a pair of parallel straight lines and an arcuate line when connecting two roads respectively represented by parallel line pairs. .
Thus, according to the prior art, road data is represented by a pair of parallel lines. However, the actual road shape is very complicated, and it is impossible to accurately represent this by using only parallel line pairs. In particular, in a very large-scale detailed city map that accurately depicts a median strip, a sidewalk, a lane, and the like, conventional road data creation technology using parallel line pairs is completely useless.
In addition, there is a demand for automatically roads that can be painted with colors or textures in an electronic city map. There are paper-based city maps that are easy to see by coloring the roads in a different color from other areas, and even electronic maps are naturally easy to see if the roads are painted in a specific color. In order to automatically fill a road, the road must be represented by closed-loop polygon data. However, since conventional road data is not a collection of mere line segments such as parallel lines and arcuate lines, the road cannot be automatically filled. Therefore, in a conventional electronic city map, buildings represented by polygons are painted in a specific color, but roads are simply drawn with outlines and are not colored specially. Not.
In addition, the electronic map can provide convenient functions such as changing the scale and searching for a route. For example, a route search is performed with a car navigation device and a route is displayed on a map, and a small scale wide area map is displayed while driving on a highway while driving a car along the route. When you enter, you can use it like switching to a large scale city map. In this case, if the searched route passes, for example, the A road, the route must be displayed on the same A road on both the wide area map and the city map. For this purpose, each road on the wide area map and the same road on the city map need to be logically associated with each other. In general, in a wide area map, roads may be displayed as simple lines, and road data is road network data expressed by vector data that connects intersections with nodes as nodes. On the other hand, in the city map, the road data is a set of road outline line segment data such as parallel line pairs and arcuate lines indicating the outline of the road as described above. Conventionally, a road on a city map and a road on a wide area map are associated with each other by associating the center coordinates of an intersection on the city map with a node of road network data on the wide area map. However, as a result, the searched route is simply expressed as a broken line connecting the center points of the intersections on the city map, and this makes full use of the advantages of the city map showing the road shape in detail. It can not be said.
Accordingly, an object of the present invention is to automatically create road data that exactly matches a complicated road shape.
Another object of the present invention is to automatically create road data using polygon data so that a road having a width can be filled.
Still another object of the present invention is to automatically create road data that accurately represents a road shape for a city map in association with road network data used in a wide area map.
Still another object of the present invention is to solve some specific technical problems, which will be described later, which occur in developing a practical technique for achieving the above object. .
Disclosure of invention
The road data creation device according to the present invention provides (1) a simple road polygon that includes a road with a width on a city map data from road network data that is modeled as a link that connects an intersection as a node and a road. Generating (2) creating 鋏 data defining the outline of the road from the city map data, and (3) trimming the simple road polygon along the outline defined by the 鋏 data. Create road polygon data shaped into road shape on the data. As a result, a road having a complicated shape on the city map is represented as a polygon.
In a preferred embodiment, when creating a simple road polygon, if a plurality of independent simple road polygons are created for one link, the plurality of simple polygons are defined as an outline polygon corresponding to the outline of the road. And a hollow polygon corresponding to the hollow surface of the road. As a result, a closed loop-like road having a hollow surface can be well polygonalized.
In a preferred embodiment, the nodes and links of the road network data are expanded more than the width of the road on the city map data, thereby creating a simple road polygon containing the road on the city map. At that time, the node expands more than the link. In addition, the bending point of the link is expanded to a large extent. As a result, a simple road polygon is created that reliably includes a slightly larger area such as an intersection or a road corner. In this way, after creating a simple road polygon that completely encloses the road, trimming it with the heel data indicating the road outline and deleting the excess part, it matches the road outline shape well Road polygon is obtained.
In a preferred embodiment, when creating the heel data, a shape line near the road on the city map data is selected, and the shape lines whose end points coincide with each other or close to each other are connected among the selected shape lines. The obtained line segment data is designated as cocoon data. As a result, hail data showing a good road outline can be obtained.
In a preferred embodiment, a lane data creating unit that creates a plurality of lane polygon data representing a plurality of lanes from the shaped road polygon data, and a guide line is set inside each of the lane polygon data. And a guide line setting unit.
In a preferred embodiment, when it becomes necessary to display a road map of a part of the entire map area covered by the road network data, the shaped road is included in the road included only in the part of the area. Dynamically create road polygon data.
A road map display device according to the present invention includes polygon road map data including road polygon data in which each road to be displayed is represented by a polygon, and a display unit that displays the road using the road polygon data. With.
In a preferred embodiment of this road display device, the polygonal road map data includes lane polygon data representing each lane in the road as a polygon, and guide line data representing a guide line set in each lane. In addition, the display unit not only displays the road, but also displays each lane in the road using the lane polygon data, and further selects one lane selected using the guide line data. The guidance mark located inside is also displayed.
In a preferred embodiment of the road display device, when road network data, city map data, and a road map of a part of the entire map area covered by the road network data need to be displayed, A road polygon data creating unit that dynamically creates road polygon data for roads included only in the area to be displayed based on the road network data and the city map data.
An intersection polygon creation device according to the present invention includes road network data having nodes representing intersections and links between nodes representing roads between intersections, and line segment data representing the shape of map elements as a set of shape element points. Receive and with city map data. Then, this device projects road network data onto city map data, determines a predetermined search area including a target node of the road network data on the city map data, and determines a predetermined position within the determined search area. The shape element point located so as to satisfy the condition is searched. Next, the apparatus creates intersection polygon data for the node of interest using the searched shape element points. According to this apparatus, intersection polygon data can be automatically created from road network data and line segment-based city map data. The created intersection polygon data inevitably has a data relation to the node in the road network data.
In a preferred embodiment, after determining the search area, the apparatus divides the search area into a plurality of sub-search areas using a link connected to the node of interest, and each apparatus has a unique search for each sub-search area. The intrinsic positional condition is determined as the positional condition. Then, this apparatus searches the shape element points having the unique position condition in each of the sub search areas, and collects the shape element points searched in the plurality of sub search areas to create intersection polygon data. Each sub-region includes shape element points at each corner of the intersection. Since the positional relationship between the node of interest and each corner portion is different for each corner portion, the shape element points of each corner portion can be accurately determined by determining the specific positional conditions suitable for each corner portion for each sub-region. Can be extracted. Therefore, accurate intersection polygon data can be obtained.
In a preferred embodiment, the apparatus determines a closest point closest to the node of interest among the shape element points in each of the plurality of sub-search regions in the search region, and A band region that is separated from the point of interest by a distance range between the first distance and a second distance obtained by adding a predetermined allowable width to the first distance is set. And this apparatus picks up only the shape element point which exists in the band area | region in each sub search area | region as a point which comprises an intersection polygon. By this method, an accurate intersection polygon can be obtained with high accuracy.
In a preferred embodiment, the apparatus divides the city map area covered by the city map data into a plurality of small cells, and from among these cells, at least one cell close to the position corresponding to the node of interest. (For example, a cell in which the node of interest is located and a cell adjacent thereto) are selected as target cells, and the search area is determined in the target cell. This method reduces the amount of data handled in each intersection polygon creation process and reduces the burden on the computer.
In a preferred embodiment, the apparatus further receives road map data having road polygon data, and if the road polygon data and the intersection polygon data have an overlapping area, The overlapping area is removed from the road polygon data using the intersection polygon data, and pure road polygon data that does not overlap with the intersection polygon data is created.
In a preferred embodiment, the apparatus further determines a plurality of tangents tangent to the plurality of roads from the intersection polygon data, and extracts two tangents from the determined plurality of tangents. Then, this apparatus creates a substantially intersection-shaped or approximately rectangular guiding intersection polygon that smoothly connects the two extracted tangent lines within the polygon area covered by the intersection polygon data.
Another road map display device according to the present invention receives road map data having road polygon data and guidance intersection polygon data, and from the road map data, road polygon data of a plurality of roads to be displayed, and The guide intersection polygon data for connecting the plurality of roads is selected, and the road and the intersection are displayed using the selected road polygon data and the guide intersection polygon data.
Another road map display device of the present invention receives road map data having road polygon data and intersection polygon data, and also receives traffic information indicating the end position of a traffic jam row. Then, this device selects road polygon data or intersection polygon data for the road or intersection where the end position of the traffic jam column exists from the road map data, and selects the selected road polygon data or intersection polygon data from the road map data. It is divided into an upstream region portion and a downstream region portion at the end position. Then, this apparatus is provided for the downstream area of the divided road polygon data or intersection polygon data, and the road polygon data and intersection multiples for roads and intersections existing downstream along the traffic jam column from the downstream area. Using the square data, the road and intersection area where the traffic jam column exists are displayed. Thereby, it is possible to accurately display the area of the road where the traffic is congested.
The computer-readable data recording medium of the present invention has node data and link data associated with each other so as to constitute a road network, and each node data represents the shape of the intersection of each node as a polygon. Stored is polygon road network data including road polygon data including intersection polygon data and representing the road shape of each link as a polygon.
By using this polygon road network data, the computer map application can create and display a polygon road map image whose shape and position match well with the roads and intersections drawn on the city map. Become. In addition, the map application uses the basic portion of the conventional route search or map matching algorithm using the conventional road network data when the route search or map matching is performed using the polygon road network data. be able to.
Still another map image display device of the present invention receives the polygon road network data described above and the polygon road network data, and creates a polygon road image composed of a polygon representing an intersection and a polygon representing a road. A display unit for displaying.
In a preferred embodiment, the road map display device further includes city map data, and the display unit creates a city map image using the city map data, and superimposes the polygon road image on the city map image. To display. The display unit has a function of performing processing such as route search or map matching using the polygon road network data.
The present invention can typically be implemented using a computer, and a computer program therefor can be installed or loaded on a computer using various media such as various disk-type storage, semiconductor memory, and communication network signals. Can do. The present invention can be implemented not only by a single computer but also by distributed processing using a plurality of computers.
BEST MODE FOR CARRYING OUT THE INVENTION
Hereinafter, an embodiment of the present invention will be specifically described with reference to the drawings.
FIG. 1 shows an example of a city map in which a house frame, a sidewalk shape, and the like are drawn in detail and accurately. FIG. 2 shows an example of road network data that is modeled and expressed as a vector with a direction (link) that connects a node with an intersection as a node.
In accordance with the principle of the present invention, the road network data as shown in FIG. 2 is superimposed on the city map as shown in FIG. It is possible to generate road polygon data in which the shape is well reproduced. FIG. 3 shows an example in which the road polygon data completed in such a manner is hatched and displayed superimposed on the city map data shown in FIG. As can be seen from FIG. 3, road polygon data that accurately matches the complicated road shape of the city map is obtained. Moreover, as shown in the figure, the road can be painted, so that an easy-to-see city map can be provided. Also, each road (link between intersections) in the road network data shown in FIG. 2 is converted into each road polygon (road polygon from the intersection to the intersection) shown in FIG. 3 by hatching. There can be a one-to-one association. As a result, for example, when a route search is performed, the searched route can be represented on the city map as a filled road itself, instead of a simple broken line connecting the intersection centers as in the prior art.
FIG. 4 shows a system configuration of a road data creation device according to an embodiment of the present invention.
This road data creation device is typically a programmed general purpose computer. The
The
Next, the
Next, the
Hereinafter, the simple road
FIG. 5 shows the procedure of the simple road
In the simple road
Next, the simple road
The
W1 = (d1 * D1 + d2 * D2 + d3 * D3 + d4 * D4) / (D1 + D2 + D3 + D4)
The lower road width W2 is
W2 = (d5 * D5 + d6 * D6 + d7 * D7 + d8 * D8) / (D5 + D6 + D7 + D8)
Determined by Creating an element polygon that completely includes the road on the city map by expanding the line segment Li up and down by distances W3 and W4 that are appropriately larger than the road widths W1 and W2 thus determined. Can do. Furthermore, as described above, an element polygon that is expanded more than the line segment Li is created at the start point or node of the line segment Li. The reason for this is that road corners and intersections (these are the In many cases, the width of the road is larger than the straight part of the road.
Moreover, the calculation of the area sum for changing the plurality of
Next, an inside / outside determination is performed to check whether or not each of the line segment groups F11 and F12 generated from the first polygon G1 is included in the region of the second polygon G2. The inside / outside determination method itself is known. As a result, it is found that the first line segment group F11 exists in the outer region of the second polygon G2, and this is left to be the outer peripheral line segment of the new polygon. On the other hand, it is found that the second line segment group F12 exists in the inner region of the polygon G2, and this is discarded. Similarly, with respect to the line segment groups F21 and F22 generated from the second polygon G2, the inside / outside determination for the polygon G1 is performed. As a result, since the first line segment group F21 exists in the inner area of the polygon G1, the first line segment group F21 is discarded, and the second line segment group F22 exists in the outer area of the polygon G1. Leave as minutes.
Finally, as shown in FIG. 7D, the remaining peripheral line segment groups F11 and F22 are connected. In FIG. 7, the start point of F11 and the start point of F22 are drawn at locations apart from each other. However, since they actually exist at the same coordinates, F11 and F22 can be connected to each other. A new polygon G is completed by connecting the remaining peripheral line segment groups in this way. One simple road polygon shown in FIG. 5 (e) is obtained by applying such region summation processing to all adjacent element polygons constituting one link shown in FIG. 5 (d). 27 is obtained.
By the way, for example, a road having a closed loop-like shape on a map, such as a spiral approach road to an expressway, has a simple road polygon with a hollow surface in the area. In such a case, in the process of creating a simple road polygon, it is necessary to correctly identify the outer polygon that defines the outer shape of the simple road polygon and the hollow polygon that defines the hollow surface. . FIG. 8 shows a method of identifying the outer shape polygon and the hollow polygon in such a case. For example, when the processing shown in FIGS. 5 and 7 is performed from the
Now, in this example, as shown in FIG.8 (c), the
Next, the eyelid data creation process 6 will be described.
As described above, the dredging data defines a cut line for trimming a simple road polygon created larger than the actual road shape and shaping it into an accurate road shape. Therefore, it is ideal that the dredging data, that is, the cut line, runs along the exact outer shape of the road and does not enter the area within the road. The eyelid data creation process 6 is a process for creating eyelid data that is as ideal as possible.
FIG. 9 shows the procedure of the eyelid data generation process 6.
First, as shown in FIG. 9A,
In general, the shape lines having various attributes constituting the outline of the road on the
In this way, the shape lines near each road are extracted, and the shape lines that can be connected are selected from the shape lines and connected to one line segment. The contour line data is included with considerably high accuracy. This process is performed for each road in the city map data, and the connected line segment data obtained for each road is stored in the heel database 7 as heel data for the simple road polygon of each road.
By the way, when connecting adjacent shape lines, not only the case where the end points of only two line segments are close to each other, but also the case where the end points of three or more line segments are close to each other. There are many. For example, as shown in FIG. 10A,
Next, the road
The road
When the simple road polygon is cut along the line segment of each tile data, the simple road polygon is divided into two line segment groups. Among them, the line segment group containing the node of the road network data (that is, the road inside) is left, and the other line group (that is, the road outside) is discarded. Similarly, the dredging data is also cut at the line segment of the simple road polygon, and only the line segment group included in the simple road polygon is left among the plurality of line segment groups of the dredging data. Then, by connecting the remaining simple road polygon line segment group and the remaining dredge data line segment group, a new simple road polygon is obtained in which the outer portion of the road is cut along the dredge data. It is done.
By repeating such trimming with each hail data for all the hail data that pass through, a road polygon that finally matches the contour shape of the road with considerable accuracy can be obtained. For example, when the rough-shaped
Through the series of processes described above, a road polygon that accurately matches the shape of the road represented on the city map can be automatically created. This data has good compatibility with road network data due to its characteristics, and the link relationship with a wide area map created from the road network data becomes clear. Further, the road related information held in the road network data can also be held in association with the road polygon.
By the way, in the road map data using the road polygon described above, the area of each road from each intersection to the adjacent intersection is represented by one polygon. A configuration example of the road map data is shown in FIG. 12A, and a road image displayed on the screen based on the road map data is shown in FIG. As shown in FIG. 12A, the road map data is composed of data of a plurality of
There is a demand to use road map data for more advanced applications than conventional applications. For example, in route guidance to a destination in car navigation, conventionally, the route is displayed as a simple line segment connecting the intersections with straight lines. However, it is easier for the user to see the method of highlighting and displaying the roads and intersection areas themselves constituting the route. When the latter route is displayed, in order to display the intersection of the route in an excellent manner, the intersection is represented as an independent polygon accurately distinguished from the road polygon on the polygon-based road map data. Is preferable. As shown in FIG. 12A, when an intersection is included in a road polygon, for example, when a route that is folded from the
The route search process for determining the route from the starting point to the destination is, for example, 1 / 255,000 scale road network data that exists in the past (intersections are expressed by nodes (coordinate points), and roads between nodes) Based on the directional vector). Therefore, in order to perform the route display using the polygon described above, it is also necessary that the intersection polygon and the road polygon of the road map data have a data relationship with the intersection node and the road vector of the road network data.
Further, regarding the display of the intersection portion of the guidance route, as shown in FIG. 13B, the travel within the
In order to solve these problems, it is desirable to create road map data in which not only roads but also intersections are represented by independent polygons.
FIG. 14 shows a system configuration of an apparatus according to an embodiment of the present invention for creating road map data expressing polygons for roads and intersections.
This road map data creation device is typically a programmed general-purpose computer. The
The
Next, the
Next, the
Next, the
The pre-processing 304, the intersection
In the
Δx = Road network map area origin longitude-City map area origin longitude
Δy = latitude of road network map area origin-latitude of city map area origin
Calculate with Then, the original city map coordinates (x1, y1) and road network coordinates (x1, y2) are respectively the city map coordinates (x′1, y′1) and the road network coordinates in the common coordinate space as follows. Converted to (x′1, y′2).
(X′1, y′1) = (F1x (x1), F1y (x1))
(X′1, y′2) = (F2x (x1), F2y (x1))
Here, the conversion functions Fix () and Fiy () are linear conversion functions using (Δx, Δy) and the maximum coordinates (Xi, Yi) at the upper right end of each
By applying such coordinate conversion to the road network data and the city map data, the coordinate spaces of the two data coincide with each other, whereby each
In the pre-processing 304, next, in order to reduce the amount of geometric calculation in the subsequent intersection
Next, the intersection
In the intersection
When the
When searching the
FIG. 20 shows an example of a search result in the range of the first angle θ1 (first sector S1). For each of the shape element points P1, P2, P3,... Searched from the sector S1, distances d1, d2, d3,... From the
The above processing is repeated in the same manner for the other sectors S2, S3, and S4. Then, as shown in FIG. 24, the data of the shape element points 353 constituting the intersection polygon extracted from the band ranges B1 to B4 of all the sectors S1 to S4 are the intersection polygon element table 351 shown in FIG. Accumulated in. Next, the shape element points 353 registered in the intersection polygon element table 351 are sorted in ascending order of the angles γ. When the shape element points 353 are arranged in the order of the angle γ, an
The above intersection polygon data creation process is repeated for all nodes of the road network data.
Next, the road
In the road
The area difference calculation by the
Next, the guidance intersection
In the guidance intersection
C1 = (p1, p2, p3,...)
Can be expressed as Only the start point p1 and the end point p5 of the tangent line C1 are extracted, and a virtual tangent line c1 that is a straight line connecting the start point p1 and the end point p5 is created. In other words,
c1 = (p1, p5)
It is.
Similarly, tangent lines C2, C3, and C4 are extracted from
In the process shown in FIG. 30, when the angle θ between the virtual tangent lines c1 and c2 at the intersection K1 is smaller than a predetermined value (that is, the virtual tangent lines c1 and c2 are nearly parallel), as shown in FIG. The end points p11 and p12 of the tangent line c1 and the end points p21 and p22 of the virtual tangent line c2 are connected by straight lines b1 and b2 so as to form a rectangle. A polygon composed of the two straight lines b1 and b2 and the original tangent lines C1 and C2 is defined as a
In the case of an intersection of N roads, the process for creating the above guiding polygon is performed for all combinations of two road polygons that can be selected from a set of N road polygons. Then, for example, in the case of a four-way intersection as shown in FIG. 33A, six guiding
The intersection polygon data, pure road polygon data, and guidance intersection polygon data created as described above can be used for various purposes. One of them is route guidance in car navigation. As shown in FIG. 34A, in the conventional route guidance, the route is indicated by a
Another application is road traffic congestion display in car navigation. With reference to FIG. 35 to FIG. 37, a method for displaying a traffic jam will be described.
For example, the traffic information provided by the VICS (Vehicle Information and Communication System) (registered trademark) of the Road Traffic Information and Communication System Center of Japan is based on the location of the start and end of the traffic congestion line for each of the upstream and downstream lanes. Specify the distance from the first and last intersection. An example is shown in FIG. FIG. 35 shows a case where the end of the traffic jam column is designated as H meters from the intersection of the node N1 for the up lane (the lane traveling from the node N2 toward the node N1). In this case, as shown in FIG. 36, the coordinates of the traffic jam end point Ph separated from the node N1 by the distance H along the link L1 (which is a broken line) connected to the node N1 through which the upward lane passes are calculated.
Next,
(1) When there is an intersection between the
(2) When there is an intersection (for example, 410, 412) between the
(3) When there is an intersection between the
Next, as shown in FIG. 37, polygon regions determined to be a traffic jam row, that is, roads and
As shown in FIG. 38, each lane is regarded as one road, and
Creating polygon data representing individual lanes is very important for identifying and showing traffic lanes on the map as described above, and for guiding the driver to the correct lane using car navigation. Useful. 39 to 45 show an example of a method for creating polygon data representing individual lanes.
As shown in FIG. 39, the positions of the
Next, as shown in FIG. 40, attention is paid to
Next, as shown in FIG. 41,
Next, as shown in FIG. 42, the intersection points 561 to 568 obtained as described above are set as the end points of the
Furthermore, as shown in FIG. 42, vehicle guidance lines for car navigation are set in the
Further, a plurality of lane polygons and guide lines are set in each intersection polygon that touches a road having two or more lanes.
FIG. 43 shows two intersections for straight travel that connect the two
FIG. 44 shows an example in which
FIG. 45 shows an example in which
In this way, lane polygons necessary for straight ahead and left / right turn are prepared in each intersection polygon in advance, and guide lines are set in each lane polygon to accurately guide the vehicle at the intersection. Can do. The lane polygons in the intersection shown in FIGS. 43 to 45 are merely illustrative examples. Intersection lanes to be prepared according to the number of lanes of intersecting roads, the driving direction of each lane (may be fixed or may change according to the time zone), applicable traffic regulations, etc. The types of polygons are different.
Now, the above-described intersection polygon, pure road polygon, and lane polygon can be created by either a static method or a dynamic method. The static method is a method in which all intersection polygons, pure road polygons, and lane polygons are first created and stored in the map database over the entire area of the map. When displaying a road map, it is possible to read out and display a polygon of a region to be displayed from the database. On the other hand, the dynamic method does not create all the polygons in advance, but every time a road map is displayed, only the necessary polygons in the necessary area are extracted from the city map data and road network data. How to create. The static method is suitable for a road map display device having a large storage capacity. On the other hand, the dynamic method is suitable for a map display device such as a car navigation device in which a sufficiently large storage capacity cannot be secured.
When polygon map data is dynamically created by a car navigation system or the like, the time available for creating polygon data is limited and the selection of roads to be polygon data is important. FIG. 46 shows one principle regarding where to limit the area of the polygon creation target when the polygon map data is dynamically created by the car navigation apparatus.
As shown in FIG. 46, when the automobile is stopped or traveling at an extremely low speed, the polygon
47 to 49 show specific polygon creation target area selection methods based on the above principle.
A map for car navigation is generally divided into a large number of small rectangular areas (mesh) and managed. For this reason, the target area for dynamically generating polygons for roads and intersections is a set of a plurality of meshes.
As shown in FIG. 47, when the vehicle is stopped or traveling at an ultra-low speed, a mesh M0 including the
As shown in FIG. 48, when traveling at medium speed, the rear of the
As shown in FIG. 49, when traveling at a high speed, a larger number of meshes existing forward of the traveling direction from the
The number or type of roads and intersections to be polygonized can be increased or decreased according to the traveling speed v of the automobile. For example, an increase / decrease method according to the following principle can be adopted. That is, N is the number of meshes that need to be polygonized at the current travel speed v, X is the size of one mesh (length of one side), and the average number of polygons to be created in one mesh is When m is set, the number m of polygons to be created per mesh is determined so that the average time S (m) required for processing one mesh satisfies the following equation.
S (m) · N = X / v
In other words, the average polygon to be created per mesh so that all polygons of the N meshes to be processed are completed within the time X / v required for the car to pass a distance of one mesh. The number m is determined. Then, the road type to be polygonized is selected so that the average number of polygons actually created per mesh does not exceed the above m.
By dynamically creating roads and intersection polygons by the method as described above, it is possible to perform appropriate driver guidance according to the traveling speed of the automobile.
FIG. 50 shows a road map display device according to an embodiment of the present invention.
The road
FIG. 51 shows the structure of the polygon
Polygon
Each
In short, as described above, the polygon
The above-described embodiment is merely an example for explaining the present invention, and is not intended to limit the present invention to this embodiment alone. The present invention can be implemented in various forms other than the above-described embodiment.
[Brief description of the drawings]
FIG. 1 is a diagram showing an example of city map data drawn in detail such as a house frame and a sidewalk shape.
FIG. 2 is a diagram illustrating an example of road network data having an intersection as a node and a road modeled as a vector with a direction connecting the nodes.
FIG. 3 is a diagram showing an example in which road polygon data completed in accordance with the principle of the present invention is displayed superimposed on city map data.
FIG. 4 is a block diagram showing a system configuration of the road polygon creation device according to the embodiment of the present invention.
FIG. 5 is an explanatory diagram showing a procedure of simple road polygon creation processing.
FIG. 6 is an explanatory diagram showing a method for measuring road width.
FIG. 7 is an explanatory diagram illustrating a procedure for calculating a region sum of element polygons.
FIG. 8 is an explanatory diagram showing an outer shape polygon and a hollow polygon.
FIG. 9 is an explanatory diagram showing a procedure of the eyelid data creation process.
FIG. 10 is an explanatory diagram showing a method for creating wrinkle data when three or more line segments are close to each other.
FIG. 11 is an explanatory diagram illustrating a procedure of road polygon creation processing.
FIG. 12 is a diagram showing an intersection representation by a road polygon.
FIG. 13 is a diagram illustrating an example of route guidance using a road polygon and an intersection polygon.
FIG. 14 is a block diagram showing a schematic configuration of a road polygon creating apparatus according to another embodiment of the present invention.
FIG. 15 is a diagram for explaining a mismatch in a coordinate space between a city map and a road network map.
FIG. 16 is a diagram in which road network data is projected onto city map data.
FIG. 17 is a diagram for explaining cell division.
FIG. 18 is a diagram for explaining a target cell.
FIG. 19 is a diagram illustrating a search for shape element points in a state where a road network map and a city map are overlaid.
FIG. 20 is a diagram for explaining the search in the sector S1 of θ1.
FIG. 21 is a diagram showing a table for finding an element point having a minimum distance in the sector S1.
FIG. 22 is a diagram for explaining element points constituting an intersection polygon.
FIG. 23 is a diagram showing a table in which element points constituting an intersection polygon are accumulated.
FIG. 24 is a diagram showing a result of searching for element points constituting an intersection polygon from all sectors.
FIG. 25 is a diagram showing the completion of the intersection polygon.
FIG. 26 is a diagram showing an overlap between a road polygon and an intersection polygon.
FIG. 27 shows a pure road polygon that does not overlap the intersection polygon.
FIG. 28 is a diagram showing a tangent line between a road polygon and an intersection polygon.
FIG. 29 is a diagram illustrating a relationship between an actual tangent and a virtual tangent.
FIG. 30 is a diagram illustrating a method of creating an arc that is one outline of a guidance intersection polygon from two virtual tangents.
FIG. 31 is a diagram showing a guidance intersection polygon made using the arc shown in FIG. 30.
FIG. 32 is a diagram illustrating a method of creating a guidance intersection polygon from two substantially parallel virtual tangents.
FIG. 33 is a diagram showing six types of guidance intersection polygons created in the case of a four-way intersection.
FIG. 34 is a diagram showing a conventional route guidance display example and a route guidance display example using a guidance intersection polygon.
FIG. 35 is a diagram illustrating the content of information for notifying a traffic jam.
FIG. 36 is a diagram illustrating a method for determining the position of the end of a traffic jam queue.
FIG. 37 is a diagram showing an example in which a traffic jam column is displayed.
FIG. 38 is a diagram showing an example in which a congestion line is displayed for each lane.
FIG. 39 is a diagram showing a first step of creating a lane polygon in a pure road.
FIG. 40 is a diagram showing a second step of creating a lane polygon on a pure road.
FIG. 41 is a diagram showing a third step of creating a lane polygon on a pure road.
FIG. 42 is a diagram showing a fourth step of creating a lane polygon on a pure road.
FIG. 43 is a diagram showing an example of a straight lane polygon in an intersection.
FIG. 44 is a diagram showing an example of a left-turn lane polygon for left-hand traffic within an intersection.
FIG. 45 is a diagram showing an example of a right-turn lane polygon for left-hand traffic in an intersection.
FIG. 46 is a diagram showing the principle of how to limit the regional range to be polygonized when polygon map data is dynamically created by the car navigation device.
FIG. 47 is a diagram showing a method for selecting a polygon creation target area when stopped or traveling at an extremely low speed.
FIG. 48 is a diagram showing a method for selecting a polygon creation target area during medium speed running.
FIG. 49 is a diagram showing a method for selecting a polygon creation target area when traveling at high speed.
FIG. 50 is a block diagram showing a road map display device according to one embodiment of the present invention.
FIG. 51 is a diagram showing a structure of polygon road network data in which intersections and road shapes are represented by polygons.
Claims (7)
前記データ入力部が受けたポリゴン道路ネットワークデータを用いて、前記交差点の多角形画像と前記道路の多角形画像を含むポリゴン道路画像を作成し表示する表示部と
を備えた道路地図表示装置。Intersection polygon data expressing an intersection as a polygon, road polygon data expressing a road as a polygon, node data expressing the intersection as a point, and link data expressing the road as a vector connecting nodes A data input unit that receives polygon road network data in which the intersection polygon data and the road polygon data are respectively associated with the node data and the link data on a one-to-one basis;
A road map display device comprising: a display unit that creates and displays a polygonal road image including the polygonal image of the intersection and the polygonal image of the road using the polygonal road network data received by the data input unit.
前記ポリゴン道路画像には、更に、前記車線の多角形画像も含まれる請求項3記載の道路地図表示装置。The polygon road network data further includes lane polygon data representing lanes in the road as polygons obtained by dividing the road polygon,
The road map display device according to claim 3 , wherein the polygon road image further includes a polygon image of the lane.
前記ポリゴン道路ネットワークデータを用いて、前記交差点の多角形画像と前記道路の多角形画像を含むポリゴン道路画像を作成し表示するステップと
を道路地図表示装置が行う道路地図表示方法。Intersection polygon data expressing an intersection as a polygon, road polygon data expressing a road as a polygon, node data expressing the intersection as a point, and link data expressing the road as a vector connecting nodes Receiving the polygon road network data in which the intersection polygon data and the road polygon data are respectively associated one-to-one with the node data and the link data;
A road map display method in which a road map display device performs a step of creating and displaying a polygon road image including the polygon image of the intersection and the polygon image of the road using the polygon road network data.
前記ポリゴン道路ネットワークデータを用いて、前記交差点の多角形画像と前記道路の多角形画像を含むポリゴン道路画像を作成し表示するステップとをコンピュータに実行させるコンピュータプログラムを格納したコンピュータ読み取り可能な記録媒体。Intersection polygon data expressing an intersection as a polygon, road polygon data expressing a road as a polygon, node data expressing the intersection as a point, and link data expressing the road as a vector connecting nodes Receiving the polygon road network data in which the intersection polygon data and the road polygon data are respectively associated one-to-one with the node data and the link data;
A computer-readable recording medium storing a computer program for causing a computer to execute a polygon road image including the polygon image of the intersection and the polygon image of the road using the polygon road network data. .
Priority Applications (1)
| Application Number | Priority Date | Filing Date | Title |
|---|---|---|---|
| JP2000595305A JP4875240B2 (en) | 1999-01-25 | 2000-01-20 | Polygon road network data creation device, road map display device and method |
Applications Claiming Priority (6)
| Application Number | Priority Date | Filing Date | Title |
|---|---|---|---|
| JP1999015372 | 1999-01-25 | ||
| JP1537299 | 1999-01-25 | ||
| JP1999189974 | 1999-07-05 | ||
| JP18997499 | 1999-07-05 | ||
| PCT/JP2000/000248 WO2000043953A1 (en) | 1999-01-25 | 2000-01-20 | Device and method for creating and using data on road map expressed by polygons |
| JP2000595305A JP4875240B2 (en) | 1999-01-25 | 2000-01-20 | Polygon road network data creation device, road map display device and method |
Publications (1)
| Publication Number | Publication Date |
|---|---|
| JP4875240B2 true JP4875240B2 (en) | 2012-02-15 |
Family
ID=26351498
Family Applications (1)
| Application Number | Title | Priority Date | Filing Date |
|---|---|---|---|
| JP2000595305A Expired - Fee Related JP4875240B2 (en) | 1999-01-25 | 2000-01-20 | Polygon road network data creation device, road map display device and method |
Country Status (7)
| Country | Link |
|---|---|
| US (1) | US6622085B1 (en) |
| EP (2) | EP1450309A3 (en) |
| JP (1) | JP4875240B2 (en) |
| KR (1) | KR100579767B1 (en) |
| CN (1) | CN1168046C (en) |
| TW (1) | TW504618B (en) |
| WO (1) | WO2000043953A1 (en) |
Families Citing this family (102)
| Publication number | Priority date | Publication date | Assignee | Title |
|---|---|---|---|---|
| JP4663136B2 (en) * | 2001-01-29 | 2011-03-30 | パナソニック株式会社 | Method and apparatus for transmitting location information of digital map |
| JP4791649B2 (en) * | 2001-05-07 | 2011-10-12 | 株式会社ゼンリン | Electronic map data, display control device and computer program |
| US6917877B2 (en) * | 2001-08-14 | 2005-07-12 | Navteq North America, Llc | Method for determining the intersection of polygons used to represent geographic features |
| JP4746794B2 (en) * | 2001-08-21 | 2011-08-10 | クラリオン株式会社 | Car navigation apparatus and recording medium recording car navigation control program |
| US20030132932A1 (en) * | 2001-09-17 | 2003-07-17 | Xiangheng Yang | Method for constructing polygons used to represent geographic features |
| US20040194017A1 (en) * | 2003-01-06 | 2004-09-30 | Jasmin Cosic | Interactive video interface |
| JP3997917B2 (en) * | 2003-01-10 | 2007-10-24 | 株式会社デンソー | Map search device |
| US7463770B2 (en) * | 2003-07-21 | 2008-12-09 | Lockheed Martin Corporation | Methods and systems for detection of repeating patterns of features |
| WO2005013242A1 (en) * | 2003-08-04 | 2005-02-10 | Matsushita Electric Industrial Co., Ltd. | Digital map position information communication method, program for executing the same, program product therefor, system therefor, and apparatus therefor |
| DE10343944A1 (en) | 2003-09-23 | 2005-04-14 | Robert Bosch Gmbh | Method for displaying road data in digital maps and method for determining the position of a vehicle |
| US20080097689A1 (en) * | 2004-08-04 | 2008-04-24 | Speedalert Pty Ltd | An information apparatus for an operator of a land or water based motor driven conveyance |
| JP4603332B2 (en) * | 2004-10-18 | 2010-12-22 | クラリオン株式会社 | Summary map generator |
| JP4580209B2 (en) * | 2004-10-18 | 2010-11-10 | クラリオン株式会社 | Summary map generator |
| KR100657937B1 (en) * | 2004-12-14 | 2006-12-14 | 삼성전자주식회사 | Real time 3 dimensional transformation method for 2 dimensional linear data and apparatus therefor, and real time 3 dimensional visualization method for 2 dimensional linear data and apparatus therefor |
| KR100634536B1 (en) * | 2005-01-25 | 2006-10-13 | 삼성전자주식회사 | 3 dimensional transformation method for 2 dimensional overpass data on 3 dimensional graphics environment and apparatus therefor, and 3 dimensional visualization method for 2 dimensional overpass data on 3 dimensional graphics environment and apparatus using the same |
| JP4790280B2 (en) * | 2005-02-04 | 2011-10-12 | 三菱電機株式会社 | MAP DATA DISPLAY DEVICE, MAP DATA DISPLAY METHOD, NAVIGATION DEVICE, AND MAP DATA DISPLAY PROGRAM |
| JP2006301601A (en) * | 2005-03-23 | 2006-11-02 | Zenrin Co Ltd | Device for generating map data |
| US8370054B2 (en) | 2005-03-24 | 2013-02-05 | Google Inc. | User location driven identification of service vehicles |
| JP5309291B2 (en) * | 2005-04-25 | 2013-10-09 | 株式会社ジオ技術研究所 | Shooting position analysis method |
| EP1904952A2 (en) * | 2005-05-23 | 2008-04-02 | Nextcode Corporation | Efficient finder patterns and methods for application to 2d machine vision problems |
| EP1917643B1 (en) * | 2005-07-26 | 2011-11-23 | DeCarta Inc. | Generalization of features in a digital map |
| JP4742285B2 (en) * | 2005-09-20 | 2011-08-10 | 株式会社ゼンリン | MAP INFORMATION CREATION DEVICE AND METHOD, AND PROGRAM |
| JP5075331B2 (en) | 2005-09-30 | 2012-11-21 | アイシン・エィ・ダブリュ株式会社 | Map database generation system |
| US7603231B2 (en) * | 2005-11-12 | 2009-10-13 | Alpine Electronics, Inc. | Navigation method and system having improved arrival detection function for large scale destination |
| US9067565B2 (en) | 2006-05-22 | 2015-06-30 | Inthinc Technology Solutions, Inc. | System and method for evaluating driver behavior |
| US7859392B2 (en) | 2006-05-22 | 2010-12-28 | Iwi, Inc. | System and method for monitoring and updating speed-by-street data |
| JP5089921B2 (en) * | 2006-05-31 | 2012-12-05 | パイオニア株式会社 | Road polygon creation device, method and program |
| DE102006055958A1 (en) * | 2006-11-24 | 2008-05-29 | Siemens Ag | Method and device for storing or displaying given geometric objects and computer program product |
| US7859537B2 (en) * | 2007-01-23 | 2010-12-28 | Microsoft Corporation | Evaluation of self-intersecting vector graphics objects via planar map profiles |
| DE102007009640A1 (en) * | 2007-02-26 | 2008-09-04 | Deutsches Zentrum für Luft- und Raumfahrt e.V. | Method for depositing routes contained in digital maps |
| US8825277B2 (en) * | 2007-06-05 | 2014-09-02 | Inthinc Technology Solutions, Inc. | System and method for the collection, correlation and use of vehicle collision data |
| DE102007028401B4 (en) * | 2007-06-15 | 2011-08-25 | Navigon Ag, 20251 | Method for operating a navigation device |
| US8666590B2 (en) | 2007-06-22 | 2014-03-04 | Inthinc Technology Solutions, Inc. | System and method for naming, filtering, and recall of remotely monitored event data |
| US9129460B2 (en) | 2007-06-25 | 2015-09-08 | Inthinc Technology Solutions, Inc. | System and method for monitoring and improving driver behavior |
| DE102007030259A1 (en) * | 2007-06-28 | 2009-01-08 | Navigon Ag | Method for operating a mobile navigation device |
| US7999670B2 (en) | 2007-07-02 | 2011-08-16 | Inthinc Technology Solutions, Inc. | System and method for defining areas of interest and modifying asset monitoring in relation thereto |
| US8577703B2 (en) | 2007-07-17 | 2013-11-05 | Inthinc Technology Solutions, Inc. | System and method for categorizing driving behavior using driver mentoring and/or monitoring equipment to determine an underwriting risk |
| US9117246B2 (en) * | 2007-07-17 | 2015-08-25 | Inthinc Technology Solutions, Inc. | System and method for providing a user interface for vehicle mentoring system users and insurers |
| US8818618B2 (en) | 2007-07-17 | 2014-08-26 | Inthinc Technology Solutions, Inc. | System and method for providing a user interface for vehicle monitoring system users and insurers |
| US7920961B2 (en) * | 2007-08-29 | 2011-04-05 | Sap Ag | Method and apparatus for path planning and distance calculation |
| US7876205B2 (en) | 2007-10-02 | 2011-01-25 | Inthinc Technology Solutions, Inc. | System and method for detecting use of a wireless device in a moving vehicle |
| US20090254841A1 (en) * | 2007-11-12 | 2009-10-08 | Move Sales, Inc. | Apparatus, method, and computer program product for characterizing user-defined areas |
| US20090132469A1 (en) * | 2007-11-16 | 2009-05-21 | Urban Mapping, Inc. | Geocoding based on neighborhoods and other uniquely defined informal spaces or geographical regions |
| US20090177393A1 (en) * | 2008-01-07 | 2009-07-09 | Simone Francine Tertoolen | Navigation device and method |
| JP5197848B2 (en) * | 2008-07-30 | 2013-05-15 | トムトム グローバル コンテント ベスローテン フエンノートシャップ | Method for generating branch point view image and computer-implemented system |
| US8688180B2 (en) | 2008-08-06 | 2014-04-01 | Inthinc Technology Solutions, Inc. | System and method for detecting use of a wireless device while driving |
| DE102009019498A1 (en) * | 2009-02-10 | 2010-08-19 | Navigon Ag | Method for generating a digital road map, navigation system and method for operating a navigation system |
| US8892341B2 (en) | 2009-02-13 | 2014-11-18 | Inthinc Technology Solutions, Inc. | Driver mentoring to improve vehicle operation |
| US8963702B2 (en) | 2009-02-13 | 2015-02-24 | Inthinc Technology Solutions, Inc. | System and method for viewing and correcting data in a street mapping database |
| DE102009043309A1 (en) * | 2009-02-26 | 2010-09-16 | Navigon Ag | Method and navigation device for determining the estimated travel time |
| DE102010006702A1 (en) * | 2009-02-26 | 2010-09-02 | Navigon Ag | Method and device for calculating alternative routes in a navigation system |
| KR101609679B1 (en) * | 2009-03-31 | 2016-04-06 | 팅크웨어(주) | Apparatus for map matching of navigation using planar data of road and method thereof |
| KR101023502B1 (en) * | 2009-07-22 | 2011-03-21 | 주식회사 와이드지리정보 | The system for creating road of numerical map and method therefor |
| US20110054792A1 (en) * | 2009-08-25 | 2011-03-03 | Inthinc Technology Solutions, Inc. | System and method for determining relative positions of moving objects and sequence of such objects |
| US8493407B2 (en) * | 2009-09-03 | 2013-07-23 | Nokia Corporation | Method and apparatus for customizing map presentations based on user interests |
| CN102169511A (en) * | 2010-02-25 | 2011-08-31 | 上海市政工程设计研究总院 | Road horizontal alignment computer aided design method |
| US8612138B2 (en) * | 2010-09-15 | 2013-12-17 | The University Of Hong Kong | Lane-based road transport information generation |
| EP2455714B1 (en) * | 2010-11-18 | 2019-01-23 | Harman Becker Automotive Systems GmbH | Method and device for displaying road segments |
| JP2012133132A (en) * | 2010-12-22 | 2012-07-12 | Geo Technical Laboratory Co Ltd | Map data generation system |
| US9350810B2 (en) * | 2011-01-18 | 2016-05-24 | Google Inc. | Constructing an integrated road network |
| US8566030B1 (en) * | 2011-05-03 | 2013-10-22 | University Of Southern California | Efficient K-nearest neighbor search in time-dependent spatial networks |
| CN102610111A (en) * | 2011-12-06 | 2012-07-25 | 北京捷易联科技有限公司 | Method and device for generating and providing traffic information sketch |
| CN103208226B (en) * | 2012-01-17 | 2015-04-15 | 深圳市腾讯计算机系统有限公司 | Method and device for rendering interchange road in electronic map system |
| EP2631594B1 (en) * | 2012-02-22 | 2015-09-09 | Harman Becker Automotive Systems GmbH | Navigation system and method for navigation |
| TWI453374B (en) * | 2012-05-04 | 2014-09-21 | Univ Cheng Shiu | A mobile navigation for specific area route plan method |
| US9123152B1 (en) * | 2012-05-07 | 2015-09-01 | Google Inc. | Map reports from vehicles in the field |
| US9453734B2 (en) * | 2012-06-05 | 2016-09-27 | Apple Inc. | Smart loading of map tiles |
| TWI485421B (en) * | 2012-12-17 | 2015-05-21 | Ind Tech Res Inst | Map matching device, system and method |
| US9086278B2 (en) * | 2012-12-21 | 2015-07-21 | Navionics Spa | Apparatus and methods for routing |
| US9405445B2 (en) | 2012-12-21 | 2016-08-02 | Navionics Spa | Apparatus and methods for routing |
| WO2014205632A1 (en) * | 2013-06-24 | 2014-12-31 | Adobe Systems Incorporated | Gravity point drawing method |
| CN104422458A (en) * | 2013-08-30 | 2015-03-18 | 深圳富泰宏精密工业有限公司 | Vehicle navigation system and vehicle navigation method |
| US9172477B2 (en) | 2013-10-30 | 2015-10-27 | Inthinc Technology Solutions, Inc. | Wireless device detection using multiple antennas separated by an RF shield |
| US20150202770A1 (en) * | 2014-01-17 | 2015-07-23 | Anthony Patron | Sidewalk messaging of an autonomous robot |
| JP5847891B2 (en) * | 2014-06-24 | 2016-01-27 | 株式会社ジオ技術研究所 | Map data generation system |
| JP6391507B2 (en) * | 2015-03-18 | 2018-09-19 | アイシン・エィ・ダブリュ株式会社 | Navigation device, navigation program, and navigation method |
| US20170301232A1 (en) * | 2016-04-13 | 2017-10-19 | Here Global B.V. | Intersection Map Message Creation for Vehicle Communication |
| US10147215B2 (en) | 2016-04-17 | 2018-12-04 | Streetography, Inc. | Digitally generated set of regional shapes for presenting information on a display screen |
| US10612930B2 (en) * | 2016-07-26 | 2020-04-07 | Apple Inc. | Normalization of device probe data for path identification |
| EP3339806B1 (en) * | 2016-12-22 | 2019-05-22 | Gestalt Systems GmbH | Navigation for vehicle based on parallel processing to determine collision-free paths |
| US20180330325A1 (en) | 2017-05-12 | 2018-11-15 | Zippy Inc. | Method for indicating delivery location and software for same |
| US10809728B2 (en) * | 2017-09-15 | 2020-10-20 | Here Global B.V. | Lane-centric road network model for navigation |
| US10504283B2 (en) * | 2018-03-16 | 2019-12-10 | Here Global B.V. | Method and apparatus for regularizing building footprints using taxicab distance |
| US20190377981A1 (en) * | 2018-06-11 | 2019-12-12 | Venkata Subbarao Veeravasarapu | System and Method for Generating Simulated Scenes from Open Map Data for Machine Learning |
| US11087469B2 (en) * | 2018-07-12 | 2021-08-10 | Here Global B.V. | Method, apparatus, and system for constructing a polyline from line segments |
| US10997784B2 (en) | 2018-12-18 | 2021-05-04 | Microsoft Technology Licensing, Llc | Generating space models from map files |
| US11170230B2 (en) | 2019-02-26 | 2021-11-09 | Tusimple, Inc. | Method and system for map construction |
| US10803635B2 (en) * | 2019-02-26 | 2020-10-13 | Tusimple, Inc. | Method and system for map construction |
| CN111736582A (en) * | 2019-03-19 | 2020-10-02 | 北京奇虎科技有限公司 | Path processing method and device, electronic equipment and computer readable storage medium |
| CN110264542B (en) * | 2019-05-29 | 2023-09-05 | 浙江中控信息产业股份有限公司 | Method for drawing map mass lines on line |
| EP3971524A4 (en) * | 2019-06-11 | 2023-01-04 | Nippon Telegraph And Telephone Corporation | Polygon lookup method |
| WO2021048987A1 (en) * | 2019-09-12 | 2021-03-18 | 日本電信電話株式会社 | Preprocessing device, determination system, preprocessing method, and preprocessing program |
| JP7380704B2 (en) | 2019-11-11 | 2023-11-15 | 日本電信電話株式会社 | Centerline correction device, centerline correction method, spatial network data generation system and program |
| DE102019132374A1 (en) * | 2019-11-28 | 2021-06-02 | Bayerische Motoren Werke Aktiengesellschaft | Method for providing map data for at least two types of zones |
| CN111311710B (en) * | 2020-03-20 | 2023-09-19 | 北京四维图新科技股份有限公司 | High-precision map manufacturing method and device, electronic equipment and storage medium |
| JP7458883B2 (en) * | 2020-04-27 | 2024-04-01 | 株式会社小松製作所 | Transport vehicle management system and transport vehicle management method |
| CN112036924B (en) * | 2020-07-21 | 2023-12-26 | 长沙市到家悠享家政服务有限公司 | Service area optimization method and device |
| AU2022202051A1 (en) * | 2021-04-22 | 2022-11-10 | Navenio Ltd., | Alignment of map segments |
| US20230126130A1 (en) * | 2021-10-22 | 2023-04-27 | Zoox, Inc. | Drivable surface map for autonomous vehicle navigation |
| US11790604B2 (en) * | 2021-12-14 | 2023-10-17 | Gm Cruise Holdings Llc | Mapping data to generate simulation road paint geometry |
| WO2023146788A1 (en) * | 2022-01-26 | 2023-08-03 | Motional Ad Llc | Semantic annotation of sensor data with overlapping physical features |
| US20230296404A1 (en) * | 2022-03-21 | 2023-09-21 | Here Global B.V. | System and method for updating a map according to feature locations |
Citations (4)
| Publication number | Priority date | Publication date | Assignee | Title |
|---|---|---|---|---|
| JPS6339086A (en) * | 1986-08-04 | 1988-02-19 | Casio Comput Co Ltd | Simple image producing device |
| JPH07192193A (en) * | 1993-12-27 | 1995-07-28 | Nippondenso Co Ltd | Guiding device for travel path of vehicle |
| JPH0981031A (en) * | 1995-09-11 | 1997-03-28 | Hitachi Software Eng Co Ltd | Map processor and map display method |
| JPH112537A (en) * | 1998-05-14 | 1999-01-06 | Aisin Aw Co Ltd | Navigation device |
Family Cites Families (15)
| Publication number | Priority date | Publication date | Assignee | Title |
|---|---|---|---|---|
| JPH0280774A (en) | 1988-09-16 | 1990-03-20 | Kokuyo Co Ltd | Drawer latching mechanism |
| JPH03238599A (en) * | 1990-02-15 | 1991-10-24 | Clarion Co Ltd | On vehicle navigation equipment |
| US5214757A (en) * | 1990-08-07 | 1993-05-25 | Georesearch, Inc. | Interactive automated mapping system |
| JPH04303271A (en) | 1991-03-29 | 1992-10-27 | Toshiba Corp | Graphic preparing device |
| JPH04303272A (en) | 1991-03-29 | 1992-10-27 | Toshiba Corp | Graphic preparing device |
| JP2760253B2 (en) * | 1992-07-14 | 1998-05-28 | 住友電気工業株式会社 | Road moving image creation method and in-vehicle navigation device to which the method is applied |
| US5982301A (en) * | 1995-01-20 | 1999-11-09 | Mitsubishi Denki Kabushiki Kaisha | Navigation apparatus |
| JPH08327380A (en) * | 1995-05-29 | 1996-12-13 | Sony Corp | Navigation device and display method |
| KR100235240B1 (en) * | 1995-10-31 | 1999-12-15 | 모리 하루오 | Navigation apparatus |
| KR960042490A (en) * | 1995-11-09 | 1996-12-21 | 모리 하루오 | Vehicle navigation device and recording medium therefor |
| JP3446930B2 (en) * | 1996-09-30 | 2003-09-16 | 松下電器産業株式会社 | Route selection method and route selection device |
| JP3760575B2 (en) | 1997-06-27 | 2006-03-29 | 大日本インキ化学工業株式会社 | Resin composition for powder coating |
| JPH1183931A (en) | 1997-09-08 | 1999-03-26 | Yaskawa Electric Corp | Interlocking device |
| US6411293B1 (en) * | 1997-10-27 | 2002-06-25 | Matsushita Electric Industrial Co., Ltd. | Three-dimensional map navigation display device and device and method for creating data used therein |
| US6247019B1 (en) * | 1998-03-17 | 2001-06-12 | Prc Public Sector, Inc. | Object-based geographic information system (GIS) |
-
2000
- 2000-01-20 EP EP04004346A patent/EP1450309A3/en not_active Withdrawn
- 2000-01-20 CN CNB008031142A patent/CN1168046C/en not_active Expired - Fee Related
- 2000-01-20 EP EP00901335A patent/EP1182611A4/en not_active Withdrawn
- 2000-01-20 JP JP2000595305A patent/JP4875240B2/en not_active Expired - Fee Related
- 2000-01-20 US US09/890,081 patent/US6622085B1/en not_active Expired - Fee Related
- 2000-01-20 WO PCT/JP2000/000248 patent/WO2000043953A1/en active IP Right Grant
- 2000-01-20 KR KR1020017009299A patent/KR100579767B1/en not_active IP Right Cessation
- 2000-01-21 TW TW089101017A patent/TW504618B/en not_active IP Right Cessation
Patent Citations (4)
| Publication number | Priority date | Publication date | Assignee | Title |
|---|---|---|---|---|
| JPS6339086A (en) * | 1986-08-04 | 1988-02-19 | Casio Comput Co Ltd | Simple image producing device |
| JPH07192193A (en) * | 1993-12-27 | 1995-07-28 | Nippondenso Co Ltd | Guiding device for travel path of vehicle |
| JPH0981031A (en) * | 1995-09-11 | 1997-03-28 | Hitachi Software Eng Co Ltd | Map processor and map display method |
| JPH112537A (en) * | 1998-05-14 | 1999-01-06 | Aisin Aw Co Ltd | Navigation device |
Also Published As
| Publication number | Publication date |
|---|---|
| WO2000043953A1 (en) | 2000-07-27 |
| EP1182611A1 (en) | 2002-02-27 |
| EP1450309A3 (en) | 2005-07-13 |
| EP1450309A2 (en) | 2004-08-25 |
| CN1338088A (en) | 2002-02-27 |
| EP1182611A4 (en) | 2003-04-02 |
| US6622085B1 (en) | 2003-09-16 |
| TW504618B (en) | 2002-10-01 |
| KR20010113662A (en) | 2001-12-28 |
| KR100579767B1 (en) | 2006-05-15 |
| CN1168046C (en) | 2004-09-22 |
Similar Documents
| Publication | Publication Date | Title |
|---|---|---|
| JP4875240B2 (en) | Polygon road network data creation device, road map display device and method | |
| CN108871368B (en) | Method and system for constructing transverse topological relation of high-precision map lane and memory | |
| CN110220521B (en) | High-precision map generation method and device | |
| JP4994256B2 (en) | Data structure of route guidance database | |
| US5272638A (en) | Systems and methods for planning the scheduling travel routes | |
| JP5661782B2 (en) | Additional map generation, refinement and expansion using GPS trajectories | |
| JP3474380B2 (en) | Navigation device and map database device | |
| JP2834952B2 (en) | Route search method | |
| ES2360480T3 (en) | SYSTEM OF MANAGEMENT AND SIMULATION OF TRAFFIC DATA. | |
| US7076409B2 (en) | System and method for abstracting and visualizing a route map | |
| JP2826079B2 (en) | In-vehicle map database device | |
| US6952661B2 (en) | System and method for abstracting and visualizing a rout map | |
| EP0838662B1 (en) | Navigation system | |
| JP4917764B2 (en) | MAP INFORMATION CREATION DEVICE, MAP INFORMATION CREATION METHOD, AND PROGRAM | |
| JPH0727568A (en) | Path guiding device and path searching method | |
| JP2001305953A (en) | Map information producing device and map information display device using the same | |
| JP6912859B2 (en) | Map update device, map update method, computer program, and recording medium on which the computer program is recorded. | |
| JP3925838B2 (en) | Traffic flow simulation data input device | |
| JP2002333828A (en) | Electronic map data | |
| JPH09127865A (en) | Map data base apparatus | |
| JP5063166B2 (en) | Map data creation device for navigation | |
| JPH04319986A (en) | Route search method | |
| JPH05323870A (en) | Course searching method | |
| JP3892727B2 (en) | Map information creation method and creation device | |
| JPH11194706A (en) | Display method of two-dimensional map and device thereof, and data generating device for model deformation |
Legal Events
| Date | Code | Title | Description |
|---|---|---|---|
| A521 | Request for written amendment filed |
Free format text: JAPANESE INTERMEDIATE CODE: A523 Effective date: 20070110 |
|
| A621 | Written request for application examination |
Free format text: JAPANESE INTERMEDIATE CODE: A621 Effective date: 20070110 |
|
| A131 | Notification of reasons for refusal |
Free format text: JAPANESE INTERMEDIATE CODE: A131 Effective date: 20090908 |
|
| RD02 | Notification of acceptance of power of attorney |
Free format text: JAPANESE INTERMEDIATE CODE: A7422 Effective date: 20091030 |
|
| A521 | Request for written amendment filed |
Free format text: JAPANESE INTERMEDIATE CODE: A523 Effective date: 20091105 |
|
| A521 | Request for written amendment filed |
Free format text: JAPANESE INTERMEDIATE CODE: A821 Effective date: 20091030 |
|
| A131 | Notification of reasons for refusal |
Free format text: JAPANESE INTERMEDIATE CODE: A131 Effective date: 20100105 |
|
| A02 | Decision of refusal |
Free format text: JAPANESE INTERMEDIATE CODE: A02 Effective date: 20100413 |
|
| A521 | Request for written amendment filed |
Free format text: JAPANESE INTERMEDIATE CODE: A523 Effective date: 20100713 |
|
| A911 | Transfer to examiner for re-examination before appeal (zenchi) |
Free format text: JAPANESE INTERMEDIATE CODE: A911 Effective date: 20100726 |
|
| A912 | Re-examination (zenchi) completed and case transferred to appeal board |
Free format text: JAPANESE INTERMEDIATE CODE: A912 Effective date: 20100813 |
|
| A01 | Written decision to grant a patent or to grant a registration (utility model) |
Free format text: JAPANESE INTERMEDIATE CODE: A01 |
|
| A61 | First payment of annual fees (during grant procedure) |
Free format text: JAPANESE INTERMEDIATE CODE: A61 Effective date: 20111125 |
|
| FPAY | Renewal fee payment (event date is renewal date of database) |
Free format text: PAYMENT UNTIL: 20141202 Year of fee payment: 3 |
|
| R150 | Certificate of patent or registration of utility model |
Free format text: JAPANESE INTERMEDIATE CODE: R150 Ref document number: 4875240 Country of ref document: JP Free format text: JAPANESE INTERMEDIATE CODE: R150 |
|
| R250 | Receipt of annual fees |
Free format text: JAPANESE INTERMEDIATE CODE: R250 |
|
| R250 | Receipt of annual fees |
Free format text: JAPANESE INTERMEDIATE CODE: R250 |
|
| S111 | Request for change of ownership or part of ownership |
Free format text: JAPANESE INTERMEDIATE CODE: R313117 |
|
| R350 | Written notification of registration of transfer |
Free format text: JAPANESE INTERMEDIATE CODE: R350 |
|
| R250 | Receipt of annual fees |
Free format text: JAPANESE INTERMEDIATE CODE: R250 |
|
| R250 | Receipt of annual fees |
Free format text: JAPANESE INTERMEDIATE CODE: R250 |
|
| R250 | Receipt of annual fees |
Free format text: JAPANESE INTERMEDIATE CODE: R250 |
|
| LAPS | Cancellation because of no payment of annual fees |