JP4209471B2 - Plasmon resonant particles, methods, and apparatus - Google Patents
Plasmon resonant particles, methods, and apparatus Download PDFInfo
- Publication number
- JP4209471B2 JP4209471B2 JP53677498A JP53677498A JP4209471B2 JP 4209471 B2 JP4209471 B2 JP 4209471B2 JP 53677498 A JP53677498 A JP 53677498A JP 53677498 A JP53677498 A JP 53677498A JP 4209471 B2 JP4209471 B2 JP 4209471B2
- Authority
- JP
- Japan
- Prior art keywords
- field
- light
- spectral
- prp
- pres
- Prior art date
- Legal status (The legal status is an assumption and is not a legal conclusion. Google has not performed a legal analysis and makes no representation as to the accuracy of the status listed.)
- Expired - Lifetime
Links
Images


Classifications
-
- G—PHYSICS
- G06—COMPUTING; CALCULATING OR COUNTING
- G06K—GRAPHICAL DATA READING; PRESENTATION OF DATA; RECORD CARRIERS; HANDLING RECORD CARRIERS
- G06K19/00—Record carriers for use with machines and with at least a part designed to carry digital markings
- G06K19/06—Record carriers for use with machines and with at least a part designed to carry digital markings characterised by the kind of the digital marking, e.g. shape, nature, code
- G06K19/06009—Record carriers for use with machines and with at least a part designed to carry digital markings characterised by the kind of the digital marking, e.g. shape, nature, code with optically detectable marking
- G06K19/06046—Constructional details
- G06K19/06084—Constructional details the marking being based on nanoparticles or microbeads
-
- B—PERFORMING OPERATIONS; TRANSPORTING
- B82—NANOTECHNOLOGY
- B82Y—SPECIFIC USES OR APPLICATIONS OF NANOSTRUCTURES; MEASUREMENT OR ANALYSIS OF NANOSTRUCTURES; MANUFACTURE OR TREATMENT OF NANOSTRUCTURES
- B82Y30/00—Nanotechnology for materials or surface science, e.g. nanocomposites
-
- C—CHEMISTRY; METALLURGY
- C12—BIOCHEMISTRY; BEER; SPIRITS; WINE; VINEGAR; MICROBIOLOGY; ENZYMOLOGY; MUTATION OR GENETIC ENGINEERING
- C12Q—MEASURING OR TESTING PROCESSES INVOLVING ENZYMES, NUCLEIC ACIDS OR MICROORGANISMS; COMPOSITIONS OR TEST PAPERS THEREFOR; PROCESSES OF PREPARING SUCH COMPOSITIONS; CONDITION-RESPONSIVE CONTROL IN MICROBIOLOGICAL OR ENZYMOLOGICAL PROCESSES
- C12Q1/00—Measuring or testing processes involving enzymes, nucleic acids or microorganisms; Compositions therefor; Processes of preparing such compositions
- C12Q1/68—Measuring or testing processes involving enzymes, nucleic acids or microorganisms; Compositions therefor; Processes of preparing such compositions involving nucleic acids
- C12Q1/6813—Hybridisation assays
- C12Q1/6816—Hybridisation assays characterised by the detection means
- C12Q1/6825—Nucleic acid detection involving sensors
-
- G—PHYSICS
- G01—MEASURING; TESTING
- G01N—INVESTIGATING OR ANALYSING MATERIALS BY DETERMINING THEIR CHEMICAL OR PHYSICAL PROPERTIES
- G01N21/00—Investigating or analysing materials by the use of optical means, i.e. using sub-millimetre waves, infrared, visible or ultraviolet light
- G01N21/17—Systems in which incident light is modified in accordance with the properties of the material investigated
- G01N21/55—Specular reflectivity
- G01N21/552—Attenuated total reflection
- G01N21/553—Attenuated total reflection and using surface plasmons
- G01N21/554—Attenuated total reflection and using surface plasmons detecting the surface plasmon resonance of nanostructured metals, e.g. localised surface plasmon resonance
-
- G—PHYSICS
- G01—MEASURING; TESTING
- G01N—INVESTIGATING OR ANALYSING MATERIALS BY DETERMINING THEIR CHEMICAL OR PHYSICAL PROPERTIES
- G01N21/00—Investigating or analysing materials by the use of optical means, i.e. using sub-millimetre waves, infrared, visible or ultraviolet light
- G01N21/62—Systems in which the material investigated is excited whereby it emits light or causes a change in wavelength of the incident light
- G01N21/63—Systems in which the material investigated is excited whereby it emits light or causes a change in wavelength of the incident light optically excited
- G01N21/64—Fluorescence; Phosphorescence
- G01N21/645—Specially adapted constructive features of fluorimeters
- G01N21/648—Specially adapted constructive features of fluorimeters using evanescent coupling or surface plasmon coupling for the excitation of fluorescence
-
- G—PHYSICS
- G01—MEASURING; TESTING
- G01N—INVESTIGATING OR ANALYSING MATERIALS BY DETERMINING THEIR CHEMICAL OR PHYSICAL PROPERTIES
- G01N21/00—Investigating or analysing materials by the use of optical means, i.e. using sub-millimetre waves, infrared, visible or ultraviolet light
- G01N21/62—Systems in which the material investigated is excited whereby it emits light or causes a change in wavelength of the incident light
- G01N21/63—Systems in which the material investigated is excited whereby it emits light or causes a change in wavelength of the incident light optically excited
- G01N21/65—Raman scattering
- G01N21/658—Raman scattering enhancement Raman, e.g. surface plasmons
-
- G—PHYSICS
- G06—COMPUTING; CALCULATING OR COUNTING
- G06K—GRAPHICAL DATA READING; PRESENTATION OF DATA; RECORD CARRIERS; HANDLING RECORD CARRIERS
- G06K7/00—Methods or arrangements for sensing record carriers, e.g. for reading patterns
- G06K7/10—Methods or arrangements for sensing record carriers, e.g. for reading patterns by electromagnetic radiation, e.g. optical sensing; by corpuscular radiation
- G06K7/14—Methods or arrangements for sensing record carriers, e.g. for reading patterns by electromagnetic radiation, e.g. optical sensing; by corpuscular radiation using light without selection of wavelength, e.g. sensing reflected white light
- G06K7/1404—Methods for optical code recognition
- G06K7/1408—Methods for optical code recognition the method being specifically adapted for the type of code
-
- B—PERFORMING OPERATIONS; TRANSPORTING
- B01—PHYSICAL OR CHEMICAL PROCESSES OR APPARATUS IN GENERAL
- B01J—CHEMICAL OR PHYSICAL PROCESSES, e.g. CATALYSIS OR COLLOID CHEMISTRY; THEIR RELEVANT APPARATUS
- B01J2219/00—Chemical, physical or physico-chemical processes in general; Their relevant apparatus
- B01J2219/00274—Sequential or parallel reactions; Apparatus and devices for combinatorial chemistry or for making arrays; Chemical library technology
- B01J2219/00277—Apparatus
- B01J2219/0054—Means for coding or tagging the apparatus or the reagents
-
- B—PERFORMING OPERATIONS; TRANSPORTING
- B01—PHYSICAL OR CHEMICAL PROCESSES OR APPARATUS IN GENERAL
- B01J—CHEMICAL OR PHYSICAL PROCESSES, e.g. CATALYSIS OR COLLOID CHEMISTRY; THEIR RELEVANT APPARATUS
- B01J2219/00—Chemical, physical or physico-chemical processes in general; Their relevant apparatus
- B01J2219/00274—Sequential or parallel reactions; Apparatus and devices for combinatorial chemistry or for making arrays; Chemical library technology
- B01J2219/00583—Features relative to the processes being carried out
- B01J2219/00603—Making arrays on substantially continuous surfaces
- B01J2219/00646—Making arrays on substantially continuous surfaces the compounds being bound to beads immobilised on the solid supports
- B01J2219/00648—Making arrays on substantially continuous surfaces the compounds being bound to beads immobilised on the solid supports by the use of solid beads
-
- B—PERFORMING OPERATIONS; TRANSPORTING
- B01—PHYSICAL OR CHEMICAL PROCESSES OR APPARATUS IN GENERAL
- B01J—CHEMICAL OR PHYSICAL PROCESSES, e.g. CATALYSIS OR COLLOID CHEMISTRY; THEIR RELEVANT APPARATUS
- B01J2219/00—Chemical, physical or physico-chemical processes in general; Their relevant apparatus
- B01J2219/00274—Sequential or parallel reactions; Apparatus and devices for combinatorial chemistry or for making arrays; Chemical library technology
- B01J2219/00583—Features relative to the processes being carried out
- B01J2219/00603—Making arrays on substantially continuous surfaces
- B01J2219/00659—Two-dimensional arrays
-
- B—PERFORMING OPERATIONS; TRANSPORTING
- B01—PHYSICAL OR CHEMICAL PROCESSES OR APPARATUS IN GENERAL
- B01J—CHEMICAL OR PHYSICAL PROCESSES, e.g. CATALYSIS OR COLLOID CHEMISTRY; THEIR RELEVANT APPARATUS
- B01J2219/00—Chemical, physical or physico-chemical processes in general; Their relevant apparatus
- B01J2219/00274—Sequential or parallel reactions; Apparatus and devices for combinatorial chemistry or for making arrays; Chemical library technology
- B01J2219/0068—Means for controlling the apparatus of the process
- B01J2219/00702—Processes involving means for analysing and characterising the products
- B01J2219/00707—Processes involving means for analysing and characterising the products separated from the reactor apparatus
-
- C—CHEMISTRY; METALLURGY
- C40—COMBINATORIAL TECHNOLOGY
- C40B—COMBINATORIAL CHEMISTRY; LIBRARIES, e.g. CHEMICAL LIBRARIES
- C40B70/00—Tags or labels specially adapted for combinatorial chemistry or libraries, e.g. fluorescent tags or bar codes
-
- Y—GENERAL TAGGING OF NEW TECHNOLOGICAL DEVELOPMENTS; GENERAL TAGGING OF CROSS-SECTIONAL TECHNOLOGIES SPANNING OVER SEVERAL SECTIONS OF THE IPC; TECHNICAL SUBJECTS COVERED BY FORMER USPC CROSS-REFERENCE ART COLLECTIONS [XRACs] AND DIGESTS
- Y10—TECHNICAL SUBJECTS COVERED BY FORMER USPC
- Y10S—TECHNICAL SUBJECTS COVERED BY FORMER USPC CROSS-REFERENCE ART COLLECTIONS [XRACs] AND DIGESTS
- Y10S436/00—Chemistry: analytical and immunological testing
- Y10S436/805—Optical property
Abstract
Description
発明の分野
本発明は、プラズモン共鳴実体(PRE)あるいはプラズモン共鳴粒子、PREを含む場を審問する方法、およびこの方法を行うための装置、ならびにPREの種々の適用に関する。
発明の背景
標的についての情報のために標的を審問する、多くの重要な商業的かつ科学的な適用がある。例えば、分析物診断の試験および方法の目的は、分析物(標的)の存在および/または量を検出することである。標的分析物は、分析物と、(i)分析物に特異的に結合し得るおよび(ii)適切な検出道具を用いて検出可能である検出可能なレポーターとを反応することによって検出され得る。レポーターは、例えば、着色分子もしくは蛍光分子、またはコロイド金属、またはレポーター(例えば、その検出のために特別なフィルムもしくはシンチレーション設備を必要とする放射性標識)であり得る。
いくつかの診断的適用において、標的分析物上の近位に位置される2つのプローブ間の相互作用によって明らかであるように、標的分析物における近接関係を検出することが望ましい。これは、いわゆる同種アッセイの基礎を形成し、ここでは、分析物の存在は、2つの異なるプローブが分析物上の密接して配置された部位において集められる場合に観察される、検出可能なプローブの近位効果によって決定される。例として、2つの蛍光分子は、集められる場合、検出可能な蛍光クエンチングまたは非放射性エネルギー伝導効果を示し得、これは、励起ピークと発光ピークとの間のストークス半径をシフトするために作用する。
化学的、生化学的、または生物学的な標的は、多様な化学的および分光写真的な方法によって、化学構造、特定の化学基の存在、または化学基の環境を決定するために、審問され得る。これらの方法の中で注目すべき物は、化学構造および化学基環境を決定するための磁気共鳴法、特定の化学基を検出するための分光法(例えば、UV、IR、Raman、ORD、およびCD分光法)、ならびにフラグメント分子量分析によって構造を決定するための質量分析法である。
標的サンプルの表面化学分析は、表面を高エネルギー粒子(例えば、電子)で衝撃し、そして表面から放出される原子のエネルギーを検出することによって行われ得る。X線電子分光法(ESCA)は、このようなアプローチの例である。
しばしば、標的における空間的および/または距離的関係を確立することが所望され、一般に、顕微鏡による審問が必要とされる。光学顕微鏡は、単純さという利点、サンプル調製の容易さ、およびサンプルが「湿潤」条件において試験され得るという特性を有する。その不利益は、比較的低い分解能力であり、照射供給源(400〜650nmの範囲)の波長に正比例し、そしてレンズシステムの開口数(良くて、約1.4)に反比例し、数百nmに分解能を制限する。
高エネルギービーム顕微鏡(例えば、透過型電子顕微鏡(TEM)および走査型電子顕微鏡(SEM))は、低いnm範囲に低下した分解能を達成し得るが、標的サンプルの高減圧環境を必要とし、生物学的サンプルを用いる適用を制限する。原子間力顕微鏡(AFM)は、低いnm範囲における分解能をまた伴って、標的サンプルの表面特徴を審問するために有用である。この方法は、表面効果に限られている。
高エネルギー発光の部位を検出および/または局在化するためのX線撮影法およびシンチグラフィー法はまた、広範囲に使用されている。これらの方法は、極めて感度が高い傾向があり、非常に少数の高エネルギー発光事象を検出し得るが、比較的高コスト、および標的の空間情報が所望される場合、乏しい分解能を欠点としてもつ。
現在利用可能な方法の多様性にもかかわらず、現在の方法では困難であるかまたは不可能である商業的および科学的な目的の多くの標的審問課題がある。これらの中には以下がある:
1.単一の(またはわずか数個の)分子事象(例えば、標的における1つもしくは数個の結合部位、または1つもしくは数個の酵素的部位の存在)を検出すること。この能力は、新規な診断的適用(例えば、特異的な細胞内事象の存在または非存在に関する)を開発し、そして信頼できるアッセイのために必要とされるサンプル材料の量を減少させ、そしてアッセイの小型化を許容する。
2.天然の水和化状態において、生物学的標的中の亜波長(sub-wavelength)距離関係を分離すること。上記のように、高エネルギービーム顕微鏡による亜波長分離は、サンプル標的が乾燥された状態にあることを必要とし、天然の細胞プロセスの観察(細胞成分の亜波長移動を含む)を妨げ、そして使用者に、観察の間、サンプルを摂動(perturb)させる。
3.生物学的標的における選択される標的部位の直接的な空間マッピング(例えば、染色体マッピングの目的のための染色体における選択される配列の直接的なマッピング)。現在、このタイプの情報は、実際的でないか、または染色体マッピングの場合において、高分解能および遺伝子配列の正確な位置決めでは可能ではないかのいずれかである。
4.マイクロコード化された情報の光学的読み出し。個々のレポーター基の独特のパターンを検出する能力は、法医学、情報保存、計測学、およびセキュリティー同定マイクロコードにおいて重要な適用を有する。
それゆえ、先行技術の方法によって得ることが非実際的または不可能である上述で概説した情報のタイプについて、場(field)を審問するための方法および装置を提供することが所望される。
本発明の方法を、種々の診断的適用に適用して、改善された感度、空間的および距離的な情報、サンプル調製の容易さ、および審問され得る標的サンプルのタイプにおける柔軟性を達成することがまた、所望される。
発明の要旨
1つの局面において、本発明は、分布された複数のPREを有する場を審問する方法を包含する。この方法は、光学的な光源で場を照射する工程、および場における個々のPREおよび他の光散乱実体についてスペクトル発光特性を検出する工程を包含する。この情報から、場において選択されたスペクトルサインを有するPREを他の光散乱実体から識別するための基準として、場に存在する個々のPREおよび他の光散乱実体の位置および発光スペクトル特性の値のコンピューター画像が構築されて、場についての情報を提供する。
照射する工程は、異なる周波数帯で行われ得、場における個々のPREおよび他の光散乱実体のスペクトル発光特性が、このような各帯で検出される。
あるいは、照射する工程は、持続時間が変化する光の複数の狭帯域パルスに、場を曝露し、持続時間の変化によって生成される発光強度における変化を検出する工程を包含し得る。
別の実施態様において、場は、好ましくは少なくともいくつかの非球状のPREを含む場合、照射する工程は、入射の異なる方向および/または異なる角度で、偏光に場を曝露する工程を包含し得る。検出する工程は、入射光の偏光方向または入射の角度の関数として、スペクトル発光特性の値の変化を検出する工程を包含する。
検出工程は、複数の規定されたスペクトル帯で、場における個々のPREおよび他の光散乱実体のスペクトル発光特性の値を同時に検出する工程を包含し得る。あるいは、場における個々のPREおよび他の光散乱実体のスペクトル発光特性値は、複数の規定されたスペクトルバンドで、連続的に検出され得る。
PREは、場における核形成中心を金属増強することによって、予め形成されたPREを場における標的に添加することによって、または場における標的部位でPREを(例えば、写真平板法によって)作製することによって、場において形成され得るか、または場に添加され得る。
この方法は、場における全ての他の光散乱実体から、選択されるスペクトルサインを有するPREを識別するために実施され得る。識別のための基準として、検出されるスペクトル発光特性は、代表的に、ピーク位置、ピーク強度、またはスペクトル発光曲線の半強度でのピーク幅、画像面におけるピークの半値幅、および/または入射応答の偏光または角度である。他の発光スペクトル特性(例えば、パルスか化光線照射に対する応答)がまた、意図される。
同じスペクトル特性が、単独または組合せてのいずれかで、(i)非PRE光散乱実体からPREを、(ii)他方の選択されるタイプのPREから、一方の選択されるタイプのPREを、および(iii)非相互作用するPRE(代表的に、PRP)から、近位効果を介して、相互作用するPREを識別するために有用である。
別の実施態様において、PREは、表面局在化蛍光分子実体またはRaman活性分子実体(例えば、Raman活性分子)を有し、そして検出する工程は、1つ以上の上記実体から、プラズモン共鳴誘導性の蛍光発光またはRaman分光学発光を検出する工程を包含する。
この方法は、(i)場における選択されるタイプのPREの総数、(ii)場における選択されるスペクトル特性の選択される値の範囲を有するPREの空間的パターン、(iii)2つの近接するPRE、特にRayleigh距離未満の距離によって分離されるPRE間の距離測定、(iv)場の環境の変化(例えば、誘電率、これは、プラズモン共鳴特性の値に影響する)、または(v)場におけるPREの移動についての情報を得るために行われ得る。
別の局面において、本発明は、例えば、場を審問するために上述の方法を実施するにおいて、分散された複数のPREを有する場を審問するための装置を含む。この装置は、場を照射するための光学的な光源、および場が光源によって照射される場合、場における個々のPREおよび他の光散乱実体のスペクトル発光特性の値を検出するための光学検出器を備える。
また、この装置において含まれるものは、検出器から受容されるシグナルから、場に存在する個々のPREおよびこのような他の光散乱実体の位置および発光スペクトル特性の値のコンピューター画像を構築するために、検出器に作動可能に連結される画像処理器、ならびにコンピューター画像において他の光散乱実体から、選択されるスペクトルサイン(すなわち、選択されるスペクトル発光特性の選択される値の範囲)を有するPREを識別するための識別器である。装置は、選択されるPREについての情報に基づいて、場についての情報を提示する(または保存する)ために構築される。
1つの好ましい光源は、場上の光を検出するための明視野/暗視野レンズである。あるいは、照射源は、明視野レンズ、暗視野レンズ、偏光照射源を生成するための偏光子(例えば、平面偏光源)、TIR、パルス化光線、暗視野/明視野レンズを介する半銀鏡(half-silverd mirror)によって光が反射される落射照明システム、および暗視野集光レンズであり得る。光源は、異なる励起波長を有する光で場を分離するための手段を備え得る。
光学検出器は、RPEから発光される光をスペクトル的に分離するための構造を備え得る。この実施態様における検出器は、それぞれの複数の異なる発光波長で、場に存在する個々のPREおよびこのような他の光散乱実体の位置および発光スペクトル特性の値のコンピューター画像を形成するために作動する。
光学検出器は、光ファイバーの二次元配列、配列からの光の線(line)供給源として作用するようにアラインされる場合、光ファイバーの出力に応答するための格子またはプリズム、および光の線供給源における各ファイバーからの広げられたスペクトル光に応答するための二次元検出器配列を備え得る。
画像処理器は、場の位置、ならびにピーク位置、ピーク強度、またはスペクトル発光曲線の半強度でのピーク幅、画像面におけるピークの半値幅、および/または入射応答の偏光もしくは角度の関連する値の画像を構築するために作動する。
別の実施態様において、PREが表面会合された蛍光分子実体またはRaman活性分子実体を有する場合、画像処理器は、プラズモン共鳴誘導性の蛍光、またはプラズモン誘導性のRomanスペクトル発光におけるRamanスペクトル特徴の場の位置おおよび蛍光ピークの画像を構築するために作動する。
識別器は、場における全ての他の光散乱実体から、選択されるタイプのPREを、非PREサブ波長光散乱粒子からのPREと(以下を含む:(i)非PRE光散乱実体からPREを、(ii)他方の選択されるタイプのPREから、一方の選択されるタイプのPREを、そして(iii)非相互作用PRE(代表的に、PRP)から近位効果を介して相互作用するPREを)識別するために作動し得る。
装置によって提示される情報は、(i)場における選択されるタイプのPREの総数、(ii)場における選択されるスペクトル特性を有するPREの空間的パターン、(iii)2つの近接するPRE、特にRayleigh距離未満の距離によって分離されるPRE間の距離測定、(iv)場の環境の変化(例えば、誘電率、これは、プラズモン共鳴特性に影響する)、または(v)場におけるPREの移動についての情報に関連し得る。
別の局面において、本発明は、1つ以上のプラズモン共鳴粒子(PRP)を有するPRPの組成物を含む。組成物は、以下:(a)PRPは、100nm未満の半分の高さ(halfheight)での幅を有する;(b)単一の集団におけるPRPは、全て、40nm以内の規定された波長にある;(c)(a)の規定を満たす組成物中の少なくとも80%のPRPは、1つ以上の集団中にあり、そして>700nm、400〜700nm、<400nmの単一の範囲におけるスペクトル発光波長を有し;および(d)各集団は、組成物中の任意の他の集団と、PRPの数において、多くとも30%の重複を有することによって、特徴付けられる。組成物は、上述の標的審問方法を実施するにおいて、および/または上述の標的審問装置と組合せて、使用され得る。
1つの実施態様において、組成物中の少なくとも80%のPRPが、1つ以上の集団にあり、そして400〜700nmの波長範囲においてスペクトル発光波長を有する。また、この実施態様において、粒子は、固体銀粒子、金コアを有する銀粒子、または誘電性コアおよび少なくとも約5nmの外側の銀シェルを有する粒子から形成される組成を有する。
種々の診断的適用で特に使用するための、1つの一般的な実施態様において、粒子は、それらの表面で、(i)標的上のリガンド結合部位に結合するために適合された表面付着リガンドであって、ここでリガンド/リガンド結合部位は、結合体結合対である、リガンド、(ii)蛍光分子、(iii)Raman-活性分子実体、および(iv)非特異的結合を防止するためのブロッキング試薬、(v)PRPへの共有結合カップリングのための官能基でのコーティング、または(vi)(i)〜(v)の組合せを局在化する。
局在化されたリガンドは、結合対(例えば、抗原/抗体、ホルモン/レセプター、薬物/レセプター、エフェクター/レセプター、酵素/基質、脂質/脂質結合剤、および相補的核酸鎖)のうちの1つであり得る。
組成物はまた、第1および第2の異なる表面局在化分子または実体を有する、第1および第2のPRPの集団を有し得る。第1および第2のリガンド結合部位を有する標的を同定するにおける使用について、第1および第2の表面結合分子は、それぞれ、第1および第2のリガンド結合部位に結合するに効果的である第1および第2のリガンドである。例として、第1および第2の表面局在化分子は、標的ポリヌクレオチドの第1および第2の近位の配列領域に相補的である配列を有するオリゴヌクレオチドである。別の例として、第1および第2の表面局在化実体は、異なるRamanスペクトル特性を有するRaman活性分子実体であり得る。
組成物は、PRPの第1および第2の集団を含み得、それぞれは、異なる形状を有し、そのうちの少なくとも1つは、球状または四面体である。
さらに別の局面において、本発明は、目的の分子特性を有する標的の存在、またはそれについての情報を検出するにおいて使用するための診断方法を包含する。この方法は、表面局在化分子を有する1つ以上のPRE(好ましくは、PRP)と、標的とを接触して、分子の特徴と局在化された分子との間の相互作用を生成する工程、光学的な光源で標的を照射する工程、および標的とのこのような相互作用後の、1つ以上のPRPのプラズモン共鳴スペクトル発光特性を観察することによって、標的の存在またはそれについての情報を決定する工程を包含する。診断方法は、例えば、上述の標的審問法によって、上記の標的審問装置を使用して、行われ得る。
一般的な実施態様において、標的は、リガンド結合部位を含み、そして表面局在化分子は、標的とリガンド/リガンド結合複合体を形成し得るリガンドである。結合相互作用は、複合体のプラズモン共鳴スペクトル発光特性を検出することによって検出される。表面局在化リガンドは、例えば、ポリヌクレオチド、オリゴヌクレオチド、抗原、抗体、レセプター、ホルモン、酵素、または薬物化合物であり得る。
方法の固相形態において、複合体を検出する前に、標的は、洗浄されて、リガンド/リガンド相互作用を介して標的に結合されないPRPを除去する。
方法の同次相において、標的とPREとの相互作用は、非相互作用PREのプラズモン共鳴スペクトル発光特性から区別可能であるプラズモン共鳴スペクトル発光特性を生成するか、または回折中心を分離するかのいずれかに効果的であり、ここでは2つのPREは、異なるピーク波長を有する。これらの特徴のうちの1つを検出することによって、診断的相互作用の存在が決定され得る。
1つの同次相の実施態様において、PREは、表面局在化蛍光レポーター分子を含み、そしてPREと標的との、またはPREと標的での別のPREとの相互作用は、PREにおける蛍光分子のプラズモン共鳴誘導性のスペクトル発光特性を検出可能に変化させるのに効果的である。
別の実施態様において、PREは、表面局在化Raman活性分子実体を含み、そしてPREと標的との、またはPREと標的での別のPREとの相互作用は、PREにおけるRaman活性分子実体のプラズモン共鳴誘導性のスペクトル発光特性を検出可能に変化させるのに効果的である。
さらに別の実施態様において、標的は、2つ以上の近位におかれたリガンド結合部位を有し、そして形成する複合体は、標的に対する結合の非存在下のPREのスペクトル発光サインとは異なるスペクトル発光サイン(例えば、複合体のスペクトル発光曲線における変化)を有する少なくとも2つの近位に置かれたPREを含み、ここで2つのPREは、実質的に同じピーク波長を有する。あるいは、2つのPREが異なるピーク波長を有する場合、個々のPREは、2つの異なる波長で審問され得、そしてPRE間の距離は、画像面における2つの回折パターンの中心間の距離によって決定される。この実施態様は、例えば、第1および第2のリガンド結合部位に結合するために、それぞれ、第1および第2の表面局在化リガンドを有するPREの第1および第2の集団と、標的とを反応することによって実施され得る。
標的の空間画像を形成するにおける使用について、標的は、複数のリガンド結合部位を有する場合、標的とPREとの接触は、複数の部位での結合を生成する。検出する工程は、標的へのPRE付着の部位の空間画像を構築する工程を包含し、これは標的におけるリガンド結合部位の相対的な間隔の指標である。
1つの適用には、ポリヌクレオチドにおける密接におかれた領域のマッピングが挙げられ、ここで検出する工程は、PREの画像面においてPREの回折パターンの中心間の間隔を観察する工程を包含する。
別の適用には、例えば、異なる相補的な表面局在化オリゴヌクレオチドを有するPREを、伸長された条件を伴う、標的ポリヌクレオチドに結合することによる、遺伝子マッピングを包含する。
別の実施態様において、標的配列変異を検出するにおいて使用するために、またはハイブリダイゼーションによって配列決定するために、標的は、異なる配列のオリゴヌクレオチドまたはポリヌクレオチドの配列である。この配列は、PERの表面局在化ポリヌクレオチドが、標的配列オリゴヌクレオチドまたはポリヌクレオチドとハイブリダイズすることを許容する条件下で、1つ以上の表面局在化試験ポリヌクレオチドを有する1つ以上のPREと接触される。標的を洗浄して未結合のPREを除去した後、配列の各領域でPREのスペクトル発光特性が検出され、配列に対するポリヌクレオチド結合のパターンが決定される。
別の実施態様において、標的は、電気泳動ゲルにおいて分離されたバンドとして示されるポリヌクレオチドであり、そして接触する工程は、ハイブリダイゼーション条件下、PREにゲルの表面を曝露することによって行われる。この方法は、DNAバンドのトランスファー工程を排除することによって、サザンハイブリダイゼーション法を単純化する。
この方法の別の一般的な実施態様において、目的の分子特徴は、分子鎖における2つの原子間の結合を破壊するために触媒的に機能する分子である。この方法におけるPRE試薬は、上記鎖によって連結されるPREの対であり、連結されたPREは、個々の(すなわち分離した)PREのスペクトル発光スペクトルとは異なるスペクトル発光スペクトルを有し得る。接触する工程は、分子鎖を切断するに効果的な条件下で行われる。切断剤の存在は、連結されたPREスペクトル発光サインの消失または個々のPREスペクトル発光特性の出現、または2つのPRE間の検出される距離の変化によって検出される。
別の局面において、本発明は、以下、(a)PRPは、100nm未満の半分の高さでの幅を有する;(b)(a)の基準を満たす組成物中の少なくとも80%のPRPが、1つ以上の集団中にあり、そして>700nm、400〜700nm、または<400nmの単一の範囲におけるスペクトル発光波長を有し;および(c)表面局在化リガンドは、標的上のリガンド結合部位に結合するように適合され、ここでリガンド/リガンド結合部位は結合体結合対、(ii)蛍光分子、または(iii)Raman活性分子実体であることによって、特徴付けられるプラズモン共鳴粒子(PRP)の組成物を含む。
本発明はさらに、発明の詳細な説明の第VI節において考察される多様なPRE組成物および方法を含む。
本発明のこれらのおよび他の目的および特徴は、添付の図面と組合せて、以下の詳細な説明が読まれる場合に、より十分に明らかになる。
【図面の簡単な説明】
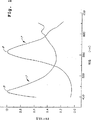
図1は、異なるピーク散乱波長を有する2つの光学的に観察可能なプラズモン共鳴実体の相対的な散乱強度のグラフである。
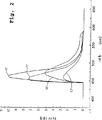
図2は、同様なピーク散乱波長を有する4つの光学的に観察可能なプラズモン共鳴実体の相対的な散乱強度のグラフである。
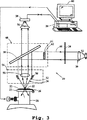
図3は、プラズモン共鳴実体の観察に適切な暗視野顕微鏡検出システムの1つの実施態様の模式的な説明である。
図4は、プラズモン共鳴実体を観察するために使用され得る固形浸漬レンズに対する液体アナログの説明である。
図5は、プラズモン共鳴実体の観察において使用するのに適切な全体の内部反射型サンプル状態の説明である。
図6は、PRE画像化に適切な反射明視野/暗視野レンズの説明である。
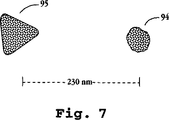
図7は、2つのプラズモン共鳴粒子の透過型電子顕微鏡画像の再現である。
図8は、図7に示されるプラズモン共鳴粒子によって発光される2つの異なる帯域幅での、画像面における位置の関数としての、光強度のグラフである。
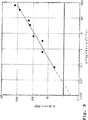
図9は、プラズモン共鳴標識を用いて行われたアッセイの結果を示すグラフである。
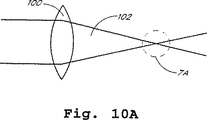
図10Aは、プラズモン共鳴実体で測定可能な強度プロフィール特性を有する、焦点を合わせられた光線を説明する。
図10Bは、図10Aの焦点を合わせられた光線内でのプラズモン共鳴実体の配置を示す。
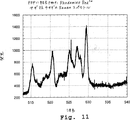
図11は、Raman活性PREからのRamanサインである。
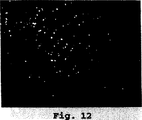
図12は、そのリアノジンレセプターは、抗リアノジンPRPで標識されたニワトリ骨格筋切片である。
図13は、特定の遺伝子が、PRPによって標識されたDrosophila多糸性染色体である。
好ましい実施態様の詳細な説明
定義
以下の用語は、他で示さない限り、以下に与えられる定義を有する:
「プラズモン共鳴粒子」あるいは「PRP」は、物質(例えば、球状粒子)の単一の切片またはフラグメントを意味し、これは電磁エネルギーで励起される場合、プラズモン共鳴を誘発する。プラズモン共鳴粒子は、これが、約180ナノメートル(nm)〜数ミクロンの波長を含む光学的領域において有意な散乱強度を示す場合、「光学的に観察可能」であり得る。プラズモン共鳴粒子は、これが、ヒトの眼によって検出可能である約400〜700nmの波長帯において有意な散乱強度を示す場合、「可視的に観察可能」であり得る。プラズモン共鳴は、基本的に遊離伝導電子と入射光との相互作用を介して作製される。粒子または実体は寸法(dimention)を有し、例えば、直径は、好ましくは約25〜150nm、より好ましくは約40〜100nmである。
用語「プラズモン共鳴実体」または「PRE」は、構造のプラズモン共鳴特性を示す任意の独立した構造をいうために本明細書中で使用され、プラズモン共鳴粒子(PRP)および上述で規定および記載されるようにプラズモン共鳴粒子の組合せまたは会合の両方を含む(が、それらに限定されない)。PREは、単一のPRP、または電磁エネルギーで励起される場合、プラズモン共鳴特性を表す2つ以上のPRPの集合のいずれかを含み得る。
「分布した複数のPREを有する場」は、一次元、二次元、または三次元の領域、例えば、標的または付着されるかもしくはそうでなければそこに分布したPREを有する標的の部分または領域をいい、その結果場におけるPREは、光学的な光源で照射された場合、プラズモン共鳴を示す。
「スペクトル発光特性」は、第III節において記載されるように、PREのプラズモン共鳴に関連するPREのスペクトル散乱特性をいう。本明細書中で使用されるように、「発光」は、PREに対して適用されるように、プラズモン共鳴によって生成または励起される散乱光を意味する。
スペクトル発光特性の「値」は、発光特徴の定性的または定量的値(例えば、検出されるピーク強度、ピーク波長、または最大でのピークの半値幅)である。
「選択されるスペクトルサイン」は、選択されるスペクトル発光特性の値の選択される範囲(例えば、スペクトルピーク強度値の範囲)をいう。
「発光スペクトル特性の位置および値のコンピューター画像」は、審問される場における各領域を、この領域における光散乱実体について測定される1つ以上のスペクトル発光特性値またはサインと結びつけるマトリクスをいう。画像は、保存された値のマトリクスであり得るか、または一方の次元あるいは面(例えばx-y面)における光散乱実体の位置、および別の次元(例えばz軸)における関連されるスペクトル発光値を示す実際の画像であり得る。
「リガンド」は、化学種、代表的に生化学種であり、「リガンド結合」部位または分子と、特異的な、代表的に高親和性の結合を形成し得る。リガンド/坑リガンドは、例えば、抗原/抗体、ホルモン/レセプター、薬物/レセプター、エフェクター/レセプター、酵素/基質、脂質/脂質結合剤、および相補的な核酸鎖を含み得る結合対を形成する。
「Raman活性分子実体」は、分子実体が付着されるプラズモン共鳴粒子の電場によって励起される場合、好ましくは共鳴Raman励起を介してRaman分光学的なサインを提示する分子、分子複合体、または粒子(例えば、ケイ素粒子)である。
「表面局在化」リガンドおよび他の種は、共有結合または他の分子力(例えば、静電力もしくは分散力)によってPREに付着される、またはPRE上のシェルもしくは他の表面コーティング中に包埋される分子種をいう。
II.プラズモン共鳴
本発明は、多様なタイプの情報(以下の第III〜VI節において詳述されるような、標的の存在もしくは非存在、標的の空間特徴、標的の環境、選択されるタイプの標的結合部位の数および/または空間分布、および標的における距離関係を含む)について、場を審問するために、伝導性のプラズモン共鳴粒子(PRPまたはPRE)の1つ以上の多くのスペクトル発光特性を利用する。
プラズモン共鳴実体(PRE)あるいはプラズモン共鳴粒子(PRP)の散乱入射光、および得られる散乱光は、粒子の周波数スペクトル特性を有する。この共鳴性の散乱を首尾良く予測する入射電磁波と球状粒子との相互作用を記載する一般的な理論は、20世紀初期に開発された(H.C.Van Ve Hulst,Light Scattering by Small Particles,Wyley,N.Y.,1957)。金属の範囲において、入射電磁場は、金属のほとんど遊離の伝導電子において、「プラズモン」と呼ばれる振動を含み、そしてこれらのプラズモンは、発光される電磁場を生成する。いくつかの物質について、ならびに粒子サイズ、形状、および形態の至適な選択について、散乱粒子およびその周囲の媒体の波長特性で、最大の散乱効率が存在する。いくつかの物質について、発光される光の強度は、光学顕微鏡下での観察について十分である。銀粒子は、共鳴的に散乱される光の波長が、スペクトルの可視領域内にあり得るので、この効果の最も顕著な表示物(exhibitor)である。
理論的な算定は、球状粒子の共鳴的に散乱される波長が、粒子直径が増加、および周囲の物質の誘電率が増加するにつれ、増加するかまたは「赤色シフト」されることを正確に予測する。球状粒子について、双極子共鳴は、物質に依存する波長で単一のピークを有する散乱される周波数スペクトルを生成し、粒子は、粒子の大きさ、粒子の形状、粒子の形態、および局所環境から作製される。より大きな粒子は、より長い双極子散乱ピーク波長を有し、およびより小さな粒子は、より短い双極子散乱ピーク波長を有する。散乱された光のスペクトルはまた、粒子の四極子共鳴からの寄与を含み得る。所定の形状について、共鳴粒子は、粒子の組成およびサイズに依存する特定の波長帯において優先的に散乱する。
プラズモンを担う伝導性の部位は、固体の幾何的な形状(例えば、球状、三角パラレルピペド(parallelpiped)、楕円、四面体など)を含む多くの異なる形態を取り得るか、または球状、円柱状、または他の形状のシェルを含み得る。表面に銀または金を有する類似の寸法の誘電性の球はまた、プラズモン共鳴を示すこともまた当てはまり、シェルは、少なくとも約3nm、好ましくは5nm以上の厚さを有すると想定される。
さらに、2つのプラズモン共鳴粒子間の接触または至近接触(near contact)は、粒子間の電磁カップリングを生成し、それによって接触する2つの粒子の合計に等しいサイズを有する単一の粒子にいくつかの点で類似する特性を有する実体を生成することが理解される。それゆえ、多くのプラズモン共鳴粒子の集合はまた、集合体の幾何学および性質に依存する特性を有するプラズモン共鳴を示す。
金属性粒子におけるプラズモン作製の別の特徴は、その表面に近い領域における増強された電場の生成である。この電場と隣接の物質との間の相互作用は、共鳴粒子および隣接の物質の散乱特性の両方を有意に変化させ得る。例えば、表面増強Raman分光法(SERS)は、ざらざらのまたは粒子コートされた銀フィルムにおける局在化されたプラズモン共鳴を活用し、6階数の大きさまで種々の物質のRaman散乱を増強する。この技術において、目的の物質からのRaman散乱が観察され、そしてプラズモンによって生成される局所的な場は、その散乱の強度を増強するために使用され得る。
ここで図1に言及すると、2つのPRPの相対的な散乱強度のグラフが説明され、異なるPREが、容易に検出されるスペクトル特性における差異を有し得ることを実証する。図1において示されるスペクトルは、より複雑な構造の個々のPRPまたはPREのいずれかによって生成され得たが、図1に説明される散乱される光スペクトルの供給源は、説明の目的のためにPRPに由来することが想定される。
図1において、任意の単位における散乱された光の相対的な強度が、ナノメートルの波長に対してプロットされる。2つの異なるPRPの個々のスペクトルが示される−1つ目はスペクトル3(約460nmでのピーク発光5を有する)、および2つ目はスペクトル7(約560nmでのピーク発光9を有する)。この図において、それぞれの2つのPREによって発光される光の光強度は、個々に1.0に正規化された。各スペクトルの形状は、ほぼLorentzianであり、470nmピークを有する粒子について約30nmの、および560nmピークを有する粒子について約50nmの半最大での幅を有した。上記のように、個々のPRPによって発光される光は、適切な光学顕微鏡で可視的に観察され得る。図1において説明される発光スペクトルを有する2つのPRPがそのように観察される場合、470nmでピーク5を有するPRPは青色に見え、そして560nmでピーク9を有するPRPは黄色に見える。
図2は、PREの4つの異なる集団の集団についてのスペクトル発光曲線を示し、それぞれほぼ同種の特性を有する。この図において示される4つのPREのスペクトル10、11、12、13は、約460nm〜480nmまで変化するピーク発光波長を有する。可視的に、図2において示されるスペクトルを生成するそれぞれの4つのPREは、青色に見える。しかし、4つの粒子はスペクトルピーク強度(すなわち、ピークの高さ)に基づいて、または異なるスペクトル発光曲線に基づいて、例えば、ピークの高さの半分でのピーク幅に対するピークの高さの比率を比較することによって、識別され得る。他のスペクトル発光特性は、以下に記載される。
III.場を審問するための方法および装置
1つの局面において、本発明は、その中に分散された複数のPREを有する場を審問する方法および装置に関する。本方法は、本質的に、以下:(i)場におけるPREの1つ以上のスペクトル発光特性についてデータを作製する工程、(ii)このデータから、PREの位置(場の領域)のコンピューター画像、ならびに個々のPREおよび場に存在する他の光散乱実体の、スペクトル発光特性の値を作製する工程、ならびに(iii)画像中の選択されたスペクトル特性を用いて、PREと場の中の他の光散乱粒子とを識別することにより、場(例えば、場における標的)についての情報を提供する工程、の3つの部分を有する。
A.スペクトル発光特性
本発明は、場における光散乱粒子の画像を作製するために、1つ以上のいくつかの型のスペクトル発光特性を検出することを意図する。目的のスペクトル発光特性は、単一のPRPのプラズモン共鳴スペクトル特性、非常に近接した2つ以上のPRPの相互作用に起因するスペクトル発光特性における移動、または蛍光、発光、またはPRE上に位置するラマン分子と相互作用する、増強された局部的な電場によって誘導される、蛍光もしくはラマン分光学的特性であり得る。それぞれから入手可能な、情報の特性および型の最重要性を、以下に示す。
ピーク波長は、スペクトル発光曲線のピーク波長(すなわち、最大強度を生じる波長)である。図1に示される2つのスペクトル発光曲線のピーク波長は、5および9で示され、これは上記のように470nmおよび560nmの波長の値に対応する。
ピーク波長の値は、多数の異なる方法の1つで決定され得、そのなかの7つを本明細書中に記載する。これらの方法の個々の実行は、方法のいくつかについて、本発明の装置の光源および検出器の記載において以下に議論されるように、開示された方法から理解される。これらの方法は全て、同時に複数のスペクトル曲線を測定するのに適応可能である。本方法のいくつかはまた、例えば、場の面の上の光検出エレメントをラスタリング(rastering)することによって、場における各光散乱実体のスペクトル曲線の個々の測定に適応可能である。
(i)場は、例えば、一連の狭帯域照射窓の個々で、可視光スペクトルを介して、照射波長の範囲にわたって照射される。代表的には、白色光源と場との間に置かれたフィルター円盤(wheel)は、狭帯域照射周波数を産生するために使用される。
(ii)場から発光する光は、発光された光をいくつかの狭帯域周波数中に散らすために散乱エレメント(例えば、プリズム)を介して方向付けられ、次いで、それぞれ別の検出配列に方向付けられる。例として、プリズムは、発光された光を赤、緑、および青の成分に分けるために使用され、各々は個々のCCD配列に方向付けられる。
(iii)その画像が完全に光ファイバーのコア直径に適合するように、レンズ(例えば、PREに対応する各光散乱スポットを拡大するレンズ)を介して、発光場画像を光ファイバーの密な束に入れる。次いで各ファイバーは、分散エレメントによって異なる周波数に拡がるスペクトル線に散開され、これは次いで2次元配列における検出エレメントの線によって読みとられる。従って、場の各線は2次元配列によって読みとられ、一方の配列の次元は複数の周波数の各々でのスペクトル強度に対応し、他方の次元は場の軸に沿った異なる位置に対応する。このアプローチは複数のスペクトル波長の各々での、複数のPREの同時読み取りを可能にする。
(iv)複数の狭帯光源(例えば、赤、緑、黄、および青の、3または4つの別々のレーザー線)で照射する。各レーザーは、異なる周波数(代表的には全て100Hzより下)で分断される。場から発光された光は、100フレーム/秒で読みとられ得るCCDで検出される。次いで、標準技術を含むコンピューター分析は、CCD配列における各画素に衝突する各色の光量を決定するために使用され、それによってスペクトル発光曲線が構築され得る。
(v)例えば、米国特許第5,539,517号に記載されるように、干渉計を通過した散乱光の経路を決定することにより、同様の情報が得られ得る。
(vi)入射光の波長が共鳴ピークを通過させられる場合の入射光と比較して、散乱光が180度の位相変化を受ける、ということもまたプラズモン共鳴粒子の特性である。ピーク波長において、位相差は90度である。この位相変化は検出され得、そして、90度の位相変化が観察された場合の入射波長として、ピーク散乱波長が決定され得る。
(vii)複数の規定された帯域幅でのPRE発光強度もまた、PREを種々の時間の短いパルスの入射光に曝すことによって、決定され得る。特に、増加または減少するステップ関数に近似するパルスの使用が有効である(すなわち、ほんの1もしくは2フェムト秒の迅速な立ち上がり時間および減衰時間)。PREの散乱応答は、強制振動および減衰振動の散乱応答であり、そして共鳴波長の付近では、狭帯域の励起に対するPREの応答は励起パルス長が増加するのに従って増加する。共鳴波長から離れると、狭帯域の励起に対する応答は小さく、そして比較的励起パルス長に非依存性である。PREを、特定の波長で、種々の時間のパルスに曝すこと(しかし都合の良いことに全て約500フェムト秒未満である)、および発光エネルギーが定常値に達するのにかかった時間を知ることによって、特定の波長がPRE共鳴波長にどのくらい近似しているかについての情報が提供される。いくつかのシリーズの時間変化パルスに対してPREを励起することによって、ここで各シリーズは異なるピーク波長を有し、波長に対する散乱切断面曲線が作製され得る。
銀のPREおよび金のPREのPREのサイズが増加するに従って、一般的に、ピーク波長は赤の方向(より長波長側)に移動する。ピーク波長の値もまた、PREの形状に関する情報を提供し得る。球形から6角形または3角形への形状の変化は、主に赤へのピーク波長の移動を生じる。誘電シェルPRP(すなわち伝導金属中に入れられた内側の誘電性コアからなる粒子)もまた、同じ大きさの固体金属粒子よりも長いピーク波長を有する傾向がある。
ピーク強度はスペクトル発光曲線のピークの強度であり、図2におけるような絶対強度値または相対強度値として示され得、これは3未満から10より大きい範囲の異なる相対ピーク強度を有する4つのPREを示す。ピーク強度値は上のように、ピーク波長で決定されている強度を用いて、PREのスペクトル発光曲線を決定するための種々の方法の内の1つによって、決定され得る。
ピーク強度は材質、形態および形状によって変化する。特定のPREに対して、強度は焦点の枠に対して最大である。
半値幅は、スペクトル発光曲線の、半分のピーク強度での、波長単位における幅である。この値は独立したスペクトル特性として測定され得るか、またはピークスペクトル強度と組み合わせてスペクトル発光曲線を特徴付ける(例えば、ピーク強度/ピーク幅の比)ために測定され得る。
図2に示される4つの曲線は相対的に狭いピーク幅を有する2つのスペクトル(曲線10および11)、および相対的に広いピーク幅を有する2つ(12および13)を図示する。
一般的にピーク幅はPREの大きさの増加と共に増加し、そして模倣され得る様式において、PREの形状が球形形状から非球形形状へと変化するに従って変化する。
画像面における幅は画像面におけるAiryパターンにおける中央回折領域の半分の幅である。全てのPRPはサブ波長光源であり、従ってその空間画像は使用される光学システムによって規定される特性を有する近似点拡大関数である。CCDを含む光学システムを仮定して、光検出エレメントの画素配列を用いて、いくつかの画素に及び得る中央回折領域の幅は、回析画像の中心のピークから、強度がそのピーク値の半分になる画像中心位置までを(円形画像と仮定して)、放射状に測定される。
PRPはサブ波長散乱体であるので、画像面において記録されるような強度パターンの半分の幅が、散乱される光の波長に比例する。それゆえ、供給源(例えば、キセノンアーク)からの光の強度における妥当に円滑な変化について、光はピーク強度において最も強く散乱され、そして各PRPについての画像における中央回折領域の半分の強度の幅を測定することによって、ピーク波長の良好な評価が作製され得る。
以下に示されるように、このスペクトル特性は、場におけるPREの位置の正確な決定、および特に、レイリー分解距離よりも近い間隔の、異なるピーク波長の2つのPREの間の距離を決定するために有用である。画像面における回折パターンのピークの強度は、最もよい焦点を与える最大値を用いて、場に対して検出器レンズの焦点を合わせるために使用され得る。
偏光は、PREの場を照射する光の偏光の方向の関数、または偏光された光の入射角として、スペクトル特性(例えば、画像面におけるピーク波長、ピーク高、波長の半値幅、またはピーク強度の半値幅)を測定する。偏光の特性はPREの大きさよりもPREの形状に依存し、そして非球形PREは、例えば、楕円形のPREの長軸および短軸方向に1つ以上の共鳴を有し得る。後者の場合、長軸方向の照射光は赤の方に移動し、一方短軸方向の照射光は青の方に移動する。
パルスまたは時間応答は十分な強度の散乱を「汲み上げる(pump up)」ことを必要とされる照射光の光サイクルの数の測定を提供する。PREは非常に速い時間応答(ピコ秒以下)を有し、散乱光子の非常に大きなパルスが発生され得、吸収された平均の入力した力であることを制限するのみである。これらは、2つの光子プロセスまたは第2の調和振動の発生および他のより高度な命令プロセスを行うために、5と500との間のフェムト秒でパルスを受容し得る。
上記のように、パルス型または時間型照射測定は、一般に場のPREを種々の時間の入射光の短パルスに曝すことによって行われ、ピーク波長が検出される。強度対パルス時間によって測定された場合、完全な共鳴に対する時間はまた、プラズモン共鳴器として物質の純度の測定を提供する。より高い純度の物質は、ピーク波長の光のパルスにより照射された場合、より狭い幅の共鳴サイン、より高いピーク強度、および散乱の最大強度に到達までのより長い時間によって特徴付けられる。
移相は、上記の、90度の移相でのスペクトルピークを決定する章において、議論される。移相もまた、共鳴ピーク波長から離れた励起波長に対する応答についての情報を与え得る。
蛍光発光寿命は、表面局在化蛍光分子を有するPRE粒子中で観察され得る。蛍光励起は、プラズモン共鳴ピーク内の光によってPREの表面付近で発生された局所電場により、増強され得る。また、蛍光発光の光の波長がプラズモン共鳴ピーク内にある場合、蛍光発光は増強され得る。適切な条件下において、蛍光寿命はこのプロセスで測定できるまで短縮され得る。
本方法を使用して、蛍光分子の励起環境における変化(例えば、他の分子または実体との近接相互作用)を検出し得る。
表面増強化ラマン散乱(SERS)は、PREの表面付近の領域での増強された電場の発生に依存する。この電場とすぐ近傍の物質との間の相互作用は、共鳴粒子の散乱特性およびすぐ近傍の物質の散乱特性の両方を有意に変化させ得る。表面増強化ラマン散乱分光法(SERS)は、伝統的に粗面または粒子乾燥化銀フィルムに局在化したプラズモン共鳴を利用して、種々の物質のラマン散乱を6桁の大きさまで増強する。本発明に従って行われるSERSは、PRE単独で確認される。本技術において、目的の物質からのラマン散乱が観察され、そしてプラズモンによって発生される局部的な場を用いて、伝統的なSERSより数桁まで散乱の強度が増強される。ラマン活性分子がPREのスペクトル発光曲線のピーク近傍で共鳴吸収を有する場合、さらなるSERS増強は第III章において開示される本発明の方法に従って、PRE分子の混成検出可能物のラマンシグナルを作製するのに十分である。PRE共鳴ラマンスペクトルにおける変化を測定することは、ラマン分子の局部的環境において、変化(例えば、結合)を検出するのに使用され得る。
B.審問される場
本発明の方法および装置による、審問される場は、複数、すなわち、2つ以上の、標的中に分散するPREを有する標的および標的領域を含む。
標的は、光学顕微鏡によって見るのに適したいずれの標的でもあり得、生体の細胞または組織;植物または動物の部分もしくは細胞凝集体;表面局在化リガンド結合分子を有する固体表面;標的分析物の分子、粒子または細胞を含む体液サンプル;伸長した条件に配置された染色体物質のような生物学的サンプル物質;人工の単分子または2分子膜基質;コンピューターマイクロチップのような微小作製デバイス;およびチップ上のオリゴヌクレオチドまたはオリゴペプチドのマイクロアレイのような、マイクロアレイ、を含む。
PREの形成およびそこに分散されたPREを有する標的を調製するための方法は、以下に詳細に議論される。この点において、3つの一般的な場合が簡単に考察される。第1に、前もって形成されたPREが、特異的標的部位への接着のために、標的に添加される。非結合型PREまたは非特異的結合型PREを除去するために、標的は洗浄され得る。標的は、PRE結合の前または後に、所望の配置(例えば、伸長型染色体)を達成するように操作され得る。第2に、核形成部位が標的に添加され得る。標的上の選択された位置への結合後、金属エンハンサー溶液、例えば、銀溶液が、適切な大きさのPREが形成されるまで添加される。第3の場合として、写真平板法、例えば、フォトマスキングおよびフォトエッチングによって、PREが金属基板、例えば、銀基板上に形成される。
本発明に従って、標的およびPREを含む場を審問することによって、決定されることが望まれる情報の型は、以下を含む:(i)場における選択された型のPERの総数、(ii)場における選択されたスペクトル特性を有するPREの空間的パターン、(iii)2つの隣接したPRE(特にレイリー分解距離より短い距離で分離したPRE)の間の距離の測定値、(iv)プラズモン共鳴特性に影響を与える、場における環境中の変化(例えば、誘電率)、(v)場におけるPREの運動、(vi)2つのPREが連結されているかどうか、または(vii)PREに局在して付着した分子または物質の蛍光もしくはラマン発光。他の型の情報もまた意図され、そして以下の第IV章〜第VI章において考察される。
C.本発明の装置
図3は、本発明に従って構築された装置20の、簡略化した概略図である。ここでは22に示される、審問される標的は、以下に記載される装置の他のコンピューターの構成要素を含む、コンピューター28の制御下の台ステップモーター(stepper motor)装置(一般的に、26に示される)の制御下にある、x-y平面に選択的に可動性である、顕微鏡台24上に保持された基板23上に支持されている。
以下に詳述される様式において、標的は光学光光源30によって照射され、この光源は照射光、代表的に、可視範囲かつ1つ以上の選択された波長範囲での光を、標的表面に向ける。以下に詳述するように、代表的に光源は、所定の波長またはスペクトル振動数の光を生成する手段32、照射光の所望の周波数帯域を生成するためのフィルター34のような1つ以上のフィルター、および光を標的に合わせるレンズシステム36を備える。
標的からのスペクトル発光、この場合、標的から散乱された光は、レンズ56を通して光学検出器58に向けられる。光学検出器は、以下に詳述される様式で、場の照射部分における個々のPREの1つ以上のスペクトル発光特性を検出するように機能する。代表的に、検出器はCCD(電荷結合素子)配列であり、これは以下に詳述するように、配列画素に対応する光学強度の値の配列を生成し、そして記録するように作動する。
コンピューター28に含まれる画像処理装置は検出器に作動可能に連結され、各々選択された照射条件(例えば、異なる波長または偏光状態)下での、検出配列の位置の各々での光強度の値を受け取る。画像処理装置は、検出器によって測定される1つ以上のスペクトル発光特性の位置および値のコンピューター画像を構築するために機能する。代表的に、このことは、照射された場におけるポジション位置としての検出配列における各画素を処理する工程、および各画素「ポジション」に、画素によって記録された光強度の値を割り当てる工程によって行われる。画像処理装置によって生成された画像は、各画素位置について、記録された数(例えば、位置座標および関連スペクトル発光特性値、または、位置が示される(例えば、x-y平面において)実際の地図、ならびにz軸に沿う量として示される各測定スペクトル発光値)の行列であり得る。
装置の選別器42(これはまた、コンピューター28の一部を形成する)は、コンピューター画像において、選択されたスペクトルサイン(すなわち、選択された範囲の値の1つ以上の選択されたスペクトル発光特性)を有するPREを、他の光散乱実体から選別するように機能する。選別器の操作例は以下に示される。
C1.基板
上述のように、標的は顕微鏡台上に載置された基板上に支持される。適切な基板には、標準ガラススライド、カバースリップ、透明なスチレン、および透明なマイカが例として挙げられる。他の適切な透明な基板は、TEMグリッドに関連する基板(例えば、ホルムバール、炭素、および窒化ケイ素)である。これらのTEM関連基板はすべて、使用する厚さでは光学的に透明である。伝導性基板、半導体基板、および反射性基板もまた、PREの適応に適している。
本発明での使用に適切な別の基板は、PREの観察に関して目的のスペクトル波長に対して最初は不透明である可能性があり得るが、適切な流体または蒸気の適用によって、適切になり得るものである。例には、「サザン」、「ノザン」、「ウエスタン」および他のブロッティング、スポッティング、または「ディップスティック(dip stick)」試験のような診断技術での、目的の生物学的サンプルの転移に使用される場合、白色ニトロセルロース「紙」がある。一旦、目的の物質が移され、そして所望のように固定されると、PREは、予め形成された実体として適応され得るか、または以下のようにPRE核形成実体に適応されそして増強され得る。この段階での白色ニトロセルロースは、代表的にPREを視覚化し難くする有意な非反射型光散乱を示し得る。しかし、非反射型散乱の有意な減少を生じ得る適切な処理が使用される場合(例えば、アセトン蒸気でニトロセルロース基板を囲ませ、一方でPREをモニターする)基板はましてや不透明になり得、そしてPREの有効な観察が可能になる。
シリコンは多くのPRE検出適応物に対して好ましい基板である。なぜならば、非常に滑らかでかつ欠損物がないようにすることが可能であり、その結果として暗場照射下で、非反射型散乱をほとんど生じないからである。特に好ましいシリコン基板の1つの例は、非常に光沢があり、エッチングされ、および欠損のないシリコンウェハの表面であり、通常半導体の製造に使用されている。このような基板は汚染物質および表面の不完全さがほとんど全く存在せず、暗場の照射条件下でPRE散乱とすばらしいコントロールを生成する。しかし、代表的に、このようなシリコンウェハは種々のプロセシング工程の結果としてその表面上に存在するSiO2の薄い層を有することが理解される。その表面にほぼ100nm以上のSiO2を有するシリコン基板は、これまでに固形基板から観察された、最も強烈な、高度なコントラストPREスペクトルのいくつかを生成するということができる。そしてこのことは、シリコンウェハ表面上にSiO2のサブミクロン層を故意に形成させるのに有利であり得る。
迅速な酸化層の再形成を阻害する様式(例えば、HF酸中でのエッチングおよび水素での表面保護によって)で酸化層がシリコン表面から除去される場合、「点供給源」であるPREの光学画像は、明るい中心領域を有する通常のAiry環パターンではなく、円環形態で観察される。この「ドーナツ」現象は(シリコン表面と平行な)横方向の駆動電界の減衰の結果として生じている可能性が高く、これによって、良好に放射されるが、直接垂直に沿っては全く放射されないプラズモンモードを励起し得る、垂直な駆動場のみが残される。裸のシリコン基板のこの性質は、特定のPREがシリコン基板の表面に近接して結合されているかどうか、または限界分子、もしくはそれを表面から離れて配置するシステムを介して束縛されているかどうかを決定し、それによって双極子成分散乱比を変化させるのに有用であり得る。
C2.光源および検出器
続けて図3を参照すると、光源中の光発生手段32は、適切に水銀、キセノンもしくは等価なアーク;または、約20〜250ワットのクオーツ−タングステンハロゲン電球であり得、これは可視光PRE散乱については約350nm〜800nmの波長に対応する周波数帯での入射光、または低波長PRE散乱については従来のUV源、を提供する。
代表的にフィルター34は、前もって選択された狭帯域幅のフィルター一式を備え、それぞれのフィルターの手動式挿入またはコンピューターで制御された挿入を可能にする。このようなフィルターの帯域幅は、代表的には5〜10nmである。
一連の選択された帯域幅で標的を照射する他の方法には、非常に狭い帯域幅を使用し得る、全ての型のレーザーのような光源の使用が含まれる。複数の周波数源、例えば、規定された強力な「線」源のいずれかの特徴を選択するための調整(tuned)レーザー(すなわち、Arイオン)のような、周波数源もまた、意図される。あるいは、回折格子またはプリズムモノクロメーターが使用され得る。全ての光源は連続またはパルス様式のいずれかであり得るか、あるいは適切な光振幅変調装置(示さず)を入射経路に挿入して、所定の暫定様式で強度レベルを変化させ得る。サンプルに入射される光の偏光は、適切なフィルターまたは当該分野で周知の他の装置の挿入によって変更され得る。
図3の顕微鏡は上面照射(epi-illumination)システムと一致するように図示され、それによって、所望のようにフィルターされた光源由来の平行光は、半銀鏡38に衝突し、そして暗場/明場(DF/BF)レンズ40にむかって下方に反射される。この特定の型のDF/BF適用において、対物レンズを通過したであろう光線を有している入射光は、不透明サークル42によって物理的にブロックされる。これは、放射状(radially)に結合されたようなそして光線46によって示される、同心帯の光のみが通過し得るように、非常に微細なウエブ44によって妨害される。鏡38および不透明サークル42を備えるユニットは、調節可能ブロック48中に組み込まれ得、これは手動で(またはロボット的に)移動可能であり、それによって、顕微鏡をDF/BFから別の操作形態に変換させ得る。
鏡からの反射光は、次いで、屈折または反射されて(適切な円レンズエレメント50、これは入射光52の中空円錐に取付られた対物レンズに固定されている)、標的のサンプル平面の焦点へ変換させる。上記のように、このような光線の鏡反射は、入射円錐軌跡の線に沿って戻らせる。ここで、これらは最終的に吸収され、さもなければ、光学システムから除去される。
図3に図示されるこの暗場システムにおいて、光学軸とサンプルを照射する入射光線との間の角度は、光学軸と対物レンズエレメント45に受け入れられるPREによって散乱される光線(これは屈折形態のものとして図示される)との間の最大角度よりも大きい。また、示さないが、光学顕微鏡の全てに組み込まれたものは、検出器38から光線を他の部分(それによって標準両眼接眼レンズを介して可視的に画像が観察され得る)にそらし、または例えば、照射された場を撮影するために、さらに別の部分にそらす能力である。
レンズシステム54として100×の倍率および開口数(N.A.)0.8を有するNikon DF/BFレンズモデルCF Plan BD ELWDを用いることが適切であることが見出され、そして20×の倍率およびN.A.0.4を有するモデルCF Plan BD ELWDもまた、適切であることが見出された。この場合に、レンズの対物エレメントに入る光線は50%の鏡38において平行および入射とされ得、そして検出器(画像キャプチャー装置)58上の画像面に対する光線に焦点を合わせる、中継レンズ56中に入り得る(代表的に2×または5×の倍率である)。ここで検出は適切なCCDカメラシステムによって行われる。
レンズ56を備える光学システムは、好ましくは、検出器の配列に対応する領域内に視覚化される場を投影し、その結果として配列中の各画素が場の規定領域からの光を読みとるように構築される。
当該分野で公知の種々の画像キャプチャー装置が使用され得、これにはファイバー結合されたフォトダイオードアレイ、写真フィルムなどが含まれる。1つの例示的な装置は、熱電冷却型CCD配列カメラシステム、モデルCH250(これはTucson AZのPhotometricsによって製造される)である。この装置はCCDチップモデルKAF1400を利用し、1032×1037画素配列を有する。
検出装置が、場における個々のPREおよび他の光散乱実体のスペクトル発光の特徴を検出するように作用することが理解されており、場が光源により照射される場合、場におけるそれぞれの領域で、同時に配列画素を対応させる。
C3.画像処理、識別および出力
例えば、検出器がスペクトルピーク波長、ピーク強度および/またはスペクトルピークの半値幅を検出するために使用される場合、検出器は、複数の異なる照射光周波数の多くの各々で光の強度を計測し、それぞれの場の領域(regions)について同時に検出器の配列画素に対応させる。
各周波数で計測された発光(散乱)値は保存され、全スペクトルの照明の後に構築される、それぞれの領域についてのスペクトルの発光曲線を与える。これらの曲線から、ピーク波長、ピーク強度、および強度での半値幅を、それぞれの領域について計算する。同様に、画像面でのピークの半値幅を上記に記載のCCDアレイを使用して計測し得る。
検出器は、時限曝露、データ保存のための適切なファイルへの画素の読み出し、統計学的分析、および画像処理(コンピューター28の機能の1つとして)を可能にする包括的なソフトウェアおよびハードウェアとともに供給され得る。この能力は、検出器から受信されたシグナルから構築するための画像処理装置として作用し、最初にスペクトルの発光特性の値を検出し、次いでこれらの値のコンピューター画像および対応する関連する場の位置を検出する。
画像処理装置により構築された画像は、保存された点の行列(例えば、それぞれの場の位置(場における領域)に関連する値の行列および1つ以上の計測されたスペクトル特性についての値)であり得るか、または場の実際の位置のマップ(例えば、x-y平面、およびz平面での関連するスペクトル発光値)であり得る。
装置内のコンピューターはまた、コンピューター画像における他の光散乱実体由来の選択されたスペクトルのサインでPREを識別するための識別手段を提供する。この識別についての基礎は、種々のスペクトル発光特性および光散乱実体の物理的特性とのこれらの相関性の議論において上記で述べている。
従って、例えば、選択されたスペクトルのピーク波長および強度でのピークの半値幅を有するPREを識別するために、生成されたコンピューター画像は、全ての場の領域の行列ならびに関連するスペクトルピークの波長および幅の値を提供し得る。次いで識別器は、PREを含むこれらの領域を選択し、このスペクトルサインは、これら2つのスペクトルの発光値の特定の範囲を満たす。選択された特定の値に応じて、識別器は、以下を識別する多くの方法で場での光散乱実体を分類し得る:
1.場における他の全ての光散乱実体から選択されたスペクトルサインを有するPRE;
2.場での非PRE光散乱実体由来のPRE;
3.選択された型のPREについて、お互いに相互作用するもの、および相互作用しないそれらの選択されたPRE;ならびに
4.場において別の選択されたPREの型に由来するPREの1つの選択された型。
それぞれの場合では、識別の基礎は、場におけるそれぞれの光散乱実体について、ピーク位置、ピーク強度、またはスペクトル発光曲線の強度でのピークの半値幅、画像面のピークの半値幅、および入射角応答または入射偏光応答の検出された値に基づき得る。他の上記で言及されるスペクトルの特性もまた意図される。特に、PREが表面局在性の蛍光分子またはラマン活性分子実体を有する場合、検出は、それぞれ1つ以上の上記の分子または実体に由来するプラズモン共鳴誘導性蛍光発光、またはラマン分光発光を検出することであり得、そしてこれらの値は、他の光散乱実体から、このようなPREを識別する基礎として使用される。図11は、PREの表面上に有されるラマン活性分子の代表的なラマンスペクトラルを示す。
次いで、識別工程から入手される情報は、場についての情報を提供するために使用される。利用可能な様々の型の情報は以下のIV〜VI節で議論される。これらには、以下のものがある。
1.場で選択された型のPREの全数。ここで、識別工程は構築されたコンピューター画像において選択されたスペクトル発光特性の選択された範囲の値を有するPREの数を計数することを含む;
2.場での選択されたスペクトル特性の選択された範囲の値を有するPREの空間パターンの検出。ここで識別工程は、これらのスペクトル特性値を有するPREの相対位置の画像を構築することを含む;
3.2つの隣接するPREの間の距離、特に、この距離がレイリー解像距離よりも小さい距離。ここで検出工程は、1つの波長の光に場を曝露して場でのPREの回折像を入手すること、第2の波長の光に場を曝露し、場における第2のPREの回折像を入手すること、および2つの回折パターンのピーク間の距離を比較することを含む;
4.場の環境における変化の審問。ここで、識別工程は、変化(例えば、場の誘導体の変化)の前後で、場でのPREの検出されたスペクトル特性の値の比較を含む;
5.場でのPREの運動の検出。ここで検出工程は、時間の関数として、画像面でのPREの回折パターンの中心の検出を含む。
C4.他の実施態様
照射された場において100以上ものPRPの同時画像化は、先程記載されるような装置を使用して容易および効率的に達成され得る。あるいは、この装置は、上記に記載の方法に従って集束光線光源で場の各領域を連続的にスキャンすることおよび/または場での各領域からの光散乱を連続的に検出すること、固定光学により定義される小審問領域を通して顕微鏡のステージを移動させ、各領域を連続的に審問して選択されたスペクトル特性の値を検出することによって場におけるそれぞれのPREのスペクトル特性を「読みとる」ように設計され得る。
蛍光画像を検出するために、光源は所望の発蛍光団の励起スペクトルについて適切にフィルターされ、そして適切なフィルター(示さず)は、鏡38とリレーレンズ56の間の領域に配置される。このフィルターは、励起光を実質的にブロックするために選択され、そして目的の発蛍光団の発光スペクトルのバンドマッチでの光の通過を可能にする。
暗視野PRP処理、明視野染色および/または蛍光染色した試料(例えば、生物学および医学研究者ならびに臨床適用の対象である細胞および他の実体物)の多重画像を比較する能力の価値は、容易に認識され得る。
PREによって散乱した光を優先的かつ効率的に観察するための適切な手段に関連しての有効な暗視野条件を確立するように入射光を導入するための幾つかの適切な手段がある。透明な基板については、入射光は、図3で示されそして以下でより詳細に記載されるように、PREが位置する近傍の境界で、基板を通じての透過率、「対物側方表面」からの反射率、またはTIR(内部全反射)のいずれかで導入され得る。後者の場合では、TIR光の消失尾部はまた、それらが反射境界の外側に直接ある場合、このような光の場の分布が対物レンズに直接照射しない場合でさえPREを励起するために使用され得る。
非透明基板については、光は、対物に到達するような最小限の光を有し、可能な限り近い正反射をもたらすような様式で入射されなければならない。この条件を達成するためのいくつかの手段がある。1例として、入射光が1つ以上の光ファイバーを介して視野に導かれ得る。このファイバーは、光が入射角で基板に反射しないように配向され得、そしてPREを画像化するために使用される顕微鏡システムの対物レンズには入らない。市販されているDF/BF対物レンズを使用することもまた利点である。実施例はNikon Company、Long Island N.Y.により販売されているものである。このようなDF/BFレンズが使用され得る方法の例は、図3に示される。
装置でのシステムの対物レンズは、反射レンズまたは屈折レンズのいずれかとして作られ得る。特定のPRE適用、特に、光波長の関数としての対物レンズの最も正確および迅速な集束を要求する適用について、反射レンズは色収差がかなり減少され得ることから好ましくあり得る。屈折レンズは、PREにより放射される光を観察する場合、色収差を慎重に補正しても、焦点距離のそれらの周波数に依存して有意な偏差をなおも示し得る。これらのプラズモン共鳴のピーク近傍のPREが、準波長(sub-wavelength)にサイズ化された供給源についてこのように異常な明るさのものであり得るという事実は、光学成分の評価について利用されることを可能にし、それによって成分の理想的な「点源」応答からの種々の偏差を観察し得る。
対物レンズの開口数を増加させる特定のレンズ型の使用もまた意図される。PREは、球状の頂部および平坦な低い表面を有する標準的な「固体液浸」レンズを用いて画像化され得る。このような別に意図されるレンズは、切断された固体液浸レンズ下部表面とレンズ材料としてのほぼ等しい屈折率を有する基板との間に液体を有する固体液浸レンズ(SIL)の液体アナログである。
このようなレンズは、図4で図示される。レンズの底部平坦表面80は、標準的な固体液浸レンズよりも短く切断される。底部表面80と基板84との間の液体82に一致する率については、レンズの焦点面は、通常のr/n(ここで、nはレンズ材料の屈折率である)の位置にあり、これはここで、(屈折)率が一致した液体の内部にある。従って、この焦点面での液体中のPRPは、このシステムを用いて画像化され、溶液中の基板に結合していないPREにおける集束を可能にする。このようなレンズは、当業者によって市販のDF/BF顕微鏡レンズに容易に追加され得、従って、液体マトリックス中の試料表示のための改良された開口数および倍率の増加をもたらす。詳細には、この改造はPREの可視化における輝度および明度の増加をもたらす。この構成は、ユーザーが大きな開口数を維持しながら液体試料中の焦点位置を変化することを可能にし、そしてSILについて使用される場合の内部全反射に基づく照射の通常の必要性を除去する。それゆえこのシステムは、溶液中の特定のPREの挙動のモニタリングを可能にする。
他の好ましい実施態様では、暗視野の光学は、PREシグナルのシグナル/ノイズ比を最適化するために選択される。これはしばしば、最小量へ、または観察されるPRE散乱光の量に対して最小量へとバックグラウンド(非PRE)散乱光を減少させることによってコントラストを改良することを含む。例えば、通常の1”×3”のガラス製顕微鏡スライドを使用して、動作距離が長いクラスのNikon DF/BFレンズが、同じ倍率レベル(100×)において、レンズのNAが高くなるほどPREから集められる光がより散乱するという事実にも拘わらず、0.9NAレンズと比較して、0.8NAレンズを使用する観察について良好なコントラストを有することが決定された。これは、暗視野照度光の入射角が対物のNAが変化する場合変化することから、むき出しのガラス製基板の特性を反映する変化に帰させ得る。
偏光入射光もまた、基板表面からの反射光の量を減少させるために特定角度(例えば、ブルースターの角度)で使用され得る。これは対物レンズに入る非PRE散乱光の量を減少させることによりコントラストを改良する。上記に記載される楕円体PREのような非球状PREを画像化する場合、平面偏光入射光への反応もまた、異なるPREの集団を識別するために使用され得る。
別の実施態様では、検出器に到達する底部表面から散乱する光量を減少させるために十分に厚い透明基板を使用する。粒子が薄いガラス基板の底部表面に存在する場合、いくらかの散乱入射光が検出システムに再び入りそしてバックグラウンドを増加させる。基板の厚さを増加させることによって、光軸からさらなるスプリアス散乱の領域を置換し、それによって検出器に入る非PRE散乱光の量を減少させる。
内部全反射(TIR)はまた、下部からの透明基板におけるPREを照射するために使用され得る。このような光の消失尾部は、その境界の近傍に位置するPREを励起するために有効に使用され得る。内部に全反射する光を用いてPREを励起するための幾つかの方法(例えば、その寸法および内部コアおよび外部層の屈折率がそれに配置されたPREを励起させるためにファイバーの外側表面で充分にする場が不在するように選択される光ファイバーを用いる)がある。PREから放射された光は、ファイバーに戻され得、標準的方法により観察され得る反射光源を形成する。
図5で図示される別の実施態様では、Doveプリズム70は側面から照射される。標準ガラススライド72は、適切な(屈折)率に一致する油74をその間に有して、Doveプリズム70の頂部表面上の間に置かれる。入射光76はプリズム70の主表面に対して並行に導入され、そしてスライド72に向かって反射される。スライドでの入射角はより臨界角を超えるように選択され、そしてスライド72の上部表面での内部全反射をもたらす。次いで、光はDoveプリズムの反対側から出、再びプリズム70の主面に対し並行になる。消失電磁場は、スライドの上部表面に結合するPREを励起し、そして通常のプラズモン共鳴散在光を、スライドの上に配置された対物レンズに放射する。
このDoveプリズムの相対位置(geometry)は、多様な供給源(例えば、レーザー、水晶ハロゲン、アークランプなど)から光を光ファイバーまたはレンズを介してもたらして、Doveプリズムの側面に衝突するのに都合が良く、そしてフィルターは、入射光の性質をさらに制御するためにその間に都合が良いように挿入され得る。
Micro-Video of Avon、MAのDARKLIGHT(TM)光源もまた、内部全反射照明システムで使用され得るが、図5を参照して記載されるDoveプリズムの実施態様よりは一般に劣ることが見出されている。この内部全反射するスライド照射器は、ハロゲン供給源から光ファイバーへ光を運び、次いでガラススライドの端へと運ぶ。光は、スライドに拡散しながらかなりの回数の内部全反射を受け、図5の実施態様のように消失場を有するPREを励起させる。このシステムは、米国特許第5,249,077号で詳細に記載されている。さらに、PREは米国特許第3,856,398号に記載される照明を介して観察され得る。
油浸レンズシステムもまた、TIR照明と共に利用され得る。もっとも、これらのシステムにおいて内部反射による媒体の屈折率は、使用される油の屈折率より大きくなくてはならない。従って、1.7の屈折率を有するフリントガラスは、1つの好ましいプリズム物質である。
図6は、別な照明スキームとして、適切に取り囲む暗視野照明リングエレメント92を組み合わせた反射対物レンズ90を備えたDF/BF対物レンズシステムの横断面を示す。このような2つの構成要素の反射レンズの使用は、回折パターンの中央部における強度を減少させる。しかし、この使用が先行技術に記述される屈折レンズに比べ実質的に色収差もまた減少させるという事実は、多くのPREおよび観察領域中の他の非PRE散乱実体について(これらは、画像化され得、そして多くの適用において識別され、そして退けられる必要のある)、同時周波数依存性散乱データを得るための手段との組み合わせで、この2つの構成要素の反射レンズ使用を好ましい実施態様とする。
いくつかの適用において、光学顕微鏡観察の方法は、光学的にPREを画像化しそして分析する両方のこと、ならびにさらなる機器を用いて同じPREおよび関連するサンプル物質を観察すること(例えば、1つ以上の形態の電子顕微鏡観察)に適合されなけらばならない。これらの場合、暗視野光学顕微鏡観察は、電子顕微鏡観察にもまた適切な基材を用い実施されなければならない。電子は、サンプルおよび基材を通過するので、基材は非常に薄くなければならない(代表的には1μmを十分に下回る)。一般的な基材は、支持グリッド上に沈着したホルムバールおよび/または炭素を含む。バックグラウンドの散乱は、入射暗視野照明の適用領域が、グリッド「バー」の間隔内にあるように、そして/または観察下のサンプルの一部について収集(collecting)対物光の視野を制限するようアレンジすることにより、グリッド境界または「バー」より減少される。BF/DF対物および顕微鏡システムについて、1インチにつき400バーまでの間隔のグリッドおよび窒化珪素膜がとくに適切である。別の暗視野照明の形態として、グリッド基板より下部からの暗視野照明を用いた別々の光ファイバーまたはレンズ、ならびにBF対物レンズを用い上部からの散乱PRE光の観察を包含する。
IV.PRP組成物
本発明は、さらに、プラズモン共鳴粒子(PRP)の1つ以上の集団を有するPRPの懸濁物を含む。組成物は、4つの顕著な特徴を有する:(i)各集団のPRPが100nm未満のスペクトル半値幅を有する;(ii)単一の集団のPRPがすべて規定されたスペクトル発光ピーク波長の40nm以内、好ましくは20nm以内である;(iii)組成物中の少なくとも80%のPRPは1つ以上の集団にあり、>700nm、400〜700nm;および<400nmの3つ範囲のうちの1つにスペクトル発光波長を有する;および(iv)各集団は組成物中の任意の他の集団とPRPの数において、多くとも30%の重複を有する。
第1の特徴は、PRPの質を述べる(高品質発光は、散乱光の比較的狭い周波数範囲により特徴づけられる)。第2の特徴は、所定の集団内の全PRPのスペクトル発光特性の均質性を提供する。特に、所定の集団内のPRPは全て、規定された波長の40nm以内のピーク波長を有する。第3の要件は、PRPの大多数(少なくとも数量で80%)は、3つの異なる波長範囲のうちの1つにあることを提供する。第4の要件は、各集団が所定のピーク波長の40nm以内のスペクトルピーク波長の分布を有すると仮定して、集団の独自性を規定する。2つの分布曲線は、1つの集団の粒子の30%(数量)が、隣接する集団により規定される分布曲線中に属する距離より近くにあり得ない。
代表的には、組成物中のPRPは、1つ以上の集団に存在し、全て400〜700nmの波長の範囲に存在する。PRPは均質であり得(例えば、全て青粒子)、あるいは集合的に組成物中のPRPの80%を構成する1以上の集団に存在し得る(例えば、赤粒子、緑粒子および青粒子の個別の集団)。
このスペクトル範囲の粒子は、下記のとおり、固形銀粒子、金核を有する銀粒子、または誘電性の核および少なくとも5nmの外側の銀殻を有する粒子として形成され得る。
1つの一般的な実施態様において、特に種々の診断への適用での使用のために、粒子は、その表面に、(i)標的のリガンド結合部位に結合するよう適応された表面付着リガンド、(ii)蛍光分子、および(iii)ラマン活性分子実体を配置する。リガンドは結合対のメンバーの1つである。結合対としては、抗原/抗体、ホルモン/レセプター、薬物/レセプター、エフェクター/レセプター、酵素/基質、脂質/脂質結合因子、および相補核酸鎖が例として挙げられ得る。
組成物中のPRPは、異なるグループのPRPに異なる表面局在化分子を有し得る。これらの異なるグループは、異なるPRPの集団(すなわち異なるスペクトルピーク波長を有するPRP)であり得るか、あるいは均質なPRP集団においてPRPに局在し得る。
第1のおよび第2のリガンド結合部位を有する標的の同定に使用するために、異なる表面局在化分子は、異なるリガンド結合部位(例えば、共通の標的ポリヌクレオチドの異なる配列領域に結合する2つの異なる配列のオリゴヌクレオチド、または高分子標的上の異なるリガンド結合部位に結合する2つの異なるリガンド)への結合に効果的な異なるリガンドであり得る。
PRPは種々の公知の方法により形成され得る。公知の方法としては、コロイド化学、水溶性ゲル、エバポレーション/アニーリング、エンハンサーを介する核形成/成長、オートラジオグラフィー、ならびに銀ハロゲン化物および光、X線または他の入射波長の様式での電磁エネルギーを介する他の物質における光反応が挙げられる。加えて、リソグラフィー、電着、電気メッキおよび走査型トンネル顕微鏡(STM)先端によるスパッタリングが使用され得る。
PRPが、例えば、付着リガンドを表面に配置している場合、PRPは、リガンド/リガンド結合性結合対の他の半分を有する目的の標的と選択的に結合し得る。
上記のとおり、異なる規定されたピーク波長値を有するPRPの集団を産生することにはまた、利点がある。規定されたPRPの集団が、特定の結合特性と組み合わせられた場合、現在使用されている全ての標識技術より有意な利点を有する、準微視的プローブの新しいクラスが作成される。以下に記載されるPRP形成技術は、このようなプローブを作成するために使用され得る。
A.金属増強メントによるPRPの形成
PRP形成のこの方法において、核形成中心(代表的には1〜20nmのサイズ範囲の金属核形成中心)は標的位置に配置される。その後、インサイチュでのPRPの完全に伝導性の本体の発達(増強(enhancing))を行う。いくつかの適用において、空間的にあらかじめ特定した位置は、核形成中心の配置のために指定される。このことは、位置が未知である特定の物質または特徴についてマトリックスを探索するために核形成中心が用いられる他の適用と、対照的である。予め特定した配置は、下記にさらに記述するような計測学および/または器械類への適用において有利であり得る。例えば、単一のPRPを、光ファイバーの末端または走査型顕微鏡先端に配置することが望まれ得る。特定の幾何学的配置において、PRPの所定のパターンを作成することもまた、望まれ得る。
制御されたスペクトル特性を伴うPRPの作成が頻繁に望まれるので、モニターしながら増強は有利に行われ得、いくらかのあらかじめ規定したスペクトル特性を有するPRPが形成される場合にプロセスを止める。これは、光の影響を受けない増強化学が用いられる場合、特に便利である。定期的に増強プロセスを終結し、形成された実体の特性を観察し、そして1つ以上のスペクトル特性(例えば、色)が、例えば所望の範囲内にない場合、増強プロセスを再度開始することによりPR形成をモニターすることもまた、可能である。
核形成中心は、代表的に、直径1〜10nmの金粒子であり、この核形成部位をPRPサイズにまで増強するのに用いられる金属は銀である。しかし、例えば、プラチナ、ニッケル、およびパラジウム、ならびにポリヌクレオチド分子のような高分子を含む他のエレメントもまた、続いての増強プロセスのための核形成中心として意図される。非金属物質もまた、核形成中心として用いられ得る(例えば、タンパク質および核酸)。
所望の形および特性を有するPRPを産生するために、核形成中心の配置は制御され得る。例えば、核形成物質の三角形または楕円形の領域が形成され得る。析出プロセスは、多くの当該分野で公知の金属析出技術(例えば、蒸着、スパッタリング、所望の物質より調製した薄膜のGa-焦点イオン光線(FIB)ミル、およびナノポア(nanopore)への電気メッキ)を包含し得る。特に、十分に制御された核形成物質の配置は、走査型トンネル顕微鏡の金属先端から核形成物質を放出することにより可能である。個々の金属原子を走査型トンネル顕微鏡の先端で拾い上げ、移動し、所望の位置へ降ろす技術が開発されてきた。個々の原子はまた、走査型トンネル顕微鏡の先端で所望の位置へ「押し込まれ」得る。本技術は、核形成中心として使用するために、例えば、10の金原子を空間的にあらかじめ特定した位置へ配置するのに使用され得る。
1つの実施態様において、標準的な微小操作技術を用い、延伸(drawn)マイクロピペットの先端へのPRPまたはPRP核形成中心の導入、PRPまたはPRP核形成中心の所望の位置への移動、およびPRPの所望の位置への沈着により、PRPまたはPRP核形成中心は所望の位置へ配置される。ピペット先端は、種々の粘度を有する溶液中(すなわち、ゼラチンまたは他のマトリックスを用いて)の所望の物質で満たされ、次に先端は、顕微鏡下で観察しながら、選択された位置へ、操作される。ピペット中の溶液に圧力を加えることにより、非常に少量が所望の基板上に沈着され得る。他の微小操作技術もまた、可能である。
PRP物質は、共鳴周波数以上の周波数で正の誘電率を有するので、現在行われているプラスチック粒子の光学的トラップと同様な原理を用い、適切な波長の焦点光線中で金属粒子を光学的にトラップし得る。従って、PRPがトラップされた光線の操作により、PRPは、空間的にあらかじめ特定された位置へ配置され得る。PRPを空間的にあらかじめ特定された位置へ電気泳動的に送るために、ゲルの導管もまた作成され得る。導管が、指定した位置の近位を通過するように配置される場合、導管内のPRPは、電場の影響下で移動し、指定した位置へ導かれる。静電的結合技術はまた、PRPを空間的にあらかじめ特定された位置へ除去可能に付着するために用いられ得る。
1つの実施態様において、直径約10〜100ミクロンの1つ以上の伝導性パッドの配列は、標準的な集積回路リングラフ技術を用い作成され得る。各パッドは、さらに電圧源と選択的に接続され得る。溶液中のPRPは負に荷電しているので、適切な電位をパッドに加えると、溶液中から伝導性パッドへ、PRPが引きつけられる。PRPとパッドとの間の表面結合力が弱い場合(すなわち、およそ1ピコニュートン)、電圧を除去し、そして加えた電位の符号を逆にすると、PRPが遊離し得る。
結合体化核形成中心および/または結合体化PRPはまた、結合体対の他の半分を空間的にあらかじめ特定された位置へ固定化し、そして核形成中心上の結合体またはPRPを結合体対の他の半分と結合させることにより、空間的にあらかじめ特定された位置へ配置され得る。
個々の核形成中心(または完全に形成されたPRP)はまた、基板への金属粒子含有液の小滴を噴出し、そしてインク−ジェット印刷で用いられるのと類似の技術によりその液体をエバポレートさせること、沈着され得る。この技術において、1つ以上の金属粒子が、滴下位置により規定される特異的な位置へ、送達され得る。いくつかの実施態様において、液体中のPRPまたは核形成中心の濃度は、統計学的に、PRPまたは核形成中心が各1滴に1つ含まれるかまたは含まれない可能性が高いように選択される。核形成中心が沈着する場合、核形成中心は引き続きPRPを形成するように銀増強され得る。さらに、これらの技術は、PRPの所望の幾何学的パターンを作成するために使用され得ることは、注目される。このようなパターンを作成する場合、滴下は、最初の通過の間にPRPが噴出されなかった位置に、再沈着され得る。このようなPRPパターンを有するものは、目的物の同定、半導体マスクの整合(registration)、および下記により詳細に記述する用法にとって有用であり得る。
本明細書中に定義するように、「インサイチュ」という用語は、PRPが基板に結合しているか、溶液中に浸漬されているか、またはマトリックス中に懸濁されていることを示す。「基板」という定義は、下記に論じた。「基板」としては、例えば、組織切片、細胞、TEMグリッド(例えば、ホルムバール、シリコン(窒化珪素および二酸化珪素を含む)、雲母、ポリスチレン等より作成される)などのPRPが会合しうる任意の実体が挙げられる。これら核形成中心は、代表的には、金コロイド調製物であり、そして核形成中心の適切な集団は、遊離型あるいは種々の生物学的分子に付着した形態のいずれかで市販されている。
電子顕微鏡および/または光学顕微鏡下で可視であり得るより大きな銀塊を産生するために、金核形成中心の銀増強は現在実施されている。そして、銀増強した金粒子を用いて生物学的システムを画像化するためのいくつかの手順が広範囲に開発されてきた。従って、増強を行う試薬および核形成中心自体は市販されている。抗原に結合した金核形成中心は、いくつかの供給源より入手可能である。供給源としては、E-Y Laboratories(San Mateo,CA)およびAmersham(Arlington Heights,IL)が挙げられる。さらに、大量の文献が、このような増強を行う種々の適切な方法を記述している(例えば、M.A.Hayat編、Immunogold-Silver Staining-Principles,Methods,and Applications,CRC Press,1995を参照、この開示は本明細書中でその全体が参考として援用される。最も特に、銀増強金核形成中心についてのいくつかの実験技術を記述し、そしてそれにより形成される銀塊について考察する第2章および第7章)。
増強プロセスは、好ましくは、金核形成中心を、銀塩(例えば、酢酸銀、乳酸銀または硝酸銀)の溶液および還元剤(例えば、pHが約3.5〜3.8のクエン酸緩衝液中のヒドロキノン)と混合することにより実施される。約6mMの濃度の銀塩および約33mMの濃度のヒドロキノンを提供するのが適切であった。適切な量の銀および還元剤を含有する市販の銀増強溶液は、例えば、BBI(英国)より市販されている。当業者は、緩衝システム、銀塩、還元剤および他の増強パラメータの選択が、局所環境、標的位置等について好ましく最適化され、そしてそのような最適化は過度の実験を要することなく行われ得ると理解する。
本発明の1つの局面に従い、本発明における有用なPRPは、粒子がプラズモン共鳴粒子の性質を有するまで、銀増強核形成中心により調製される。最も好ましくは、銀増強パラメーターは、作成されたPRPが、暗視野顕微鏡観察で観察する場合、特定の所望の色を表すというような、あらかじめ規定されたスペクトル特性を有するように制御される。増強の間、個々の進化中のPRPを1つずつまたは個々のPRPを複数同時に、スペクトル特性が観察され得る。従って、特定の物理的性質を有するPRPが作成され、そして、所望の位置へ配置され得る。加えて、PRP核形成中心は、インサイチュ、インビトロまたはインビボのいずれかにおいて、所望の位置に配置され得る。その後、その特定位置において銀増強によりPRPを産生する。
B.金属増強によるPRP(またはPRE)形成の具体例
PRPを、以下の実施例に記載する金核形成中心の銀増強により調製した。
実施例1
基板への金コロイドの配置
アルシアンブルー法は、基板の空間的にあらかじめ特定された1以上の部位を化学的に処理することにより、金コロイド核形成中心を基板に付着させるための一方法である。アルシアンブルーは、電荷相互作用により負に荷電した金コロイドの付着を促進する正荷電色素である。PRPが望まれていない基板部分を、BSAのようなブロッキング剤でコートし得る。5%酢酸および2%アルシアンブルーの100:1希釈の100マイクロリットルの液滴を、注意深く清浄にしたスライドガラス上に10分間置いた。次いで、基板の活性部位を、二回蒸留水に浸漬し、リンスし、次いで乾燥させた。
金コロイドを、所望の濃度に希釈した。溶液を、基板のアルシアンブルー処理領域に置き、そして10分間インキュベートした。次いで、基板を蒸留水でリンスした。
基板に付着した金コロイドを、実施例2に記載される方法により増強した。
実施例2
個々の金核形成中心の銀増強
ゼラチンの0.1mg/ml溶液1mlを、エッペンドルフチューブ内で50μlイニシエーターおよび50μlエンハンサーと混合した。イニシエーターおよびエンハンサーは、BBI International(英国)銀増強キット、光学顕微鏡(LM)バージョン、カタログ番号SEKL15から入手した。基板を直ちにエンハンサー溶液でカバーして、時間測定を開始した。次いで、PRが存在するか否かを決定するために、基板を暗視野照明下で観察した。ガラス、シリコン、またはTEM基板上におけるコロイドのおよその増強時間は約1分であったが、生物学的基板上に付着した結合体コロイドのおよその増強時間は約7分であった。これらの時間を、増強が起こっている間に、暗視野顕微鏡下で個々の伸展PRPからの散乱光を連続的に観察することにより決定した。正確な増強持続期間は、散乱反応、従って生成するPRPの色を制御するために利用され得ることが理解され得る。蒸留水で徹底的にリンスすることにより、増強を停止させた。
実施例3
溶液中でのPRPの生成
コートされないコロイドについては、100μlのストック金コロイド(BBI International、英国)を、20mlゼラチン溶液(0.1mg/ml)に添加した。タンパク質結合体化コロイドについては、100μlのストック結合体化金コロイドを、表面をブロックするために、1%ウシ血清アルブミン(BSA)を有する20mlの二回蒸留水に添加した。使用した結合体化コロイドは、ウシ血清アルブミン、ヤギ抗ビオチンおよびウサギ抗ヤギIgGであった。代表的な金コロイド濃度は、以下の通りである:
コートされないコロイドについて:
3nmストック−約3×10¹³粒子/ml
10nmストック−約5.7×10¹²粒子/ml
20nmストック−約7×10¹¹粒子/ml
タンパク質結合体化コロイドについて:
1nmストック−約2×10¹⁵粒子/ml
5nmストック−約1.7×10¹⁴粒子/ml
10nmストック−約1.7×10¹³粒子/ml
20nmストック−約2×10¹²粒子/ml
次いで、3滴(150μl)のイニシエーターを添加した。次いで、エンハンサーの10μlの増分を、所望のPRP散乱ピーク波長に相当する量を添加するまで、撹拌しながら添加した。PRP共鳴を、先に記載したように、暗視野測定または吸収分光法によりチェックした。
C.リソグラフィーおよび照射によるPRPおよびPRE形成
リソグラフィー技術を、PRP(またはPRE)の形成部位を特定し、その形状、形態、および組成を制御するために使用し得る。ポジティブレジスト法およびネガティブレジスト法の両方を、核形成中心または完全に形成したPRPのいずれかを下に配置するために利用し得る。ポジティブレジスト法においては、レジスト層の部分を、モールドを形成するために除去し、このモールドの中に金属を沈着させる。このような沈着後、レジストおよび過剰の金属を離昇し、核形成中心または完全に形成されたPRPを後に残す。ネガティブレジスト法においては、銀またはその他の適切な金属の選択される層をレジストの層により被覆する。次いで、このレジスト層の部分を重合する。本技術を用いて核形成中心を形成する場合は、本重合領域の固有サイズは好都合には約5〜20nmであり得る。ピーク波長が光学スペクトル内であるPRPを下に配置するためには、重合領域の固有サイズは、好都合には、4〜125nmである。次いで、銀および非重合レジストは、エッチングにより除去されて、レジストの重合領域の下に金属核形成中心または完全に形成したPRPを残す。別の代替法としては、所望されるよりも大きな金属型を作製し、そして所望の特性のPRPが形成されるまでイオンミリングにより材料をエッチングにより除去し得る。これらの技術の全ては、電子工学およびその他の産業において使用されており、当業者には周知である。
さらに、金属塩およびハロゲン化物(すなわち、フィルム内)を核形成中心または粒子全体を得るために照射し得る。増強を、上記の技術により実施し得るか、または金属粒子を熱アニーリングすることにより実施し得るか、またはPRPを生成するまで光化学金属塩または金属ハロゲン化物のフィルムを光で局部的に照射し、次いでフィルムを固定、および現像する、写真現像工程で行われるように実施し得る。核形成中心またはPRPを所望の位置に形成するために、局所化された光のスポットを作製し得る、いくつかの方法がある。一つの実施様態においては、核形成を適切な小さなサイズに制限するのを助けるため、または銀粒子を直接成長させるために、金属側をコートしたテーパーファイバー「近距離場」スキャンチップを使用して、極めて局所化された光のスポットを生成し得る。あるいは、末端にPRPを有する、好ましくは直径約150nmの、あらかじめ作製された特製光ファイバーチップは、感光性表面物質上にこれらの核形成中心を「描く」ために所望の位置に光を集中させる。別の実施様態においては、固体-液浸レンズを、金属塩またはハロゲン化物上に光線を収束するために利用し得る。基板の局所照射をさらに増強するために、固体-液浸レンズは、PRPをその焦点に含み得る。
光化学銀塩またはハロゲン化物はまた、電子およびイオンビーム照射、ならびに放射線元素からの照射に感受性である。これらの写真法はまた、所望の配置のPRPの配列またはパターンを生成するために使用され得ることが理解される。
現像中のPRPが溶液内にあっても、または基板と結合していても、増強工程は、暗視野顕微鏡でインサイチュで観察され得、そしてPRPが、特定の色に対応する所望のサイズに一旦達すると、プロセスは停止し得る。光感受性増強手順の間、エンハンサーを洗浄により除去し、生成された粒子の光散乱特性を観察することにより増強プロセスの進行を測定し得、そして所望のスペクトル特性を有するPRPが得られるまで、増強を再開し得る。代替的な実施様態においては、比較的光非感受性のエンハンサーを使用し得、そして増強プロセスを、連続的な暗視野照射および散乱データ収集により観察し得る。勿論、所定の特性を有するPRPを生成するための、エンハンサー量、インキュベーション時間などを示す特定のプロトコルが一旦開発されれば、増強プロセスの観察は不必要となる。
D.結合体化PRPの形成
上記の実施例3に示したように、抗体のような生物学的高分子に結合される核形成中心を増強することが可能である。結合体化金抗体のこの増強は、結合体化金/抗体が水性溶液中に存在するか、または細胞内もしくは細胞オルガネラ内で抗体とあらかじめ結合されていない場合においてさえ、好結果で実施され得る。驚くべきことには、PRPを生成するための遊離の結合体化金核形成中心の銀増強後、金コロイド中にもともと存在している結合体分子のかなりの部分は、生じるPRPに表面で結合することが見出されている。さらに、生物学的分子は、増強プロセス後も生物学的活性を保持し得る。
本方法に関して、所定のPRP上に結合する結合体の量を、結合体に結合させる核形成中心のサイズを制御することにより制御し得る。例えば、市販の直径1nmの核形成中心は、結合体化分子を一つだけ有し得、そしてその最外部表面に付着されるその結合体分子を有するPRPを形成するために銀増強され得る。20nmの核形成中心は、相応じて多数の付着結合体を有し、そのうちのいくつかは、銀増強にされたPRPの表面に結合することになる。銀増強の間、結合体に結合されるPRPを、PRPの表面上の非特異的結合部位の存在を減少させるために、ウシ血清アルブミン(BSA)のようなブロッキング剤とともにインキュベートし得る。
別の実施様態においては、PRPの作製後に、結合体をPRPに添加する。結合体は、PRPと共有結合または非共有結合のいずれかにより結合する。例えば、完全に形成されたPRPを、非特異的電荷相互作用を防止するために、ゼラチン、寒天、ポリテトラフルオロエチレン(TeflonTM)、PVP、またはラテックスでコーティングし、次いで周知の方法により1以上の官能基を共有結合によりそこに付着させ、従って特定の結合体対の最初の半分に付着されたPRPを生成する。結合体を免疫金核形成中心または形成されるPRPに結合するために必要とされる試薬は、全て市販である。
結合体に結合されるPRPを形成する本方法はまた、PRE表面に結合される結合体分子(すなわち、「最初の半分」の結合体対)の数の制御を可能とする。この場合、結合体およびBSAのようなブロッキング剤溶液中で、裸のPRPをインキュベートし得る。結合体およびBSAの相対濃度は、平均して、各PRP上の結合体の所望の量を生成するために調整され得る。普通でない形状のPRP、または異なる物質の同心円状のシェルを含むPRPについては、形成後に結合体でコーティングすることが、代表的にはより便利である。しかし、ほぼ球形である、結合体に結合されたPRPは、上記の通りに市販の結合体に結合された金コロイド核形成中心および銀エンハンサーから好都合に生成され得る。
結合体または他の分子は、PRPの金属表面に直接結合され得る。そのような結合に関わる表面化学は複雑であるが、多くの非PRP免疫金銀染色技術において、現在広範囲に開発されている。あるいは、PRPを、結合体のようなさらなる分子の結合に先だってラテックスのようなプラスチック材料のシェルによりコートし得る。ラテックスに分子を結合するための技術もまた既知である。金属に直接結合する分子またはプラスチックシェルに結合する分子は、結合体自体であり得るか、またはスルフィド、アミド、ホスフェート、アルデヒド、カルボキシル、アルコールのような他の中間反応基、または結合体もしくは他の目的の分子が結合し得る他の物質であり得る。結合体または他の目的の分子は、組み合わせ化学の公知の方法を用いて、そのような反応性基礎の上に合成され得る。
E.所望の特徴を有するPRP集団の形成
図1に示すような、2つの別々のPRPについての発光スペクトルにおける相違は、多数の因子から生じ得る。一つの重大な因子は、サイズであり、粒子のサイズが大きいほど、より長い波長において共鳴ピークを有し、そしてまた増加した半波高幅値を伴うスペクトル形を有する。従って、生成されるPRPのサイズの制御は、いくつかのスペクトル特性にわたる制御となる。
従って、制御された量のエンハンサー添加により、4つの型のPRPについて図2に図示したような、狭い直径範囲を有する、従って相対して狭い共鳴ピーク周波数範囲を有するPRPの集団を生成し得る。いくつかの有利なPRP生成方法においては、粒子は、増強プロセスの間に適切な顕微鏡を使用して観察され得ることが理解され得る。これらの方法は、増強プロセスの間のPRPの伸展を観察するために必要とされる入射光により比較的影響されない、本明細書中において説明するような増強化学物質を使用する。従って、PRPの伸展は観察され得、そして所望の終点に達した時点で停止され得る。光感受性増強プロセスを使用することが所望され得る適用については、または顕微鏡外における伸展が所望される場合、時間計測による連続増強を行う。各適用後に試料をリンスし、そしてPRP光散乱の状態を決定する。所望な数の連続増強プロセスを継続し得る。
上記で示したように、本発明によるPRP組成物は、規定された波長のピーク波長40nmを有する、1以上のPRP集団を含む。PRP集団におけるそのような均質性は上記のようなPRP生成の暗視野観察と対にした、エンハンサーの段階的添加によって可能である。プラズモン共鳴ピークの幅は代表的には20〜40nmであるので、一般的にはPRP集団の共鳴ピークにおける分散をさらに減少させる必要はない。
あるいは、均一なスペクトル特性を有するPRPの集団はまた、非均質性集団を精製することにより調製され得る。PRP結合体および遊離PRPは、カラムクロマトグラフィー、遠心分離、電気泳動、および濾過を含む従来の生化学的方法により分離され得る。表面局在分子または実体を有するPRPは、同じサイズの遊離PRPの移動度と有意に異なる易動度を有し得るので、これらは、遊離のPRPが溶出するのと異なる速度でゲル濾過カラムから溶出する。PRPは荷電粒子であるので、これらは、電界内を移動する。従って、PRPは、電気泳動中に操作され得、そしてさらに観察され得る。
特定の所望の特性を有するPRPはまた、ゼータ電位に基づいて分離され得る。本使用に適切であるゼータ電位分離装置は市販である(Coulter Corp.、Florida)。PRPをその構造的特性に基づいて異なる速度でマトリックスを通過させるために、放射圧もまた適用され得る。結合PRPおよび遊離PRPを、例えば、アガロースまたはアクリルアミドゲルでの電気泳動に供する場合は、遊離PRPは結合PRPが移動するよりも迅速に移動する。同様に、PRP結合体は、フィルターにより優先的に保持され得る。あるいは、精製は、遠心分離によって実施され得る。従って、これらの方法を使用して、広い範囲のスペクトル特性を有するもともとのPRPの集団を、より狭い範囲のスペクトル特性を有するサブ集団に分離し得る。
PRPの個々の集団は、別々に調製し、そして所望の量におけるPRP特性(例えば色)の所望の組み合わせに従って後に混合され得、各々は、適用に応じて同一もしくは異なる生物学的高分子を用いて標識されるか、または標識されない。そのような組成物においては、PRPの異なる集団の共鳴ピークが、上記で規定したように、実質的にオーバーラップしないことが好ましい。いくつかの好ましい実施様態においては、PRPの1集団のピーク位置における分散は、ある規定された波長の約20nm以内であるように制御され、そして混合物内のPRPの別の集団のピーク位置の分散は第二の規定される波長の約20nm以内に制御される。かなりのオーバーラップを回避するために、2つのピーク波長が少なくとも30〜40nmは離れていること、およひ最も好ましくは50以上のナノメーター離れていることを確実にすることが好ましい。
上記の方法を適用することにより、新しいタイプの分子プローブを、選択されたPRPに選択された結合体を結合することにより生成し得る。前述のように、異なる選択的結合特性を有する2種の区別可能なPRP集団を生成するために、第一のスペクトル特性を有するPRP集団を第一の結合体に結合させ、そして第二のスペクトル特性を有するPRP集団を第二の異なる結合体と結合させ得る。このようなあらかじめ規定したPRPの混合物は、以下でさらに説明するような、量の少ない分子の検出精度の改善に特に有用である。
F.単離された非球形および複合PRP
PRPの発光スペクトルは、さらにその構造の細部により影響を受ける。楕円形PRPは、同定および弁別のためのさらなるパラメーターを与える。各楕円形PRPは、それぞれ、1本の等方軸が存在するかまたは3つの異なる主軸次元が存在するかに依存して、2または3のプラズモン共鳴ピークを有し得る。1本の等方性軸を有する楕円形PRPは、2つの直交偏光発光に対応するピークを示し、一方は楕円の主軸にそったプラズモン励起に付随し、他方は短軸にそったプラズモン励起に付随する。入射光の偏りが対応する主軸にそっている場合、別個のプラズモン共鳴ピークは最大強度で出現する。従って、固定楕円形PRPの偏光に対する反応は入射方向によって変化し得る。
楕円形銀粒子を作製するプロセスは、粘度により所望の扁平率を有する長楕円形粒子へのPRPの伸長がもたらされるような温度にて、球形PRPを含むガラスマトリックス上で引っ張ることから成る。そのような粒子を「押しつぶし」、その結果、扁平楕円粒子を形成する条件についてもまた説明されている。PolarcorTM(Corning Company、Corning、NY)というマトリックスを含む1つの楕円形PRPは、ガラスマトリックス中に整列された楕円形PRPから成る。この複合材料は、主として赤色以上の、特定の光学的周波数に対して効果的な偏光子である。そのようなガラスマトリックス内に含まれる個々の楕円形PRPは、PRPを妨害しないような様式でマトリックスを溶解することにより単離され得る。適切なマトリックス中で適切な扁平率およびサイズの楕円形金粒子を調製し、次いで粒子を妨害しない様式でマトリックスを溶解することにより、ほぼ等価であるプラズモン共鳴散乱特性を有する大量の楕円形PRPを、例えば、以下で詳細に記載する生化学的アッセイのための液体試薬調製での使用のために調製し得る。
他の方法は、楕円形PRPを調製するために使用され得る。楕円形PRPは、銀ハロゲン化物の光反応を介して、または適切なリソグラフ用モールドを用いて生成され得る。あるいは、最初は実質的に球形に形成されたPRPを、2つの表面の間で所望の扁平楕円外形または長楕円外形につぶすために、プレスまたはロールし得る。
非球形および非楕円形のPRPは、球形または楕円形粒子と異なる特徴的なスペクトルサインを有し、有利なサイズおよび散乱特性を有するプラズモン共鳴プローブの作製に有用であることが観察される。青色領域に強度に散乱するPRPは、球形銀粒子を生成することにより簡便に生成され得ることが見いだされている。上記で考察したように、粒子直径の増加により、共鳴ピークは赤色シフトする。しかし、球形粒子については、ピークが赤色にシフトするにつれ、散乱光のピーク強度が低下し始め、従って、強青色散乱体と比較して、強赤色散乱体の球状粒子による生成はずっと困難である。しかし、他の幾何学的形状の粒子は、より長波長において強い散乱を生じ得る。そのような3種類の粒子は、断面が三角形、四角形、およびほぼ六角形である。三角形、四角形、および六角形の銀粒子は、例えば、銀ハロゲン化物の光反応を介して、または適当なリソグラフモールドを用いて生成され得る。青色球状粒子と類似のサイズである、単離された六角形粒子は、代表的には緑色のプラズモン共鳴ピークを有する。50〜150nmの特徴的寸法を有し得る、単離された三角形粒子は、特に興味深い。なぜなら、これらは、しばしば、可視スペクトルの赤色部において共鳴ピークを示すからである。三角形PRPの生成は、赤色に現れるPRPを得る適切な方法の1つであることが見いだされている。赤色三角形粒子および青色球状粒子の具体的な例は、図7および8を参照して以下で考察する。小さな球形の金属粒子を、対または他の集合体に結合させることにより、様々のプラズモン共鳴粒子形状を形成することもまた可能である。
さらに、誘電性および導電性物質から成る同心円状シェルを有するPRPを調製し得る。PRPのこれらの実施様態においては、プラズモン共鳴のピークを所望の周波数に変換し得る。特に、コアまたは外部シェルは共鳴ピークを赤色シフトさせる傾向があり、そして比較的強い散乱体を生成するので、誘電性物質を添加にすることにより、PRPを作製し得る。この理由によって、赤色PRPはそのような誘電性シェルまたは核の封入を伴って、有利に生成し得る。誘電性コアおよびアルミニウムのシェルを有する粒子は、紫外線域の約240〜280nmにおいてプラズモン共鳴ピークを有することが見いだされている。
誘電性コア/金属シェル/外部誘電性シェルを含む3層から成る粒子は、ピーク共鳴および散乱強度の変化におけるさらなる柔軟性のために有用であり得る。さらに、複数の同心円状導電性シェルを有するPRPを作製し得る。各シェルは異なる直径を有するので、しばしばいくつかの別々のピークを含む複雑な散乱スペクトルが生成され得る。これらのピークは、導電性シェルを隔てる誘電性物質内で変動を伴ってシフトし得る。以下にさらに詳細に説明するように、ラテックス、テフロン、または他のポリマーコーティングを含む誘電性外部シェルはまた、PRPの外部への目的の高分子の結合に適切な基板として有用である。
導電性物質および誘電性物質の複数のシェルを有するPRPの生成はより複雑であり得るが、これらは、化学蒸着法またはスパッタリングを含む様々なフィルム沈着技術を使用して製造され得る。複数シェルPRPの実施様態を作製するための他の方法は、上記のBirnboimらによる米国特許第5,023,139号において記載される。
誘電性コアおよび外部金属シェルを有するPRPはまた、非電着性メッキ技術を用いて生成され得る。このプロセスにおいては、例えば、ラテックスから構成されるコア粒子は、その表面が、白金原子であり得る金属原子により活性化される。上記のような増強手順を使用することにより、これらの白金原子は、銀増強およびラテックスコア周囲のシェル形成のための核形成中心を含む。
ちょうど記載したPRP組成物における(i)〜(iv)の全ての限定を含み得るが、その必要はない、PRP組成物もまた、第III節に開示する一般的方法を含む、本明細書中で考察する様々な適用における使用のための新規なPRP組成物として、本明細書中で意図される。
2リガンド組成物。組成物は、PRPの2つの集団を含み、その各々は、PRP表面上に担持される異なるリガンド種を有する。2つのリガンドは、標的上の異なるリガンド結合部位と結合するように設計される。2つのPRP集団は、異なるスペクトル特性を有し得る。
蛍光レポーター組成物。組成物は、標的のリガンド結合部位に結合するための、表面付着リガンドを有するPRPを含む。組成物は、結合粒子のプラズモン共鳴スペクトル発光により励起される蛍光発光が、励起光を蛍光分子の部位に収束させるように作用するという点で、極めて高感度な「一部位」レポーターである。組成物はまた、これらがもし蛍光クエンチング分子または蛍光エネルギー転移分子を含むように設計されるならば、標的環境に対して高感度であり得る。
蛍光クエンチングまたはエネルギー転移。本組成物は、PRPの2集団を含み、各々は、標的の近傍の2つの部位に結合するための表面付着リガンド(同一であってもよく、または異なってもよい)を有する。各々の集団は、近傍に配置された場合に蛍光クエンチングを生じる表面局在化蛍光分子、または近傍に配置された場合の非照射エネルギー転移のためのドナーおよびアクセプターの蛍光分子を含む表面局在化蛍光分子を含む。組成物は、例えば、第一および第二の近傍リガンド結合部位を有する標的を検出するための均質アッセイにおいて有用である。
ラマン活性実体を有するPRP。組成物は、複数のPRP集団を含み、各々はPRP表面上に局在化された異なるラマン活性実体を有する。各々の集団は、さらなる表面局在化分子(例えば、異なる塩基配列を有するオリゴヌクレオチドまたは組み合わせライブラリー分子)を含み得、ここで、各表面局在化分子の正体は、公知の独特のラマンスペクトルサインを有するラマン活性実体(例えば、分子)に結びついている。組成物は、例えば、(i)標準的なビーズ合成法に従ってPRP上に形成される、および(ii)所望の化合物活性を有すると同定される、組み合わせライブラリーの化合物を同定するために使用される。
別の例として、組成物は、染色体地図作成のために使用され、ここで、既知の配列領域(例えば、ESTまたはSST)の相対的な空間的位置は、(i)独特なラマンスペクトルサインを有する各PRPに、染色体配列の1つと相補的なオリゴ配列フラグメントを付着させること、(ii)プローブを染色体DNAとハイブリダイズさせること、および(iii)各PRPの独特のスペクトルサインから、DNAに結合するPRPの相対的位置を同定することにより決定される。DNAを上記のように伸長条件に置くことにより、配列を隔てる地図作成距離もまた決定され得る。
図13は、Drosophila多糸染色体に対するDNA配列標識PREの結合を示し、染色体領域にPREを局在させる能力を例示する。
V.診断方法および組成物
本発明の診断方法は、目的の分子特徴を有する標的の存在またはその情報の決定における使用が意図される。本方法は、好ましくは、第III節に記載される方法および装置に従って、そして好ましくは、第IV節に記載されるPRP(ここで、PRPは、表面局在化リガンドを有する)を使用して、実施される。
本方法の実施において、表面局在化分子を有する1以上のPREと標的を接触させて、分子特徴と局在化分子との間の相互作用を生じさせる。この相互作用は、(A)PRE/標的複合体を生成するための、例えば、リガンド/リガンド結合相互作用を介する標的結合部位へのPREの結合、(B)PRE/PRE相互作用を実証するスペクトル特徴を生じるための、近接して間隔をあけられた標的部位への2つのPRPの結合、(C)連結されていないPREを生じるための、2つのPRE間の連結の切断、(D)検出可能な様式でPRE上のラマン活性分子のラマンスペクトルを変更するための、例えば、リガンド/リガンド結合相互作用を介する、標的へのPREの結合、(E)検出可能な様式でPRE上の蛍光分子の蛍光発光の強度を変更(例えば、クエンチングまたは増強)するための、例えば、リガンド/リガンド結合相互作用を介する、標的へのPREの結合、および(F)結合されたPREを生成するためのPRE間の連結の形成、を含み得る。
標的は、第III節に詳説されるように、1以上の選択されたプラズモン共鳴スペクトル発光特性の測定を可能にする様式で、光学的光源を使用して照射される。次いで、標的の存在または標的についての情報は、標的とのそのような相互作用の後に、1以上のPREのプラズモン共鳴スペクトル発光特性を検出することにより決定される。
本方法に使用されるPREは、好ましくは、抗原/抗体、ホルモン/レセプター、薬物/レセプター、エフェクター/レセプター、酵素/基質、脂質/脂質結合因子、および相補的な核酸鎖のような、リガンド/リガンド結合部位結合体対の1つである表面局在化分子を含むように、上記の通りに構築されたPRPである。検知されるスペクトル発光特性がラマンスペクトル特性または蛍光スペクトル特性のシフトまたは変化に関連する場合、PRPはまたそれぞれ、表面局在化蛍光活性分子または表面局在化ラマン活性分子の実体を含む。使用されるPRPは、第IV節に開示されるPRP組成物の品質および均質性の属性を有し得るか、またはさほど厳密ではない均質性の属性を有し得る。
PREプローブは極めて高感度である(上記のように、単一PREを観察およびスペクトル分析し得る)ので、本方法は、標的分析物の量に対して(最低1事象まで)極めて高感度になされ得る。これにより、HIV、腫瘍マーカーおよび細菌性病原体のより早期の検出を含む、体液中の病原体のより早期の検出、より少ない液体容量からの検出、ならびに多数の現行の診断テストを小規模化することが可能である。
A.標的結合部位へのPREの結合
この一般的実施様態においては、標的上のリガンド結合部位へのPRP結合リガンド結合を導く条件下で、表面リガンド分子を有するPREを、標的と接触させて、標的との1以上のPRE/標的複合体を形成させる。代表的には、測定されるスペクトル発光特性は、複合体の形成によっては不変である。すなわち、PRP/PRP近傍のスペクトル発光効果も、標的とのPRPの相互作用により引き起こされるスペクトル発光特性における変化も、いずれも観察されなかった。
代表的には、本実施様態においては、分析される標的は、固定化されるか、または固定化結合部位について競合する。固相へのPRP結合の後、標的を照射し、そして標的複合体のプラズモン共鳴スペクトル特性を検出する前に、固定化表面、固相を、結合していないPRPを除去するために洗浄する。標的と接触したPREは、2以上の集団を含み得、各々は異なるリガンドを有し、そして好ましくは、各々は、異なるリガンド(例えば、一方のリガンドについては青色粒子、そして他方については赤色粒子)に結びついた異なるスペクトルサインを有する。下記で詳述するように、本実施様態は以下の適用を有する:
(i)標的分析物の存在の検出、ここで、分析物は、固定化されているか、固定化された結合因子と競合するか、または接触混合物中の結合していないPRPから分離され得るかのいずれかである;
(ii)配列ハイブリダイゼーション部位においてPRPを単離するための、DNA標的とのPRP-オリゴヌクレオチド結合体のインサイチュハイブリダイゼーション;
(iii)標的の空間的特徴(例えば、染色体地図作成のための標的細胞もしくは組織上での、またはDNA標的内での特異的結合部位の配置)の地図作成;および
(iv)隔てられたDNAバンドの同定のための、DNA分画ゲルへプローブ標識PRPを直接結合する、例えば、サザンブロット法における、標的のインサイチュ標識。
以下の実施例は、結合部位の空間的特徴、および/または結合部位の密度の検出の目的のために、表面付着リガンド分子を有するPRPを固定化標的組織に結合させる様々なアッセイを例示する。
実施例4
ニワトリ筋肉内のリアノジンレセプターのPREによる標識
パラホルムアルデヒド内で固定した凍結ニワトリ肋間筋を2〜3μm切片に切断し、調製済みのカバーガラス(Pap penウエル内のCell Takコーティングスポット)に移した。組織切片を3回、各回5〜10分間、PBSで洗浄した。非特異的結合部位を、PBS中の3%正常ヤギ血清、1%ゼラチン、0.01% Triton X-100で20分間インキュベートすることによりブロックした。カバーガラスをブロッキング緩衝液(作業緩衝液)の1:3希釈液で5分間洗浄して、次いで作業緩衝液中のマウス抗リアノジンモノクローナル抗体(34C)の1:5希釈液中で1時間インキュベートした。次いで、カバーグラスを6回、各回3〜5分間、作業緩衝液で洗浄して、次いで、ヤギ抗マウスIgG(AuroProbe EM、Amersham)に結合体化させた5nmまたは10nmの金粒子の1:40希釈液と30分間インキュベートした。カバーガラスを各々3〜5分間、作業緩衝液で3回洗浄して、次いで3〜5分間、PBSで3回洗浄した。試料を2分間、二重蒸留水中で3回洗浄して、次いで50μlイニシエーター、50μlエンハンサー(IntenSE M Silver Enhancementキット、Amersham)および1mlの0.1mg/mlゼラチンを使用して、8分間銀増強した。試料を3〜5分間、二重蒸留水で3回洗浄して、ゲルバトール(Gelvatol)抗退色培地で被覆して、暗視野顕微鏡下で可視観測した。リアノジンレセプターを含む個々のPREは、筋肉のZ線に沿って規則的間隔で観測された。結果を図12に表示する。
実施例5
ニトロセルロース上のDNAへのPREの結合
ニトロセルロース膜の1cm×3cm片を切断し、DNA表面を同定するために、一端で頂部表面を鉛筆でマークした。ビオチン標識化DNA(100ng)を、マークしたニトロセルロース表面の一端にピペットで滴下した。非ビオチン標識化DNA(100ng)をコントロールとして他端に付与した。ニトロセルロースをDNAスポットを乾燥させるためにデシケーターに入れて、次いで紫外線で架橋結合させた。DNA表面を上にした、ニトロセルロースを小パラフイルム皿に入れて、少なくとも4時間、ブロッキング溶液(50mM リン酸ナトリウム、150mM NaCl、2%BSA、1% Tween-20)中、室温で、蒸発防止のために100%湿度チャンバー内でインキュベートした。ヤギ抗ビオチン免疫金結合体(Nanoprobes,Inc.、Stony Brook、NY;約1×10⁸コロイド)を添加して、室温で2時間インキュベーションを継続した。免疫金結合体を除去して、ブロッキング溶液(500μl)を添加し、ニトロセルロースを室温で1時間洗浄した。ブロッキング溶液を除去して、二重蒸留水でフィルターを十分にリンスした。二重蒸留水(2ml)を30分間洗浄したフィルターに添加した。水の除去後、1mlエンハンサー溶液(1ml 0.1mg/mlゼラチン、50μlイニシエーター、50μlエンハンサー;エンハンサーおよびイニシエーターはBBI International、英国、Ted Pella カタログ番号SEKL15により入手した)をニトロセルロース上に8分間置いた。次いで、エンハンサー溶液を蒸留水で十分に洗い流した。ニトロセルロースを、デシケーター中で、DNA側面を上にして濾紙上に置いて1時間乾燥させ、次いでスライドガラス上にDNA側面を上にして置いて、カバーガラスで被覆した。スライドをアセトン蒸気チャンバー内に20分間、またはニトロセルロースが透明になるまで置いた。PREを暗視野顕微鏡を使用して観察した。非ビオチン標識化DNAをスポットした位置を含む、ニトロセルロース上の他の箇所でのPREの低密度と比較して、PREの高密度が、ビオチン標識DNAをスポットした位置に観察された。同じ実験が又、ヤギ抗ビオチンに結合体化する完全形成PREを使用した時、ビオチン標識化DNAを首尾良く検出した。
実施例6
ポリスチレン細胞培養皿内におけるDNAへのPREの結合
48ウエル培養皿内の1列のウエルに二重蒸留水(150μl)および1M NaHCO3(17μl)を添加した。各皿にニュートラビジン(10μg)を添加して、その後一晩インキュベートした。全てのインキュベートは、4℃、100%相対湿度において実施した。ニュートラビジン(Neutravidin)を除去して、ウエルを二重蒸留水で十分にリンスした。150μlのブロッキング緩衝液(50mM リン酸ナトリウム、150mM NaCl、2%BSA、1% Tween−20)を各ウエルに添加して次いで4時間インキュベートした。第二ウエルから開始して、1μgのビオチン標識化DNAをブロッキング緩衝液に添加した。引き続くウエルには、ビオチン標識化DNAの10倍希釈を順次添加して(0.1μg、0.01μg、…)プレートを4時間インキュベートした。ビオチン標識化DNAを除去して、ウエルを二重蒸留水で十分にリンスした。ブロッキング緩衝液(上記の緩衝液、150μl)および約108ヤギ抗ビオチン結合体化免疫金コロイドを各ウエルに添加して4時間インキュベートした。次いで、免疫金コロイドを除去して、ウエルを二重蒸留水で十分にリンスし、7分間各ウエルに100μlエンハンサー溶液を加えてコロイドを増強した。エンハンサー溶液を除去して、ウエルを二重蒸留水で十分にリンスして、ウエルを塵を含まない圧縮空気で乾燥させた。暗視野顕微鏡を使用して、各ウエル内のPRE濃度を決定した。PRE濃度は、各ウエル中のDNA濃度と相関した。同じ実験がまた、ヤギ抗ビオチンに結合体化された完全形成PREを使用したとき、ビオチン標識化DNAを首尾良く検出した。
蛍光インサイチュハイブリダイゼーション(FISH)は、蛍光標識の代わりにPREを使用して実施され得る(PRISH)。本方法においては、PRE標識オリゴヌクレオチドを目的のDNA分子と共にインキュベートする。PRE結合オリゴヌクレオチド上に相補配列が存在するならば、結合PREが観察され得る。あるいは、各々が異なるオリゴヌクレオチドに付着された2つのPREを目的のDNA分子と共にインキュベートする。ある特定の障害と関連する遺伝子欠失が存在し、そしてPREが欠失領域のどちらかの側で結合すると、それらは、欠失対野生型においてよりずっと密接であり得る。本方法において、PREの結合対は、散乱パラメータの改変、または同一または異なるかのいずれかのスペクトル特性のPREの相関対の観察により検出され得る。PRISHは、より小さな欠損、または局在化の増加に起因する選択ゲノム領域の検出を可能とする。適切に結合体化されたPREを使用して、結合PREは、核酸鎖に沿っていくつかの位置において観察され得、これは、一度にいくつかの部位に関する情報を提供する。上記に詳説するように、距離測定もまたなされ得る。図7および8に図示するように、約640塩基対に相当するPRE間の230nmの距離は、光学顕微鏡を使用してほんの10ナノメーター以下の精度まで容易に分析し得る。さらに、PCR増強もまたPREハイブリダイゼーション試験と共に使用し得るが、通常増強を必要とするFISHとは対照的に、PCRまたはその他の増強工程の使用は不必要である。遺伝的欠失および変異はまた、PREカップリング核酸の2つの近接する鎖を接合させるリガーゼを使用して、検出され得る。もしPREカップリング鎖が、正確に近接してハイブリダイズすると、変性によって、1対のPREにカップリングされた核酸の遊離鎖が生じる。次いで、これらの結合対を上述のように観察し得る。もし鎖がより近接すぎたりまたはより離れすぎる部位においてハイブリダイズすると、リガーゼ反応は生じず、結合対は形成しない。PREが核酸のハイブリダイズ鎖にカップリングされる場合、PREの結合対はまた、PCR法により生成され得、そして標準PCR法を用いて、存在する標的核酸量を増幅する。
これらの手順の全てにおいて、PREは、オリゴヌクレオチドが標的核酸に結合する前後いずれかにオリゴヌクレオチドに結合体化され得る。さらには、このような試験はインビトロ、または細胞内において実施され得る。選択的PREハイブリダイゼーションはまた、異なった核酸配列のライブラリーを含む多重核酸含有試料ウエルをスクリーニングするために有利に適用される。そのような試料ウエルは、ライブラリーチップアレイまたは標準マルチウェル皿において提供され得る。
PREはまた、様々な高分子の酵素結合免疫吸着アッセイ(ELISA)検出に類似のアッセイにおける用途のために抗体でコートし得る。1つの有利な実施態様においては、マルチウェル皿(すなわち、96ウェルマイクロタイタープレート)を目的の分子に特異的な抗体でコートする。次いで、試験する生物学的液体を、固定化抗体を含むウエルに入れる。固定化抗体と異なる分子の領域を結合する、PRE標識二次抗体をウエルに添加する。次いで、プレートを暗視野光学的検出と互換性のプレートリーダーを使用して読みとる。PRE結合の存在およびレベルは、生物学的液体中の分子の存在および量を示す。
その他の実施態様において、特定の試料はまた、PREの多重集団(各々が異なったスペクトルサインを有する)を使用して可視化され得、標的分子上の異なった結合部位を識別するか、または異なる標的分子を認識する別々の抗体に結合体化され得る。あるいは、PREを、同一標的タンパク質上の複数のエピトープを認識するポリクローナル抗体とカップリングさせる。同一位置における2つのスペクトル的に異なるPREの存在はポジティブシグナルを示し、どちらかの粒子の別々な存在は、不完全な同定となり、拒否される。本アプローチは、臨床診断アッセイにおける誤まったポジティブシグナルを有意に減少させる。
PRE免疫アッセイのさらなる利点は、良好なシグナル対ノイズ比を有する1つのPREを検出する能力は、二次抗体または酵素およびその基質の使用によるシグナル増幅の必要性を排除するという事実を含む。これはさらに、非特異的バックグラウンドを排除する。さらには、光学顕微鏡による処理中に試料を分析する能力は、シグナル対ノイズをさらに至適化するように、インキュベーションおよび洗浄条件のリアルタイム修正を可能とする。PREアッセイは、直接法、サンドイッチ法、およびその他の広範囲に使用されている試験フォーマットにおいて、本質的にはどんな標的物質および様々な結合パートナーとも便利に使用され得、それらのいくつかを以下により詳細に説明する。PREと試験され、これに結合体化される物質は、タンパク質、核酸、リガンド、レセプター、抗原、糖類、レクチン、酵素などを含む。
実施例7
ヤギ抗ビオチンのPRPアッセイ
ポリスチレンマルチウエル皿のウエルをビオチン標識化BSAでコートした。通常BSAをウエル内の残存非特異的結合部位をブロックするために添加した。濃度0.06から600ピコグラム(pg)の範囲のヤギ抗ビオチン抗体の試料を個々のウエルに添加した。ヤギ抗ビオチン抗体を含まないコントロール試料もまたアッセイした。次いで、ウサギ抗ヤギ抗体に結合されたPRPを、各々のウエルに添加してインキュベートした。非結合PRPsをウエルから洗浄して、各ウエル内の結合PRPsを暗視野光学顕微鏡で観測した。視野の光源を上述の識別法に従って分析し、残りの散乱部位を各ウエル内で個別に計数した。本試験の結果を図9に示す。コントロール試料では、画像処理後1計数を残存しており、図9に黒帯(dark bar)として図示する。試験濃度範囲にわたる計数されたPRE数は、0.06pg分析物における4から600pg分析物における1000以上と変化した。
ほぼ均一なスペクトル特性を有するPREの1以上の集団を使用してこれらのアッセイを実施することが好都合であるために、そのようなほぼ均一集団の形成につながる条件下でまずPRE標識を形成することが好都合である。上述のように、結合部位への核形成中心の結合と、それに続く金属増強および光学的観測を説明したが、本技術は、このように作出された粒子のスペクトル特性よりも極めて小さな制御を提供する。しかもこれらの技術が実施されるにしても、バックグラウンドを識別したりまた高感度アッセイを作製するためにPRE散乱特性を使用する努力は未だなされておらず、提案すらされていない。従って、(結合前にPREを形成するより)第一に核形成中心で標的種を標識化して、次いでPRE形成のために金属増強することにより実施するPREアッセイは、PRE散乱体およびバックグラウンド間の光識別が実施される場合なお改善される。さらに、いかなる種類ものあらかじめ形成された光学的観測可能であるサブ波長光エミッタを使用するアッセイは、感度の高いアッセイを作出するために個別に粒子を計数する技術を利用していない。バックグラウンドのスペクトルおよび空間識別を実施する場合は、そのようなカウンティングはPRE標識に加えて、蛍光または発光ビーズ標識のために有用であり得る。以下に説明するように、蛍光は局所的プラズモン共鳴により増強され得、従ってPRE増強蛍光ビーズはそのようなアッセイに有用である付加的サブ波長光発光標識を提供する。
これらのアッセイのタイプの多数の変型がPRE標識を使用して実施し得ることもまた理解される。現在は蛍光分子標識を使用して実施する免疫吸着アッセイの様々な型の全てが、PREを使用して実施され得る。例えば、サンドイッチアッセイおよび競合アッセイが、PREを使用して実施され得る。第一の場合は、検出する標的物質に親和性を有する抗体のような実体をアッセイウエル底に固定化し得る。標的物質を含む試験試料をウエルに添加すると、標的物質は第一実体に結合する。次いで、標的物質の異なった部分に対する親和性を有する第二実体を、ウエルに添加し得る。ここで、それが標的種に結合する。最後に、第二実体に対する親和性を有する第三実体に結合されたPREをウエルに添加し、これは順に第二実体に結合する。リンス後、PREは、標的物質が先に結合した部位にのみ結合することが理解される。本試験は、上述の第一および第二実体が、アッセイする抗原上の異なったエピトープに対する親和性を有する抗体である場合、極めて有用である。PREと結合された第三実体は、標的物質の特異的結合パートナーというよりは、むしろ抗種抗体であり得る。
競合アッセイにおいては、第一実体をアッセイウエル内に固定化し得、PREカップリング第二実体および標的物質の両方をウエルに添加する。ここで、第二実体および標的物質は第一実体への結合について競合する。非結合PREを分離する時、ウエル内に残存するPRE数は、標的物質が結合部位を占有し得た度合いを示す。この型のアッセイにおいては、PRE結合第二実体は標的物質と同一であり得るか、または第一実体に対する親和性もまた有する異なった物質であり得る。
当業者は、感度の高いアッセイを生成するために、広範な種々の方法で広範な種々の分子複合体に結合するために、PRE標識が使用され得ることを認識している。さらなる例として、PRE標識上の結合体は、試験される分析物の特異的結合パートナーであり得る。それは固定化分析物/抗体複合体の特異的結合パートナーであり得る。その他では、PREが固定化抗体と結合し得るが、その固定化抗体が分析物分子とあらかじめ結合する時のみである。これらの様々な技術の各々は、試験される分析物の化学的性質に基づいて、所定のアッセイに本質的に適応し得る。
さらには、異なったスペクトルサインを有するPRE集団を使用して、複数分析物のためのアッセイを同時に実施し得ることが理解される。異なった色または異なった偏極反応を有するPRE集団を、異なった標的物質を認識するために結合体化され得る。いくつかの異なった分析物の未知濃度を含むマトリックス中に導入する時に、各々の異なったスペクトル特性と関連するPREを別々にカウンティングすることにより、本明細書中に発表する全てのアッセイを一度にいくつかの標的物質において実施し得た。
PREプローブはまた、インビトロにおけるコンビナトリアルライブラリーのスクリーニングに使用され得る。本技術のある従来の方法においては、薬物レセプターを発蛍光団で標識して、ビーズ、コンビナトリアルライブラリーを構成する収集物と混合して、スライドの上に塗布する。蛍光ビーズの存在は、レセプター結合およびビーズと結合された潜在薬物の存在を指摘する。本発明の1つの実施態様においては、蛍光レセプターを、アッセイの感度および光安定性を増加するPRE標識化レセプターと置換して、それにより、より小さなビーズ上における元来のコンビナトリアルライブラリーの生成を可能とし、またより大きな化学ライブラリーの合成およびスクリーン能力を可能とする。
ライブラリーは、マイクロチップ上においても合成され得、PREプローブの存在はレセプター結合を示す。最近における、薬物発見を改善するためのコンビナトリアルライブラリーの適用は、従って有力候補物質検出のための方法としてのPREプローブを使用することにより増強され得る。選択的に付着されたPREは、バイオ−チップ検出スキームの分解能および感度を増加する。
これらのアッセイの全てにおいて、PRE較正を、標的実体の検出のために使用されるのとは異なったスペクトル特性のPREを用いて、好都合に実施する。本質において、アッセイは、アッセイ機能のために使用するPREと共に検出および測定され得るPREのコントロール集団を生成するための選択スペクトル特性を有するPREをあらかじめ決定した量導入することにより較正される。ある特異的サンドイッチアッセイ較正例として、赤色PREを、試験する標的実体と結合体化され得、本PRE結合体化標的実体の既知量(勿論、飽和量よりはかなり低量であるが)を試料と共に、連続的または同時に、ウエルに添加する。非結合結合体化赤色PREをリンスして流した後、標的実体に対する抗体を添加する。非結合標的実体抗体をリンスした後、抗種抗体に結合体化する青色PRE(例えば)を添加すると、これは抗体を標的実体に結合する。リンス後、赤色および青色PRE両方を計数する。ここで赤色PRE計数は較正計数を提供する。このサンドイッチフォーマットに替わる方法においては、直接結合アッセイ較正もまた利用され得、ここで異なった固定化抗体を試料ウエルの底に用意し、較正PREを固定化抗体の一つに対する特異的結合パートナーに結合体化させる。
PREを使用するアッセイは、細胞においても実施され得る。結合体化PREは、細胞内の固定または遊離部位に結合され得、その位置は個々に観察され得る。細胞内への粒子の配置の周知技術があり、粒子に細胞膜を穿孔させる高圧バースト法、および加速過程のために高電圧放電を使用する電気穿孔法を含む(PREは代表的には電気穿孔技術に先だって荷電される)。これらの技術を実施する装置は、BioRad Laboratories of Hercules、CAにより市販されている。PREおよびPRE結合体はまた、エレクトポレーションを含む従来のトランスフェクション技術により細胞内に導入され得る。PREはまた、マイクロピペットで細胞膜を刺し通し、細胞内に1以上のPREを直接的に注入することにより直接的に細胞内に配置され得る。好ましい実施態様においては、生化学的損傷から保護するために周知の方法によって、PREをコート(すなわち、ラテックス)する。
生細胞内におけるPREアッセイのある有利な実施態様においては、別に結合体化されたPREの2つの集団を1以上の細胞内に挿入する。各別々の集団と会合した別々の結合体は、細胞内で製造される標的物質上の異なったエピトープと結合するように選択され得る。細胞内への注入後、標的物質の存在はPRE対合により指示され、これは上述の技術を使用して検出される。標的物質の性質により、各結合体と会合される同様な、または異なるスペクトル特性を有するPREを有することが望ましい。
暗視野顕微鏡による観測に適切である、PREアッセイとの使用のためのウエルを調製すると好都合である。暗視野顕微鏡に適切である基板を含むためのマルチウエルプレートのためには、ウエル底を、光散乱不完全の形成を防ぐために、均一、平滑、および清潔を特に強調して好都合に製造する。現在では標準96ウエル皿の生産において、このような注意は払われていない。さらに、ウエル下の外部表面もまた望ましくないバックグラウンドシグナルを導入し得る光散乱表面を提供するので、この外部表面もまた比較的清潔で平滑であるべきである。ある有利な実施態様においては、ウエル表面は、その光散乱不完全が約100未満であり、また約10未満ですらある。これらのアッセイにおいてシグナル対ノイズ比を増加するためのさらなる方法として、ウエル内の不完全位置が記録され得、その特定ウエルでアッセイを実施する時に、これらの位置からの散乱シグナルを無視し得る。
代表的には、これらのアッセイに使用する光学顕微鏡の視野は、ウエル底の全てまたは一部分を含む。従って、低レベルの分析物を検出する場合は、ウエル底よりはむしろウエル壁に付着する分析物が最小量であることを確保することが重要である。従って、生産中にウエル壁上にブロッキング剤を含むと好都合である。そのようなウエルを作製するためには、皿を倒置してBSAのようなブロッキング剤を含む溶液上に配置し得る。皿を溶液中に押し沈めるか、またはウエル内に捕捉された空気をピペットまたはキャピラリによる吸い出しによって除去すると、BSA溶液は、ウエル底に接触することなしにウエル壁に接触し得る。本工程後、所望の抗体または他の結合剤をウエル底に固定化し、次いでウエル底において残存する非特異的結合部位をブロックするためにさらなるブロッキング剤を添加し得る。
本発明に従うアッセイ方法はまた、例えば第III章に説明する本発明の方法および装置を使用することにより自動化され得る。自動化プレートリーダーは、現在、従来のアッセイ技術に使用されており、ロボットPREプレートリーダーの原理は、ある意味では同様である。現在市販のプレートリーダーと同様に、ロボット試料装填器具が付属していても、いなくてもよい。ロボットPREアッセイプレートリーダーは、好都合には、試料ウエルとウエル底の全てまたはその一部の観測のための顕微鏡を備える。ある実施態様においては、極めて小型の対物レンズ(その直径が約2mmであり得る)を、ウエル底部分を画像化している間に高開口度を獲得するために、ウエル内におよびウエル底の近くに低下させる。これらの実施態様においては、PREは、透明ウエル底の底部をはずして総内部反射を有する底部から照射され得る。対物レンズにより光線が集められると、上述の自動画像分析技術を使用して、光発光実体を検出し、そしてバックグラウンドから識別し得る。残存する識別粒子源の計数もまた、自動的に実施され得る。ある実施態様においては、顕微鏡の視野がアッセイウエル底の一部であり得、特定の先決計数が読みとられるまで、同一アッセイウエルのいくつかの領域における粒子を識別および計数するように、リーダーが設定され得る。この計数を達成した後のみ、リーダーは異なったアッセイウエルへと移動する。本技術は、大量シグナルが存在する時にウエルからウエルへと迅速に移動することにより時間を節約し、またウエル内に少数の結合PREが存在する時には適切な計数統計を獲得するために必要とする時間をかける。リーダーはまた、受容計数に依存して識別の付加レベルを実施するように設定され得る。例えば、予測される点拡散機能からの空間的偏差に基づく第一識別は、全視野において実施され得るが、低計数値が得られる場合には付加スペクトル偏差測定法を行い得る。識別の様々なレベルを実施するための全ての閾値がリーダーにプレプログラムされ得、低PRE計数を有するウエルを分析してシグナル対ノイズ比を最大化し、一方、シグナルレベルが既に高い多数計数を有するウエルにおいては時間を節約することを再度保証する。
本明細書中に説明するアッセイの実施のための成分を含む市販のキットが、成分の新規な組み合わせを有するように作出され得ることもまた理解される。好都合には、そのようなキットは、ほぼ等価であるスペクトル特性を有するPREの容器を含み得る。PREは、抗体または選択物質の特異的結合パートナーのその他のタイプのような選択生物分子と結合体化され得る。PREは、のちには結合体のカスタム形成のために反応基にカップリングされ得る。洗浄およびブロッキング溶液もまた提供され得る。PREの第二容器もまた、上述の較正または多重アッセイのために提供され得る。
B. 近接する標的部位への2つのPRPの結合
上述のように、PREにより発光された光のスペクトル特性は他のPREの隣接に依存する。発光周波数における観測ピークの変化、例えばピーク波長、スペクトルの半値幅、1ピークより多くの出現、および偏光に応じた変化などは全て、PREが互いに接近したり、遠ざかると観察され得る。これらの特徴は、その相互反応の度合いを測定することにより、PRE間の概算距離を決定するためにさえ使用され得る。
凝集反応および集塊依存性免疫アッセイは、従ってPREプローブを使用して実施され、また単一分子検出能力を有する。一つの実施態様においては、同一または異なるのいずれかのスペクトルサインを有するPREプローブに2つの抗体をそれぞれ付着させる。これらの抗体は、目的の同一生物分子と、しかし非競合部位において結合する。2結合部位間の距離は、その相互作用の結果による独特なスペクトルサインにより、2つのPREが別々のプラズモン共鳴周波数を有するか、または同一プラズモン共鳴周波数を有する場合、狭帯域照射を介して直接的に検出される近接位に、PREプローブを配置する。例えば、特定の血清成分に特異的である抗体でコートしたPREプローブを含む試験管に、血清を添加する。インキュベート後、試料をスライドガラス上に塗布して集塊(すなわち近接する)PREプローブの周波数を測定する。これを、目的の分子を血清が含む又は含まないコントロールスライドと比較する。本技術は、複数PRE標識への適用、および全細胞またはウイルスまたはその部分と同様に、ペプチド、核酸オリゴマーまたは遺伝子の結果としての検出を有する。
二実体間の結合定数の測定は、現在ではいくつかの手順を用いて実施される。肉眼的結合は、例えば、等温滴定熱量測定法で直接的に測定され得る。間接法は、吸収、蛍光、複合体形成と関連する円二色性における変化を含む。これらの方法に関連する一つの問題は、シグナルの検知可能な変化を観測するためには物質の高濃度を必要とし、この高濃度において試料は本質的に100%複合体化され得、従って、これらの条件下においては結合定数の測定を妨害する。好ましい実施態様においては、2つの実体をPREプローブで標識して、平衡を達成させ、遊離対結合比により結合定数の計算を行う。
2つのPREが隣接するときを検出する能力はまた、分子会合また解離のアッセイとして重要である。2つのPREが適切な結合体対と会合して一緒に混合されると、対、または限られるわけではないが、より高度な複合体を形成するように結合する。一つの例として、オリゴヌクレオチドに結合体化されたPREは、PREの異なった集団上のオリゴヌクレオチド配列が相補配列を含む場合、またはPRE結合体化オリゴヌクレオチド配列が、マトリックス内にまた存在する標的オリゴヌクレオチドの異なった領域と相補的である場合に、そのような対または複合体を形成する。
C. 2つのPRE間の連結の切断
この実施態様においては、1つのPREが、切断可能であるリンカー(例えば、ペプチド、オリゴヌクレオチド、オリゴサッカライド、または他の化学的または酵素的に切断可能なリンカー)を介して別のPREと連結する。連結組成物の目的は、単一の化学物質または酵素切断事象を、連結PREが個別の非連結PREとなることから生じる観察可能なスペクトル変化に基づいて、パートB実施態様に従って、検出することである。
より一般的には、PRPの連結対を区別して、例えばPRE間のペプチドリンカーの酵素による分解または変性により、結合が破壊される場合、これは対形成したまたは複合体PREのスペクトルにおける変化に反映される。酵素の操作は、この技術により、酵素の存在下での複合体形成または解離の比率の増加を観察することによりモニターし得る。これらの方法の一つの有利な適用は、細胞内におけるシグナル伝達カスケードの操作のモニタリングを含む。シグナル伝達カスケードの産物の存在が、あらかじめ結合したPREを解離するか、または解離PREを結合させるように、結合PREを選択する。従って、カスケードの開始は細胞内のPREの会合または解離を観察することにより生細胞内において光学顕微鏡により観察し得る。
各PREを、ペプチドまたはDNA分子のようなリンカーとの結合により結合対を高確率で生起する様式でコートし得る。本明細書中に論説するように、同一PRピーク周波数を有する2つのPREが互いに極めて近接した場合、周波数シフト、さらなる共鳴、および偏光効果が生ずる。溶液中に特定の酵素が存在するか否かを測定することを望む場合、その酵素による分解に対して感受性であるリンカーを使用する。例えば、セリンプロテアーゼは、その中にプロテアーゼ認識部位を含むペプチドリンカーを使用してアッセイし得る。タンパク質分解後、結合PREのスペクトルは、PREが分離するにつれて劇的に変化する。いくつかの場合には、PREは、それらが認識可能なほど相互作用せず、そして連結した場合および連結していない場合の両方で、本質的に独立した散乱スペクトルを保持するように、連結した場合十分な距離をとって空間的に分離され得る。この場合、対形成および解離はなお、PRE位置をCCD検知器で評価することにより観察および測定し得、そして連結されていることを示す相対的運動を有するPRE対を観察する。
VI.PREのさらなる組成物および適用
A.局部誘電環境のモニタリング
空気中におけるPREが空気の誘電率と異なる誘電率を有する媒体で包囲されている場合、散乱パラメーターは、空気中にある粒子の散乱パラメーター特性に比例して変化し得る。この効果は、誘電性媒体が除去される場合可逆的である。そのようなパラメーターは、例えば、共鳴ピークの波長の強度またはシフトの変化、偏光に対するPRE応答の変化、および共鳴ピーク数の変化を含む。共鳴ピークおよび強度のシフトは、PREを包囲する異なる屈折指数を有する液体の添加後に観察され、そして適切な洗浄工程による除去後、PREはその以前の特性を示す。プラズモン共鳴を示す多くの物質については、周囲の媒体の屈折指数が増加すると共鳴ピークが長波長側に赤色シフトする。
目的の特定の物質または試験される試料中のその他の摂動の存在は、従って、PREと相互作用する基板に対するPREのスペクトル応答を記録することにより検出し得る。例えば、PREが基板と結合した適切な試料を調製し得る。選択分子をPRE表面に結合し得る。各々のそのようなPREの光学散乱パラメーター(強度、偏光依存性、角度依存性、波長依存性、等)を記録する。次いで、試料を、初回処理および/またはそれに引き続くさらなる処理後にPRE散乱パラメーターが変化して、このことがさらなる物質の局所吸収または、さらなる物質もしくは開始物質の脱離、または局所誘電性環境におけるその他の変化を確認することによるような様式で、選択的にPRE表面に結合する目的の分子を含む物質で処理する。開始PRE試料を試験「ライブラリー」として調製し得るか、またはタンパク質、抗体等の「適用」ライブラリーをスクリーニングするために使用し得ることが理解され得る。
(D) 蛍光スペクトルのシフト
これらのピークシフトおよび強度の変化もまた、PRE局所誘電性環境における変化に起因する会合および解離のような分子摂動の検出のために使用し得る。
被験体マトリックス特性に関する情報をまた、PREの相対的位置におけるスペクトル依存性および平滑Si表面のような近接基板を観察することにより獲得し得る。例えば、所定の試料内のPRE局在およびスペクトルサインの記録を作成したら、酵素を添加するかまたは結合を光分解するし、基板からのPREの運動を生起して、それによりPREの空間的および/またはスペクトルサインを変化し得る。実際、そのようなPRE対が互いに結合し、そして他方が表面に結合している間に一方が移動した場合には、得られるスペクトルサインはこの事象を明確に示す。基板上のコーティングもまた、PREを使用する検出および分析システムの作成におけるさらなる柔軟性を提供するために使用し得る。例えば、コーティングは、望ましいポリペプチドまたはポリヌクレオチドを結合する基板に対して適用し得るか、または遮断コーティングを適用して、PRE結合体の非特異性結合をブロックし得る。1つの適切なコーティングは、例えば、抗反射特性を生成する誘電性物質の1つ以上の層を含む。コーティングはまた、観察光学システムに入射する光のPREによる増強される放射を生成する誘電性物質の1つ以上の層を含み得る。コーティングはまた、PREを塩基性基板表面から離れた距離に変位するために選択し得る。PREにより散乱される光の所定の偏光は、反射表面からの距離に応じて阻害または増強される。例えば、シリコン上にSiO2から成る適切なスペーサー層を配置すると、予測通りに中心にピークを有する良好な点源イメージが観察される。SiO2層を調整するかまたは別の誘電性物質を使用すると、条件が基板(界面)および誘電性層の上面からの反射光の重畳に起因するPREの破壊的および構築的干渉が存在するPRE共鳴波長、ならびに誘電的厚さ(thickness)、および物質に関して見出され得る。シリコンまたは導電性表面を使用することにより、PREが表面との接触から離れたりまたは誘電性層が介在する場合とは顕著に異なるスペクトルサインが得られる。
B.運動のモニタリング
三次元PRE運動は、2つの観察レンズを互いに直角になるように使用して、各々がそれぞれの光軸に対して垂直な平面において2軸運動(two axis motion)を起こすことによりに、直接的に可視化し得る。これは、特に、対物レンズ視野の深度よりも小さな運動に適している。観察する運動が対物レンズの焦点深度よりも大きな成分を有する場合は、三次元運動のためには1つのレンズのみを使用して、それにより影像面上にPRE強度の焦点を合わせるフィードバックシグナルを介して「深度」方向を測定する。他の二次元は通常方法により測定される。基板表面からのPRE距離はまた、位置の変化に伴うPREによる散乱光の強度を測定することにより、TIRイルミネーションシステムにおいてモニターし得る。励起電場が反射界面からの距離と指数関数的に降下するために、PRE強度は、基板表面から離れて移動すると減少する。
PREプローブは極めて明るくそして非常に小さいので、速度および相対的運動のリアルタイム測定に使用し得る。例えば、PREは、モータータンパク質(すなわち、キネシン)、細胞分裂、小細胞輸送等を含む動的細胞プロセスのモニタリングに使用し得る。PREプローブは光退色しないので、特に広範囲の時間スケールにわたるインビボでの時間的な実験のために有用である。PREまたは前駆体金核形成中心は、細胞膜に取り込まれる脂質に付着する。特異的PRE結合体を、細胞膜と結合する細胞表面レセプター上のその対に結合するように設計する。この方法は、例えば、イオンチャンネル開口のモニタリングを可能にする。PREはまた、筋肉細胞内のアクチンおよびミオシンの運動をモニターするために使用し得る。結合体に結合する、または結合体でコートされるPREは細胞内に導入され得る。次いで、結合体は、サイトゾル、核または様々なオルガネラ膜内のその結合パートナーを結合する。例えば、特定の薬物による、細胞レセプターの活性化は、細胞構造内の形態学的変化を導き得る。従って、細胞内または細胞上にあるPREは、薬物発見またはレセプター活性化のための光学アッセイシステムとして使用し得る。一旦結合すると、PREは局在してその運動を観察し得る。PREはまた、巨視的運動のアッセイにも使用し得る。例えば、血液細胞を標識して、循環において観察し得る。あるいは、血液またはその他の液体の流れは、PREの対応する運動を誘導し得る。PREはまた、Biolistic装置(BioRad Inc.、Richmond、CA)または電気穿孔法により細胞内に導入し得る。
PREで目的の実体を標識することにより、適切なリアルタイムデータの取得および分析システムを統合することにより、本明細書中に記載される検出プロセスを使用して、この実体の運動をモニターし得る。そのようなシステムは運動を三次元的に測定することが可能であり、運動が平面に限定される場合は、二次元的に測定し得る。目的の特異的システムにおける運動についての正確な情報入手が可能なだけでなく、薬物処理、あるいは温度、pH、照射、電場もしくは磁場の強度、または目的の任意の化合物の濃度における変化のような物理的および化学的環境におけるその他の変化の後の分子運動における変化もまた観察可能である。
PREはまた、より巨視的な対象物の物理的運動のモニターするためにも使用し得る。例えば、昆虫の触角上に配置した単一PREはその正常な運動または外的分子に対する反応における運動を感知するために使用し得る。これは特に、嗅いおよびフェロモンに対する分子応答の検出に有用である。PREはまた、顕微鏡的または顕微鏡下限的スケールの機械的運動の分析を可能とするための理想的ツールである。PREをいわゆる「ナノベアリングス」の成分またはその他のミクロンサイズの機械部品と結合させることにより、三次元的運動を可視化し、そしてナノメータースケールで分析し得る。電子顕微鏡のためのさらなる出費に加えて、電子顕微鏡は走査装置であるために、電子顕微鏡を介して運動をとらえることは困難であり、そして視野は、従って、光学顕微鏡で可能であるようにリアルタイムで観察するよりはむしろ連続的スキャンにより生起される。さらには、電子顕微鏡では、真空化した測定領域に加えて、大規模な試料調製を必要とする。これらの要素はリアルタイム運動分析に対して、電子顕微鏡の適用の可能性を大幅に制限する。
C. 近距離場(near-field)効果
前記に論説されるPREの適用は、PREによって散乱された光の遠距離場(far-field)観察に焦点を合わせていた。しかし、PREはまた、強力な、非照射性短域電場を生成するので、近接分子の物理的、化学的および分光特性を有用な方法で影響を及ぼすために使用し得る。表面増強ラマン散乱(Surface Enhanced Raman Scattering)の分光技術は、増強PREの中間近傍におけるその物質のみの特異的増強を含むように拡張し得る。例えば、PREを既知ラマンサインを有する標的に結合するために結合し得る。首尾よい結合は、標的の表面増強ラマンスペクトルを観察することにより検出し得る。また局部的に増強された励起および近接蛍光団の改変された発光のために有用であり得る。驚くべきことには、PREの表面が蛍光団から約1〜5nmの距離に配置されると、PREは、高量子効率蛍光団からさえも増強された発光を生成し得る。対照的に、金属の存在が高量子効率蛍光団の蛍光発光を消光すると一般的に考えられている。この事実は、結合しない場合と比較して、より高度の輝度または変化した寿命を有する蛍光標識を作製するために使用し得る。プラズモン共鳴導電性核(例えば、40〜100nm直径を有する銀粒子)および、例えば、ラテックスから作製される、非導電性シェルを含む標識を作製し得、ここで、このシェル上またはその内部に蛍光またはラマン活性分子を埋蔵する。おそらく、プラズモン共鳴のピークは、蛍光団またはラマン活性分子の効率励起帯と顕著なオーバーラップを有する。その標識が照射を受けると、核のプラズモン共鳴励起が、観察される蛍光を大きく増強する。上記の議論によれば、蛍光増強を生起するためには、非導電性シェルの厚さは好ましくは約5nmに等しいかまたはそれ以下である。従って、選択された波長で共鳴するために選択された、プラズモン共鳴核は、現在市販蛍光ラテックス粒子に対して標識性能を劇的に改善する。
楕円形PRE応答はまた、蛍光分光法と共用して好都合に使用し得る。楕円形粒子は、2または3の異なった周波数において共鳴励起を同時に起こすので、1つのそのようなプラズモン共鳴による選択された蛍光団の局在的励起に特に効果的であり、そして他のプラズモン共鳴に対応する波長での励起蛍光団の放射(すなわち、発光)に影響するために同時に効果的である。
従って標的化PREは、極めて局在化した分光効果を誘導し得、再び顕微鏡下限システムについての情報収集を改善する。蛍光共鳴エネルギー移動(FRET)の場合と同様に、PREのクラスターは、局在化したおよび光子バンド空隙(Photonic Band Gap)モードを含む新たな光学的特性を生じ、これは分子結合事象の高度に反応性のPREに基づく検出器の作製を便宜にするために使用し得る。
D. 計測学および計器化
励起PREは局在熱を発生し、そして個々のPREはポリカーボネート基板への書き込みのために使用し得る。個々の高度に局在化した光源である、PREは、精密リトグラフィ、光化学、または光活性化化学反応の誘起のために有用であり得る。
PREはまた、電子、原子力、および走査型トンネル顕微鏡を含む、極めて高解像度顕微鏡の全てのその他の非光学型と共にマーカーとして使用し得る。これらの適用においては、DNAのセグメントのような、目的の高分子を1つ以上の光学的観察可能なPREで標識する。好ましくは、高解像度顕微鏡がまた、非光学顕微鏡により影像される表面の部分を光学的に観察するための暗視野光学顕微鏡装置を備える。分子に結合したPREは、光学的に観察可能であり、そして原子力または走査型トンネルプローブチップのような高解像度度顕微鏡の関連部分を、観察される分子上の目的の部位に直ちに配置し得る。これは、影像される対象物を局在化させるために通常使用される余計な走査時間を節約して高解像度顕微鏡の使用の効率を増加し得る。原子力、走査型トンネル、または他の任意の型の走査型高解像度顕微鏡は、PREの本特徴を利用するために暗視野顕微鏡システムを組み込むために有利に構築され得る。
高精度アライメントまたはレジストレーションを必要とする産業的適用はまた、PREの使用の恩恵を受け得る。1つのそのような適用は、半導体製造工程であり、リトグラフマスクが処理されるセミコンダクターウエハと正確に整列されなければならない。PREを数ナノメーターまたはそれ以下の精度でさえ局在され得るので、セミコンダクターウェーハ上の1つ以上のPREの位置の、リトグラフマスク上の1つ以上のPREとの位置の比較は、ナノメーターレベルにおいてウエハに対するマスクの局在を決定し得る。相対的配置のみが重要であるので、マスクおよびウエハ上のランダムまたは制御されたPREパターンのいずれかを使用し得る。
本発明の他の適用は、PREが、本質的には、発光波長よりも大幅に小さい直径を有する光学的周波数光の点源であるという事実を利用する。従って、その構造の画像ではなく観察される計器の点散布機能パターン特性のみを生成する。この点拡散機能を、それを作成するために使用される光学システムにおける不完全を検出するために分析し得る。1つの例として、円形干渉縞強度における角度変化は、視野システムにおける円周非対称を有するレンズを示す。2つ以上の発光波長におけるエアリーパターンの中心の局在はまた、色収差のためのレンズシステムを評価する。
PREの点源性質はまた、光学システムのその解像度を試験するために使用され得る。個々のPREの特定位置での配置について上記に説明する技術を使用して、PRE対のセットの較正を、PRE間の距離を変化させることにより作製し得る。次いで、それぞれの点拡散機能の中心ピークが重複して、単一の非識別ピークを生成する前に、2つのPREがどのように接近されるべきかを決定し得る。ある程度は、対象のレンズシステムを有する焦点面における単一PREのピークの幅を測定することにより実施し得る。
PREをまた、集束光光線の強度分布をプロフィールするために使用し得、それによりそのような光線を生成するために使用するレンズおよび他の光学システムの特性に関与する情報を収集し得る。図10AおよびBに図示されるように、集束レンズ100は、レンズの焦点面に狭光線を集中させる光線102を発生する。当該分野に既知であるように、光線は焦点面において点に集中されないが、その強度は、集束光線の中心からの距離の関数としてはぼガウス強度を有する。焦点面における位置の関数としての強度の詳細は、集束光線を生成する光学システムの特性に依存する。
図10Aを参照して、薄い透明プレート104を焦点面における光線102に配置し得る。この透明プレート104は、その上にマウントされるPREを含む。好ましくは、勿論、PREのプラズモン共鳴反応のピークを、入射光光線102の優勢周波数帯にほぼ一致するように選択する。PREによる散乱光強度が照射強度に依存することが認識される。従って、プレート104または光線102が、焦点面内の異なった位置にPREを移動させるように移動する場合、位置の関数としての強度は、観測顕微鏡の適切に配置した対物レンズで散乱光を収集することにより決定し得る。上記の他の暗視野技術を使用して、PREによる発光を収集するが、プレート104を通過して伝達されるまたはプレート104によってスペクトル反射される光は収集しないように、観測顕微鏡の対物レンズを配置し得る。本システムは固体液浸レンズ、レーザー、および他の光学システムの特性を試験するために使用し得る。
E. 対象同定法
本発明のさらに他の適用は、紙幣もしくはクレジットカード、または身分証明バッジのような偽造の対象となる紙またはプラスチック項目の標識および同定である。PREのランダムまたは予め定義されたパターンのいずれかを項目の表面に結合し得る。有利な実施様態においては、PREを保護層またはフィルムでコートする。上記のように顕微鏡技術を用いて項目上の適切なPREパターンの後の観察は、鑑定目的に使用し得る。そのような認証を、店頭末端、施設入り口位置などにおいて、リアルタイム鑑定を可能にするコンピューターによるパターン認識システムを介してし得る。あるいは、PRE配列に加えて、磁気性ストリップ、バーコード、または他のデータ保存媒体を、項目上に(例えばクレジットカード)配置し得る。PRE配列のコードバージョンはまたこの媒体に保存されて、一致は項目が正当に作製されたことを示す。勿論、配列自身から容易に推測し得ないPRE配列に基づく一致磁性コードを生成する暗号アルゴリズムが使用されるべきであり、そしてそのようなアルゴリズムは暗号分野においては周知である。
G. 法医学
PREの強靭性および容易な可視性はまた、ある種の法医学的適用にとって理想的にする。指紋に存在する、身体油、体液、DNAなどはPREと結合し得、適切な照明下で指紋を容易に可視化する。多数の異なった物もまた、痕跡追跡可能性(traceability)を提供するためにPREで標識し得る。異なった散乱特性を有するPREを、爆発物、食物、薬物、毒物またはその他の毒素等と混合し得る。特定のPREは供給源同定を提供し得た。PREはその分解に対する抵抗性および試料中の単一の個々のPREでさえ検出する能力のために本適用に理想的である。
H. ラマンスペクトルPREによる組み合わせライブラリー内の小分子の同定法
PREはまた、1つ以上の結合体分子に加えて提供され得る表面に付着する分子の特性により識別し得る。個々のPREに隣接するラマン活性分子からのラマン散乱により増強された表面が報告されている。(NieおよびEmory、Science第275巻、1102ー1106、1997)。異なるラマンスペクトルを有する分子がPREの異なる集団に付着すると、異なる集団からのPREを、その異なるラマン散乱サインにより同定し得る。広範な種々の入手可能であるラマン分子があり、組み合わせライブラリー技術と組み合わせて特に有用であり得る多数の識別プローブが可能である。ラマンマーカーはまた、各々の塩基に1つずつ、4個の識別可能マーカーを使用するDNA配列決定技術において有用である、4個の識別可能PRE集団を生成するための別の方法(4個の異なるプラズモン共鳴波長に加えて)としして使用され得る。蛍光分子もまた、PREに結合して、そのスペクトル特性よりはむしろ優先的ハイブリダイゼーション特性によって区別される、オリゴヌクレオチドであり得るような付加マーカーを提供する。所望であれば、導電性共鳴核およびラテックスのような非導電性誘電性シェルを有するPREは、その誘電性シェル内に埋蔵される蛍光分子を含み得る。この標識実施様態を以下に詳細に説明する。異なる共鳴散乱特性、異なる蛍光マーカー、および異なるラマンマーカーの組み合わせを、数百または数千のスペクトル識別可能プローブさえ調製するために使用し得ることもまた認識される。例えば、ライブラリーは4個の異なるプラズモン共鳴サイン、4個の異なる蛍光サイン、および10個の異なるラマンサインを含み得、それにより、入手可能なスペクトルサインの異なる組合わせにより160個の異なる区別可能なプローブを作製し得る。従って、PRE集団は、サイズまたは形状の差異に基づいて、またはそれに結合する物質の差異により区別し得る。
さらには、組み合わせ化学の公知技術を、同時の一連の分子組立て工程のにおいて、PRE上にマーカー分子と抱合体分子を同時に合成するために使用し得る。ある実施様態においては、本プロセスは、結合する1つ以上の反応基を有するPREを含み、組み合わせ化学合成を開始する塩基を形成し得る、標識前駆実体により開始する。反応基は、例えば、リン酸塩、アルデヒド、カルボキシル、アルコール、アミド、硫化物、アミノ酸、または核酸塩基を含み得る。例えば、選択されたラマン活性分子を、オリゴヌクレオチド抱合体と同時に合成し得た。あるいは、薬物候補化合物のライブラリーをオリゴヌクレオチドマーカーの同定と同時に合成し得る。
I. 細胞分類
PREプローブはまた、細胞分類法に適切であり、蛍光活性化細胞分類(FACS)に類似である。混合細胞集団を特定のPREプローブを使用することにより、特定の表面抗原を発現する1つの細胞型について分析する。さらに、作製可能な個別のスペクトルサインを有する独特に同定可能であるPREプローブの数のために、複数のPREプローブを同時に使用していくつかの細胞型が単離される。本明細書中に記載のPRE検出法および局在法の全てが、他の項目の中でも、細胞ソーターを生成するのために完全に自動化され得ることを意図する。PRE細胞ソーターを使用して、目的の細胞集団を実質的には1つずつ暗視野顕微鏡の場内に通過させることは利点である。上記に詳説する検出、識別、分析技術は、PRE標識化細胞の同定のために細胞分類状況において使用し得る。
多数の異なる細胞経路指定スキームをそのような装置において使用し得る。1つの有利な実施様態においては、細胞を水のような液体の流れの中に沈着させて、第1液体中で実質的に混合しない、油のような第2液体の包囲シェルの制限内で強制的に動かす。この力は、顕微鏡の視野の場を通過するので、暗視野のための小領域に細胞を閉じこめたままにする。2つの液体の屈折指数は、それらの間の界面における入射光の反射を最小化するために、ほぼ等価であることが好ましい。
さらに、PRE標識を、細胞分類技術においては蛍光標識の代りではなく、むしろ蛍当標識に加えて使用し得る。この場合、蛍光標識およびPRE標識を、同一標的細胞に結合するために作製する。細胞分類を、蛍光マーカーの観察に基づいて実施し得る。分類された細胞の一部分が分類プロセスの結果の記録として保存される場合は、将来において首尾よい分類結果を証明するためにPREを使用し得る。このことは、保存試料の蛍光を観測するよりも、PREの安定性および非光退色特性のためにより効果的である。
同技術のさらなる適用は、インビボまたはエクスビボにおいて実施される。本技術においては、細胞を透過化して、そして目的の細胞内生物分子に対する抗体に付着するPREプローブを透過化細胞内に導入する。次いで、細胞を、組合わせ化学ライブラリーとともにインキュベートする。生存細胞をスライド上に塗布して、そして化学ライブラリーにより”影響された”細胞を選択する。”影響された”とは、付着した生物分子の局在の変化に起因するPREプローブの局在または分布における変化を示し得るか、または、新スペクトルサインを導くPREプローブのクラスターを示し得る。目的の任意の実体(すなわち、細胞、DNA、オルガネラ)は、PREで標識可能であるので、次いで、PREの収集物がユニットとして動くことが観測され得るために、光学的に検出し得る。
J. PREの臨床適用
PREはまた、広範囲の臨床適用において使用し得る。1つの重要な分野は、動物(ヒトを含む)における異なる条件の診断であり、これは動物内の特定器官に対する抱合体の選択的結合により同定し得る。本技術において、選択散乱特性を有するPREを動物によって血流内に注射するかまたは摂取させ得る。これらのPREをさらに、動物内にある特定物質の存在を標的または同定するために抗体または他の抱合体と結合し得る。次いで、組織を、動物から剥離して顕微鏡下でPREの存在について試験し得る。所望であれば、特異的結合抱合体に結合しないコントロールPREもまた、非特異的結合バックグラウンドを測定するために注射または摂取させ得る。これらの技術は、着色ラテックス粒子をプローブとして開発され、そしてラテックス粒子でこれらの試験を実施するための試薬は、例えば、Triton Technologies of San Diego、CAおよびMolecular Probes of Eugene、ORから市販されている。PREの使用は、その明るさ、生体適合性、および分解に対する抵抗性に起因して、そのような試験の感受性を改善する。
細胞改変および遺伝子治療のような治療技術もまたPREにより増強し得る。この場合は、望ましい遺伝的特性を有する細胞をPREで標識して、上記の技術を使用して細胞ソーターで選択する。次いで、選択された細胞を患者におく。所望であれば、PREを患者に配置する前に解離させて除去し得る。
選択的加熱および薬物送達もまたPREにより可能である。PREを患者の選択された組織または領域に局在させると、身体の隣接領域を有意に影響することなく、その組織または領域を局部的に加熱するために照射し得る。光活性化薬物の投与および活性化はまたPREにより増強される。光活性化薬物は、電場が増強されているPREに結合することにより極めて少量の総光エネエルギーにより活性化され得る。乳ガンを処置するための光活性化薬物の使用は、近来注目を集めており、そして組織内のより深い位置におけるその活性化を増強するためにPREに薬物を結合させることにより改善され得る。
生化学システムに対する光学的PRE検出および分析の適用は、現在の標識技術を越える多大の恩恵を提供すると考えられ、そしてPRE分析法が大きなインパクトを有し得る領域を含むようである。しかし、その他の領域もまた、本発明によるPRE検出およびスペクトル分析の恩恵を受け得る。
前述から、本発明の種々の対象物および特徴がいかに見合っているかを評価する。本発明の方法および装置は、これまで困難または不可能であった様々な標的を審問する課題に理想的に適合しており、その代表的実例として以下を含む:
1. 単一分子事象の検出;
2. 天然水和状態における生物標的内の準波長距離関係の解明;
3. 染色体マッピング目的のための染色体内の選択された配列の直接マッピングのような、生物学的標的における選択された標的部位の直接空間的マッピング;および
4. マイクロコードされた情報の光学的読みとり;
本方法および装置はさらに、改善された感受性、空間および距離情報、試料調製の簡易さ、および審問され得る標的試料のタイプにおける柔軟性を達成するために、広範囲の診断的適用に適用し得る。
本発明は、特定の方法、組成物、およびデバイスに関して記載されているが、本発明から逸脱することなく種々の変更または修正を加え得ることが認識される。 Field of Invention
The present invention relates to a plasmon resonance entity (PRE) or plasmon resonance particle, a method for interrogating a field containing a PRE, an apparatus for performing this method, and various applications of the PRE.
Background of the Invention
There are many important commercial and scientific applications that interrogate targets for information about the target. For example, the purpose of analyte diagnostic tests and methods is to detect the presence and / or amount of an analyte (target). The target analyte can be detected by reacting the analyte with a detectable reporter that (i) can specifically bind to the analyte and (ii) is detectable using a suitable detection tool. The reporter can be, for example, a colored or fluorescent molecule, or a colloidal metal, or a reporter (eg, a radiolabel that requires special film or scintillation equipment for its detection).
In some diagnostic applications, it is desirable to detect proximity relationships in the target analyte, as evidenced by the interaction between two probes located proximally on the target analyte. This forms the basis of so-called homogeneous assays, where the presence of the analyte is observed when two different probes are collected at closely located sites on the analyte Determined by the proximal effect. As an example, when two fluorescent molecules are collected, they may exhibit detectable fluorescence quenching or non-radiative energy conduction effects, which act to shift the Stokes radius between the excitation and emission peaks. .
Chemical, biochemical, or biological targets are interrogated to determine the chemical structure, the presence of a particular chemical group, or the environment of a chemical group by a variety of chemical and spectrophotometric methods. obtain. Of note among these methods are magnetic resonance methods to determine chemical structure and chemical group environment, spectroscopic methods to detect specific chemical groups (eg, UV, IR, Raman, ORD, and CD spectroscopy), as well as mass spectrometry to determine structure by fragment molecular weight analysis.
Surface chemical analysis of the target sample can be performed by bombarding the surface with high energy particles (eg, electrons) and detecting the energy of the atoms emitted from the surface. X-ray electron spectroscopy (ESCA) is an example of such an approach.
Often, it is desirable to establish a spatial and / or distance relationship at the target, and generally a microscopic interview is required. Optical microscopes have the advantage of simplicity, ease of sample preparation, and the property that samples can be tested in “wet” conditions. The disadvantage is a relatively low resolution capability, directly proportional to the wavelength of the illumination source (range 400-650 nm), and inversely proportional to the numerical aperture of the lens system (at best about 1.4), to several hundred nm Limit resolution.
High energy beam microscopes (eg, transmission electron microscope (TEM) and scanning electron microscope (SEM)) can achieve reduced resolution in the low nm range, but require a high vacuum environment of the target sample, Limit applications using dynamic samples. Atomic force microscopy (AFM) is useful for interrogating the surface characteristics of a target sample, also with resolution in the low nm range. This method is limited to surface effects.
X-ray and scintigraphic methods for detecting and / or localizing sites of high energy emission are also widely used. These methods tend to be very sensitive and can detect very few high energy luminescence events, but have the disadvantage of relatively high cost and poor resolution when target spatial information is desired.
Despite the variety of methods currently available, there are many targeted hearing issues for commercial and scientific purposes that are difficult or impossible with current methods. Among these are:
1. Detecting a single (or just a few) molecular events (eg, the presence of one or several binding sites or one or several enzymatic sites in a target). This ability develops new diagnostic applications (eg, regarding the presence or absence of specific intracellular events) and reduces the amount of sample material required for reliable assays and assays Allow downsizing.
2. Separating sub-wavelength distance relationships in biological targets in the natural hydrated state. As mentioned above, subwavelength separation by high energy beam microscopy requires that the sample target be in a dry state, hindering the observation and use of natural cellular processes (including subwavelength migration of cellular components) One perturbs the sample during observation.
3. Direct spatial mapping of selected target sites in a biological target (eg, direct mapping of selected sequences in a chromosome for chromosomal mapping purposes). Currently, this type of information is either impractical or not possible with high resolution and precise positioning of gene sequences in the case of chromosomal mapping.
4). Optical readout of microcoded information. The ability to detect unique patterns of individual reporter groups has important applications in forensics, information storage, metrology, and security identification microcode.
Therefore, it would be desirable to provide a method and apparatus for interrogating fields for the types of information outlined above that are impractical or impossible to obtain by prior art methods.
Applying the method of the present invention to a variety of diagnostic applications to achieve improved sensitivity, spatial and distance information, ease of sample preparation, and flexibility in the type of target sample that can be interrogated Is also desirable.
Summary of the Invention
In one aspect, the invention encompasses a method for hearing a field having a plurality of distributed PREs. The method includes illuminating the field with an optical light source and detecting spectral emission characteristics for individual PREs and other light scattering entities in the field. From this information, the location of individual PREs and other light scattering entities present in the field and the values of the emission spectral characteristics are used as a basis for distinguishing PREs having a spectral signature selected in the field from other light scattering entities. Computer images are constructed to provide information about the venue.
The illuminating step can be performed in different frequency bands, and the spectral emission characteristics of individual PREs and other light scattering entities in the field are detected in each such band.
Alternatively, irradiating can include exposing the field to a plurality of narrowband pulses of light of varying duration and detecting a change in emission intensity generated by the variation of duration.
In another embodiment, if the field preferably comprises at least some non-spherical PREs, illuminating may include exposing the field to polarized light at different directions and / or different angles of incidence. . The detecting step includes detecting a change in the value of the spectral emission characteristic as a function of the polarization direction of the incident light or the angle of incidence.
The detecting step may include simultaneously detecting the values of spectral emission characteristics of individual PREs and other light scattering entities in the field in a plurality of defined spectral bands. Alternatively, the spectral emission characteristic values of individual PREs and other light scattering entities in the field can be detected continuously in multiple defined spectral bands.
PRE by metal-enhancement of the nucleation center in the field, by adding pre-formed PRE to the target in the field, or by making the PRE at the target site in the field (eg, by photolithography) Can be formed in the field or added to the field.
This method can be implemented to identify a PRE with a selected spectral signature from all other light scattering entities in the field. As a criterion for identification, the detected spectral emission characteristics typically include peak position, peak intensity, or peak width at half-intensity of the spectral emission curve, peak half-width at the image plane, and / or incident response. Of polarization or angle. Other emission spectral characteristics (e.g., response to pulsed irradiation) are also contemplated.
The same spectral characteristics, either alone or in combination, (i) a PRE from a non-PRE light scattering entity, (ii) from the other selected type of PRE, one selected type of PRE, and (Iii) Useful to distinguish interacting PREs from non-interacting PREs (typically PRP) via proximal effects.
In another embodiment, the PRE has a surface-localized fluorescent molecular entity or a Raman-active molecule entity (eg, a Raman-active molecule), and the detecting step comprises plasmon resonance inducibility from one or more of the above-described entities. Detecting fluorescence or Raman spectroscopy.
The method consists of (i) the total number of selected types of PREs in the field, (ii) a spatial pattern of PREs with a range of selected values of selected spectral characteristics in the field, and (iii) two adjacent Distance measurement between PREs, especially PREs separated by distances less than the Rayleigh distance, (iv) field environment changes (eg, permittivity, which affects the value of plasmon resonance properties), or (v) field To obtain information about the movement of the PRE in
In another aspect, the invention includes an apparatus for hearing a field having a plurality of distributed PREs, eg, in performing the method described above for hearing a field. The apparatus includes an optical light source for illuminating the field, and an optical detector for detecting spectral emission characteristic values of individual PREs and other light scattering entities in the field when the field is illuminated by the light source. Is provided.
Also included in this device is to construct computer images of the values of individual PREs and other light scattering entities present in the field and values of emission spectral properties from the signals received from the detector. Having a selected spectral signature (ie, a selected range of values of selected spectral emission characteristics) from an image processor operably coupled to the detector, as well as other light scattering entities in the computer image. It is an identifier for identifying PRE. The device is constructed to present (or store) information about the field based on information about the selected PRE.
One preferred light source is a bright field / dark field lens for detecting light on the field. Alternatively, the illumination source can be a bright field lens, a dark field lens, a polarizer (eg, a plane polarization source) to produce a polarized illumination source, a TIR, a pulsed beam, a half-silver mirror via a dark field / bright field lens. an epi-illumination system in which light is reflected by a -silverd mirror, and a dark field condenser lens. The light source may comprise means for separating the field with light having different excitation wavelengths.
The optical detector may comprise a structure for spectrally separating light emitted from the RPE. The detector in this embodiment operates at each of a plurality of different emission wavelengths to form a computer image of the position and emission spectral characteristic values of individual PREs and such other light scattering entities present in the field. To do.
The optical detector is a two-dimensional array of optical fibers, a grating or prism for responding to the output of the optical fiber when aligned to act as a line source of light from the array, and a line source of light A two-dimensional detector array for responding to the spread spectrum light from each fiber at.
The image processor can determine the position of the field, as well as the peak position, peak intensity, or peak width at half-intensity of the spectral emission curve, peak half-width at the image plane, and / or associated values of polarization or angle of the incident response. Operates to build an image.
In another embodiment, when the PRE has a surface-associated fluorescent molecular entity or Raman active molecular entity, the image processor can generate a field of Raman spectral features in plasmon resonance induced fluorescence or plasmon induced Raman spectral emission. Actuate to construct the position and fluorescence peak images.
The discriminator selects the selected type of PRE from all other light scattering entities in the field, PRE from non-PRE subwavelength light scattering particles (including: (i) PRE from non-PRE light scattering entities. , (Ii) one selected type of PRE from the other selected type of PRE, and (iii) a PRE interacting via a proximal effect from a non-interacting PRE (typically PRP) A) to identify.
The information presented by the device includes (i) the total number of selected types of PREs in the field, (ii) the spatial pattern of PREs with selected spectral characteristics in the field, (iii) two adjacent PREs, in particular For distance measurements between PREs separated by distances less than the Rayleigh distance, (iv) Field environment changes (eg, permittivity, which affects plasmon resonance properties), or (v) PRE movement in the field It may be related to the information.
In another aspect, the present invention comprises a composition of PRP having one or more plasmon resonance particles (PRP). The composition is: (a) the PRP has a width at half height of less than 100 nm; (b) all the PRP in a single population is at a defined wavelength within 40 nm. (C) at least 80% PRP in the composition meeting the provisions of (a) is in one or more populations and spectral emission wavelengths in a single range> 700 nm, 400-700 nm, <400 nm; And (d) each population is characterized by having at most 30% overlap in the number of PRPs with any other population in the composition. The composition may be used in performing the above-described targeted hearing method and / or in combination with the above-described targeted hearing device.
In one embodiment, at least 80% of the PRP in the composition is in one or more populations and has a spectral emission wavelength in the wavelength range of 400-700 nm. Also in this embodiment, the particles have a composition formed from solid silver particles, silver particles having a gold core, or particles having a dielectric core and an outer silver shell of at least about 5 nm.
In one general embodiment, particularly for use in various diagnostic applications, the particles are at their surface (i) with a surface-attached ligand adapted to bind to a ligand binding site on the target. Where the ligand / ligand binding site is a conjugate binding pair, a ligand, (ii) a fluorescent molecule, (iii) a Raman-active molecular entity, and (iv) blocking to prevent non-specific binding Localize the reagents, (v) coating with functional groups for covalent coupling to PRP, or (vi) combinations of (i)-(v).
The localized ligand is one of the binding pairs (eg, antigen / antibody, hormone / receptor, drug / receptor, effector / receptor, enzyme / substrate, lipid / lipid binder, and complementary nucleic acid chain). It can be.
The composition can also have first and second populations of PRP having first and second different surface localized molecules or entities. For use in identifying a target having first and second ligand binding sites, the first and second surface binding molecules are effective to bind to the first and second ligand binding sites, respectively. The first and second ligands. By way of example, the first and second surface localization molecules are oligonucleotides having sequences that are complementary to the first and second proximal sequence regions of the target polynucleotide. As another example, the first and second surface localized entities may be Raman active molecular entities having different Raman spectral characteristics.
The composition can include first and second populations of PRP, each having a different shape, at least one of which is spherical or tetrahedral.
In yet another aspect, the invention encompasses a diagnostic method for use in detecting the presence or information about a target having a molecular property of interest. This method contacts one or more PREs (preferably PRP) with surface-localized molecules with a target to generate an interaction between the molecular features and the localized molecules. Observing the plasmon resonance spectral emission characteristics of one or more PRPs after such steps, illuminating the target with an optical light source, and such interaction with the target, information about the presence of the target A step of determining. The diagnosis method can be performed, for example, by using the above-described target hearing device by the above-described target hearing method.
In a general embodiment, the target includes a ligand binding site and the surface-localized molecule is a ligand that can form a ligand / ligand binding complex with the target. The binding interaction is detected by detecting the plasmon resonance spectral emission characteristic of the complex. The surface-localizing ligand can be, for example, a polynucleotide, oligonucleotide, antigen, antibody, receptor, hormone, enzyme, or drug compound.
In the solid phase form of the method, prior to detecting the complex, the target is washed to remove PRP that is not bound to the target via a ligand / ligand interaction.
In the homogeneous phase of the method, the interaction of the target with the PRE either produces a plasmon resonance spectral emission characteristic that is distinguishable from the plasmon resonance spectral emission characteristic of the non-interacting PRE or separates the diffraction center. Here, the two PREs have different peak wavelengths. By detecting one of these features, the presence of a diagnostic interaction can be determined.
In one homogeneous phase embodiment, the PRE comprises a surface-localized fluorescent reporter molecule and the interaction of the PRE with the target or with the PRE and another PRE at the target is the It is effective to detectably change the plasmon resonance-induced spectral emission characteristics.
In another embodiment, the PRE comprises a surface-localized Raman-active molecular entity, and the interaction of the PRE with the target or with the PRE and another PRE at the target is a plasmon of the Raman-active molecular entity at the PRE. It is effective to detectably change the resonance-induced spectral emission characteristics.
In yet another embodiment, the target has two or more proximally located ligand binding sites and the complex that forms is different from the spectral emission signature of PRE in the absence of binding to the target. It includes at least two proximally placed PREs having a spectral emission signature (eg, a change in the spectral emission curve of the complex), where the two PREs have substantially the same peak wavelength. Alternatively, if the two PREs have different peak wavelengths, individual PREs can be interrogated at two different wavelengths, and the distance between the PREs is determined by the distance between the centers of the two diffraction patterns in the image plane . This embodiment includes, for example, first and second populations of PREs having first and second surface-localized ligands, respectively, for binding to first and second ligand binding sites, Can be carried out by reacting.
For use in creating a spatial image of a target, if the target has multiple ligand binding sites, contact of the target with the PRE will generate binding at multiple sites. The detecting step includes constructing a spatial image of the site of PRE attachment to the target, which is an indication of the relative spacing of the ligand binding sites on the target.
One application includes the mapping of closely spaced regions in the polynucleotide, where the detecting step involves observing the spacing between the centers of the PRE diffraction pattern in the PRE image plane.
Another application includes gene mapping, for example, by binding PRE with different complementary surface-localized oligonucleotides to a target polynucleotide with extended conditions.
In another embodiment, the target is an oligonucleotide or polynucleotide sequence of a different sequence, for use in detecting target sequence variations, or for sequencing by hybridization. This sequence comprises one or more surface localization test polynucleotides having one or more surface localization test polynucleotides under conditions that allow the PER surface localization polynucleotide to hybridize to the target sequence oligonucleotide or polynucleotide. Contacted with PRE. After washing the target to remove unbound PRE, the spectral emission characteristics of the PRE are detected in each region of the sequence, and the pattern of polynucleotide binding to the sequence is determined.
In another embodiment, the target is a polynucleotide shown as a separated band in the electrophoresis gel, and the contacting step is performed by exposing the surface of the gel to the PRE under hybridization conditions. This method simplifies the Southern hybridization method by eliminating the DNA band transfer step.
In another general embodiment of this method, the molecular feature of interest is a molecule that functions catalytically to break the bond between two atoms in the molecular chain. The PRE reagent in this method is a pair of PREs linked by the chain, and the linked PREs may have a spectral emission spectrum that is different from the spectral emission spectrum of the individual (ie, separate) PREs. The contacting step is performed under conditions effective to cleave the molecular chain. The presence of the cleaving agent is detected by the disappearance of the linked PRE spectral emission signature or the appearance of individual PRE spectral emission characteristics, or a change in the detected distance between the two PREs.
In another aspect, the invention provides that: (a) the PRP has a width at half height less than 100 nm; (b) at least 80% PRP in the composition meeting the criteria of (a) Have a spectral emission wavelength in one or more populations and in a single range of> 700 nm, 400-700 nm, or <400 nm; and (c) the surface-localized ligand binds ligand on the target A plasmon resonance particle (PRP) characterized by being adapted to bind to a site, wherein the ligand / ligand binding site is a conjugate binding pair, (ii) a fluorescent molecule, or (iii) a Raman-active molecular entity A composition.
The present invention further includes various PRE compositions and methods discussed in Section VI of the Detailed Description of the Invention.
These and other objects and features of the invention will become more fully apparent when the following detailed description is read in conjunction with the accompanying drawings.
[Brief description of the drawings]
FIG. 1 is a graph of the relative scattering intensity of two optically observable plasmon resonance entities having different peak scattering wavelengths.
FIG. 2 is a graph of the relative scattering intensity of four optically observable plasmon resonance entities having similar peak scattering wavelengths.
FIG. 3 is a schematic illustration of one embodiment of a dark field microscope detection system suitable for observation of plasmon resonance entities.
FIG. 4 is an illustration of a liquid analog for a solid immersion lens that can be used to observe a plasmon resonance entity.
FIG. 5 is an illustration of an overall internal reflection sample state suitable for use in observing a plasmon resonance entity.
FIG. 6 is an illustration of a reflective brightfield / darkfield lens suitable for PRE imaging.
FIG. 7 is a reproduction of a transmission electron microscope image of two plasmon resonance particles.
FIG. 8 is a graph of light intensity as a function of position in the image plane for two different bandwidths emitted by the plasmon resonant particles shown in FIG.
FIG. 9 is a graph showing the results of an assay performed using plasmon resonance labeling.
FIG. 10A illustrates a focused light beam having an intensity profile characteristic measurable with a plasmon resonance entity.
FIG. 10B shows the placement of the plasmon resonance entity in the focused ray of FIG. 10A.
FIG. 11 is a Raman signature from the Raman active PRE.
FIG. 12 is a chicken skeletal muscle section whose ryanodine receptor is labeled with anti-ryanodine PRP.
FIG. 13 is a Drosophila polyfilament chromosome in which a particular gene is labeled with PRP.
Detailed Description of the Preferred Embodiment
Definition
The following terms have the definitions given below, unless otherwise indicated:
“Plasmon resonance particle” or “PRP” means a single section or fragment of a substance (eg, a spherical particle) that induces plasmon resonance when excited by electromagnetic energy. A plasmon resonant particle can be “optically observable” if it exhibits significant scattering intensity in the optical region including wavelengths from about 180 nanometers (nm) to several microns. A plasmon resonant particle can be “visible” if it exhibits significant scattering intensity in the wavelength band of about 400-700 nm that is detectable by the human eye. Plasmon resonance is basically created through the interaction between free conduction electrons and incident light. The particle or entity has a dimension, for example, the diameter is preferably about 25-150 nm, more preferably about 40-100 nm.
The term “plasmon resonance entity” or “PRE” is used herein to refer to any independent structure that exhibits the plasmon resonance properties of the structure and is defined and described above as a plasmon resonance particle (PRP) and above. Including, but not limited to, any combination or association of plasmon resonance particles. The PRE can include either a single PRP or a collection of two or more PRPs that exhibit plasmon resonance characteristics when excited with electromagnetic energy.
A “field with multiple distributed PREs” refers to a one-dimensional, two-dimensional, or three-dimensional region, such as a target or a portion or region of a target that has an attached or otherwise distributed PRE on it. As a result, the PRE in the field shows plasmon resonance when illuminated by an optical light source.
“Spectral emission characteristic” refers to the spectral scattering characteristic of the PRE in relation to the plasmon resonance of the PRE, as described in Section III. As used herein, “emission” means scattered light that is generated or excited by plasmon resonance as applied to a PRE.
A “value” of a spectral emission characteristic is a qualitative or quantitative value of the emission characteristic (eg, detected peak intensity, peak wavelength, or peak half-width at maximum).
“Selected spectral signature” refers to a selected range of spectral emission characteristic values to be selected (eg, a range of spectral peak intensity values).
"Computer image of emission spectral characteristic positions and values" refers to a matrix that links each region in the field being interrogated with one or more spectral emission characteristic values or signatures measured for light scattering entities in this region. The image can be a matrix of stored values, or shows the location of light scattering entities in one dimension or plane (eg, the xy plane) and the associated spectral emission values in another dimension (eg, the z-axis) It can be an actual image.
A “ligand” is a chemical species, typically a biochemical species, that can form a specific, typically high affinity binding, with a “ligand binding” site or molecule. The ligand / anti-ligand forms a binding pair that can include, for example, antigen / antibody, hormone / receptor, drug / receptor, effector / receptor, enzyme / substrate, lipid / lipid binding agent, and complementary nucleic acid chain.
A “Raman active molecular entity” is a molecule, molecular complex or particle that presents a Raman spectroscopic signature, preferably via resonant Raman excitation, when excited by the electric field of a plasmon resonant particle to which the molecular entity is attached. (For example, silicon particles).
“Surface-localized” ligands and other species are attached to the PRE by covalent bonds or other molecular forces (eg electrostatic or dispersive forces) or embedded in a shell or other surface coating on the PRE Refers to the molecular species.
II.Plasmon resonance
The present invention provides various types of information (such as the presence or absence of a target, spatial characteristics of the target, target environment, target binding site of the selected type, as detailed in Sections III-VI below). One or more of the many spectral emission characteristics of conductive plasmon resonance particles (PRP or PRE) are used to interrogate the field for number and / or spatial distribution, including distance relationships at the target.
The scattered incident light of the plasmon resonance entity (PRE) or plasmon resonance particle (PRP) and the resulting scattered light have the frequency spectral characteristics of the particles. A general theory describing the interaction between incident electromagnetic waves and spherical particles that successfully predicts this resonant scattering was developed in the early 20th century (HCVan Ve Hulst, Light Scattering by Small Particles, Wyley, NY , 1957). In the metal range, the incident electromagnetic field contains vibrations called “plasmons” in the almost free conduction electrons of the metal, and these plasmons generate an electromagnetic field that is emitted. For some materials, and for the optimal choice of particle size, shape, and morphology, there is maximum scattering efficiency at the wavelength characteristics of the scattering particles and the surrounding media. For some materials, the intensity of the emitted light is sufficient for observation under an optical microscope. Silver particles are the most prominent exhibitors of this effect because the wavelength of light that is resonantly scattered can be in the visible region of the spectrum.
Theoretical calculations accurately predict that the resonantly scattered wavelength of a spherical particle will increase or “red shift” as the particle diameter increases and the dielectric constant of the surrounding material increases. To do. For spherical particles, dipole resonance produces a scattered frequency spectrum with a single peak at a material-dependent wavelength, and the particles are from the size, shape, shape, and local environment of the particle. Produced. Larger particles have a longer dipole scattering peak wavelength, and smaller particles have a shorter dipole scattering peak wavelength. The spectrum of scattered light can also include contributions from the quadrupole resonance of the particles. For a given shape, resonant particles preferentially scatter in specific wavelength bands that depend on the composition and size of the particles.
The conductive sites responsible for plasmons can take many different forms, including solid geometric shapes (eg, spherical, triangular parallelpiped, ellipse, tetrahedron, etc.), or spherical, cylindrical, Or other shapes of shells may be included. It is also true that similarly dimensioned dielectric spheres with silver or gold on the surface also exhibit plasmon resonance, and the shell is assumed to have a thickness of at least about 3 nm, preferably 5 nm or more.
Furthermore, contact or near contact between two plasmon resonant particles creates an electromagnetic coupling between the particles, thereby reducing several single particles having a size equal to the sum of the two particles in contact. It is understood that an entity having similar characteristics in terms of Therefore, many plasmon resonant particle assemblies also exhibit plasmon resonances with properties that depend on the geometry and nature of the assembly.
Another feature of plasmon production in metallic particles is the generation of an enhanced electric field in a region near its surface. This interaction between the electric field and the adjacent material can significantly change both the resonant particles and the scattering properties of the adjacent material. For example, surface-enhanced Raman spectroscopy (SERS) takes advantage of localized plasmon resonance in rough or particle-coated silver films and enhances Raman scattering of various materials up to six orders of magnitude. In this technique, Raman scattering from the material of interest is observed, and a local field generated by plasmons can be used to enhance the intensity of the scattering.
Referring now to FIG. 1, a graph of the relative scattering intensity of the two PRPs is described, demonstrating that different PREs can have differences in easily detected spectral characteristics. While the spectrum shown in FIG. 1 could be generated by either a more complex individual PRP or PRE, the source of the scattered light spectrum described in FIG. 1 is for illustrative purposes. It is assumed that it is derived from PRP.
In FIG. 1, the relative intensity of scattered light in arbitrary units is plotted against nanometer wavelengths. The individual spectra of two different PRPs are shown—the first is spectrum 3 (with a
FIG. 2 shows the spectral emission curves for a population of four different populations of PRE, each having approximately the same characteristics. The four
III.Method and apparatus for hearing a venue
In one aspect, the present invention relates to a method and apparatus for interrogating a field having a plurality of PREs dispersed therein. The method essentially consists of: (i) generating data for one or more spectral emission characteristics of the PRE in the field; (ii) from this data, a computer image of the location of the PRE (field region); As well as generating spectral emission characteristic values for individual PREs and other light scattering entities present in the field, and (iii) using the selected spectral characteristics in the image, Providing information about a field (eg, a target in the field) by distinguishing it from light scattering particles, has three parts.
A. Spectral emission characteristics
The present invention contemplates detecting one or more of several types of spectral emission characteristics to produce an image of light scattering particles in the field. The desired spectral emission characteristics are the plasmon resonance spectral characteristics of a single PRP, the shift in spectral emission characteristics due to the interaction of two or more PRPs in close proximity, or the fluorescence, emission, or Raman located on the PRE It can be a fluorescent or Raman spectroscopic property induced by an enhanced local electric field that interacts with the molecule. The most important information properties and types available from each are listed below.
Peak wavelengthIs the peak wavelength of the spectral emission curve (ie, the wavelength that produces the maximum intensity). The peak wavelengths of the two spectral emission curves shown in FIG. 1 are indicated by 5 and 9, which correspond to the wavelength values of 470 nm and 560 nm as described above.
The peak wavelength value can be determined in one of a number of different ways, seven of which are described herein. The individual performance of these methods will be understood from the disclosed methods for some of the methods, as discussed below in the description of the light source and detector of the apparatus of the present invention. All of these methods are adaptable to measure multiple spectral curves simultaneously. Some of the methods are also adaptable to individual measurements of the spectral curve of each light scattering entity in the field, for example by rastering the light detection elements on the surface of the field.
(I) The field is illuminated over a range of illumination wavelengths via the visible light spectrum, for example, in each of a series of narrowband illumination windows. Typically, a filter wheel placed between the white light source and the field is used to produce a narrow band illumination frequency.
(Ii) Light emitted from the field is directed through scattering elements (eg, prisms) to scatter the emitted light into several narrowband frequencies, and then directed to each different detection array It is done. As an example, prisms are used to split emitted light into red, green, and blue components, each directed to an individual CCD array.
(Iii) Place the luminescence field image into a dense bundle of optical fibers via a lens (eg, a lens that expands each light scattering spot corresponding to the PRE) so that the image fits perfectly to the core diameter of the optical fiber. . Each fiber is then spread into spectral lines that are spread to different frequencies by the dispersive elements, which are then read by the lines of detector elements in a two-dimensional array. Thus, each line of the field is read by a two-dimensional array, with one array dimension corresponding to the spectral intensity at each of the plurality of frequencies and the other dimension corresponding to a different position along the field axis. This approach allows simultaneous reading of multiple PREs at each of multiple spectral wavelengths.
(Iv) Irradiate with multiple narrow band light sources (eg, 3 or 4 separate laser lines of red, green, yellow and blue). Each laser is split at a different frequency (typically all below 100 Hz). Light emitted from the field is detected by a CCD that can be read at 100 frames / second. Computer analysis, including standard techniques, can then be used to determine the amount of light for each color that strikes each pixel in the CCD array, thereby creating a spectral emission curve.
(V) Similar information can be obtained by determining the path of scattered light that has passed through the interferometer, eg, as described in US Pat. No. 5,539,517.
(Vi) It is also a characteristic of plasmon resonance particles that the scattered light undergoes a phase change of 180 degrees compared to the incident light when the wavelength of the incident light is allowed to pass through the resonance peak. At the peak wavelength, the phase difference is 90 degrees. This phase change can be detected and the peak scattering wavelength can be determined as the incident wavelength when a 90 degree phase change is observed.
(Vii) PRE emission intensity over multiple defined bandwidths can also be determined by exposing the PRE to various short time pulses of incident light. In particular, the use of pulses approximating increasing or decreasing step functions is useful (ie, rapid rise and decay times of only 1 or 2 femtoseconds). The PRE scattering response is a forced and damped oscillation scattering response, and near the resonance wavelength, the PRE response to narrowband excitation increases as the excitation pulse length increases. Beyond the resonant wavelength, the response to narrow band excitation is small and relatively independent of excitation pulse length. By exposing the PRE to pulses at various wavelengths for various times (but conveniently all less than about 500 femtoseconds) and knowing the time it took for the luminescence energy to reach a steady value Information about how close a particular wavelength is to the PRE resonance wavelength is provided. By exciting the PRE for several series of time-varying pulses, each series now has a different peak wavelength and a scattering cut plane curve for the wavelength can be created.
As the size of the silver PRE and the gold PRE increases, the peak wavelength generally moves in the red direction (longer wavelength side). The peak wavelength value may also provide information about the shape of the PRE. The change in shape from spherical to hexagonal or triangular results in a peak wavelength shift mainly to red. Dielectric shell PRP (ie, particles consisting of an inner dielectric core encased in a conductive metal) also tends to have longer peak wavelengths than solid metal particles of the same size.
Peak intensityIs the intensity of the peak of the spectral emission curve and can be expressed as an absolute intensity value or a relative intensity value as in FIG. 2, which shows four PREs with different relative peak intensities ranging from less than 3 to more than 10. The peak intensity value can be determined by one of various methods for determining the spectral emission curve of the PRE, as described above, using the intensity determined at the peak wavelength.
The peak intensity varies depending on the material, form and shape. For a particular PRE, the intensity is maximum with respect to the focal frame.
Half widthIs the width in wavelength units at half the peak intensity of the spectral emission curve. This value can be measured as an independent spectral characteristic or can be measured to characterize the spectral emission curve in combination with the peak spectral intensity (eg, peak intensity / peak width ratio).
The four curves shown in FIG. 2 illustrate two spectra having a relatively narrow peak width (curves 10 and 11) and two having a relatively wide peak width (12 and 13).
Generally, the peak width increases with increasing PRE size and changes in a manner that can be mimicked as the PRE shape changes from a spherical shape to a non-spherical shape.
Width in image planeIs half the width of the central diffraction region in the Airy pattern on the image plane. All PRPs are sub-wavelength light sources, so their aerial image is an approximate point magnification function with properties defined by the optical system used. Assuming an optical system that includes a CCD, the width of the central diffractive region that can span several pixels using a pixel array of light detection elements is half the peak value from the peak at the center of the diffraction image. Up to the center position of the image (assuming a circular image), it is measured radially.
Since PRP is a subwavelength scatterer, the half width of the intensity pattern as recorded on the image plane is proportional to the wavelength of the scattered light. Therefore, for a reasonably smooth change in light intensity from a source (eg, xenon arc), the light is most strongly scattered in peak intensity, and half the intensity width of the central diffraction region in the image for each PRP A good evaluation of the peak wavelength can be made by measuring.
As will be shown below, this spectral characteristic is used to accurately determine the location of the PRE in the field, and in particular to determine the distance between two PREs of different peak wavelengths that are closer than the Rayleigh decomposition distance. Useful. The peak intensity of the diffraction pattern at the image plane can be used to focus the detector lens with respect to the field, with the maximum giving the best focus.
PolarizationIs a spectral characteristic (eg, peak wavelength, peak height, half-width of wavelength, or half-peak intensity at the image plane) as a function of the direction of polarization of the light illuminating the PRE field, or the angle of incidence of the polarized light. Measure the value range. The properties of polarization depend on the shape of the PRE rather than the size of the PRE, and an aspherical PRE can have one or more resonances in the major and minor axis directions of an elliptical PRE, for example. In the latter case, the irradiation light in the long axis direction moves toward red, while the irradiation light in the short axis direction moves toward blue.
Pulse or time responseProvides a measure of the number of light cycles of the illuminating light required to “pump up” scattering of sufficient intensity. The PRE has a very fast time response (sub-picoseconds) and can only generate very large pulses of scattered photons, limiting the average input force absorbed. They can accept pulses in femtoseconds between 5 and 500 in order to perform two photon processes or generation of second harmonic oscillations and other more sophisticated command processes.
As described above, pulsed or temporal illumination measurements are generally performed by exposing the field PRE to short pulses of incident light at various times to detect the peak wavelength. The time for complete resonance, when measured by intensity versus pulse time, also provides a measure of material purity as a plasmon resonator. Higher purity material is characterized by a narrower resonance signature, a higher peak intensity, and a longer time to reach the maximum intensity of scattering when illuminated by a pulse of light of peak wavelength.
Phase shiftAre discussed above in the section on determining spectral peaks at a 90 degree phase shift. The phase shift can also provide information about the response to excitation wavelengths away from the resonant peak wavelength.
Fluorescence lifetimeCan be observed in PRE particles with surface-localized fluorescent molecules. Fluorescence excitation can be enhanced by a local electric field generated near the surface of the PRE by light within the plasmon resonance peak. Further, when the wavelength of the fluorescence emission light is within the plasmon resonance peak, the fluorescence emission can be enhanced. Under appropriate conditions, the fluorescence lifetime can be shortened until it can be measured by this process.
The method can be used to detect changes in the excitation environment of fluorescent molecules (eg, proximity interactions with other molecules or entities).
Surface-enhanced Raman scattering(SERS) depends on the generation of an enhanced electric field in the region near the surface of the PRE. This interaction between the electric field and the nearby material can significantly change both the scattering properties of the resonant particles and the scattering properties of the nearby material. Surface-enhanced Raman scattering spectroscopy (SERS) uses plasmon resonance traditionally localized on roughened or grain-dried silver films to enhance Raman scattering of various materials to six orders of magnitude. The SERS performed according to the present invention is confirmed by PRE alone. In this technique, Raman scattering from the material of interest is observed, and using a local field generated by plasmons, the intensity of the scattering is enhanced to several orders of magnitude over traditional SERS. If the Raman-active molecule has a resonance absorption near the peak of the spectral emission curve of PRE, further SERS enhancement will produce a Raman signal of the hybrid molecule detectable substance according to the method of the invention disclosed in Section III. Enough. Measuring changes in the PRE resonance Raman spectrum can be used to detect changes (eg, binding) in the local environment of the Raman molecule.
B. Where to be heard
The field to be interrogated by the method and apparatus of the present invention includes multiple, ie, two or more, targets and target regions having PREs dispersed in the target.
The target can be any target suitable for viewing by light microscopy; a biological cell or tissue; a plant or animal part or cell aggregate; a solid surface with a surface-localized ligand binding molecule; a target analyte Body fluid samples containing molecules, particles or cells; biological sample materials such as chromosomal material placed in extended conditions; artificial monomolecular or bilayer substrates; microfabricated devices such as computer microchips; and chips A microarray, such as the above oligonucleotide or oligopeptide microarray.
The formation of PRE and methods for preparing targets with PRE dispersed therein are discussed in detail below. In this regard, three general cases are briefly considered. First, a preformed PRE is added to the target for adhesion to a specific target site. The target can be washed to remove unbound PRE or non-specifically bound PRE. The target can be engineered to achieve the desired configuration (eg, an extended chromosome) before or after PRE binding. Second, a nucleation site can be added to the target. After binding to a selected location on the target, a metal enhancer solution, such as a silver solution, is added until an appropriately sized PRE is formed. As a third case, PRE is formed on a metal substrate, for example, a silver substrate, by a photolithographic method, for example, photomasking and photoetching.
In accordance with the present invention, the type of information that is desired to be determined by interrogating the field containing the target and the PRE includes: (i) the total number of PERs of the selected type in the field; (ii) the field A spatial pattern of PREs with selected spectral characteristics at (iii) a measure of the distance between two adjacent PREs (especially a PRE separated by a distance shorter than the Rayleigh decomposition distance), (iv) a plasmon resonance characteristic Affecting environmental changes in the field (eg, dielectric constant), (v) motion of the PRE in the field, (vi) whether the two PREs are linked, or (vii) localized and attached to the PRE Fluorescence or Raman luminescence of molecules or materials. Other types of information are also contemplated and are discussed in Sections IV through VI below.
C.Device of the present invention
FIG. 3 is a simplified schematic diagram of an
In the manner detailed below, the target is illuminated by an optical
Spectral emission from the target, in this case light scattered from the target, is directed through
An image processing device included in the
The device sorter 42 (which also forms part of the computer 28) is configured to select a selected spectral signature (ie, one or more selected spectral emission characteristics of a selected range of values) in the computer image. Function to sort PREs with) from other light scattering entities. An example of the operation of the sorter is shown below.
C1.substrate
As described above, the target is supported on the substrate placed on the microscope stage. Suitable substrates include standard glass slides, cover slips, clear styrene, and clear mica. Other suitable transparent substrates are those associated with TEM grids (eg, formvar, carbon, and silicon nitride). All of these TEM related substrates are optically transparent at the thickness used. Conductive substrates, semiconductor substrates, and reflective substrates are also suitable for PRE adaptation.
Another substrate suitable for use in the present invention may be initially opaque to the spectral wavelength of interest for PRE observation, but may be appropriate by application of an appropriate fluid or vapor. It is. Examples are used to transfer biological samples of interest in diagnostic techniques such as “Southern”, “Northern”, “Western” and other blotting, spotting, or “dip stick” tests When done, there is white nitrocellulose “paper”. Once the material of interest has been transferred and immobilized as desired, the PRE can be adapted as a pre-formed entity or can be adapted and augmented with a PRE nucleating entity as follows. White nitrocellulose at this stage can exhibit significant non-reflective light scattering that typically makes it difficult to visualize the PRE. However, if appropriate processing is used that can result in a significant reduction in non-reflective scattering (eg, surrounding the nitrocellulose substrate with acetone vapor while monitoring the PRE), the substrate can be much more opaque, and Enables effective observation of PRE.
Silicon is the preferred substrate for many PRE detection applications. This is because it can be made very smooth and free of defects and, as a result, hardly causes non-reflective scattering under dark field irradiation. One example of a particularly preferred silicon substrate is the surface of a silicon wafer that is very glossy, etched and free of defects and is commonly used in semiconductor manufacturing. Such a substrate is free of contaminants and surface imperfections and produces PRE scattering and excellent control under dark field illumination conditions. However, typically such silicon wafers are SiO SiO present on their surface as a result of various processing steps.2It is understood that it has a thin layer. SiO of approximately 100 nm or more on the surface2Can be said to produce some of the most intense and highly contrasted PRE spectra ever observed from solid substrates. And this means that SiO on the silicon wafer surface2It may be advantageous to intentionally form a submicron layer.
The optics of PRE as a "point source" when the oxide layer is removed from the silicon surface in a manner that inhibits rapid oxide layer reformation (eg, by etching in HF acid and surface protection with hydrogen) The image is observed in an annular form, rather than the normal Airy ring pattern with a bright central area. This “doughnut” phenomenon is likely to occur as a result of lateral drive field decay (parallel to the silicon surface), which radiates well, but not directly along the vertical. Only the vertical drive field that can excite the plasmon mode is left. This property of the bare silicon substrate determines whether a particular PRE is bound in close proximity to the surface of the silicon substrate, or whether it is constrained via a limiting molecule or system that places it away from the surface. It can be useful to determine and thereby change the dipole component scattering ratio.
C2.Light source and detector
With continued reference to FIG. 3, the light generating means 32 in the light source may suitably be a mercury, xenon or equivalent arc; or an approximately 20-250 watt quartz-tungsten halogen bulb, which is visible light PRE scattered. Provides incident light in a frequency band corresponding to a wavelength of about 350 nm to 800 nm, or a conventional UV source for low wavelength PRE scattering.
Typically, the
Other methods of illuminating a target with a range of selected bandwidths include the use of light sources such as all types of lasers that can use very narrow bandwidths. A frequency source is also contemplated, such as a tuned laser (ie, Ar ions) to select features of any of a plurality of frequency sources, eg, a defined powerful “line” source. Alternatively, a diffraction grating or prism monochromator can be used. All light sources can be either continuous or pulsed, or an appropriate light amplitude modulator (not shown) can be inserted into the incident path to change the intensity level in a predetermined provisional manner. The polarization of light incident on the sample can be altered by the insertion of a suitable filter or other device well known in the art.
The microscope of FIG. 3 is illustrated to be consistent with an epi-illumination system whereby collimated light from a light source filtered as desired impinges on a
The reflected light from the mirror is then refracted or reflected (appropriate
In this dark field system, illustrated in FIG. 3, the angle between the optical axis and the incident light that illuminates the sample is such that the light scattered by the PRE received by the optical axis and the objective lens element 45 (this is in refractive form). Larger than the maximum angle between them. Also, although not shown, those incorporated in all of the light microscopes divert the light from the
It has been found suitable to use the Nikon DF / BF lens model CF Plan BD ELWD with 100 × magnification and numerical aperture (NA) 0.8 as the
The optical system comprising the
Various image capture devices known in the art can be used, including fiber-coupled photodiode arrays, photographic films, and the like. One exemplary device is a thermoelectrically cooled CCD array camera system, model CH250 (manufactured by Photometrics of Tucson AZ). This apparatus uses a CCD chip model KAF1400 and has a 1032 × 1037 pixel array.
It is understood that the detection device acts to detect the spectral emission characteristics of individual PREs and other light scattering entities in the field, and when the field is illuminated by a light source, in each region in the field, At the same time, the array pixels are made to correspond.
C3.Image processing, identification and output
For example, if the detector is used to detect spectral peak wavelength, peak intensity and / or half-width of the spectral peak, the detector measures the intensity of light at each of a number of different illumination light frequencies. Each field region is associated with an array pixel of the detector at the same time.
The emission (scatter) values measured at each frequency are stored, giving a spectral emission curve for each region that is constructed after full spectrum illumination. From these curves, the peak wavelength, peak intensity, and half width at intensity are calculated for each region. Similarly, the half width of the peak on the image plane can be measured using the CCD array described above.
The detector is a comprehensive software and hardware that allows timed exposure, pixel readout to appropriate files for data storage, statistical analysis, and image processing (as one of the functions of computer 28) Can be supplied with. This capability acts as an image processor to construct from the signals received from the detector, first detecting the values of the spectral emission characteristics, and then computer images of these values and the corresponding associated field positions Is detected.
The image constructed by the image processing device is a stored matrix of points (eg, a matrix of values associated with each field position (area in the field) and values for one or more measured spectral characteristics). It can be or a map of the actual position of the field (eg the associated spectral emission values in the xy and z planes).
The computer in the apparatus also provides an identification means for identifying the PRE with selected spectral signatures from other light scattering entities in the computer image. The basis for this identification is discussed above in the discussion of their correlation with various spectral emission properties and the physical properties of light scattering entities.
Thus, for example, to identify a PRE that has a peak half-width at the peak wavelength and intensity of the selected spectrum, the generated computer image contains a matrix of all field regions and the wavelength and associated spectral peak wavelength and A width value may be provided. The discriminator then selects those regions that contain the PRE, and this spectral signature meets a particular range of emission values of these two spectra. Depending on the particular value selected, the discriminator can classify light scattering entities in the field in a number of ways to identify:
1. A PRE with a spectral signature selected from all other light scattering entities in the field;
2. PRE from non-PRE light scattering entities in the field;
3. Those selected PREs that interact with each other and those that do not interact with each other; and
4). One selected type of PRE derived from another selected PRE type in the field.
In each case, the basis of identification is for each light scattering entity in the field, peak half-width at peak position, peak intensity, or spectral emission curve intensity, peak half-width at image plane, and incident angle response. Or based on the detected value of the incident polarization response. Other above mentioned spectral characteristics are also contemplated. In particular, when the PRE has a surface-localized fluorescent molecule or Raman active molecular entity, the detection detects plasmon resonance induced fluorescence emission or Raman spectroscopic emission derived from one or more of the above molecules or entities, respectively. And these values are used as a basis for identifying such PREs from other light scattering entities. FIG. 11 shows a representative Raman spectrum of Raman active molecules present on the surface of the PRE.
The information obtained from the identification process is then used to provide information about the field. The various types of information available are discussed in sections IV-VI below. These include the following:
1. The total number of PREs of the type selected in the field. Here, the identifying step includes counting the number of PREs having a selected range value of the selected spectral emission characteristic in the constructed computer image;
2. Detection of a PRE spatial pattern with values of a selected range of selected spectral characteristics in the field. Here, the identification step includes constructing an image of the relative position of the PRE with these spectral characteristic values;
3. The distance between two adjacent PREs, in particular this distance is smaller than the Rayleigh resolution distance. Here, the detection step involves exposing the field to light of one wavelength to obtain a diffraction image of the PRE in the field, exposing the field to light of the second wavelength, and diffracting the second PRE in the field. And comparing the distance between the peaks of the two diffraction patterns;
4). Hearing changes in the environment of the venue. Here, the identification step includes a comparison of the value of the detected spectral characteristic of the PRE in the field before and after the change (eg, the change in the field derivative);
5). Detection of PRE motion in the field. Here, the detecting step includes detecting the center of the PRE diffraction pattern on the image plane as a function of time.
C4. Other embodiments
Simultaneous imaging of as many as 100 PRPs in the irradiated field can be easily and efficiently achieved using an apparatus as described above. Alternatively, the apparatus may be configured to scan continuously each region of the field with a focused light source and / or continuously detect light scatter from each region in the field according to the method described above, by fixed optics. Designed to “read” the spectral characteristics of each PRE in the field by moving the microscope stage through the defined interrogation areas, and sequentially interrogating each area to detect the selected spectral characteristic value Can be done.
In order to detect the fluorescence image, the light source is appropriately filtered for the excitation spectrum of the desired fluorophore, and an appropriate filter (not shown) is placed in the region between the
The value of the ability to compare multiple images of darkfield PRP-treated, brightfield stained and / or fluorescently stained samples (eg, cells and other entities subject to biology and medical researchers and clinical applications) is easy Can be recognized.
There are several suitable means for introducing incident light so as to establish an effective dark field condition in conjunction with appropriate means for preferentially and efficiently observing light scattered by the PRE. For a transparent substrate, the incident light is transmitted from the “object lateral surface” at the boundary near the location where the PRE is located, as shown in FIG. 3 and described in more detail below. It can be introduced in either reflectance or TIR (total internal reflection). In the latter case, the disappearing tails of the TIR light are also used to excite the PRE if they are directly outside the reflection boundary, even if such a light field distribution does not illuminate the objective lens directly. obtain.
For non-transparent substrates, the light must be incident in a manner that has minimal light to reach the objective and provides a specular reflection as close as possible. There are several means to achieve this condition. As an example, incident light can be directed to the field of view via one or more optical fibers. This fiber can be oriented so that light does not reflect off the substrate at the angle of incidence, and does not enter the objective lens of the microscope system used to image the PRE. It is also an advantage to use a commercially available DF / BF objective lens. Examples are those sold by Nikon Company, Long Island N.Y. An example of how such a DF / BF lens can be used is shown in FIG.
The objective lens of the system at the device can be made as either a reflective lens or a refractive lens. For certain PRE applications, particularly those requiring the most accurate and quick focusing of the objective lens as a function of light wavelength, reflective lenses may be preferred because chromatic aberrations can be significantly reduced. Refractive lenses, when observing light emitted by the PRE, can still show significant deviations depending on their frequency of focal length, even with careful correction of chromatic aberration. The fact that the PRE near the peak of these plasmon resonances can be of such an unusual brightness for a source sized to sub-wavelength is utilized for the evaluation of the optical component. That allows various deviations from the ideal "point source" response of the components to be observed.
The use of specific lens types that increase the numerical aperture of the objective lens is also contemplated. The PRE can be imaged using a standard “solid immersion” lens with a spherical top and a flat low surface. Such a separately intended lens is a liquid analog of a solid immersion lens (SIL) having a liquid between the cut solid immersion lens lower surface and a substrate having a substantially equal refractive index as the lens material. .
Such a lens is illustrated in FIG. The bottom
In another preferred embodiment, dark field optics is selected to optimize the signal / noise ratio of the PRE signal. This often involves improving contrast by reducing the background (non-PRE) scattered light to a minimum amount or to a minimum amount relative to the amount of PRE scattered light observed. For example, using a
Polarized incident light can also be used at a specific angle (eg, Brewster's angle) to reduce the amount of reflected light from the substrate surface. This improves contrast by reducing the amount of non-PRE scattered light entering the objective lens. When imaging an aspherical PRE, such as the ellipsoid PRE described above, the response to plane polarized incident light can also be used to identify different populations of PREs.
In another embodiment, a sufficiently thick transparent substrate is used to reduce the amount of light scattered from the bottom surface reaching the detector. If the particles are present on the bottom surface of a thin glass substrate, some scattered incident light will reenter the detection system and increase the background. Increasing the thickness of the substrate displaces additional spurious scattering regions from the optical axis, thereby reducing the amount of non-PRE scattered light entering the detector.
Total internal reflection (TIR) can also be used to illuminate the PRE on the transparent substrate from below. Such a vanishing tail of light can be effectively used to excite a PRE located near its boundary. Several methods to excite the PRE with totally internally reflected light (eg, its dimensions and the refractive index of the inner core and outer layers are sufficient on the outer surface of the fiber to excite the PRE placed on it. Use an optical fiber that is selected so that there is no field to remove. The light emitted from the PRE can be returned to the fiber to form a reflected light source that can be observed by standard methods.
In another embodiment illustrated in FIG. 5, the
This Dove prism geometry is convenient for colliding the side of the Dove prism with light coming from various sources (eg laser, quartz halogen, arc lamp, etc.) through an optical fiber or lens. Well, and filters can be conveniently inserted between them to further control the nature of the incident light.
The DARKLIGHT (TM) light source from Micro-Video of Avon, MA can also be used in the total internal reflection illumination system, but has been found to be generally inferior to the Dove prism embodiment described with reference to FIG. ing. This internally reflecting slide illuminator carries light from the halogen source to the optical fiber and then to the end of the glass slide. The light undergoes a significant number of total internal reflections while diffusing to the slide, exciting the PRE with a vanishing field as in the embodiment of FIG. This system is described in detail in US Pat. No. 5,249,077. Furthermore, the PRE can be observed through illumination as described in US Pat. No. 3,856,398.
Oil immersion lens systems can also be utilized with TIR illumination. However, the refractive index of the medium due to internal reflection in these systems must be greater than the refractive index of the oil used. Accordingly, flint glass having a refractive index of 1.7 is one preferred prism material.
FIG. 6 shows a cross section of a DF / BF objective system with a
In some applications, optical microscopy methods both optically image and analyze the PRE and observe the same PRE and associated sample material using additional instruments (eg, one or more Must be adapted to the form of electron microscopy). In these cases, dark field optical microscopy must be performed using a substrate that is also suitable for electron microscopy. As electrons pass through the sample and substrate, the substrate must be very thin (typically well below 1 μm). Typical substrates include form bar and / or carbon deposited on a support grid. Background scattering may be such that the application area of incident dark field illumination is within the grid “bar” spacing and / or limits the field of collection objective light for a portion of the sample under observation. Arrangement reduces from grid boundaries or “bars”. For BF / DF objectives and microscope systems, grids and silicon nitride films with spacings up to 400 bars per inch are particularly suitable. Other forms of dark field illumination include separate optical fibers or lenses using dark field illumination from below the grid substrate, and observation of scattered PRE light from above using a BF objective lens.
IV.PRP composition
The present invention further includes a suspension of PRP having one or more populations of plasmon resonance particles (PRP). The composition has four distinct characteristics: (i) each population PRP has a spectral half-width less than 100 nm; (ii) all single population PRP is within 40 nm of the defined spectral emission peak wavelength. (Iii) at least 80% of the PRP in the composition is in one or more populations,> 700 nm, 400-700 nm; and <400 nm spectrum in one of three ranges And (iv) each population has at most 30% overlap in the number of PRPs with any other population in the composition.
The first feature describes the quality of the PRP (high quality emission is characterized by a relatively narrow frequency range of scattered light). The second feature provides homogeneity of spectral emission characteristics of all PRPs within a given population. In particular, all PRPs within a given population have a peak wavelength within 40 nm of the defined wavelength. The third requirement provides that the majority of PRP (at least 80% in quantity) is in one of three different wavelength ranges. The fourth requirement defines the uniqueness of the population, assuming that each population has a spectral peak wavelength distribution within 40 nm of the predetermined peak wavelength. Two distribution curves cannot be closer than the distance that 30% (quantity) of one population of particles belongs in the distribution curve defined by the adjacent population.
Typically, the PRP in the composition is present in one or more populations, all in the wavelength range of 400-700 nm. The PRP can be homogeneous (eg, all blue particles) or can be present in one or more populations that collectively constitute 80% of the PRP in the composition (eg, individual red, green and blue particles) Collective).
The particles in this spectral range can be formed as solid silver particles, silver particles with gold nuclei, or particles with dielectric nuclei and an outer silver shell of at least 5 nm, as described below.
In one general embodiment, particularly for use in a variety of diagnostic applications, the particles have (i) a surface attachment ligand adapted to bind to a target ligand binding site, (i) ii) Arrange fluorescent molecules, and (iii) Raman-active molecular entities. A ligand is one member of a binding pair. Examples of binding pairs may include antigen / antibody, hormone / receptor, drug / receptor, effector / receptor, enzyme / substrate, lipid / lipid binding factor, and complementary nucleic acid strand.
The PRP in the composition may have different surface localized molecules in different groups of PRP. These different groups can be different PRP populations (ie, PRP with different spectral peak wavelengths) or can be localized to PRP in a homogeneous PRP population.
For use in the identification of targets having first and second ligand binding sites, different surface-localized molecules may have different ligand binding sites (eg, two sequences that bind to different sequence regions of a common target polynucleotide). Different ligands that are effective in binding to different sequences of oligonucleotides, or two different ligands that bind to different ligand binding sites on a macromolecular target.
PRP can be formed by various known methods. Known methods include colloid chemistry, water soluble gels, evaporation / annealing, nucleation / growth via enhancers, autoradiography, and electromagnetic energy in the form of silver halides and light, X-rays or other incident wavelengths. Photoreactions in other substances via In addition, lithography, electrodeposition, electroplating and sputtering with a scanning tunneling microscope (STM) tip can be used.
If the PRP, for example, has an attached ligand on the surface, the PRP can selectively bind to the target of interest having the other half of the ligand / ligand binding binding pair.
As mentioned above, it is also advantageous to produce populations of PRP with different defined peak wavelength values. When a defined population of PRP is combined with specific binding properties, a new class of semi-microscopic probes is created that has significant advantages over all currently used labeling techniques. The PRP formation techniques described below can be used to create such probes.
A.Formation of PRP by metal reinforcement
In this method of PRP formation, a nucleation center (typically a metal nucleation center in the 1-20 nm size range) is placed at the target location. Thereafter, the development (enhancing) of the fully conductive body of the PRP in situ is performed. In some applications, a spatially pre-specified location is designated for placement of the nucleation center. This is in contrast to other applications where nucleation centers are used to search the matrix for specific substances or features whose position is unknown. Pre-specified arrangements can be advantageous in metrology and / or instrumentation applications as described further below. For example, it may be desirable to place a single PRP at the end of an optical fiber or at the tip of a scanning microscope. It may also be desirable to create a predetermined pattern of PRP in a particular geometry.
Since the creation of PRP with controlled spectral characteristics is frequently desired, augmentation can be advantageously performed while monitoring, stopping the process when a PRP with some predefined spectral characteristics is formed. This is particularly convenient when enhanced chemistry that is not affected by light is used. By periodically ending the enhancement process, observing the properties of the formed entity, and if one or more spectral properties (eg, color) are not within the desired range, for example, by reinitiating the enhancement process It is also possible to monitor PR formation.
The nucleation center is typically gold particles with a diameter of 1-10 nm, and the metal used to enhance this nucleation site to the PRP size is silver. However, other elements including macromolecules such as, for example, platinum, nickel, and palladium, and polynucleotide molecules are also contemplated as nucleation centers for subsequent enhancement processes. Non-metallic materials can also be used as nucleation centers (eg, proteins and nucleic acids).
In order to produce PRP with the desired shape and properties, the arrangement of nucleation centers can be controlled. For example, triangular or elliptical regions of nucleation material can be formed. The deposition process involves many metal deposition techniques known in the art (eg, vapor deposition, sputtering, thin film Ga-focus ion beam (FIB) mill prepared from the desired material, and electroplating into nanopores). Can be included. In particular, well-controlled nucleation material placement is possible by releasing the nucleation material from the metal tip of a scanning tunneling microscope. A technique has been developed in which individual metal atoms are picked up at the tip of a scanning tunneling microscope, moved, and lowered to a desired position. Individual atoms can also be “pushed” into the desired position with the tip of a scanning tunneling microscope. The technique can be used, for example, to place 10 gold atoms at spatially pre-specified positions for use as a nucleation center.
In one embodiment, using standard micromanipulation techniques, introduction of a PRP or PRP nucleation center at the tip of a drawn micropipette, movement of the PRP or PRP nucleation center to a desired position, and PRP PRP or PRP nucleation center is placed at the desired location by depositing at the desired location. The pipette tip is filled with the desired substance in a solution with various viscosities (ie using gelatin or other matrix), and then the tip is manipulated to a selected position while observing under a microscope. Is done. By applying pressure to the solution in the pipette, a very small amount can be deposited on the desired substrate. Other micromanipulation techniques are also possible.
Since PRP materials have a positive dielectric constant at frequencies above the resonance frequency, they use a principle similar to that currently used for plastic particle optical traps to optically metal particles in a focused light beam of the appropriate wavelength. You can trap. Accordingly, the PRP can be placed at a spatially pre-specified position by manipulating the light beam on which the PRP is trapped. Gel conduits can also be created to electrophoretically deliver the PRP to a spatially pre-specified location. When the conduit is positioned to pass proximal to the specified location, the PRP in the conduit moves under the influence of the electric field and is directed to the specified location. Electrostatic coupling techniques can also be used to removably attach the PRP to spatially pre-specified locations.
In one embodiment, an array of one or more conductive pads having a diameter of about 10-100 microns can be created using standard integrated circuit lingraph techniques. Each pad can further be selectively connected to a voltage source. Since PRP in solution is negatively charged, applying an appropriate potential to the pad will attract PRP from the solution to the conductive pad. If the surface binding force between the PRP and the pad is weak (ie, approximately 1 piconewton), removing the voltage and reversing the sign of the applied potential can release the PRP.
The conjugated nucleation center and / or the conjugated PRP also immobilizes the other half of the conjugate pair in a spatially pre-specified position and attaches the conjugate or PRP on the nucleation center to the conjugate pair. By combining with the other half, it can be placed in a spatially pre-specified position.
Individual nucleation centers (or fully formed PRP) also eject droplets of liquid containing metal particles onto the substrate and evaporate the liquid by techniques similar to those used in ink-jet printing. That can be deposited. In this technique, one or more metal particles can be delivered to a specific location defined by the drop location. In some embodiments, the concentration of PRP or nucleation center in the liquid is statistically selected such that one PRP or nucleation center is likely to be included or not included in each drop. Is done. If a nucleation center is deposited, the nucleation center can subsequently be silver enhanced to form PRP. It is further noted that these techniques can be used to create the desired geometric pattern of the PRP. When creating such a pattern, the drip can be redeposited at a location where no PRP was ejected during the first pass. Those having such PRP patterns may be useful for object identification, semiconductor mask registration, and usage described in more detail below.
As defined herein, the term “in situ” indicates that the PRP is bound to the substrate, immersed in a solution, or suspended in a matrix. The definition of “substrate” is discussed below. “Substrate” refers to any entity that can be associated with PRP such as tissue sections, cells, TEM grids (eg, formvar, silicon (including silicon nitride and silicon dioxide), mica, polystyrene, etc.) Is mentioned. These nucleation centers are typically colloidal gold preparations, and suitable populations of nucleation centers are commercially available either in free form or attached to various biological molecules.
Silver enhancement of gold nucleation centers is currently being performed to produce larger silver masses that may be visible under electron and / or light microscopy. And several procedures for imaging biological systems using silver-enhanced gold particles have been extensively developed. Therefore, the enhancing reagent and the nucleation center itself are commercially available. Gold nucleation centers bound to antigens are available from several sources. Sources include EY Laboratories (San Mateo, CA) and Amersham (Arlington Heights, IL). In addition, a large body of literature describes various suitable ways of performing such enhancements (see, eg, MAHayat, Immunogold-Silver Staining-Principles, Methods, and Applications, CRC Press, 1995, The disclosure is incorporated herein by reference in its entirety, in
The enhancement process preferably involves the formation of a gold nucleation center with a solution of a silver salt (eg, silver acetate, silver lactate or silver nitrate) and a reducing agent (eg, hydroquinone in a citrate buffer having a pH of about 3.5 to 3.8). It is carried out by mixing. It was appropriate to provide a silver salt concentration of about 6 mM and hydroquinone concentration of about 33 mM. Commercial silver enhancement solutions containing appropriate amounts of silver and reducing agent are commercially available, for example, from BBI (UK). Those skilled in the art will appreciate that the selection of buffer systems, silver salts, reducing agents and other enhancement parameters are preferably optimized for local environment, target location, etc., and such optimization can be done without undue experimentation. And understand.
In accordance with one aspect of the present invention, PRP useful in the present invention is prepared with silver enhanced nucleation centers until the particles have the properties of plasmon resonance particles. Most preferably, the silver enhancement parameters are controlled so that the generated PRP has a predefined spectral characteristic such that it represents a particular desired color when viewed with dark field microscopy. During enhancement, spectral characteristics can be observed, one individual evolving PRP or several individual PRPs simultaneously. Thus, a PRP having specific physical properties can be created and placed at a desired location. In addition, the PRP nucleation center can be placed at a desired location, either in situ, in vitro or in vivo. Thereafter, PRP is produced by silver enhancement at that specific position.
B.Specific examples of PRP (or PRE) formation by metal enhancement
PRP was prepared by silver enhancement of gold nucleation centers as described in the examples below.
Example 1
Placement of colloidal gold on the substrate
The Alcian blue method is a method for attaching gold colloid nucleation centers to a substrate by chemically treating one or more spatially specified portions of the substrate in advance. Alcian blue is a positively charged dye that promotes the adhesion of negatively charged gold colloids through charge interactions. Substrate portions where PRP is not desired can be coated with a blocking agent such as BSA. A 100 microliter drop of 100: 1 dilution of 5% acetic acid and 2% alcian blue was placed on a carefully cleaned glass slide for 10 minutes. The active site of the substrate was then immersed in double distilled water, rinsed and then dried.
Gold colloid was diluted to the desired concentration. The solution was placed in the Alcian blue treated area of the substrate and incubated for 10 minutes. The substrate was then rinsed with distilled water.
Gold colloid attached to the substrate was enhanced by the method described in Example 2.
Example 2
Silver enhancement of individual gold nucleation centers
1 ml of a 0.1 mg / ml solution of gelatin was mixed with 50 μl initiator and 50 μl enhancer in an Eppendorf tube. Initiators and enhancers were obtained from BBI International (UK) silver enhancement kit, light microscope (LM) version, catalog number SEKL15. The substrate was immediately covered with the enhancer solution and time measurement was started. The substrate was then observed under dark field illumination to determine if PR was present. The approximate enhancement time of the colloid on the glass, silicon, or TEM substrate was about 1 minute, while the approximate enhancement time of the conjugate colloid deposited on the biological substrate was about 7 minutes. These times were determined by continuously observing the scattered light from individual extended PRPs under dark field microscopy while the enhancement occurred. It can be appreciated that the exact enhancement duration can be utilized to control the scattering response and thus the color of the PRP produced. The enhancement was stopped by rinsing thoroughly with distilled water.
Example 3
Formation of PRP in solution
For uncoated colloids, 100 μl of stock gold colloid (BBI International, UK) was added to 20 ml gelatin solution (0.1 mg / ml). For protein-conjugated colloid, 100 μl of stock-conjugated gold colloid was added to 20 ml of double distilled water with 1% bovine serum albumin (BSA) to block the surface. The conjugated colloids used were bovine serum albumin, goat anti-biotin and rabbit anti-goat IgG. Typical gold colloid concentrations are as follows:
About uncoated colloids:
3nm stock-about 3x10¹³Particle / ml
10nm stock-approx.5.7 x 1012Particle / ml
20nm stock-approx. 7 x 10¹¹Particle / ml
About protein-conjugated colloids:
1nm stock-approx. 2x10¹⁵Particle / ml
5nm stock-approx. 1.7 x 10¹⁴Particle / ml
10nm stock-approx. 1.7 x 10¹³Particle / ml
20nm stock-approx. 2x10¹²Particle / ml
Three drops (150 μl) of initiator were then added. Then, 10 μl increments of enhancer were added with stirring until an amount corresponding to the desired PRP scattering peak wavelength was added. PRP resonances were checked by dark field measurements or absorption spectroscopy as previously described.
C.PRP and PRE formation by lithography and irradiation
Lithographic techniques can be used to identify the formation site of PRP (or PRE) and control its shape, morphology, and composition. Both positive and negative resist methods can be utilized to place either the nucleation center or the fully formed PRP underneath. In the positive resist method, a portion of the resist layer is removed to form a mold, and a metal is deposited in the mold. After such deposition, the resist and excess metal are lifted off, leaving behind a nucleation center or fully formed PRP. In the negative resist process, a selected layer of silver or other suitable metal is coated with a layer of resist. Next, the resist layer portion is polymerized. When using this technique to form nucleation centers, the intrinsic size of the polymerization region may conveniently be about 5-20 nm. In order to place a PRP below whose peak wavelength is in the optical spectrum, the intrinsic size of the polymerisation region is advantageously between 4 and 125 nm. The silver and non-polymerized resist are then removed by etching, leaving a metal nucleation center or fully formed PRP below the polymerized region of the resist. As another alternative, the metal mold can be made larger than desired and the material can be etched away by ion milling until a PRP of the desired characteristics is formed. All of these techniques are used in electronics and other industries and are well known to those skilled in the art.
In addition, metal salts and halides (ie, in the film) can be irradiated to obtain nucleation centers or whole grains. The enhancement can be performed by the techniques described above, or by thermal annealing of the metal particles, or a photochemical metal salt or metal halide film is irradiated locally with light until PRP is produced, The film can then be fixed and developed as practiced in the photographic development process. There are several ways in which a localized spot of light can be created to form the nucleation center or PRP at the desired location. In one embodiment, a tapered fiber “near field” scan tip coated on the metal side is used to help limit nucleation to an appropriate small size or to grow silver particles directly. Can produce highly localized spots of light. Alternatively, prefabricated custom fiber optic chips with PRP at the ends, preferably about 150 nm in diameter, concentrate the light at the desired location to “draw” these nucleation centers on the photosensitive surface material. In another embodiment, a solid-immersion lens may be utilized to focus the light on the metal salt or halide. In order to further enhance the local illumination of the substrate, the solid-immersion lens may include PRP at its focal point.
Photochemical silver salts or halides are also sensitive to electron and ion beam irradiation, as well as irradiation from radiation elements. It will be appreciated that these photographic methods can also be used to generate an array or pattern of PRP in a desired arrangement.
Whether the PRP being developed is in solution or bound to the substrate, the enhancement process can be observed in situ with a dark field microscope and once the PRP has reached the desired size corresponding to a particular color. Once reached, the process may stop. During the photosensitivity enhancement procedure, the enhancer can be removed by washing, the progress of the enhancement process can be measured by observing the light scattering properties of the generated particles, and enhanced until a PRP with the desired spectral properties is obtained You can resume. In an alternative embodiment, a relatively light insensitive enhancer can be used and the enhancement process can be observed by continuous dark field illumination and scatter data collection. Of course, once a specific protocol has been developed that shows the amount of enhancer, incubation time, etc. to generate PRP with the desired properties, observation of the enhancement process is unnecessary.
D.Conjugated PRP formation
As shown in Example 3 above, it is possible to enhance nucleation centers bound to biological macromolecules such as antibodies. This enhancement of conjugated gold antibody can be performed successfully even when the conjugated gold / antibody is present in an aqueous solution or is not pre-bound with the antibody in a cell or cell organelle. . Surprisingly, after silver enhancement of free conjugated gold nucleation centers to produce PRP, a significant portion of the conjugate molecules originally present in the gold colloid binds to the resulting PRP at the surface. Has been found to do. In addition, biological molecules can retain biological activity after the enhancement process.
With respect to this method, the amount of conjugate bound on a given PRP can be controlled by controlling the size of the nucleation center bound to the conjugate. For example, a commercially available 1 nm diameter nucleation center can have only one conjugated molecule and can be silver enhanced to form a PRP with its conjugate molecule attached to its outermost surface. The 20 nm nucleation center has a correspondingly large number of attached conjugates, some of which will bind to the surface of the silver enhanced PRP. During silver enhancement, PRP bound to the conjugate can be incubated with a blocking agent such as bovine serum albumin (BSA) to reduce the presence of non-specific binding sites on the surface of the PRP.
In another embodiment, the conjugate is added to the PRP after making the PRP. The conjugate binds to PRP either covalently or non-covalently. For example, fully formed PRP can be prepared using gelatin, agar, polytetrafluoroethylene (Teflon) to prevent non-specific charge interactions.TM), Coated with PVP, or latex, and then one or more functional groups are covalently attached thereto by well-known methods, thus producing PRP attached to the first half of a particular conjugate pair. All reagents required to bind the conjugate to the immunogold nucleation center or the formed PRP are all commercially available.
The present method of forming PRP bound to the conjugate also allows control of the number of conjugate molecules (ie, “first half” conjugate pairs) bound to the PRE surface. In this case, naked PRP can be incubated in a blocking agent solution such as conjugate and BSA. The relative concentrations of conjugate and BSA can be adjusted to produce, on average, the desired amount of conjugate on each PRP. For unusually shaped PRPs or PRPs containing concentric shells of different materials, it is typically more convenient to coat with a conjugate after formation. However, PRP bound to the conjugate, which is approximately spherical, can be conveniently produced from a colloidal gold nucleation center and a silver enhancer bound to a commercial conjugate as described above.
Conjugates or other molecules can be bound directly to the metal surface of the PRP. The surface chemistry involved in such binding is complex, but is currently extensively developed in many non-PRP immunogold silver staining techniques. Alternatively, PRP can be coated with a shell of plastic material, such as latex, prior to attachment of additional molecules such as conjugates. Techniques for attaching molecules to latex are also known. Molecules that bind directly to the metal or to the plastic shell can be the conjugate itself, or other intermediate reactive groups such as sulfides, amides, phosphates, aldehydes, carboxyls, alcohols, or conjugates or other It can be another substance to which the molecule of interest can bind. Conjugates or other molecules of interest can be synthesized on such reactive basis using known methods of combinatorial chemistry.
E.Formation of PRP population with desired characteristics
The difference in emission spectra for two separate PRPs, as shown in FIG. 1, can arise from a number of factors. One critical factor is size, the larger the size of the particle, it has a resonance peak at longer wavelengths and also has a spectral shape with an increased half-wave width value. Thus, control of the size of the generated PRP is control over several spectral characteristics.
Thus, controlled amounts of enhancer addition can produce a population of PRP having a narrow diameter range, and thus a relatively narrow resonance peak frequency range, as illustrated in FIG. 2 for the four types of PRP. It can be appreciated that in some advantageous PRP generation methods, the particles can be observed using an appropriate microscope during the enhancement process. These methods use enhancement chemicals as described herein that are relatively unaffected by the incident light required to observe the extension of PRP during the enhancement process. Thus, the extension of PRP can be observed and stopped when the desired end point is reached. For applications where it may be desirable to use a photosensitivity enhancement process, or when extension outside the microscope is desired, continuous enhancement by time measurement is performed. Samples are rinsed after each application and the state of PRP light scattering is determined. The desired number of continuous enhancement processes can be continued.
As indicated above, the PRP composition according to the present invention comprises one or more PRP populations having a peak wavelength of 40 nm of a defined wavelength. Such homogeneity in the PRP population is possible by stepwise addition of enhancers, coupled with dark field observation of PRP generation as described above. Since the width of the plasmon resonance peak is typically 20-40 nm, it is generally not necessary to further reduce the dispersion at the resonance peak of the PRP population.
Alternatively, a population of PRP with uniform spectral characteristics can also be prepared by purifying a heterogeneous population. PRP conjugate and free PRP can be separated by conventional biochemical methods including column chromatography, centrifugation, electrophoresis, and filtration. Since PRPs with surface-localized molecules or entities can have a mobility that is significantly different from the mobility of free PRP of the same size, they are removed from the gel filtration column at a different rate than the free PRP elutes. Elute. Since PRP are charged particles, they move in an electric field. Thus, PRP can be manipulated during electrophoresis and further observed.
PRPs with certain desired properties can also be separated based on zeta potential. Zeta potential separators suitable for this use are commercially available (Coulter Corp., Florida). Radiation pressure can also be applied to pass the PRP through the matrix at different rates based on its structural properties. When bound PRP and free PRP are subjected to electrophoresis on, for example, agarose or acrylamide gels, the free PRP moves faster than the bound PRP moves. Similarly, PRP conjugates can be preferentially retained by filters. Alternatively, purification can be performed by centrifugation. Thus, these methods can be used to separate the original PRP population with a broad range of spectral characteristics into subpopulations with a narrower range of spectral characteristics.
Individual populations of PRP can be prepared separately and later mixed according to the desired combination of PRP properties (eg color) in the desired amount, each using the same or different biological macromolecules depending on the application Labeled or not labeled. In such compositions, it is preferred that the resonance peaks of the different populations of PRP do not substantially overlap as defined above. In some preferred embodiments, the dispersion at the peak position of one population of PRP is controlled to be within about 20 nm of one defined wavelength, and the dispersion of the peak position of another population of PRP within the mixture. Is controlled within about 20 nm of the second defined wavelength. In order to avoid significant overlap, it is preferable to ensure that the two peak wavelengths are at least 30-40 nm apart and most preferably 50 nanometers apart.
By applying the above method, a new type of molecular probe can be generated by binding a selected conjugate to a selected PRP. As described above, to generate two distinct PRP populations with different selective binding characteristics, a PRP population with a first spectral characteristic is bound to a first conjugate and a second spectrum A PRP population with characteristics can be combined with a second different conjugate. Such pre-defined mixtures of PRP are particularly useful for improving the detection accuracy of small quantities of molecules, as further described below.
F.Isolated non-spherical and composite PRP
The emission spectrum of PRP is further influenced by details of its structure. Elliptical PRP provides additional parameters for identification and discrimination. Each elliptical PRP may have 2 or 3 plasmon resonance peaks, depending on whether there is one isotropic axis or three different principal axis dimensions, respectively. An elliptical PRP with one isotropic axis shows peaks corresponding to two orthogonally polarized emissions, one associated with plasmon excitation along the major axis of the ellipse and the other with plasmon excitation along the minor axis. Accompanying. A separate plasmon resonance peak appears at maximum intensity when the incident light bias is along the corresponding principal axis. Thus, the response of the fixed elliptical PRP to polarized light can vary with the direction of incidence.
The process of making elliptical silver particles consists of pulling on a glass matrix containing spherical PRP at a temperature such that the viscosity results in the extension of the PRP into oblong particles having the desired flatness. The conditions for “squeezing” such particles and, as a result, forming oblate elliptical particles are also described. PolarcorTMOne elliptical PRP containing the matrix (Corning Company, Corning, NY) consists of elliptical PRPs arranged in a glass matrix. This composite material is an effective polarizer for a specific optical frequency, mainly red or higher. Individual oval PRP contained within such a glass matrix can be isolated by dissolving the matrix in a manner that does not interfere with the PRP. By preparing oval gold particles of the appropriate flatness and size in an appropriate matrix and then dissolving the matrix in a manner that does not interfere with the particles, a large amount of elliptical PRP with nearly equivalent plasmon resonance scattering properties is obtained. For example, for use in liquid reagent preparation for biochemical assays as described in detail below.
Other methods can be used to prepare elliptical PRP. Elliptical PRP can be generated via photoreaction of silver halide or using a suitable lithographic mold. Alternatively, the initially substantially spherically shaped PRP can be pressed or rolled to collapse to the desired oblong or oblong profile between the two surfaces.
It is observed that non-spherical and non-elliptical PRPs have characteristic spectral signatures different from spherical or elliptical particles, and are useful for making plasmon resonance probes with advantageous size and scattering properties. It has been found that PRP that is strongly scattered in the blue region can be easily generated by generating spherical silver particles. As discussed above, the resonance peak shifts red with increasing particle diameter. However, for spherical particles, as the peak shifts to red, the peak intensity of the scattered light begins to decline, and thus the generation of strong red scatterers by spherical particles is much more difficult compared to strong blue scatterers. . However, other geometrically shaped particles can produce strong scattering at longer wavelengths. These three types of particles are triangular, square, and approximately hexagonal in cross section. Triangular, square, and hexagonal silver particles can be produced, for example, via photoreaction of silver halide or using a suitable lithographic mold. Isolated hexagonal particles, similar in size to blue spherical particles, typically have a green plasmon resonance peak. Of particular interest are isolated triangular particles that can have characteristic dimensions of 50-150 nm. Because they often show resonance peaks in the red part of the visible spectrum. The generation of a triangular PRP has been found to be one suitable way to obtain a PRP that appears in red. Specific examples of red triangular particles and blue spherical particles are discussed below with reference to FIGS. It is also possible to form various plasmon resonant particle shapes by bonding small spherical metal particles to pairs or other aggregates.
In addition, PRPs having concentric shells made of dielectric and conductive materials can be prepared. In these embodiments of PRP, the plasmon resonance peak can be converted to a desired frequency. In particular, the core or outer shell tends to red shift the resonance peak and produces a relatively strong scatterer, so the addition of a dielectric material can make a PRP. For this reason, red PRP can be advantageously produced with such dielectric shell or core encapsulation. Particles having a dielectric core and an aluminum shell have been found to have a plasmon resonance peak at about 240-280 nm in the ultraviolet region.
Particles consisting of three layers comprising a dielectric core / metal shell / outer dielectric shell can be useful for further flexibility in changing peak resonance and scattering intensity. Furthermore, a PRP having a plurality of concentric conductive shells can be made. Since each shell has a different diameter, complex scattering spectra often containing several separate peaks can be generated. These peaks can shift with variation in the dielectric material separating the conductive shells. As described in more detail below, a dielectric outer shell comprising a latex, Teflon, or other polymer coating is also useful as a substrate suitable for bonding the polymer of interest to the exterior of the PRP.
Although the production of PRP with multiple shells of conductive and dielectric materials can be more complex, they can be manufactured using various film deposition techniques including chemical vapor deposition or sputtering. Another method for making multi-shell PRP embodiments is described in Birnboim et al., US Pat. No. 5,023,139, supra.
A PRP having a dielectric core and an outer metal shell can also be produced using non-electrodeposition plating techniques. In this process, for example, the core particles composed of latex are activated on the surface by metal atoms, which can be platinum atoms. By using an enhancement procedure as described above, these platinum atoms contain nucleation centers for silver enhancement and shell formation around the latex core.
The PRP composition may also include, but need not include, all of the limitations of (i)-(iv) in the PRP composition just described, including the general methods disclosed in Section III herein. As contemplated herein as a novel PRP composition for use in the various applications discussed in.
Two-ligand composition. The composition comprises two populations of PRP, each having a different ligand species carried on the PRP surface. The two ligands are designed to bind to different ligand binding sites on the target. The two PRP populations can have different spectral characteristics.
Fluorescent reporter composition. The composition includes a PRP having a surface attached ligand for binding to a target ligand binding site. The composition is an extremely sensitive “partial” reporter in that the fluorescence emission excited by the plasmon resonance spectrum emission of the binding particles acts to converge the excitation light to the site of the fluorescent molecule. The compositions can also be sensitive to the target environment if they are designed to include fluorescent quenching molecules or fluorescent energy transfer molecules.
Fluorescence quenching or energy transfer. The composition comprises two populations of PRP, each having a surface attachment ligand (which may be the same or different) for binding to two sites in the vicinity of the target. Each population contains surface-localized fluorescent molecules that cause fluorescence quenching when placed in the vicinity, or donor and acceptor fluorescent molecules for non-irradiation energy transfer when placed in the vicinity. Containing fluorescent molecules. The composition is useful, for example, in a homogeneous assay for detecting targets having first and second nearby ligand binding sites.
PRP with Raman active entity. The composition comprises a plurality of PRP populations, each having a different Raman-active entity localized on the PRP surface. Each population may include additional surface-localized molecules (eg, oligonucleotides or combination library molecules having different base sequences), where the identity of each surface-localized molecule is a known unique Raman spectrum. It is associated with a Raman-active entity (eg, molecule) that has a signature. The composition is used, for example, to identify compounds in a combinatorial library that are (i) formed on PRP according to standard bead synthesis methods, and (ii) identified as having the desired compound activity. The
As another example, the composition is used for chromosome mapping, where the relative spatial location of a known sequence region (eg, EST or SST) is (i) a unique Raman spectral signature. Attach to each PRP an oligo sequence fragment complementary to one of the chromosomal sequences, (ii) hybridize the probe with chromosomal DNA, and (iii) bind to the DNA from the unique spectral signature of each PRP Is determined by identifying the relative position of the PRP. By placing the DNA in extension conditions as described above, the mapping distance separating the sequences can also be determined.
FIG. 13 shows the binding of DNA sequence-tagged PRE to the Drosophila polytene chromosome, illustrating the ability to localize the PRE to the chromosomal region.
V.Diagnostic methods and compositions
The diagnostic methods of the present invention are intended for use in determining the presence or information of a target having a molecular feature of interest. The method is preferably according to the method and apparatus described in Section III, and preferably using the PRP described in Section IV, where the PRP has a surface-localizing ligand. Implemented.
In carrying out the method, the target is contacted with one or more PREs having surface-localized molecules to produce an interaction between the molecular features and the localized molecules. This interaction is (A) the binding of PRE to the target binding site via, for example, a ligand / ligand binding interaction to generate a PRE / target complex, (B) a spectrum demonstrating the PRE / PRE interaction. Binding of two PRPs to closely spaced target sites to generate a feature, (C) Breaking the connection between two PREs to generate an unlinked PRE, (D) Detection To modify the Raman spectrum of a Raman-active molecule on the PRE in a possible manner, for example, binding of the PRE to the target via a ligand / ligand binding interaction, (E) a fluorescent molecule on the PRE in a detectable manner To alter the intensity of fluorescence emission of (eg, quench or enhance), for example, binding of PRE to a target via a ligand / ligand binding interaction, and (F) to generate a bound PRE Formation of connections between PREs, including That.
The target is illuminated using an optical light source in a manner that allows measurement of one or more selected plasmon resonance spectral emission characteristics, as detailed in Section III. The presence or information about the target is then determined by detecting the plasmon resonance spectral emission characteristics of one or more PREs after such interaction with the target.
The PRE used in this method is preferably a ligand / antibody, hormone / receptor, drug / receptor, effector / receptor, enzyme / substrate, lipid / lipid binding factor, and complementary nucleic acid chain, such as a complementary nucleic acid chain. PRP constructed as described above to include a surface-localized molecule that is one of the ligand binding site-conjugate pair. If the detected spectral emission characteristic is related to a shift or change in Raman spectral characteristic or fluorescent spectral characteristic, the PRP also includes a surface-localized fluorescent active molecule or a surface-localized Raman active molecule entity, respectively. The PRP used may have the quality and homogeneity attributes of the PRP composition disclosed in Section IV, or may have a less stringent homogeneity attribute.
Since the PRE probe is extremely sensitive (as described above, a single PRE can be observed and spectrally analyzed), the method is made extremely sensitive (up to one event) to the amount of target analyte. obtain. This will scale down earlier detection of pathogens in body fluids, detection from lower fluid volumes, and many current diagnostic tests, including earlier detection of HIV, tumor markers and bacterial pathogens Is possible.
A.Binding of PRE to the target binding site
In this general embodiment, a PRE with a surface ligand molecule is contacted with a target under conditions that lead to PRP binding ligand binding to a ligand binding site on the target to produce one or more PRE / target complexes with the target. Form the body. Typically, the measured spectral emission characteristics are invariant with complex formation. That is, neither the spectral emission effect in the vicinity of PRP / PRP nor the change in spectral emission characteristics caused by the interaction of PRP with the target was observed.
Typically, in this embodiment, the target to be analyzed is immobilized or competes for an immobilized binding site. After PRP binding to the solid phase, the immobilized surface, the solid phase is washed to remove unbound PRP before irradiating the target and detecting the plasmon resonance spectral properties of the target complex. A PRE in contact with a target may comprise two or more populations, each having a different ligand, and preferably each having a different ligand (eg, blue particles for one ligand and red particles for the other). With different spectral signatures associated with As detailed below, this embodiment has the following applications:
(I) detection of the presence of the target analyte, where the analyte is immobilized, competes with the immobilized binding agent, or can be separated from unbound PRP in the contact mixture One of the following:
(Ii) in situ hybridization of a PRP-oligonucleotide conjugate with a DNA target to isolate the PRP at the sequence hybridization site;
(Iii) mapping of spatial features of the target (eg, placement of specific binding sites on target cells or tissues for chromosomal mapping, or within a DNA target);
(Iv) In situ labeling of the target, eg, in Southern blotting, where probe-labeled PRP is directly bound to a DNA fractionation gel for identification of separated DNA bands.
The following examples illustrate various assays that bind PRP with surface attached ligand molecules to immobilized target tissue for the purpose of detecting spatial characteristics of binding sites and / or density of binding sites.
Example 4
PRE labeling of ryanodine receptor in chicken muscle.
Frozen chicken intercostals fixed in paraformaldehyde were cut into 2-3 μm sections and transferred to prepared coverslips (Cell Tak coating spots in Pap pen wells). Tissue sections were washed 3 times with PBS for 5-10 minutes each time. Non-specific binding sites were blocked by incubating with 3% normal goat serum, 1% gelatin, 0.01% Triton X-100 in PBS for 20 minutes. The coverslips were washed with a 1: 3 dilution of blocking buffer (working buffer) for 5 minutes and then incubated for 1 hour in a 1: 5 dilution of mouse anti-ryanodine monoclonal antibody (34C) in working buffer. . The coverslips were then washed 6 times, 3-5 minutes each time with working buffer, then 1:40 of 5 nm or 10 nm gold particles conjugated to goat anti-mouse IgG (AuroProbe EM, Amersham). Incubate with dilution for 30 minutes. The coverslips were washed 3 times with working buffer for 3-5 minutes each and then 3 times with PBS for 3-5 minutes. Samples were washed 3 times in double distilled water for 2 minutes and then silver enhanced for 8 minutes using 50 μl initiator, 50 μl enhancer (IntenSE M Silver Enhancement kit, Amersham) and 1 ml 0.1 mg / ml gelatin. . Samples were washed 3 times with double distilled water for 3-5 minutes, covered with Gelvatol anti-fading medium and visually observed under a dark field microscope. Individual PREs containing ryanodine receptors were observed at regular intervals along the muscle Z-line. The results are displayed in FIG.
Example 5
Binding of PRE to DNA on nitrocellulose.
A 1 cm × 3 cm piece of nitrocellulose membrane was cut and the top surface was marked with a pencil at one end to identify the DNA surface. Biotin-labeled DNA (100 ng) was pipetted onto one end of the marked nitrocellulose surface. Non-biotin labeled DNA (100 ng) was applied to the other end as a control. Nitrocellulose was placed in a desiccator to dry the DNA spot and then cross-linked with UV light. Nitrocellulose with DNA surface up, placed in a small parafilm dish and protected from evaporation in blocking solution (50 mM sodium phosphate, 150 mM NaCl, 2% BSA, 1% Tween-20) at room temperature for at least 4 hours Incubated in a 100% humidity chamber. Goat anti-biotin immunogold conjugate (Nanoprobes, Inc., Stony Brook, NY; approx. 1 × 10⁸Colloid) was added and the incubation was continued for 2 hours at room temperature. The immune gold conjugate was removed, blocking solution (500 μl) was added and the nitrocellulose was washed at room temperature for 1 hour. The blocking solution was removed and the filter was rinsed thoroughly with double distilled water. Double distilled water (2 ml) was added to the washed filter for 30 minutes. After removal of water, 1 ml enhancer solution (1 ml 0.1 mg / ml gelatin, 50 μl initiator, 50 μl enhancer; enhancer and initiator obtained from BBI International, UK, Ted Pella catalog number SEKL15) is placed on nitrocellulose for 8 minutes. It was. The enhancer solution was then washed thoroughly with distilled water. Nitrocellulose was placed on a filter paper with the DNA side up in a desiccator and allowed to dry for 1 hour, then placed on a glass slide with the DNA side up and covered with a cover glass. Slides were placed in an acetone vapor chamber for 20 minutes or until the nitrocellulose was clear. The PRE was observed using a dark field microscope. A high density of PRE was observed at the spot where biotin labeled DNA was spotted, compared to the low density of PRE elsewhere on the nitrocellulose, including the spot where non biotin labeled DNA was spotted. The same experiment also successfully detected biotin-labeled DNA when using fully formed PRE conjugated to goat anti-biotin.
Example 6
Binding of PRE to DNA in polystyrene cell culture dishes.
Double row water (150 μl) and 1 M NaHCO in one row of wells in a 48-well culture dishThree(17 μl) was added. Neutravidin (10 μg) was added to each dish followed by overnight incubation. All incubations were performed at 4 ° C. and 100% relative humidity. Neutravidin was removed and the wells were thoroughly rinsed with double distilled water. 150 μl of blocking buffer (50 mM sodium phosphate, 150 mM NaCl, 2% BSA, 1% Tween-20) was added to each well and then incubated for 4 hours. Starting from the second well, 1 μg of biotin-labeled DNA was added to the blocking buffer. In subsequent wells, a 10-fold dilution of biotin-labeled DNA was sequentially added (0.1 μg, 0.01 μg,...) And the plate was incubated for 4 hours. Biotin-labeled DNA was removed and the wells were thoroughly rinsed with double distilled water. Blocking buffer (above buffer, 150 μl) and approximately 108Goat anti-biotin-conjugated immunogold colloid was added to each well and incubated for 4 hours. The immune gold colloid was then removed, the wells were thoroughly rinsed with double distilled water, and 100 μl enhancer solution was added to each well for 7 minutes to enhance the colloid. The enhancer solution was removed, the wells were thoroughly rinsed with double distilled water, and the wells were dried with dust-free compressed air. A dark field microscope was used to determine the PRE concentration in each well. The PRE concentration correlated with the DNA concentration in each well. The same experiment also successfully detected biotin labeled DNA when using fully formed PRE conjugated to goat anti-biotin.
Fluorescence in situ hybridization (FISH) can be performed using PRE instead of fluorescent labels (PRISH). In this method, the PRE-labeled oligonucleotide is incubated with the DNA molecule of interest. If a complementary sequence is present on the PRE-binding oligonucleotide, the bound PRE can be observed. Alternatively, two PREs, each attached to a different oligonucleotide, are incubated with the DNA molecule of interest. When there are gene deletions associated with certain disorders and PREs bind on either side of the deletion region, they can be much closer in deletion versus wild type. In this method, PRE binding pairs can be detected by modifying scattering parameters or observing PRE correlation pairs of either the same or different spectral characteristics. PRISH allows the detection of selected genomic regions due to smaller defects or increased localization. Using an appropriately conjugated PRE, the bound PRE can be observed at several positions along the nucleic acid strand, which provides information about several sites at once. As detailed above, distance measurements can also be made. As illustrated in FIGS. 7 and 8, a 230 nm distance between PREs corresponding to about 640 base pairs can be easily analyzed to an accuracy of only 10 nanometers or less using an optical microscope. In addition, PCR enhancement can also be used with the PRE hybridization test, but in contrast to FISH, which usually requires enhancement, the use of PCR or other enhancement steps is unnecessary. Genetic deletions and mutations can also be detected using a ligase that joins two adjacent strands of a PRE-coupled nucleic acid. If the PRE coupling strand hybridizes in close proximity, denaturation results in the free strand of nucleic acid coupled to a pair of PREs. These binding pairs can then be observed as described above. If the strands hybridize at sites that are too close or too far apart, a ligase reaction will not occur and a binding pair will not be formed. When PRE is coupled to a hybridizing strand of nucleic acid, a PRE binding pair can also be generated by a PCR method and a standard PCR method is used to amplify the amount of target nucleic acid present.
In all of these procedures, the PRE can be conjugated to the oligonucleotide either before or after the oligonucleotide is bound to the target nucleic acid. Furthermore, such tests can be performed in vitro or in cells. Selective PRE hybridization is also advantageously applied to screen multiple nucleic acid-containing sample wells containing libraries of different nucleic acid sequences. Such sample wells can be provided in library chip arrays or standard multiwell dishes.
The PRE can also be coated with antibodies for use in assays similar to enzyme-linked immunosorbent assay (ELISA) detection of various macromolecules. In one advantageous embodiment, a multiwell dish (ie, a 96 well microtiter plate) is coated with an antibody specific for the molecule of interest. The biological fluid to be tested is then placed in the well containing the immobilized antibody. A PRE-labeled secondary antibody that binds a region of the molecule different from the immobilized antibody is added to the well. The plate is then read using a plate reader compatible with dark field optical detection. The presence and level of PRE binding indicates the presence and amount of molecules in the biological fluid.
In other embodiments, a particular sample can also be visualized using multiple populations of PREs, each having a different spectral signature, to identify different binding sites on the target molecule or different targets It can be conjugated to a separate antibody that recognizes the molecule. Alternatively, PRE is coupled with a polyclonal antibody that recognizes multiple epitopes on the same target protein. The presence of two spectrally different PREs at the same position indicates a positive signal, and the separate presence of either particle results in incomplete identification and is rejected. This approach significantly reduces false positive signals in clinical diagnostic assays.
Additional advantages of the PRE immunoassay include the fact that the ability to detect a single PRE with a good signal-to-noise ratio eliminates the need for signal amplification through the use of a secondary antibody or enzyme and its substrate. This further eliminates non-specific background. In addition, the ability to analyze samples during processing with a light microscope allows real-time correction of incubation and wash conditions to further optimize signal to noise. The PRE assay can be conveniently used with essentially any target substance and various binding partners in direct methods, sandwich methods, and other widely used test formats, some of which are described in more detail below. Explained. Substances tested with and conjugated to PRE include proteins, nucleic acids, ligands, receptors, antigens, sugars, lectins, enzymes, and the like.
Example 7
PRP assay for goat anti-biotin
The wells of polystyrene multiwell dishes were coated with biotinylated BSA. Usually BSA was added to block residual non-specific binding sites in the wells. Samples of goat anti-biotin antibody at concentrations ranging from 0.06 to 600 picograms (pg) were added to individual wells. A control sample containing no goat anti-biotin antibody was also assayed. PRP conjugated to rabbit anti-goat antibody was then added to each well and incubated. Unbound PRPs were washed from the wells and bound PRPs in each well were observed with a dark field optical microscope. The field light source was analyzed according to the identification method described above, and the remaining scattering sites were counted individually within each well. The results of this test are shown in FIG. In the control sample, one count remains after image processing, which is shown as a dark bar in FIG. The number of PRE counted over the test concentration range varied from 4 in the 0.06 pg analyte to over 1000 in the 600 pg analyte.
Because it is convenient to perform these assays using one or more populations of PRE having nearly uniform spectral characteristics, the PRE label is first formed under conditions that lead to the formation of such a nearly homogeneous population. Is convenient. As described above, the nucleation center binding to the binding site, followed by metal enhancement and optical observations, has been described, but this technique provides much less control than the spectral properties of the particles thus created. To do. Moreover, even when these techniques are implemented, no effort has yet been made or even proposed to use the PRE scattering property to identify background and create sensitive assays. Thus, a PRE assay performed by first labeling the target species at the nucleation center (rather than forming the PRE prior to binding) and then metal-enhanced for PRE formation is performed between the PRE scatterer and the background. This is still improved when the light identification is performed. Furthermore, assays that use any type of preformed optically observable subwavelength light emitter do not utilize techniques that individually count particles to create sensitive assays. Such counting can be useful for fluorescent or luminescent bead labeling in addition to PRE labeling when performing background spectral and spatial discrimination. As explained below, fluorescence can be enhanced by local plasmon resonance, thus PRE-enhanced fluorescent beads provide an additional subwavelength light emitting label that is useful in such assays.
It is also understood that many variations of these assay types can be performed using PRE labels. All of the various types of immunosorbent assays currently performed using fluorescent molecular labels can be performed using PRE. For example, sandwich assays and competition assays can be performed using PRE. In the first case, an entity such as an antibody having an affinity for the target substance to be detected can be immobilized on the bottom of the assay well. When a test sample containing the target substance is added to the well, the target substance binds to the first entity. A second entity having affinity for a different part of the target substance can then be added to the well. Here it binds to the target species. Finally, PRE bound to the third entity with affinity for the second entity is added to the well, which in turn binds to the second entity. It is understood that after rinsing, PRE binds only to the site to which the target substance has previously bound. This test is very useful when the first and second entities described above are antibodies with affinity for different epitopes on the antigen being assayed. The third entity associated with PRE can be an anti-species antibody rather than a specific binding partner of the target substance.
In a competitive assay, the first entity can be immobilized in the assay well, and both the PRE-coupled second entity and the target substance are added to the well. Here, the second entity and the target substance compete for binding to the first entity. When unbound PRE is separated, the number of PREs remaining in the well indicates the degree to which the target substance can occupy the binding site. In this type of assay, the PRE-binding second entity can be the same as the target substance or can be a different substance that also has an affinity for the first entity.
Those skilled in the art recognize that PRE labels can be used to bind to a wide variety of molecular complexes in a wide variety of ways to produce a sensitive assay. As a further example, the conjugate on the PRE label can be a specific binding partner of the analyte being tested. It can be a specific binding partner of an immobilized analyte / antibody complex. In other cases, the PRE can bind to the immobilized antibody, but only when the immobilized antibody has previously bound to the analyte molecule. Each of these various techniques can be inherently adapted to a given assay based on the chemistry of the analyte being tested.
Furthermore, it is understood that assays for multiple analytes can be performed simultaneously using PRE populations with different spectral signatures. PRE populations with different colors or different polarization responses can be conjugated to recognize different target substances. When introduced into a matrix containing unknown concentrations of several different analytes, all of the assays published herein are performed at once by counting separately the PRE associated with each different spectral characteristic. It could be performed on several target substances.
PRE probes can also be used for screening combinatorial libraries in vitro. In one conventional method of the present technology, a drug receptor is labeled with a fluorophore, mixed with beads, a collection comprising a combinatorial library, and applied onto a slide. The presence of fluorescent beads indicates the presence of receptor binding and potential drug bound to the beads. In one embodiment of the invention, the fluorescent receptor is replaced with a PRE-labeled receptor that increases the sensitivity and photostability of the assay, thereby creating the original combinatorial library on smaller beads. And allows for the synthesis and screening capabilities of larger chemical libraries.
The library can also be synthesized on a microchip, and the presence of the PRE probe indicates receptor binding. The recent application of combinatorial libraries to improve drug discovery can therefore be enhanced by using PRE probes as a method for potential candidate substance detection. Selectively attached PRE increases the resolution and sensitivity of the bio-chip detection scheme.
In all of these assays, PRE calibration is conveniently performed using a PRE with a spectral characteristic different from that used for detection of the target entity. In essence, the assay is calibrated by introducing a pre-determined amount of PRE with selected spectral characteristics to produce a control population of PRE that can be detected and measured with the PRE used for assay function. As an example of a specific sandwich assay calibration, red PRE can be conjugated to the target entity to be tested, and a known amount of the PRE-conjugated target entity (of course much less than the saturation amount) is sampled. Add to the wells either sequentially or simultaneously. After rinsing and flushing the unbound conjugated red PRE, antibodies against the target entity are added. After rinsing the unbound target entity antibody, adding blue PRE (for example) that conjugates to the anti-species antibody, this binds the antibody to the target entity. After rinsing, both red and blue PRE are counted. Here the red PRE count provides a calibration count. In an alternative to this sandwich format, direct binding assay calibration can also be used, where a different immobilized antibody is provided at the bottom of the sample well and the calibration PRE is a specific binding partner for one of the immobilized antibodies. Combine.
Assays using PRE can also be performed on cells. The conjugated PRE can be bound to a fixed or free site within the cell, and its location can be observed individually. There are well-known techniques for the placement of particles within cells, including high-pressure bursting, which perforates particles through the cell membrane, and electroporation using a high-voltage discharge for the acceleration process (PRE is typically an electroporation technique) Is charged prior to). Equipment that implements these techniques is commercially available from BioRad Laboratories of Hercules, CA. PRE and PRE conjugates can also be introduced into cells by conventional transfection techniques including electroporation. The PRE can also be placed directly into the cell by piercing the cell membrane with a micropipette and directly injecting one or more PREs into the cell. In a preferred embodiment, the PRE is coated (ie, latex) by well known methods to protect against biochemical damage.
In one advantageous embodiment of the PRE assay in living cells, two populations of separately conjugated PREs are inserted into one or more cells. Separate conjugates associated with each separate population can be selected to bind to different epitopes on the target substance produced within the cell. After injection into the cell, the presence of the target substance is indicated by PRE pairing, which is detected using the techniques described above. Depending on the nature of the target substance, it is desirable to have a PRE with similar or different spectral characteristics associated with each conjugate.
It is convenient to prepare wells for use with the PRE assay that are suitable for observation with a dark field microscope. For multi-well plates to contain a substrate that is suitable for a dark field microscope, the well bottom is conveniently manufactured with particular emphasis on uniformity, smoothness, and cleanliness to prevent the formation of imperfect light scattering. At present, such attention is not paid to the production of standard 96-well dishes. In addition, the outer surface under the well should also provide a light scattering surface that can introduce unwanted background signals, so this outer surface should also be relatively clean and smooth. In one advantageous embodiment, the well surface has a light scattering imperfection of less than about 100 and even less than about 10. As a further way to increase the signal-to-noise ratio in these assays, imperfect locations within a well can be recorded and scatter signals from these locations can be ignored when performing the assay in that particular well.
Typically, the light microscope field used in these assays includes all or a portion of the well bottom. Therefore, when detecting low levels of analyte, it is important to ensure that there is a minimal amount of analyte that adheres to the well walls rather than the well bottom. It is therefore advantageous to include a blocking agent on the well wall during production. To make such wells, the dish can be inverted and placed on a solution containing a blocking agent such as BSA. When the dish is plunged into the solution or the air trapped in the well is removed by pipetting or capillary aspiration, the BSA solution can contact the well wall without contacting the well bottom. After this step, the desired antibody or other binding agent may be immobilized on the well bottom and then additional blocking agent may be added to block non-specific binding sites remaining at the well bottom.
Assay methods according to the present invention can also be automated using, for example, the methods and apparatus of the present invention as described in Section III. Automated plate readers are currently used in conventional assay technology, and the principles of robotic PRE plate readers are similar in some ways. As with currently marketed plate readers, a robotic sample loading instrument may or may not be attached. The Robot PRE assay plate reader conveniently comprises a microscope for observation of the sample well and all or part of the well bottom. In some embodiments, a very small objective lens (which may be about 2 mm in diameter) is placed in and near the well bottom to obtain a high aperture while imaging the well bottom portion. To lower. In these embodiments, the PRE can be irradiated from the bottom having total internal reflection, removing the bottom of the transparent well bottom. Once the light beam is collected by the objective lens, the automatic image analysis technique described above can be used to detect the light emitting entity and distinguish it from the background. The counting of the remaining discriminating particle source can also be performed automatically. In some embodiments, the reader may be able to identify and count particles in several regions of the same assay well until the microscope field of view can be part of the assay well bottom and a specific predetermined count is read. Can be set. Only after achieving this count will the leader move to a different assay well. This technique saves time by moving quickly from well to well when there is a large amount of signal, and is needed to obtain proper counting statistics when there are a small number of bound PREs in the well Take time. The reader can also be set to perform an additional level of identification depending on the acceptance count. For example, the first identification based on the spatial deviation from the predicted point spread function can be performed over the entire field of view, but an additional spectral deviation measurement can be performed if a low count is obtained. All thresholds for performing various levels of discrimination can be preprogrammed into the reader, analyzing wells with low PRE counts to maximize the signal-to-noise ratio, while signal levels already have high counts In the wells again we are guaranteed to save time.
It is also understood that commercially available kits containing components for performing the assays described herein can be made to have new combinations of components. Conveniently, such a kit may include a container of PREs having spectral characteristics that are approximately equivalent. The PRE can be conjugated with a selected biomolecule such as an antibody or other type of specific binding partner of the selection agent. The PRE can later be coupled to a reactive group for custom formation of a conjugate. Washing and blocking solutions can also be provided. A second container of PRE may also be provided for the calibration or multiplex assay described above.
B.Binding of two PRPs to adjacent target sites
As described above, the spectral characteristics of light emitted by a PRE depend on the proximity of other PREs. Changes in the observed peak at the emission frequency, such as peak wavelength, half width of the spectrum, more than one peak, and changes depending on polarization, can all be observed as the PREs approach or move away from each other. These features can even be used to determine the approximate distance between PREs by measuring the degree of their interaction.
Agglutination and agglutination-dependent immunoassays are therefore performed using PRE probes and have single molecule detection capabilities. In one embodiment, each of the two antibodies is attached to a PRE probe having either the same or different spectral signature. These antibodies bind to the same biomolecule of interest, but at non-competitive sites. The distance between the two binding sites is directly due to narrow band illumination if the two PREs have separate or identical plasmon resonance frequencies, due to the unique spectral signature resulting from the interaction. Place the PRE probe in the proximity position detected by For example, serum is added to a test tube containing a PRE probe coated with an antibody that is specific for a particular serum component. After incubation, the sample is applied on a glass slide and the frequency of the agglomerated (ie, adjacent) PRE probe is measured. This is compared to a control slide with or without serum of the molecule of interest. The technology has application to multiple PRE labels and detection as a result of peptides, nucleic acid oligomers or genes as well as whole cells or viruses or parts thereof.
Measurement of the association constant between two entities is currently performed using several procedures. Macroscopic binding can be measured directly, for example, with isothermal titration calorimetry. Indirect methods include changes in circular dichroism associated with absorption, fluorescence, and complex formation. One problem associated with these methods requires a high concentration of the substance to observe a detectable change in signal, at which the sample can be essentially 100% complexed, and thus Under these conditions it interferes with the measurement of the binding constant. In a preferred embodiment, the two entities are labeled with a PRE probe to achieve equilibrium and the binding constant is calculated by the free to binding ratio.
The ability to detect when two PREs are adjacent is also important as a molecular association or dissociation assay. When two PREs associate with an appropriate pair of conjugates and are mixed together, they combine to form a pair or, but not limited to, a more complex. As one example, a PRE conjugated to an oligonucleotide is a target where the oligonucleotide sequence on a different population of PREs contains a complementary sequence, or where the PRE conjugated oligonucleotide sequence is also present in the matrix. Such pairs or complexes are formed when they are complementary to different regions of the oligonucleotide.
C. Disconnection between two PREs
In this embodiment, one PRE is linked to another PRE via a cleavable linker (eg, a peptide, oligonucleotide, oligosaccharide, or other chemically or enzymatically cleavable linker). . The purpose of the linking composition is to detect a single chemical or enzymatic cleavage event, according to the Part B embodiment, based on observable spectral changes that result from the linking PRE becoming an individual unlinked PRE. is there.
More generally, if the PRP linkage pair is differentiated and the bond is broken, for example by enzymatic degradation or denaturation of the peptide linker between the PREs, this is reflected in changes in the spectrum of the paired or complex PRE Is done. Enzyme manipulation can be monitored by this technique by observing an increase in the rate of complex formation or dissociation in the presence of the enzyme. One advantageous application of these methods involves monitoring the manipulation of signaling cascades within cells. The bound PRE is selected such that the presence of the product of the signaling cascade either dissociates the prebound PRE or binds the dissociated PRE. Thus, the initiation of the cascade can be observed by light microscopy in living cells by observing intracellular PRE association or dissociation.
Each PRE can be coated in such a manner that a binding pair occurs with high probability by binding to a linker such as a peptide or DNA molecule. As discussed herein, when two PREs having the same PR peak frequency are in close proximity to each other, frequency shifts, additional resonances, and polarization effects occur. If it is desired to determine whether a particular enzyme is present in the solution, a linker that is sensitive to degradation by that enzyme is used. For example, serine proteases can be assayed using a peptide linker that includes a protease recognition site therein. After proteolysis, the spectrum of bound PRE changes dramatically as the PRE separates. In some cases, the PREs were linked so that they do not interact appreciably and retain essentially independent scattering spectra both when linked and when not linked. In some cases, it can be spatially separated by a sufficient distance. In this case, pairing and dissociation can still be observed and measured by evaluating the PRE position with a CCD detector, and observing PRE pairs with relative motion indicating that they are linked.
VI. Further compositions and applications of PRE
A. Monitoring of local dielectric environment
If the PRE in air is surrounded by a medium having a dielectric constant different from that of air, the scattering parameters can vary in proportion to the scattering parameter characteristics of the particles in the air. This effect is reversible when the dielectric medium is removed. Such parameters include, for example, changes in the intensity or shift of the wavelength of the resonance peak, changes in the PRE response to polarization, and changes in the number of resonance peaks. Resonance peaks and intensity shifts are observed after the addition of liquids with different refractive indices surrounding the PRE, and after removal by a suitable washing step, the PRE exhibits its previous properties. For many substances that exhibit plasmon resonance, the resonance peak shifts red toward the longer wavelength side as the refractive index of the surrounding medium increases.
The presence of the particular substance of interest or other perturbations in the sample being tested can therefore be detected by recording the spectral response of the PRE to the substrate interacting with the PRE. For example, a suitable sample can be prepared in which the PRE is bound to the substrate. Selective molecules can be bound to the PRE surface. Record the optical scattering parameters (intensity, polarization dependence, angle dependence, wavelength dependence, etc.) of each such PRE. The sample is then subjected to a change in PRE scattering parameters after the initial treatment and / or subsequent treatment, which may cause local absorption of additional material or desorption of additional material or starting material, or other in the local dielectric environment. Treat with material containing the molecule of interest that selectively binds to the PRE surface in a manner such as by confirming the change. It can be appreciated that the starting PRE sample can be prepared as a test “library” or can be used to screen an “application” library of proteins, antibodies, etc.
(D) Shift of fluorescence spectrum
These peak shifts and intensity changes can also be used for the detection of molecular perturbations such as association and dissociation due to changes in the PRE local dielectric environment.
Information regarding the subject matrix properties can also be obtained by observing the spectral dependence in the relative position of the PRE and a close substrate such as a smooth Si surface. For example, once a record of PRE localization and spectral signature within a given sample has been created, enzyme is added or photolysis of the binding occurs, causing movement of the PRE from the substrate, thereby creating a spatial and pre- / Or may change the spectral signature. Indeed, if such PRE pairs bind to each other and one moves while the other is bound to the surface, the resulting spectral signature clearly indicates this event. Coatings on the substrate can also be used to provide additional flexibility in creating detection and analysis systems using PRE. For example, the coating can be applied to a substrate that binds the desired polypeptide or polynucleotide, or a blocking coating can be applied to block non-specific binding of the PRE conjugate. One suitable coating includes, for example, one or more layers of dielectric material that produces anti-reflective properties. The coating may also include one or more layers of dielectric material that produce enhanced radiation by the PRE of light incident on the viewing optical system. The coating can also be selected to displace the PRE a distance away from the basic substrate surface. The predetermined polarization of light scattered by the PRE is inhibited or enhanced depending on the distance from the reflective surface. For example, SiO on silicon2When a suitable spacer layer consisting of is placed, a good point source image with a peak in the center as expected is observed. SiO2PRE resonance wavelength where there is destructive and constructive interference of the PRE due to superposition of reflected light from the substrate (interface) and the top surface of the dielectric layer when adjusting the layer or using another dielectric material As well as dielectric thickness and materials. By using a silicon or conductive surface, a spectral signature is obtained that is significantly different from when the PRE is away from contact with the surface or through the presence of a dielectric layer.
B. Exercise monitoring
Three-dimensional PRE motion is directly achieved by using two observation lenses at right angles to each other, each causing two axis motion in a plane perpendicular to the respective optical axis. Can be visualized. This is particularly suitable for movements smaller than the depth of field of the objective lens. If the observed motion has a component larger than the depth of focus of the objective lens, only one lens is used for 3D motion and thereby via a feedback signal that focuses the PRE intensity on the image plane. Measure the "depth" direction. The other two dimensions are measured by conventional methods. The PRE distance from the substrate surface can also be monitored in a TIR illumination system by measuring the intensity of scattered light by the PRE as the position changes. Because the excitation electric field drops exponentially with the distance from the reflective interface, the PRE intensity decreases as it moves away from the substrate surface.
Since the PRE probe is extremely bright and very small, it can be used for real-time measurement of velocity and relative motion. For example, PRE can be used to monitor dynamic cellular processes including motor proteins (ie, kinesin), cell division, small cell transport, and the like. PRE probes do not photobleach and are particularly useful for in vivo temporal experiments over a wide range of time scales. PRE or precursor gold nucleation centers attach to lipids that are taken up by cell membranes. A specific PRE conjugate is designed to bind to its pair on the cell surface receptor that binds to the cell membrane. This method allows, for example, monitoring of the ion channel opening. PRE can also be used to monitor actin and myosin movement in muscle cells. A PRE that binds to or is coated with a conjugate can be introduced into the cell. The conjugate then binds its binding partner in the cytosol, nucleus or various organelle membranes. For example, activation of cellular receptors by certain drugs can lead to morphological changes in the cell structure. Thus, PREs that are intracellular or on cells can be used as optical assay systems for drug discovery or receptor activation. Once bound, the PRE can localize and observe its movement. PRE can also be used in macroscopic movement assays. For example, blood cells can be labeled and observed in the circulation. Alternatively, blood or other fluid flow may induce a corresponding movement of the PRE. PRE can also be introduced into cells by Biolistic equipment (BioRad Inc., Richmond, Calif.) Or electroporation.
By labeling the entity of interest with a PRE and integrating the appropriate real-time data acquisition and analysis system, the detection process described herein can be used to monitor the movement of this entity. Such a system can measure motion in three dimensions and can measure it in two dimensions if the motion is limited to a plane. Not only is it possible to obtain accurate information about movements in the specific system of interest, but also physics such as drug treatment or changes in temperature, pH, irradiation, electric or magnetic field strength, or concentration of any compound of interest. Changes in molecular motion after other changes in the chemical and chemical environment are also observable.
The PRE can also be used to monitor physical movement of more macroscopic objects. For example, a single PRE placed on the antennal antennae can be used to sense its normal movement or movement in response to external molecules. This is particularly useful for detecting molecular responses to scents and pheromones. PRE is also an ideal tool for enabling analysis of mechanical motion on a microscopic or submicroscopic scale. By combining PRE with so-called “nanobearings” components or other micron-sized mechanical components, three-dimensional motion can be visualized and analyzed on a nanometer scale. In addition to the additional expense for the electron microscope, because the electron microscope is a scanning device, it is difficult to capture motion through the electron microscope, and the field of view is therefore real-time as is possible with an optical microscope. Rather than observing with a continuous scan. Furthermore, an electron microscope requires large-scale sample preparation in addition to a vacuumed measurement region. These factors greatly limit the potential application of electron microscopy for real-time motion analysis.
C. Near-field effect
The application of PRE discussed above focused on the far-field observation of light scattered by the PRE. However, since PRE also generates a strong, non-irradiating short-range electric field, it can be used to influence the physical, chemical and spectroscopic properties of neighboring molecules in useful ways. Surface enhanced Raman scattering spectroscopic techniques can be extended to include specific enhancement of only that material in the middle of the enhanced PRE. For example, PRE can be bound to bind to a target having a known Raman signature. Successful binding can be detected by observing the surface enhanced Raman spectrum of the target. It may also be useful for locally enhanced excitation and modified emission of vicinal fluorophores. Surprisingly, when the surface of the PRE is placed at a distance of about 1-5 nm from the fluorophore, the PRE can produce enhanced emission even from high quantum efficiency fluorophores. In contrast, it is generally believed that the presence of metal quenches the fluorescence emission of high quantum efficiency fluorophores. This fact can be used to make fluorescent labels with a higher brightness or altered lifetime compared to the unbound case. A label comprising a plasmon resonance conducting nucleus (eg, silver particles having a diameter of 40-100 nm) and a non-conducting shell, eg, made from latex, can be made where fluorescence on or within this shell Or reserve Raman-active molecules. Presumably, the plasmon resonance peak has a significant overlap with the efficiency excitation band of the fluorophore or Raman active molecule. When the label is irradiated, plasmon resonance excitation of the nucleus greatly enhances the observed fluorescence. According to the above discussion, to cause fluorescence enhancement, the thickness of the non-conductive shell is preferably equal to or less than about 5 nm. Thus, plasmon resonance nuclei, selected to resonate at selected wavelengths, dramatically improve labeling performance over currently commercially available fluorescent latex particles.
The elliptical PRE response can also be advantageously used in conjunction with fluorescence spectroscopy. Elliptical particles are particularly effective for localized excitation of selected fluorophores by one such plasmon resonance, as they simultaneously cause resonant excitation at two or three different frequencies, and other plasmon resonances. Are simultaneously effective to affect the emission (ie, emission) of the excited fluorophore at a wavelength corresponding to.
Targeted PREs can therefore induce highly localized spectral effects, again improving information gathering for the microscope lower limit system. As in the case of fluorescence resonance energy transfer (FRET), PRE clusters give rise to new optical properties, including localized and photonic band gap modes, which are highly related to molecular binding events. It can be used to facilitate the production of reactive PRE-based detectors.
D. Metrology and instrumentation
Excited PREs generate localized heat and individual PREs can be used for writing to a polycarbonate substrate. Individual highly localized light sources, PREs can be useful for the induction of precision lithography, photochemistry, or photoactivated chemical reactions.
PRE can also be used as a marker with all other non-optical types of very high resolution microscopes, including electron, nuclear and scanning tunneling microscopes. In these applications, the macromolecule of interest, such as a segment of DNA, is labeled with one or more optically observable PREs. Preferably, the high resolution microscope also comprises a dark field optical microscope apparatus for optical observation of the portion of the surface imaged by the non-optical microscope. The PRE bound to the molecule is optically observable and the relevant part of the high resolution microscope, such as a nuclear or scanning tunnel probe tip, can be immediately placed at the desired site on the observed molecule. This can save the extra scan time normally used to localize the object being imaged and increase the efficiency of using a high resolution microscope. Nuclear, scanning tunnel, or any other type of scanning high resolution microscope can be advantageously constructed to incorporate a dark field microscope system to take advantage of this feature of the PRE.
Industrial applications that require high precision alignment or registration can also benefit from the use of PRE. One such application is a semiconductor manufacturing process where the lithographic mask must be accurately aligned with the semiconductor wafer being processed. Comparison of the position of one or more PREs on a semiconductor wafer with one or more PREs on a lithographic mask is possible at the nanometer level, since PREs can be localized even with an accuracy of a few nanometers or less The mask localization relative to the wafer can be determined at. Since only the relative placement is important, either random or controlled PRE patterns on the mask and wafer can be used.
Another application of the present invention takes advantage of the fact that the PRE is essentially a point source of optical frequency light having a diameter much smaller than the emission wavelength. Therefore, only the observed point distribution function pattern characteristics of the instrument are generated, not the image of the structure. This point spread function can be analyzed to detect imperfections in the optical system used to create it. As one example, the angular change in circular fringe intensity indicates a lens with circumferential asymmetry in the viewing system. The localization of the center of the Airy pattern at two or more emission wavelengths also evaluates the lens system for chromatic aberration.
The point source nature of PRE can also be used to test its resolution of an optical system. Using the techniques described above for placement of individual PREs at specific locations, the calibration of a set of PRE pairs can be made by varying the distance between the PREs. The central peak of each point spread function can then overlap to determine how the two PREs should be approached before generating a single non-identifying peak. To some extent, this can be done by measuring the width of a single PRE peak at the focal plane with the lens system of interest.
The PRE can also be used to profile the intensity distribution of the focused light beam, thereby collecting information related to the characteristics of the lenses and other optical systems used to generate such light beam. As illustrated in FIGS. 10A and B, the focusing
Referring to FIG. 10A, a thin
E.Object identification method
Yet another application of the present invention is the marking and identification of paper or plastic items that are subject to counterfeiting, such as banknotes or credit cards, or identification badges. Either a random or predefined pattern of PREs can be bound to the surface of the item. In an advantageous embodiment, the PRE is coated with a protective layer or film. Subsequent observation of the appropriate PRE pattern on the item using microscopic techniques as described above can be used for appraisal purposes. Such authentication may be through a computerized pattern recognition system that allows real-time appraisals at storefronts, facility entrance locations, and the like. Alternatively, in addition to the PRE arrangement, a magnetic strip, bar code, or other data storage medium may be placed on the item (eg, a credit card). The code version of the PRE sequence is also stored on this medium, and a match indicates that the item was created successfully. Of course, cryptographic algorithms should be used that generate matched magnetic codes based on PRE sequences that cannot be easily inferred from the sequences themselves, and such algorithms are well known in the cryptographic field.
G.Forensic medicine
PRE's toughness and easy visibility also make it ideal for certain forensic applications. Body oils, body fluids, DNA, etc. present in the fingerprint can bind to the PRE, making it easy to visualize the fingerprint under appropriate lighting. A number of different objects can also be labeled with PRE to provide trace traceability. PREs with different scattering properties can be mixed with explosives, food, drugs, poisons or other toxins and the like. Certain PREs could provide source identification. PRE is ideal for this application because of its resistance to degradation and the ability to detect even a single individual PRE in a sample.
H.Identification of small molecules in combinatorial libraries by Raman spectrum PRE
PREs can also be distinguished by the properties of the molecules attached to the surface that can be provided in addition to one or more conjugate molecules. Surfaces enhanced by Raman scattering from Raman-active molecules adjacent to individual PREs have been reported. (Nie and Emory, Science Vol. 275, 1102-1106, 1997). When molecules with different Raman spectra attach to different populations of PREs, PREs from different populations can be identified by their different Raman scattering signatures. There are a wide variety of Raman molecules available, and numerous discriminating probes are possible that can be particularly useful in combination with combinatorial library technology. Raman markers are also useful in DNA sequencing techniques that use four identifiable markers, one for each base, an alternative method for generating four identifiable PRE populations (four As well as different plasmon resonance wavelengths). Fluorescent molecules also bind to PRE and provide additional markers, such as can be oligonucleotides, that are distinguished by preferential hybridization properties rather than their spectral properties. If desired, a PRE having a non-conductive dielectric shell, such as a conductive resonant nucleus and latex, can include fluorescent molecules embedded within the dielectric shell. This labeling mode will be described in detail below. It will also be appreciated that a combination of different resonant scattering properties, different fluorescent markers, and different Raman markers can be used to prepare hundreds or even thousands of spectrally distinguishable probes. For example, a library can contain 4 different plasmon resonance signatures, 4 different fluorescent signatures, and 10 different Raman signatures, so that 160 different distinctions can be made with different combinations of available spectral signatures. Simple probes can be made. Thus, PRE populations can be distinguished based on differences in size or shape, or by differences in the substances that bind to them.
Furthermore, known techniques of combinatorial chemistry can be used to simultaneously synthesize marker molecules and conjugate molecules on the PRE in a simultaneous series of molecular assembly steps. In certain embodiments, the process begins with a labeled precursor entity that includes a PRE that has one or more reactive groups attached to it and can form a base that initiates combinatorial chemical synthesis. The reactive group can include, for example, phosphate, aldehyde, carboxyl, alcohol, amide, sulfide, amino acid, or nucleobase. For example, selected Raman-active molecules could be synthesized simultaneously with the oligonucleotide conjugate. Alternatively, a library of drug candidate compounds can be synthesized simultaneously with the identification of oligonucleotide markers.
I.Cell classification
PRE probes are also suitable for cell sorting methods and are similar to fluorescence activated cell sorting (FACS). The mixed cell population is analyzed for one cell type that expresses a specific surface antigen by using a specific PRE probe. In addition, because of the number of uniquely identifiable PRE probes with distinct spectral signatures that can be generated, several cell types are isolated using multiple PRE probes simultaneously. It is contemplated that all of the PRE detection and localization methods described herein can be fully automated to produce a cell sorter, among other items. It is advantageous to use a PRE cell sorter to pass the cell population of interest substantially one by one through the dark field microscope field. The detection, identification and analysis techniques detailed above can be used in a cell classification context for the identification of PRE-labeled cells.
A number of different cell routing schemes can be used in such devices. In one advantageous embodiment, the cells are deposited in a stream of liquid such as water and within the limits of a surrounding shell of a second liquid such as oil that does not substantially mix in the first liquid. Force to move. This force passes through the field of view of the microscope, leaving the cells confined to a small area for the dark field. The refractive indices of the two liquids are preferably approximately equivalent to minimize reflection of incident light at the interface between them.
Furthermore, PRE labeling is not an alternative to fluorescent labeling in cell sorting techniques, but rather can be used in addition to firefly labeling. In this case, a fluorescent label and a PRE label are generated to bind to the same target cell. Cell sorting can be performed based on observation of fluorescent markers. If a portion of the classified cells is stored as a record of the results of the classification process, the PRE can be used to prove a successful classification result in the future. This is more effective due to the stability and non-photobleaching properties of the PRE than to observe the fluorescence of the stored sample.
Further applications of the technology are performed in vivo or ex vivo. In this technique, a PRE probe is introduced into the permeabilized cell that permeabilizes the cell and attaches to an antibody against the desired intracellular biomolecule. The cells are then incubated with the combinatorial chemical library. Viable cells are plated on slides and cells that are “affected” are selected by the chemical library. “Affected” may indicate a change in the location or distribution of the PRE probe due to a change in the location of the attached biomolecule, or may indicate a cluster of PRE probes that leads to a new spectral signature. Any entity of interest (i.e., cell, DNA, organelle) can be labeled with PRE, so that it can then be detected optically since it can be observed that the PRE collection moves as a unit.
J.Clinical application of PRE
PRE can also be used in a wide range of clinical applications. One important area is the diagnosis of different conditions in animals (including humans), which can be identified by the selective binding of conjugates to specific organs within the animal. In this technique, a PRE with selective scattering properties can be injected or ingested into the bloodstream by an animal. These PREs can further be conjugated with antibodies or other conjugates to target or identify the presence of specific substances in the animal. The tissue can then be detached from the animal and examined for the presence of PRE under a microscope. If desired, a control PRE that does not bind to a specific binding conjugate can also be injected or ingested to measure non-specific binding background. These techniques were developed using colored latex particles as probes, and reagents for performing these tests on latex particles are commercially available from, for example, Triton Technologies of San Diego, CA and Molecular Probes of Eugene, OR. . The use of PRE improves the sensitivity of such tests due to its brightness, biocompatibility, and resistance to degradation.
Therapeutic techniques such as cell modification and gene therapy can also be enhanced by PRE. In this case, cells with the desired genetic properties are labeled with PRE and selected with a cell sorter using the techniques described above. The selected cells are then placed in the patient. If desired, the PRE can be dissociated and removed prior to placement in the patient.
Selective heating and drug delivery is also possible with PRE. When a PRE is localized to a selected tissue or region of a patient, it can be irradiated to locally heat that tissue or region without significantly affecting adjacent regions of the body. Administration and activation of photoactivated drugs is also enhanced by PRE. Photoactivatable drugs can be activated by very small amounts of total photoenergy by binding to PREs with enhanced electric fields. The use of photoactivatable drugs to treat breast cancer has attracted attention recently and can be improved by conjugating drugs to the PRE to enhance its activation at deeper locations within the tissue.
The application of optical PRE detection and analysis to biochemical systems is believed to provide tremendous benefits over current labeling technologies and appears to include areas where PRE analysis methods can have a significant impact. However, other regions may also benefit from PRE detection and spectral analysis according to the present invention.
From the foregoing, it will be appreciated how the various objects and features of the present invention are met. The method and apparatus of the present invention is ideally suited to the task of interrogating various targets that have been difficult or impossible before, and representative examples include:
1. detection of single molecule events;
2. Elucidation of quasi-wavelength distance relationships within biological targets in natural hydration state
3. direct spatial mapping of selected target sites in biological targets, such as direct mapping of selected sequences within a chromosome for chromosomal mapping purposes; and
4. Optical reading of microcoded information;
The method and apparatus can further be applied to a wide range of diagnostic applications to achieve improved sensitivity, spatial and distance information, ease of sample preparation, and flexibility in the type of target sample that can be interrogated.
Although the present invention has been described with respect to particular methods, compositions and devices, it will be appreciated that various changes or modifications may be made without departing from the invention.
Claims (28)
光学的な光源で該場を照射する工程、
該場における個々のPREおよび他の光散乱実体のスペクトル発光特性を、検出する工程、
該場に存在する個々のPREおよび他の光散乱実体について測定された1つ以上の発光スペクトル特性値と該場の中の各領域を結びつける画像であるマトリクスを構築する工程、ならびに
選択されたサインPREに独特の検出されたスペクトル特性の値に基づいて、他の光散乱実体から、選択されたスペクトルサインを有するPREを識別し、該場についての情報を提供する工程であって、該場における各光散乱実体についての、スペクトル発光曲線の半強度でのピーク位置、ピーク強度、またはピーク幅、画像面におけるピーク半幅、および入射応答の偏光または角度の、検出された値に基づいて、該場における全ての他の光散乱実体から、選択されたタイプのPREを識別する工程を包含する、該場における他の光散乱実体から、選択されたスペクトルサインを有するPREを識別することを包含する工程、を包含する、方法。A method for hearing a place having a plurality of distributed PREs,
Irradiating the field with an optical light source;
Detecting the spectral emission characteristics of individual PREs and other light scattering entities in the field;
Individual PRE and other steps to build Mato Riku scan an image to link each region in the measured one or more light-emitting spectral characteristic values and該場was for light scattering entities present in該場, and selected Identifying a PRE having a selected spectral signature from other light scattering entities based on detected spectral characteristic values unique to the signature PRE and providing information about the field comprising: Based on the detected values of peak position at half intensity of the spectral emission curve, peak intensity or peak width, peak half width at the image plane, and polarization or angle of the incident response for each light scattering entity in the field, from all other light-scattering entities in the該場involves identifying a PRE of the selected type, the other light-scattering entities in the 該場, selected spectral Sa Step involves identifying a PRE having emissions including, method.
該第1の周波数帯での照射下で、前記場における個々のPREおよび他の光散乱実体のスペクトル発光特性を検出する工程;
第2の周波数帯において、主に、入射光で該PREを照射する工程;ならびに
該第2の周波数帯での照射下で、該場における個々のPREおよび他の光散乱実体のスペクトル発光特性を検出する工程、
を包含する、方法。The method according to claim 1, wherein the irradiating and detecting include irradiating the PRE mainly with incident light in a first frequency band;
Detecting spectral emission characteristics of individual PREs and other light scattering entities in the field under illumination in the first frequency band;
Illuminating the PRE primarily with incident light in a second frequency band; and, under illumination in the second frequency band, spectral emission characteristics of individual PREs and other light scattering entities in the field. Detecting step,
Including the method.
(i)核形成中心を場に結合し、該核中心を金属増強し、該金属増強プロセスの間、該核形成中心の増強を観察し、そして所望のスペクトル特性のPREが形成されている場合、増強を終結する工程;
(ii)該場において、予め形成されたPREを標的に添加する工程、
(iii)該場において、標的部位でPREを作製する工程、
からなる群より選択される工程によって、該場において形成される、方法。The method of claim 1, wherein the PRE comprises: (i) binding a nucleation center to a field, metal enhancing the nucleation center, and enhancing the nucleation center during the metal enhancement process. Observing and terminating the enhancement if a PRE of the desired spectral characteristics has been formed;
(Ii) adding a preformed PRE to the target in the field;
(Iii) creating a PRE at the target site in the field;
A method formed in the field by a process selected from the group consisting of:
該場を照射するための光学的な光源、
該場が該光源によって照射される場合、該場における個々のPREおよび他の光散乱実体のスペクトル発光特性を検出するための光学検出器、
該検出器から受容されるシグナルから、該場に存在する個々のPREおよびこのような他の光散乱実体について測定された1つ以上のスペクトル発光特性値と該場中の各領域を結びつける画像であるマトリクスを構築するための、検出器に作動可能に連結される画像処理器、
該マトリクスにおいて他の光散乱実体から、選択されたスペクトルサインを有するPREを識別するための識別器手段、ならびに
選択されたPREについての情報に基づいて、該場についての情報を表示するための出力手段、
を備える、装置。An apparatus for use in the method of claim 1 for hearing a field having a plurality of distributed PREs, comprising:
An optical light source for illuminating the field;
An optical detector for detecting the spectral emission characteristics of individual PREs and other light scattering entities in the field when the field is illuminated by the light source;
From a signal which is received from the detector, the individual PRE and such other one or more images that links each region of the spectral emission characteristic values and in該場measured for light scattering entities present in該場for building certain Matrix scan, image processor operably coupled to the detector,
Other from light scattering entities in the Mato Riku scan, discriminator means for discriminating the PRE having a spectral signature that is selected, and based on information about the selected PRE, to display information about the該場Output means,
An apparatus comprising:
Applications Claiming Priority (3)
| Application Number | Priority Date | Filing Date | Title |
|---|---|---|---|
| US3867797P | 1997-02-20 | 1997-02-20 | |
| US60/038,677 | 1997-02-20 | ||
| PCT/US1998/002995 WO1998037417A1 (en) | 1997-02-20 | 1998-02-20 | Plasmon resonant particles, methods and apparatus |
Publications (3)
| Publication Number | Publication Date |
|---|---|
| JP2001513198A JP2001513198A (en) | 2001-08-28 |
| JP2001513198A5 JP2001513198A5 (en) | 2005-10-06 |
| JP4209471B2 true JP4209471B2 (en) | 2009-01-14 |
Family
ID=21901272
Family Applications (1)
| Application Number | Title | Priority Date | Filing Date |
|---|---|---|---|
| JP53677498A Expired - Lifetime JP4209471B2 (en) | 1997-02-20 | 1998-02-20 | Plasmon resonant particles, methods, and apparatus |
Country Status (8)
| Country | Link |
|---|---|
| US (6) | US6180415B1 (en) |
| EP (1) | EP0979409B1 (en) |
| JP (1) | JP4209471B2 (en) |
| AT (1) | ATE349697T1 (en) |
| AU (1) | AU748939B2 (en) |
| CA (1) | CA2280794A1 (en) |
| DE (1) | DE69836734D1 (en) |
| WO (1) | WO1998037417A1 (en) |
Families Citing this family (332)
| Publication number | Priority date | Publication date | Assignee | Title |
|---|---|---|---|---|
| US6490913B1 (en) * | 1995-05-19 | 2002-12-10 | The United States Of America As Represented By The Secretary Of Commerce | Humidity chamber for scanning stylus atomic force microscope with cantilever tracking |
| US6586193B2 (en) * | 1996-04-25 | 2003-07-01 | Genicon Sciences Corporation | Analyte assay using particulate labels |
| CA2253710A1 (en) * | 1996-04-25 | 1997-10-30 | Spectrametrix Inc. | Analyte assay using particulate labels |
| US6582921B2 (en) | 1996-07-29 | 2003-06-24 | Nanosphere, Inc. | Nanoparticles having oligonucleotides attached thereto and uses thereof |
| US6413786B1 (en) | 1997-01-23 | 2002-07-02 | Union Biometrica Technology Holdings, Inc. | Binding assays using optical resonance of colloidal particles |
| WO1998037417A1 (en) * | 1997-02-20 | 1998-08-27 | The Regents Of The University Of California | Plasmon resonant particles, methods and apparatus |
| US7144627B2 (en) * | 1997-03-12 | 2006-12-05 | William Marsh Rice University | Multi-layer nanoshells comprising a metallic or conducting shell |
| US6344272B1 (en) | 1997-03-12 | 2002-02-05 | Wm. Marsh Rice University | Metal nanoshells |
| US6852252B2 (en) | 1997-03-12 | 2005-02-08 | William Marsh Rice University | Use of metalnanoshells to impede the photo-oxidation of conjugated polymer |
| US6428811B1 (en) | 1998-03-11 | 2002-08-06 | Wm. Marsh Rice University | Temperature-sensitive polymer/nanoshell composites for photothermally modulated drug delivery |
| US6699724B1 (en) * | 1998-03-11 | 2004-03-02 | Wm. Marsh Rice University | Metal nanoshells for biosensing applications |
| JP3380744B2 (en) * | 1998-05-19 | 2003-02-24 | 株式会社日立製作所 | Sensor and measuring device using the same |
| US6723517B1 (en) * | 1998-06-02 | 2004-04-20 | Minerva Biotechnologies Corporation | Use of self-assembled monolayers to probe the structure of a target molecule |
| ATE376671T1 (en) * | 1998-08-11 | 2007-11-15 | Union Biometrica Technology Ho | BINDING ASSAY USING OPTICAL RESONANCE OF COLLOIDAL PARTICLES |
| IL126776A (en) | 1998-10-27 | 2001-04-30 | Technion Res & Dev Foundation | Method for gold depositions |
| JP2002532728A (en) * | 1998-12-17 | 2002-10-02 | ライカ ミクロジュステムス ハイデルベルク ゲーエムベーハー | Method for advantageously discriminating various structures in a biological sample |
| US6633660B1 (en) * | 1999-02-05 | 2003-10-14 | John Carl Schotland | Near-field tomography |
| JP3468149B2 (en) * | 1999-02-19 | 2003-11-17 | 松下電器産業株式会社 | Device and method for operating fine objects |
| US6142681A (en) * | 1999-02-22 | 2000-11-07 | Vialogy Corporation | Method and apparatus for interpreting hybridized bioelectronic DNA microarray patterns using self-scaling convergent reverberant dynamics |
| US6136541A (en) * | 1999-02-22 | 2000-10-24 | Vialogy Corporation | Method and apparatus for analyzing hybridized biochip patterns using resonance interactions employing quantum expressor functions |
| EP1175505A4 (en) * | 1999-04-15 | 2005-04-20 | Vitra Bioscience Inc | Combinatorial chemical library supports having indicia at coding positions and methods of use |
| US20030096321A1 (en) * | 1999-05-19 | 2003-05-22 | Jose Remacle | Method for the identification and/or the quantification of a target compound obtained from a biological sample upon chips |
| US7074586B1 (en) * | 1999-06-17 | 2006-07-11 | Source Precision Medicine, Inc. | Quantitative assay for low abundance molecules |
| EP1206716A1 (en) * | 1999-08-13 | 2002-05-22 | California Institute Of Technology | Optoelectronic device and method utilizing nanometer-scale particles |
| DE19943704C1 (en) * | 1999-09-08 | 2001-05-10 | Inst Physikalische Hochtech Ev | Affinity sensor for the detection of biological and / or chemical species and its use |
| US8497131B2 (en) * | 1999-10-06 | 2013-07-30 | Becton, Dickinson And Company | Surface enhanced spectroscopy-active composite nanoparticles comprising Raman-active reporter molecules |
| US20020154803A1 (en) * | 1999-11-01 | 2002-10-24 | Inflamet Ltd. | Biological sample carrier |
| IL132687A0 (en) * | 1999-11-01 | 2001-03-19 | Keren Mechkarim Ichilov Pnimit | System and method for evaluating body fluid samples |
| US6528993B1 (en) * | 1999-11-29 | 2003-03-04 | Korea Advanced Institute Of Science & Technology | Magneto-optical microscope magnetometer |
| US7198939B2 (en) * | 2000-01-28 | 2007-04-03 | Agilent Technologies, Inc. | Apparatus for interrogating an addressable array |
| FR2804784B1 (en) * | 2000-02-04 | 2003-04-11 | Novatec | UNIVERSAL PROCESS FOR THE IDENTIFICATION AND AUTHENTICATION OF OBJECTS, PLANTS OR LIVING BEINGS |
| US6530944B2 (en) | 2000-02-08 | 2003-03-11 | Rice University | Optically-active nanoparticles for use in therapeutic and diagnostic methods |
| US6760124B1 (en) | 2000-03-22 | 2004-07-06 | Hewlett-Packard Development Company, L.P. | Software determination of led brightness and exposure |
| US6970811B1 (en) * | 2000-03-22 | 2005-11-29 | Hewlett-Packard Development Company, L.P. | Hardware modeling of LED relative brightness |
| US6759235B2 (en) * | 2000-04-06 | 2004-07-06 | Quantum Dot Corporation | Two-dimensional spectral imaging system |
| AU2001275475A1 (en) * | 2000-06-12 | 2001-12-24 | Genicon Sciences Corporation | Assay for genetic polymorphisms using scattered light detectable labels |
| US20020102617A1 (en) * | 2000-08-03 | 2002-08-01 | Macbeath Gavin | Protein microarrays |
| AU2002211317A1 (en) * | 2000-10-03 | 2002-04-15 | Mirari Biosciences, Inc. | Methods and compositions for directed microwave chemistry |
| US20040209303A1 (en) | 2000-10-03 | 2004-10-21 | Martin Mark T. | Methods and compositions for directed microwave chemistry |
| US7348182B2 (en) * | 2000-10-03 | 2008-03-25 | Mirari Biosciences, Inc. | Directed microwave chemistry |
| US6818907B2 (en) * | 2000-10-17 | 2004-11-16 | The President And Fellows Of Harvard College | Surface plasmon enhanced illumination system |
| US7118710B2 (en) * | 2000-10-30 | 2006-10-10 | Sru Biosystems, Inc. | Label-free high-throughput optical technique for detecting biomolecular interactions |
| US6953694B2 (en) * | 2000-12-06 | 2005-10-11 | The Trustees Of Columbia University In The City Of New York | Attachment of second harmonic-active moiety to molecules for detection of molecules at interfaces |
| WO2002054071A1 (en) * | 2001-01-08 | 2002-07-11 | Salafsky Joshua S | Method and apparatus using a surface-selective nonlinear optical technique |
| US6515749B2 (en) * | 2001-01-10 | 2003-02-04 | The United States Of America As Represented By The Secretary Of Commerce | Sensitive and selective chemical sensor with nanostructured surfaces |
| US6861263B2 (en) * | 2001-01-26 | 2005-03-01 | Surromed, Inc. | Surface-enhanced spectroscopy-active sandwich nanoparticles |
| US6696362B2 (en) * | 2001-02-08 | 2004-02-24 | Applied Materials Inc. | Method for using an in situ particle sensor for monitoring particle performance in plasma deposition processes |
| US7361472B2 (en) | 2001-02-23 | 2008-04-22 | Invitrogen Corporation | Methods for providing extended dynamic range in analyte assays |
| US7203342B2 (en) * | 2001-03-07 | 2007-04-10 | Schlumberger Technology Corporation | Image feature extraction |
| AU2002251449B2 (en) * | 2001-03-29 | 2008-01-31 | Cellect Technologies Corp. | Methods devices and systems for sorting and separating particles |
| US6838121B2 (en) * | 2001-05-10 | 2005-01-04 | Zyvex Corporation | System and method for controlling deposition parameters in producing a surface to tune the surface's plasmon resonance wavelength |
| US7238472B2 (en) | 2001-05-25 | 2007-07-03 | Nanosphere, Inc. | Non-alloying core shell nanoparticles |
| US7147687B2 (en) * | 2001-05-25 | 2006-12-12 | Nanosphere, Inc. | Non-alloying core shell nanoparticles |
| WO2003001869A2 (en) * | 2001-06-29 | 2003-01-09 | California Institute Of Technology | Method and apparatus for use of plasmon printing in near-field lithography |
| US7473767B2 (en) | 2001-07-03 | 2009-01-06 | The Institute For Systems Biology | Methods for detection and quantification of analytes in complex mixtures |
| US6714299B2 (en) * | 2001-07-13 | 2004-03-30 | Genicon Sciences Corporation | Use of light scattering particles in design, manufacture, and quality control of small volume instruments, devices, and processes |
| WO2003064991A2 (en) * | 2001-07-17 | 2003-08-07 | Salafsky Joshua S | Method and apparatus using a nonlinear optical technique for detection of probe-target interactions in a field |
| US6991939B2 (en) * | 2001-07-19 | 2006-01-31 | Tufts University | Optical array device and methods of use thereof for screening, analysis and manipulation of particles |
| WO2003053535A2 (en) * | 2001-08-03 | 2003-07-03 | Nanosphere, Inc. | Nanoparticle imaging system and method |
| EP1286152B1 (en) * | 2001-08-07 | 2005-10-26 | Sysmex Corporation | Apparatus and method for measuring particle size |
| US20030049866A1 (en) * | 2001-09-05 | 2003-03-13 | Genicon Sciences Corporation | Sample device preservation |
| EP2302363A2 (en) * | 2001-09-05 | 2011-03-30 | Life Technologies Corporation | Method for normalization of assay data |
| WO2003025635A1 (en) * | 2001-09-19 | 2003-03-27 | Technion Research & Development Foundation Ltd. | Space-variant subwavelength dielectric grating and applications thereof |
| US7238477B2 (en) * | 2001-09-24 | 2007-07-03 | Intel Corporation | Methods to increase nucleotide signals by Raman scattering |
| US6972173B2 (en) | 2002-03-14 | 2005-12-06 | Intel Corporation | Methods to increase nucleotide signals by raman scattering |
| US7135054B2 (en) * | 2001-09-26 | 2006-11-14 | Northwestern University | Nanoprisms and method of making them |
| US20030148391A1 (en) * | 2002-01-24 | 2003-08-07 | Salafsky Joshua S. | Method using a nonlinear optical technique for detection of interactions involving a conformational change |
| US20070059760A1 (en) * | 2002-02-21 | 2007-03-15 | Dorsel Andreas N | Multi-featured arrays with reflective coating |
| US6795777B1 (en) * | 2002-03-04 | 2004-09-21 | The Texas A&M University System | Identifying molecules of a sample |
| US20040110208A1 (en) * | 2002-03-26 | 2004-06-10 | Selena Chan | Methods and device for DNA sequencing using surface enhanced Raman scattering (SERS) |
| US7476501B2 (en) * | 2002-03-26 | 2009-01-13 | Intel Corporation | Methods and device for DNA sequencing using surface enhanced raman scattering (SERS) |
| EP1594607A1 (en) * | 2002-05-06 | 2005-11-16 | Universität Tübingen | Method for producing patterns of physical, chemical or biochemical structures on carriers |
| AU2003237283A1 (en) * | 2002-05-28 | 2003-12-12 | Autogenomics, Inc. | Integrated sample processing platform |
| WO2003100380A2 (en) * | 2002-05-28 | 2003-12-04 | Autogenomics, Inc. | Integrated sample processing platform |
| WO2003104775A1 (en) * | 2002-06-08 | 2003-12-18 | Korea Basic Science Institute | Method for protein chip analysis by using surface plasmon resonance spectroscopic imaging technology |
| US6989897B2 (en) * | 2002-06-12 | 2006-01-24 | Intel Corporation | Metal coated nanocrystalline silicon as an active surface enhanced Raman spectroscopy (SERS) substrate |
| US6970239B2 (en) * | 2002-06-12 | 2005-11-29 | Intel Corporation | Metal coated nanocrystalline silicon as an active surface enhanced Raman spectroscopy (SERS) substrate |
| US7361313B2 (en) * | 2003-02-18 | 2008-04-22 | Intel Corporation | Methods for uniform metal impregnation into a nanoporous material |
| US6788477B2 (en) | 2002-10-22 | 2004-09-07 | Taiwan Semiconductor Manufacturing Co., Ltd. | Apparatus for method for immersion lithography |
| AU2003289853A1 (en) * | 2002-11-04 | 2004-06-07 | Ludwig-Maximilian-Uni Versitat Munchen | Methods, device and instrument for detection of analytes |
| US7122384B2 (en) * | 2002-11-06 | 2006-10-17 | E. I. Du Pont De Nemours And Company | Resonant light scattering microparticle methods |
| US20040101822A1 (en) * | 2002-11-26 | 2004-05-27 | Ulrich Wiesner | Fluorescent silica-based nanoparticles |
| EP1445601A3 (en) | 2003-01-30 | 2004-09-22 | Fuji Photo Film Co., Ltd. | Localized surface plasmon sensor chips, processes for producing the same, and sensors using the same |
| US7192703B2 (en) * | 2003-02-14 | 2007-03-20 | Intel Corporation, Inc. | Biomolecule analysis by rolling circle amplification and SERS detection |
| WO2004074508A2 (en) * | 2003-02-15 | 2004-09-02 | Golovlev Valeri V | Method of visualization and quantification of biopolymer molecules immobilized on solid support |
| US20080050842A1 (en) * | 2003-02-15 | 2008-02-28 | Golovlev Valeri V | Method of visualization and quanitification of biopolymer molecules immobilized on solid support |
| AU2003900924A0 (en) * | 2003-02-28 | 2003-03-13 | Medsaic Pty Ltd | Imaging device |
| EP1613787A4 (en) * | 2003-04-02 | 2007-09-26 | Univ Northwestern | Methods of controlling nanoparticle growth |
| US20040197841A1 (en) * | 2003-04-02 | 2004-10-07 | Apffel James Alexander | Methods and reagents for multiplexed analyses |
| US7976169B2 (en) * | 2003-05-14 | 2011-07-12 | Sun Innovations, Inc. | Waveguide display |
| US20040227694A1 (en) * | 2003-05-14 | 2004-11-18 | Xiao-Dong Sun | System and method for a three-dimensional color image display utilizing laser induced fluorescence of nanopartcles and organometallic molecules in a transparent medium |
| US7002681B1 (en) * | 2003-06-25 | 2006-02-21 | The United States Of America As Represented By The Secretary Of The Navy | Spectroscopy system for the detection of chemicals |
| AU2004274866B2 (en) * | 2003-08-01 | 2007-12-13 | Ge Healthcare Bio-Science Ab | Method and apparatus for quantitating surface-binding optical resonance profiles |
| IL157206A0 (en) * | 2003-08-03 | 2004-02-19 | Correlating spatial position of chemical species on a substrate with molecular weight, structure and chemical reactivity | |
| US20050191665A1 (en) * | 2003-12-29 | 2005-09-01 | Xing Su | Composite organic-inorganic nanoclusters |
| US20050147963A1 (en) * | 2003-12-29 | 2005-07-07 | Intel Corporation | Composite organic-inorganic nanoparticles and methods for use thereof |
| US7361410B2 (en) * | 2003-12-29 | 2008-04-22 | Intel Corporation | External modification of composite organic inorganic nanoclusters comprising raman active organic compound |
| US20080076119A9 (en) * | 2003-12-29 | 2008-03-27 | Lei Sun | Composite organic inorganic nanoclusters |
| US20050148100A1 (en) * | 2003-12-30 | 2005-07-07 | Intel Corporation | Methods and devices for using Raman-active probe constructs to assay biological samples |
| US20050141843A1 (en) * | 2003-12-31 | 2005-06-30 | Invitrogen Corporation | Waveguide comprising scattered light detectable particles |
| CA2834041C (en) * | 2003-12-31 | 2017-05-16 | President And Fellows Of Harvard College | Assay device and method |
| JP4261375B2 (en) * | 2004-01-15 | 2009-04-30 | 富士フイルム株式会社 | How to collect push shapes |
| US7243548B2 (en) * | 2004-04-07 | 2007-07-17 | Ut-Battelle, Llc | Surface wave chemical detector using optical radiation |
| CN101019019A (en) * | 2004-04-23 | 2007-08-15 | 奥克尼卡公司 | Surface enhanced spectrometry-active composite nanoparticles |
| JP2005309295A (en) * | 2004-04-26 | 2005-11-04 | Nec Corp | Element, device, and system for optical amplification |
| CN1957245B (en) * | 2004-05-19 | 2010-12-08 | Vp控股有限公司 | Optical sensor with layered plasmon structure for enhanced detection of chemical groups by SERS |
| WO2006091215A2 (en) * | 2004-06-18 | 2006-08-31 | The Trustees Of The University Of Pennsylvania | Optical circuits and circuit elements and methods of forming same |
| US7511285B2 (en) * | 2004-07-16 | 2009-03-31 | The Charles Stark Draper Laboratory, Inc. | Methods and apparatus for biomolecule identification |
| US20070048797A1 (en) * | 2004-08-11 | 2007-03-01 | Xing Su | Composite organic inorganic nanoclusters as carriers and identifiers of tester molecules |
| US7791290B2 (en) * | 2005-09-30 | 2010-09-07 | Virgin Islands Microsystems, Inc. | Ultra-small resonating charged particle beam modulator |
| US20070034518A1 (en) * | 2005-08-15 | 2007-02-15 | Virgin Islands Microsystems, Inc. | Method of patterning ultra-small structures |
| US7586097B2 (en) * | 2006-01-05 | 2009-09-08 | Virgin Islands Microsystems, Inc. | Switching micro-resonant structures using at least one director |
| US7626179B2 (en) * | 2005-09-30 | 2009-12-01 | Virgin Island Microsystems, Inc. | Electron beam induced resonance |
| US8057655B1 (en) * | 2004-08-20 | 2011-11-15 | The Board Of Trustees Of The Leland Stanford Junior University | Sub-micron object control arrangement and approach therefor |
| US9494581B2 (en) | 2004-08-24 | 2016-11-15 | University Of Wyoming | System and method for Raman spectroscopy assay using paramagnetic particles |
| US7776547B2 (en) * | 2004-08-26 | 2010-08-17 | Intel Corporation | Cellular analysis using Raman surface scanning |
| US8484000B2 (en) | 2004-09-02 | 2013-07-09 | Vialogy Llc | Detecting events of interest using quantum resonance interferometry |
| US7612769B2 (en) * | 2004-09-14 | 2009-11-03 | E.I. Du Pont De Nemours And Company | Computer-implemented methods for organizing image data produced by resonant Mie scattering of light from microparticles and resulting data structures |
| US7321422B2 (en) * | 2004-09-16 | 2008-01-22 | Hewlett-Packard Development Company, L.P. | SERS-active structures having nanoscale dimensions |
| ITMI20041801A1 (en) * | 2004-09-21 | 2004-12-21 | Solvay Solexis Spa | USE OF PERFLUOROPOLYMER SUBMICROMETRIC LATEXES IN THE DETERMINATION OF MOLECULAR INTERACTION BY LASER LIGHT SCATTERING (LLS) |
| US7285427B2 (en) * | 2004-10-06 | 2007-10-23 | General Electric Company | Raman-active particles and methods of making and using them |
| JP2006118920A (en) * | 2004-10-20 | 2006-05-11 | Institute Of Physical & Chemical Research | Method of observing interaction |
| US7656525B2 (en) * | 2004-10-21 | 2010-02-02 | University Of Georgia Research Foundation, Inc. | Fiber optic SERS sensor systems and SERS probes |
| US7658991B2 (en) * | 2004-10-21 | 2010-02-09 | University Of Georgia Research Foundation, Inc. | Structures having aligned nanorods and methods of making |
| US7880876B2 (en) * | 2004-10-21 | 2011-02-01 | University Of Georgia Research Foundation, Inc. | Methods of use for surface enhanced raman spectroscopy (SERS) systems for the detection of bacteria |
| US7583379B2 (en) | 2005-07-28 | 2009-09-01 | University Of Georgia Research Foundation | Surface enhanced raman spectroscopy (SERS) systems and methods of use thereof |
| US7738096B2 (en) * | 2004-10-21 | 2010-06-15 | University Of Georgia Research Foundation, Inc. | Surface enhanced Raman spectroscopy (SERS) systems, substrates, fabrication thereof, and methods of use thereof |
| US7867770B2 (en) * | 2004-12-03 | 2011-01-11 | Trustees Of Boston University | Nanostructured substrate for surface enhanced raman scattering |
| US20060147941A1 (en) * | 2004-12-30 | 2006-07-06 | Intel Corporation | Methods and apparatus for SERS assay of biological analytes |
| US20060170444A1 (en) * | 2005-02-02 | 2006-08-03 | Wu Zong M | Novel fluorescent and photoemission apparatus and method for submicron IC failure analysis |
| US7940387B2 (en) * | 2005-03-15 | 2011-05-10 | Univeristy Of Georgia Research Foundation, Inc. | Surface enhanced Raman spectroscopy (SERS) systems for the detection of viruses and methods of use thereof |
| US7889334B2 (en) * | 2005-03-15 | 2011-02-15 | University Of Georgia Research Foundation, Inc. | Surface enhanced Raman spectroscopy (SERS) systems for the detection of bacteria and methods of use thereof |
| JP2006279228A (en) * | 2005-03-28 | 2006-10-12 | Fuji Xerox Co Ltd | Image pickup apparatus |
| US20060222869A1 (en) * | 2005-04-04 | 2006-10-05 | Yuguang Cai | Electropen lithography |
| US7956991B2 (en) | 2005-04-04 | 2011-06-07 | Chemimage Corporation | Method and apparatus for interactive hyperspectral image subtraction |
| US20060221335A1 (en) * | 2005-04-04 | 2006-10-05 | Bangalore Arjun S | Method and apparatus for interactive hyperspectral image subtraction |
| US20060250613A1 (en) * | 2005-04-14 | 2006-11-09 | Chem Image Corporation | Method and applications to enhance and image optical signals from biological objects |
| EP1715326A1 (en) * | 2005-04-22 | 2006-10-25 | Universität Heidelberg | Sensor chip with connected non-metallic particles comprising a metallic coating |
| US8084001B2 (en) * | 2005-05-02 | 2011-12-27 | Cornell Research Foundation, Inc. | Photoluminescent silica-based sensors and methods of use |
| US20070111327A1 (en) * | 2005-05-05 | 2007-05-17 | Jay Gregory D | Methods of detecting lubricin |
| US8254227B2 (en) * | 2005-05-10 | 2012-08-28 | The Trustees Of The University Of Pennsylvania | Frequency-modulated coding and data recording and storage using plasmonic nanostructures |
| EP1915610A4 (en) | 2005-06-15 | 2010-05-19 | Univ Maryland Biotech Inst | Bioassays using plasmonic scattering from noble metal nanostructures |
| US7471388B1 (en) * | 2005-06-22 | 2008-12-30 | University Of Central Florida Research Foundation, Inc. | Frequency tunable resonant apparatus |
| ATE525655T1 (en) * | 2005-08-02 | 2011-10-15 | Univ Maryland | NANOSTRUCTURES FOR POLARIZED IMAGING AND RECEPTOR/LIGAND QUANTIFICATION: EXCEEDING THE DIFFRACTION LIMIT FOR IMAGING |
| DE102005037531A1 (en) * | 2005-08-09 | 2007-02-15 | Leica Microsystems Cms Gmbh | Method and apparatus for reducing systematic measurement errors in the microscopic examination of objects |
| US20070042510A1 (en) * | 2005-08-19 | 2007-02-22 | Wafermasters, Incorporated | In situ process monitoring and control |
| US20070092870A1 (en) * | 2005-10-20 | 2007-04-26 | Yiping Zhao | Detection of biomolecules |
| FR2893131A1 (en) * | 2005-11-09 | 2007-05-11 | Centre Nat Rech Scient | METHOD FOR DETECTING NANOPARTICLES AND ITS APPLICATIONS |
| US7579609B2 (en) * | 2005-12-14 | 2009-08-25 | Virgin Islands Microsystems, Inc. | Coupling light of light emitting resonator to waveguide |
| US7427762B2 (en) | 2005-12-21 | 2008-09-23 | Searete Llc | Variable multi-stage waveform detector |
| US7649180B2 (en) * | 2005-12-21 | 2010-01-19 | Searete Llc | Multi-stage waveform detector |
| US7649182B2 (en) * | 2006-10-26 | 2010-01-19 | Searete Llc | Variable multi-stage waveform detector |
| US7601967B2 (en) * | 2005-12-21 | 2009-10-13 | Searete Llc | Multi-stage waveform detector |
| US7391032B1 (en) * | 2005-12-21 | 2008-06-24 | Searete Llc | Multi-stage waveform detector |
| US8207907B2 (en) * | 2006-02-16 | 2012-06-26 | The Invention Science Fund I Llc | Variable metamaterial apparatus |
| CA2640385C (en) | 2005-12-23 | 2014-07-15 | Nanostring Technologies, Inc. | Nanoreporters and methods of manufacturing and use thereof |
| US20070155022A1 (en) * | 2005-12-30 | 2007-07-05 | Mineo Yamakawa | Degenerate binding detection and protein identification using Raman spectroscopy nanoparticle labels |
| US7470920B2 (en) * | 2006-01-05 | 2008-12-30 | Virgin Islands Microsystems, Inc. | Resonant structure-based display |
| US7619373B2 (en) * | 2006-01-05 | 2009-11-17 | Virgin Islands Microsystems, Inc. | Selectable frequency light emitter |
| US20070152781A1 (en) * | 2006-01-05 | 2007-07-05 | Virgin Islands Microsystems, Inc. | Switching micro-resonant structures by modulating a beam of charged particles |
| US20070190794A1 (en) * | 2006-02-10 | 2007-08-16 | Virgin Islands Microsystems, Inc. | Conductive polymers for the electroplating |
| US20070200063A1 (en) * | 2006-02-28 | 2007-08-30 | Virgin Islands Microsystems, Inc. | Wafer-level testing of light-emitting resonant structures |
| US7605835B2 (en) * | 2006-02-28 | 2009-10-20 | Virgin Islands Microsystems, Inc. | Electro-photographic devices incorporating ultra-small resonant structures |
| US7443358B2 (en) * | 2006-02-28 | 2008-10-28 | Virgin Island Microsystems, Inc. | Integrated filter in antenna-based detector |
| US20070200646A1 (en) * | 2006-02-28 | 2007-08-30 | Virgin Island Microsystems, Inc. | Method for coupling out of a magnetic device |
| US8259297B1 (en) * | 2006-03-03 | 2012-09-04 | Nanometrics Incorporated | Scanning focal length metrology |
| US7697135B1 (en) * | 2006-03-03 | 2010-04-13 | Nanometrics Incorporated | Scanning focal length metrology |
| US20100133489A1 (en) * | 2006-03-08 | 2010-06-03 | Northwestern University | Photoinduced phase separation of gold in two-component nanoparticles to form nanoprisms |
| US9068917B1 (en) * | 2006-03-14 | 2015-06-30 | Kla-Tencor Technologies Corp. | Systems and methods for inspection of a specimen |
| ITMI20060480A1 (en) * | 2006-03-16 | 2007-09-17 | Solvay Solexis Spa | USOM OF PERFLUOROPOLYMERS IN THE DTERMIBNAZIONE OF THE LIGANDO-RECEPTOR BOND CONSTANT |
| US7923240B2 (en) * | 2006-03-31 | 2011-04-12 | Intel Corporation | Photo-activated field effect transistor for bioanalyte detection |
| US7558490B2 (en) * | 2006-04-10 | 2009-07-07 | Virgin Islands Microsystems, Inc. | Resonant detector for optical signals |
| US20070247729A1 (en) * | 2006-04-25 | 2007-10-25 | Rudolph Technologies, Inc. | Reflective objective |
| US7876793B2 (en) | 2006-04-26 | 2011-01-25 | Virgin Islands Microsystems, Inc. | Micro free electron laser (FEL) |
| US7492868B2 (en) * | 2006-04-26 | 2009-02-17 | Virgin Islands Microsystems, Inc. | Source of x-rays |
| US7646991B2 (en) * | 2006-04-26 | 2010-01-12 | Virgin Island Microsystems, Inc. | Selectable frequency EMR emitter |
| US20070264023A1 (en) * | 2006-04-26 | 2007-11-15 | Virgin Islands Microsystems, Inc. | Free space interchip communications |
| US20070252089A1 (en) * | 2006-04-26 | 2007-11-01 | Virgin Islands Microsystems, Inc. | Charged particle acceleration apparatus and method |
| JP4890926B2 (en) * | 2006-04-28 | 2012-03-07 | キヤノン株式会社 | Detection method and kit |
| US7728702B2 (en) * | 2006-05-05 | 2010-06-01 | Virgin Islands Microsystems, Inc. | Shielding of integrated circuit package with high-permeability magnetic material |
| US20070257273A1 (en) * | 2006-05-05 | 2007-11-08 | Virgin Island Microsystems, Inc. | Novel optical cover for optical chip |
| US20070258675A1 (en) * | 2006-05-05 | 2007-11-08 | Virgin Islands Microsystems, Inc. | Multiplexed optical communication between chips on a multi-chip module |
| US7656094B2 (en) | 2006-05-05 | 2010-02-02 | Virgin Islands Microsystems, Inc. | Electron accelerator for ultra-small resonant structures |
| US7583370B2 (en) * | 2006-05-05 | 2009-09-01 | Virgin Islands Microsystems, Inc. | Resonant structures and methods for encoding signals into surface plasmons |
| US20070272931A1 (en) * | 2006-05-05 | 2007-11-29 | Virgin Islands Microsystems, Inc. | Methods, devices and systems producing illumination and effects |
| US7732786B2 (en) * | 2006-05-05 | 2010-06-08 | Virgin Islands Microsystems, Inc. | Coupling energy in a plasmon wave to an electron beam |
| US7557647B2 (en) * | 2006-05-05 | 2009-07-07 | Virgin Islands Microsystems, Inc. | Heterodyne receiver using resonant structures |
| US20070258720A1 (en) * | 2006-05-05 | 2007-11-08 | Virgin Islands Microsystems, Inc. | Inter-chip optical communication |
| US7986113B2 (en) * | 2006-05-05 | 2011-07-26 | Virgin Islands Microsystems, Inc. | Selectable frequency light emitter |
| US7741934B2 (en) * | 2006-05-05 | 2010-06-22 | Virgin Islands Microsystems, Inc. | Coupling a signal through a window |
| US7746532B2 (en) * | 2006-05-05 | 2010-06-29 | Virgin Island Microsystems, Inc. | Electro-optical switching system and method |
| US7554083B2 (en) * | 2006-05-05 | 2009-06-30 | Virgin Islands Microsystems, Inc. | Integration of electromagnetic detector on integrated chip |
| US7569836B2 (en) * | 2006-05-05 | 2009-08-04 | Virgin Islands Microsystems, Inc. | Transmission of data between microchips using a particle beam |
| US7723698B2 (en) * | 2006-05-05 | 2010-05-25 | Virgin Islands Microsystems, Inc. | Top metal layer shield for ultra-small resonant structures |
| US7586167B2 (en) * | 2006-05-05 | 2009-09-08 | Virgin Islands Microsystems, Inc. | Detecting plasmons using a metallurgical junction |
| US7718977B2 (en) | 2006-05-05 | 2010-05-18 | Virgin Island Microsystems, Inc. | Stray charged particle removal device |
| US8188431B2 (en) * | 2006-05-05 | 2012-05-29 | Jonathan Gorrell | Integration of vacuum microelectronic device with integrated circuit |
| US7710040B2 (en) * | 2006-05-05 | 2010-05-04 | Virgin Islands Microsystems, Inc. | Single layer construction for ultra small devices |
| US7728397B2 (en) * | 2006-05-05 | 2010-06-01 | Virgin Islands Microsystems, Inc. | Coupled nano-resonating energy emitting structures |
| WO2007129325A2 (en) * | 2006-05-09 | 2007-11-15 | Xceed Imaging Ltd. | Optical sub wavelength super resolution imaging system and method |
| US7573045B2 (en) * | 2006-05-15 | 2009-08-11 | Virgin Islands Microsystems, Inc. | Plasmon wave propagation devices and methods |
| US8980179B2 (en) * | 2006-05-17 | 2015-03-17 | University Of Maryland, Baltimore County | Angular-dependent metal-enhanced fluorescence |
| US20070274365A1 (en) * | 2006-05-26 | 2007-11-29 | Virgin Islands Microsystems, Inc. | Periodically complex resonant structures |
| US7679067B2 (en) * | 2006-05-26 | 2010-03-16 | Virgin Island Microsystems, Inc. | Receiver array using shared electron beam |
| JP4923763B2 (en) | 2006-06-09 | 2012-04-25 | 富士ゼロックス株式会社 | Method for producing silver triangular pyramid particles, and silver triangular pyramid particles |
| US7655934B2 (en) | 2006-06-28 | 2010-02-02 | Virgin Island Microsystems, Inc. | Data on light bulb |
| JP2008058209A (en) * | 2006-09-01 | 2008-03-13 | Ricoh Co Ltd | Composite metal nano particle, multiphoton absorbing reaction material containing composite metal nano particle, reaction product and multiphoton absorbing reaction aid containing composite metal nano particle |
| JP5151097B2 (en) * | 2006-09-01 | 2013-02-27 | 株式会社リコー | Composite metal nanoparticles, multiphoton absorption reaction materials and reaction products containing composite metal nanoparticles, and multiphoton absorption reaction aids containing composite metal nanoparticles |
| US8124598B2 (en) | 2006-09-14 | 2012-02-28 | Sharon Sageman | 7-keto DHEA for psychiatric use |
| US7560716B2 (en) * | 2006-09-22 | 2009-07-14 | Virgin Islands Microsystems, Inc. | Free electron oscillator |
| US8284477B2 (en) * | 2006-10-10 | 2012-10-09 | The Trustees Of The University Of Pennsylvania | Lumped plasmonic “diode” and lumped plasmonic “rectifier” for optical field rectification and lumped optical second harmonic generation |
| WO2008067103A2 (en) * | 2006-10-30 | 2008-06-05 | Stc.Unm | Magnetically susceptible particles and apparatuses for mixing the same |
| US7714997B2 (en) | 2006-11-07 | 2010-05-11 | Hitachi High-Technologies Corporation | Apparatus for inspecting defects |
| US8078420B2 (en) * | 2006-11-15 | 2011-12-13 | Miller Gary L | Raman spectrometry authentication |
| US7659513B2 (en) * | 2006-12-20 | 2010-02-09 | Virgin Islands Microsystems, Inc. | Low terahertz source and detector |
| FR2910632B1 (en) * | 2006-12-22 | 2010-08-27 | Commissariat Energie Atomique | OPTICAL PLASMON ENCODING DEVICE AND AUTHENTICATION METHOD EMPLOYING THE SAME |
| US7738094B2 (en) | 2007-01-26 | 2010-06-15 | Becton, Dickinson And Company | Method, system, and compositions for cell counting and analysis |
| US20080199880A1 (en) * | 2007-02-21 | 2008-08-21 | Porter Marc D | Spin array method |
| CA2981992C (en) | 2007-03-20 | 2020-06-30 | Becton, Dickinson And Company | Assays using surface-enhanced raman spectroscopy (sers)-active particles |
| GB2447696A (en) * | 2007-03-23 | 2008-09-24 | Univ Exeter | Photonic biosensor arrays |
| GB2447698A (en) * | 2007-03-23 | 2008-09-24 | Univ Exeter | Fabrication of photonic biosensor arrays |
| US20080241853A1 (en) * | 2007-03-29 | 2008-10-02 | Concurrent Analytical, Inc. | Microtiter spin array |
| WO2009009198A2 (en) * | 2007-04-18 | 2009-01-15 | Becton, Dickinson And Company | Sers nanotag assays |
| US7460238B2 (en) * | 2007-04-24 | 2008-12-02 | Corporation De L'ecole Polytechnique De Montreal | Plasmon excitation by the gaussian-like core mode of a photonic crystal waveguide |
| JP5116362B2 (en) * | 2007-05-28 | 2013-01-09 | 株式会社リコー | Biosensor |
| US7990336B2 (en) * | 2007-06-19 | 2011-08-02 | Virgin Islands Microsystems, Inc. | Microwave coupled excitation of solid state resonant arrays |
| JP2009025295A (en) | 2007-06-21 | 2009-02-05 | Canon Inc | Apparatus and method for detecting target substance |
| JP5157284B2 (en) | 2007-06-28 | 2013-03-06 | 株式会社リコー | Photosensitized composite material and three-dimensional memory material and recording medium, light limiting material and element, photocurable material and stereolithography system, fluorescent material and apparatus for multiphoton fluorescence microscope |
| JP5351163B2 (en) * | 2007-08-22 | 2013-11-27 | ファディア・アクチボラグ | Reading method and reading apparatus |
| US20100204459A1 (en) * | 2007-08-27 | 2010-08-12 | The Regents Of The University Of California | Systems and methods for producing multi-component colloidal structures |
| US20100160274A1 (en) * | 2007-09-07 | 2010-06-24 | Sharon Sageman | 7-KETO DHEA for Psychiatric Use |
| US7791053B2 (en) | 2007-10-10 | 2010-09-07 | Virgin Islands Microsystems, Inc. | Depressed anode with plasmon-enabled devices such as ultra-small resonant structures |
| JP2009098010A (en) * | 2007-10-17 | 2009-05-07 | Fujifilm Corp | Cantilever for near-field optical microscope, plasma enhanced fluorescence microscope using the same, and fluorescence detection method |
| WO2009055702A1 (en) * | 2007-10-24 | 2009-04-30 | Purdue Research Foundation | Time of death biosensor |
| US8507785B2 (en) | 2007-11-06 | 2013-08-13 | Pacific Integrated Energy, Inc. | Photo induced enhanced field electron emission collector |
| US8004673B2 (en) * | 2007-11-21 | 2011-08-23 | Hitachi High-Technologies Corporation | Photometric instrument |
| US9086400B2 (en) * | 2007-11-29 | 2015-07-21 | Cornell Research Foundation, Inc. | Amplifier and array for measuring small current |
| KR20090070886A (en) | 2007-12-27 | 2009-07-01 | 삼성전자주식회사 | A method for amplifying variation of frequency of signal in piezoelectrical biosensor |
| JP5094484B2 (en) * | 2008-03-11 | 2012-12-12 | 富士フイルム株式会社 | Fluorescence detection method and fluorescence detection apparatus |
| CL2009000560A1 (en) | 2008-03-11 | 2010-02-19 | Univ Duke | A method of hardening a radiation hardenable medium comprising placing a composition within an object to be hardened, applying at least one chosen from x-ray, gamma ray, or electron beam through the object and within the composition. |
| JP2009229103A (en) * | 2008-03-19 | 2009-10-08 | Toshiba Corp | Quantification method of metal colloid |
| JP5097590B2 (en) * | 2008-03-26 | 2012-12-12 | 富士フイルム株式会社 | Raman signal measuring method and Raman signal measuring apparatus |
| JP5450993B2 (en) * | 2008-07-14 | 2014-03-26 | 富士フイルム株式会社 | Detection method, detection sample cell and detection kit |
| US9182406B2 (en) * | 2008-08-04 | 2015-11-10 | Biodesy, Inc. | Nonlinear optical detection of molecules comprising an unnatural amino acid possessing a hyperpolarizability |
| JP5836803B2 (en) | 2008-08-14 | 2015-12-24 | ナノストリング テクノロジーズ, インコーポレイテッド | Stable nanoreporter |
| WO2010029471A1 (en) * | 2008-09-09 | 2010-03-18 | Koninklijke Philips Electronics N.V. | Method for determining the presence of a sample on a sample receiving surface |
| CN102227626A (en) * | 2008-09-30 | 2011-10-26 | 蒙特利尔大学 | High resolution surface plasmon resonance instrument using dove prism |
| JP5707021B2 (en) * | 2008-09-30 | 2015-04-22 | 株式会社日立ハイテクノロジーズ | Magnetic field measuring device |
| GB2464747B (en) * | 2008-10-10 | 2013-05-15 | Hai Kang Life Corp Ltd | Method for detection of analyte in microarray of samples and apparatus for performing such method |
| GB2464300A (en) * | 2008-10-10 | 2010-04-14 | Univ Dublin City | Microfluidic multiplexed cellular and molecular analysis device and method |
| DK200801722A (en) * | 2008-12-05 | 2010-06-06 | Unisensor As | Optical sectioning of a sample and detection of particles in a sample |
| US20100163759A1 (en) * | 2008-12-31 | 2010-07-01 | Stmicroelectronics S.R.L. | Radiation sensor with photodiodes being integrated on a semiconductor substrate and corresponding integration process |
| US20100197508A1 (en) * | 2009-02-03 | 2010-08-05 | The Administrator of the National Aeronautics and Space Administration, United States of America | Integrated Universal Chemical Detector with Selective Diffraction Array |
| NZ595456A (en) | 2009-03-02 | 2012-12-21 | Genia Photonics Inc | Assessing interactions of a sample with light beams having different wavelengths with the use of an intensity modulation function |
| US8039272B2 (en) | 2009-04-01 | 2011-10-18 | Nova Biomedical | Rapid quantification assay involving concentrated and ligand-coated gold colloid |
| US20100252514A1 (en) * | 2009-04-03 | 2010-10-07 | Min-Ju Chung | Foldable baseball equipment rack |
| WO2010123993A1 (en) | 2009-04-21 | 2010-10-28 | Tuan Vo-Dinh | Non-invasive energy upconversion methods and systems for in-situ photobiomodulation |
| CA2772020A1 (en) * | 2009-08-31 | 2011-03-03 | Mbio Diagnostics, Inc. | Integrated sample preparation and analyte detection |
| AU2010306862B2 (en) | 2009-10-13 | 2015-08-27 | Nanostring Technologies, Inc. | Protein detection via nanoreporters |
| EP2513636B1 (en) * | 2009-12-18 | 2020-08-05 | Koninklijke Philips N.V. | Substance determining apparatus |
| AU2011215753B2 (en) | 2010-02-11 | 2015-09-03 | Nanostring Technologies, Inc. | Compositions and methods for the detection of small RNAs |
| EP2372348A1 (en) * | 2010-03-22 | 2011-10-05 | Imec | Methods and systems for surface enhanced optical detection |
| JP5609241B2 (en) * | 2010-04-28 | 2014-10-22 | セイコーエプソン株式会社 | Spectroscopic method and analyzer |
| EP2580788A2 (en) | 2010-06-08 | 2013-04-17 | Pacific Integrated Energy, Inc. | Optical antennas with enhanced fields and electron emission |
| US8950684B1 (en) * | 2010-10-25 | 2015-02-10 | The Boeing Company | Fluorescent barcode for identification |
| US9036144B2 (en) * | 2010-11-05 | 2015-05-19 | Ondavia, Inc. | Nano-/micro-droplets for the detection of analytes |
| EP2646795B1 (en) * | 2010-11-29 | 2019-02-20 | Dako Denmark A/S | Methods for analyzing images of specimens processed by a programmable quantitative assay |
| CN102162792B (en) * | 2011-01-10 | 2012-10-24 | 南京航空航天大学 | HPRT (hypoxanthine phosphoribosyl transferase) body gene mutation detection method based on surface plasmon resonance |
| CN103492859B (en) * | 2011-02-28 | 2017-05-24 | 皇家飞利浦有限公司 | Substance determining apparatus |
| GB2503604B (en) | 2011-03-21 | 2020-04-22 | Biodesy Llc | Classification of kinase inhibitors using second harmonic optical techniques |
| US9072473B2 (en) | 2011-03-24 | 2015-07-07 | The Arizona Board Of Regents On Behalf Of The University Of Arizona | In-vivo optical sensor |
| WO2012135340A2 (en) | 2011-03-28 | 2012-10-04 | Nanostring Technologies, Inc. | Compositions and methods for diagnosing cancer |
| US8810789B2 (en) | 2011-11-07 | 2014-08-19 | University Of Georgia Research Foundation, Inc. | Thin layer chromatography-surfaced enhanced Raman spectroscopy chips and methods of use |
| AU2012340722B2 (en) | 2011-11-21 | 2018-03-29 | Zoetis Services Llc | Signal amplification in lateral flow and related immunoassays |
| US20130135617A1 (en) * | 2011-11-30 | 2013-05-30 | General Electric Company | Plasmonic optical transducer |
| US20130196449A1 (en) * | 2012-01-17 | 2013-08-01 | Hewlett-Packard Development Company, L.P. | Electrically driven devices for surface enhanced raman spectroscopy |
| GB2520111A (en) | 2012-02-05 | 2015-05-13 | Biodesy Inc | Methods for identifying modulators of Ras using nonlinear techniques |
| US9395358B2 (en) | 2012-02-05 | 2016-07-19 | Biodesy, Inc. | Methods for detecting allosteric modulators of protein |
| US20130288271A1 (en) | 2012-04-25 | 2013-10-31 | Biodesy, Llc | Methods for detecting allosteric modulators of protein |
| JP5986308B2 (en) | 2012-06-22 | 2016-09-06 | アップル インコーポレイテッド | White-like anodic oxide film and method for forming the same |
| JP6351180B2 (en) * | 2012-07-09 | 2018-07-04 | サーモ エレクトロン サイエンティフィック インストルメンツ リミテッド ライアビリティ カンパニー | Electric path length variable cell for spectroscopic measurement |
| US9493876B2 (en) * | 2012-09-14 | 2016-11-15 | Apple Inc. | Changing colors of materials |
| WO2014164929A1 (en) * | 2013-03-11 | 2014-10-09 | Kla-Tencor Corporation | Defect detection using surface enhanced electric field |
| CN105247348A (en) * | 2013-03-12 | 2016-01-13 | 文塔纳医疗系统公司 | Digitally enhanced microscopy for multiplexed histology |
| WO2014191003A1 (en) * | 2013-05-28 | 2014-12-04 | Chemometec A/S | Image forming cytometer |
| US20150049332A1 (en) * | 2013-07-30 | 2015-02-19 | The Curators Of The University Of Missouri | Gold nanoisland arrays |
| ES2877351T3 (en) | 2013-08-07 | 2021-11-16 | Univ Wayne State | Micro-raman-based portable detection instrument and detection method |
| LT3041507T (en) | 2013-08-26 | 2021-08-25 | Biontech Research And Development, Inc. | Nucleic acids encoding human antibodies to sialyl-lewis a |
| US9181629B2 (en) | 2013-10-30 | 2015-11-10 | Apple Inc. | Methods for producing white appearing metal oxide films by positioning reflective particles prior to or during anodizing processes |
| US9839974B2 (en) | 2013-11-13 | 2017-12-12 | Apple Inc. | Forming white metal oxide films by oxide structure modification or subsurface cracking |
| US9097737B2 (en) | 2013-11-25 | 2015-08-04 | Oxford Instruments Asylum Research, Inc. | Modular atomic force microscope with environmental controls |
| US9492840B2 (en) * | 2013-12-02 | 2016-11-15 | Samsung Electronics Co., Ltd. | Methods of removing surface ligand compounds |
| CN104808329B (en) * | 2014-01-25 | 2017-08-08 | 清华大学 | A kind of optical microscope system |
| US10620128B2 (en) * | 2014-02-17 | 2020-04-14 | Eaton Intelligent Power Limited | Oxygen sensor having a tip coated large diameter optical fiber utilizing a trichroic prism or tricolor sensor |
| US9659360B2 (en) | 2014-02-26 | 2017-05-23 | Georg-August-Universitaet Goettingen Stiftung Oeffentlichen Rechts | Identifying an original object in a forgery-proof way |
| WO2015130980A1 (en) * | 2014-02-26 | 2015-09-03 | Lamdagen Corporation | Digital lspr for enhanced assay sensitivity |
| AU2015271685B2 (en) | 2014-06-04 | 2021-02-18 | Biontech Research And Development, Inc. | Human monoclonal antibodies to ganglioside GD2 |
| US9989534B2 (en) | 2014-06-30 | 2018-06-05 | Biodesy, Inc. | Systems and methods for high throughput analysis of conformation in biological entities |
| TWI691716B (en) | 2014-08-13 | 2020-04-21 | 美商艾巴希斯公司 | Signal amplification in plasmonic specific-binding partner assays |
| US10445869B2 (en) | 2014-12-03 | 2019-10-15 | Bombardier Inc. | Online inspection for composite structures |
| EP3037861A1 (en) * | 2014-12-23 | 2016-06-29 | Commissariat à l'Énergie Atomique et aux Énergies Alternatives | Imaging method, and system, for obtaining an super-resolution image of an object |
| EP3237906B8 (en) | 2014-12-23 | 2020-10-28 | Bluelight Therapeutics, Inc. | Attachment of proteins to interfaces for use in nonlinear optical detection |
| WO2016150957A1 (en) * | 2015-03-25 | 2016-09-29 | Asml Netherlands B.V. | Metrology methods, metrology apparatus and device manufacturing method |
| EP3278087A4 (en) | 2015-04-02 | 2018-12-19 | Biodesy, Inc. | Methods for determining protein structure using a surface-selective nonlinear optical technique |
| CA2982764C (en) * | 2015-04-14 | 2023-05-23 | Capital One Services, Llc | A system, method, and apparatus for a dynamic transaction card |
| EP3317624B1 (en) * | 2015-07-05 | 2019-08-07 | The Whollysee Ltd. | Optical identification and characterization system and tags |
| CN108350486B (en) | 2015-07-17 | 2021-09-03 | 纳米线科技公司 | Simultaneous quantification of gene expression in user-defined regions of cross-sectional tissue |
| JP6971219B2 (en) | 2015-07-17 | 2021-11-24 | ナノストリング テクノロジーズ,インコーポレイティド | Simultaneous quantification of multiple proteins in a user-defined region of a cross-tissue section |
| JP6944438B2 (en) | 2015-08-04 | 2021-10-06 | ゾエティス サービシズ リミテッド ライアビリティ カンパニー | Signal amplification in solution-based plasmon-specific binding partner assay |
| US10395895B2 (en) | 2015-08-27 | 2019-08-27 | Mks Instruments, Inc. | Feedback control by RF waveform tailoring for ion energy distribution |
| WO2017053911A1 (en) * | 2015-09-24 | 2017-03-30 | Baird Zane | Mass tag analysis for rare cells and cell free molecules |
| WO2017087823A1 (en) | 2015-11-18 | 2017-05-26 | Mir Kalim U | Super-resolution sequencing |
| US10809195B2 (en) | 2015-12-23 | 2020-10-20 | Koninklijke Philips N.V. | Optical detection of particles in a fluid |
| CN109154551B (en) | 2015-12-30 | 2021-05-14 | 生物辐射实验室股份有限公司 | Detection and signal processing system for particle assays |
| US9846111B2 (en) * | 2015-12-30 | 2017-12-19 | Bio-Rad Laboratories, Inc. | Optical detection system for particles |
| TW201725385A (en) * | 2016-01-05 | 2017-07-16 | 財團法人工業技術研究院 | Raman detecting chip for thin layer chromatography and method for separating and detecting an analyte |
| US11232940B2 (en) * | 2016-08-02 | 2022-01-25 | Virgin Instruments Corporation | Method and apparatus for surgical monitoring using MALDI-TOF mass spectrometry |
| US20180052893A1 (en) * | 2016-08-22 | 2018-02-22 | Eung Joon JO | Database management using a matrix-assisted laser desorption/ionization time-of-flight mass spectrometer |
| KR101810846B1 (en) | 2016-08-23 | 2017-12-20 | 한국기초과학지원연구원 | FAR-FIELD Plasmonic Lens AND FAR-FIELD Plasmonic Lens ASSEMBLY |
| US10409052B2 (en) * | 2016-09-28 | 2019-09-10 | University Of Washington | Inverted light-sheet microscope |
| JP6747939B2 (en) * | 2016-10-28 | 2020-08-26 | 日本電信電話株式会社 | Detection method and device |
| CN110225980B (en) | 2016-11-21 | 2023-01-06 | 纳米线科技公司 | Chemical compositions and methods of use thereof |
| WO2019073069A1 (en) | 2017-10-13 | 2019-04-18 | Boehringer Ingelheim International Gmbh | Human antibodies to thomsen-nouvelle (tn) antigen |
| EP3752635A1 (en) | 2018-02-12 | 2020-12-23 | Nanostring Technologies, Inc. | Biomolecular probes and methods of detecting gene and protein expression |
| CN112703255A (en) | 2018-05-14 | 2021-04-23 | 纳米线科技公司 | Chemical compositions and methods of use thereof |
| US11698304B2 (en) | 2019-02-15 | 2023-07-11 | Wayne State University | Apparatuses, systems, and methods for detecting materials based on Raman spectroscopy |
| KR102191673B1 (en) * | 2019-03-04 | 2020-12-17 | 한국과학기술원 | Endomicroscopic having ultra compact lensed fiber probe |
| WO2021021024A1 (en) * | 2019-07-31 | 2021-02-04 | Nanyang Technological University | Platform for stand-off and real-time sers sensing of airborne analytes |
| US10613012B1 (en) * | 2019-10-17 | 2020-04-07 | Horiba Instruments Incorporated | Apparatus and method for observation of microscopic movements and counting of particles in colloids |
| EP4067102A1 (en) | 2021-04-02 | 2022-10-05 | Kaunas University of Technology | An optical device with ordered scatterer arrays for secure identity and a method of producing the same |
| CN113281323B (en) * | 2021-06-29 | 2024-01-26 | 集美大学 | Method for extracting characteristic information of organic pollutants in complex system and rapid detection method and system thereof |
| WO2023243490A1 (en) * | 2022-06-14 | 2023-12-21 | 国立大学法人徳島大学 | Nanoparticle body, composite containing nanoparticle bodies, and method for forming polymer membrane containing nanoparticle body |
Family Cites Families (56)
| Publication number | Priority date | Publication date | Assignee | Title |
|---|---|---|---|---|
| US3856398A (en) | 1972-11-13 | 1974-12-24 | D Taylor | Apparatus and method for wide area, dark field, high resolution autoradiography |
| US3801183A (en) * | 1973-06-01 | 1974-04-02 | Minnesota Mining & Mfg | Retro-reflective film |
| US4099854A (en) | 1976-10-12 | 1978-07-11 | The Unites States Of America As Represented By The Secretary Of The Navy | Optical notch filter utilizing electric dipole resonance absorption |
| US4202626A (en) * | 1978-02-24 | 1980-05-13 | A Patent Partnership | Signature verification and authentication systems |
| NL7807532A (en) * | 1978-07-13 | 1980-01-15 | Akzo Nv | METAL IMMUNO TEST. |
| US4481091A (en) | 1981-02-17 | 1984-11-06 | At&T Bell Laboratories | Chemical processing using electromagnetic field enhancement |
| US4416998A (en) | 1981-04-02 | 1983-11-22 | The Upjohn Company | Silver stain procedure and kit for same |
| US4514085A (en) * | 1982-06-28 | 1985-04-30 | Beckman Instruments, Inc. | Marking and authenticating documents with liquid crystal materials |
| US4645301A (en) * | 1983-02-07 | 1987-02-24 | Minnesota Mining And Manufacturing Company | Transparent sheet containing authenticating image and method of making same |
| US5236826A (en) * | 1985-12-10 | 1993-08-17 | Murex Corporation | Immunoassay for the detection or quantitation of an analyte |
| US5501949A (en) | 1985-12-10 | 1996-03-26 | Murex Diagnostics Corporation | Particle bound binding component immunoassay |
| US4877647A (en) | 1986-04-17 | 1989-10-31 | Kansas State University Research Foundation | Method of coating substrates with solvated clusters of metal particles |
| ES2024468B3 (en) | 1987-09-25 | 1992-03-01 | Ibm | SENSOR TO CONVERT A DISTANCE TO OPTICS AND ALSO TO ELECTRICAL ENERGY, AND A SURFACE EXPLORATION DEVICE USING THE SAME |
| US4979821A (en) * | 1988-01-27 | 1990-12-25 | Ortho Diagnostic Systems Inc. | Cuvette for receiving liquid sample |
| GB8830039D0 (en) * | 1988-12-22 | 1989-02-15 | Renishaw Plc | Raman microscope |
| US5023139A (en) | 1989-04-04 | 1991-06-11 | Research Corporation Technologies, Inc. | Nonlinear optical materials |
| US5338353A (en) | 1989-04-07 | 1994-08-16 | Nippon Shokubai Kagaku Kogyo | Method for production of powder of fine inorganic particles |
| US5376556A (en) | 1989-10-27 | 1994-12-27 | Abbott Laboratories | Surface-enhanced Raman spectroscopy immunoassay |
| US5790693A (en) * | 1990-02-05 | 1998-08-04 | Cummins-Allison Corp. | Currency discriminator and authenticator |
| GB9012099D0 (en) * | 1990-05-31 | 1990-07-18 | Kodak Ltd | Optical article for multicolour imaging |
| FI85768C (en) | 1990-07-04 | 1992-05-25 | Valtion Teknillinen | FOERFARANDE FOER UTFOERNING AV YTPLASMONRESONANSMAETNING SAMT I FOERFARANDET ANVAENDBAR GIVARE. |
| US5225900A (en) * | 1990-12-31 | 1993-07-06 | Xerox Corporation | Method of storing information within a reproduction system |
| US5817462A (en) * | 1995-02-21 | 1998-10-06 | Applied Spectral Imaging | Method for simultaneous detection of multiple fluorophores for in situ hybridization and multicolor chromosome painting and banding |
| DE69110032T2 (en) * | 1991-06-08 | 1995-12-21 | Hewlett Packard Gmbh | Method and device for determining and / or determining the concentration of biomolecules. |
| US5249077A (en) | 1991-12-12 | 1993-09-28 | Microvideo Instruments, Inc. | Darkfield illuminator for a microscope slide |
| US5248772A (en) | 1992-01-29 | 1993-09-28 | Coulter Corporation | Formation of colloidal metal dispersions using aminodextrans as reductants and protective agents |
| US5451525A (en) | 1992-02-14 | 1995-09-19 | Coulter Corporation | Method and materials for determining particle count in a flow cytometer |
| CA2076709A1 (en) * | 1992-08-24 | 1994-02-25 | Ulrich J. Krull | Amplified fluorescence emission for chemical transduction |
| US5618063A (en) * | 1992-12-09 | 1997-04-08 | Wallace Computer Services, Inc. | Multicolor heat-sensitive verification and highlighting system |
| DE4244086C2 (en) * | 1992-12-24 | 1994-10-27 | Florin Ernst Ludwig | Method and device for the detection of surface plasmons |
| US5485277A (en) * | 1994-07-26 | 1996-01-16 | Physical Optics Corporation | Surface plasmon resonance sensor and methods for the utilization thereof |
| US5479024A (en) | 1994-08-11 | 1995-12-26 | The Regents Of The University Of California | Method and apparatus for performing near-field optical microscopy |
| US5599668A (en) | 1994-09-22 | 1997-02-04 | Abbott Laboratories | Light scattering optical waveguide method for detecting specific binding events |
| US6025202A (en) * | 1995-02-09 | 2000-02-15 | The Penn State Research Foundation | Self-assembled metal colloid monolayers and detection methods therewith |
| US6363164B1 (en) * | 1996-05-13 | 2002-03-26 | Cummins-Allison Corp. | Automated document processing system using full image scanning |
| CA2220551A1 (en) * | 1995-05-12 | 1996-11-14 | Schering Corporation | Surface plasmon resonance based enzymatic assay |
| US5935755A (en) * | 1995-08-21 | 1999-08-10 | Xerox Corporation | Method for document marking and recognition |
| US5633724A (en) * | 1995-08-29 | 1997-05-27 | Hewlett-Packard Company | Evanescent scanning of biochemical array |
| US6174677B1 (en) * | 1995-10-13 | 2001-01-16 | Ut-Battelle, Llc | Advanced surface-enhanced Raman gene probe systems and methods thereof |
| US5815278A (en) * | 1995-10-25 | 1998-09-29 | University Of Washington | Surface plasmon resonance light pipe sensing probe and related interface optics |
| CA2253710A1 (en) | 1996-04-25 | 1997-10-30 | Spectrametrix Inc. | Analyte assay using particulate labels |
| US5717518A (en) * | 1996-07-22 | 1998-02-10 | Kla Instruments Corporation | Broad spectrum ultraviolet catadioptric imaging system |
| WO1998037417A1 (en) * | 1997-02-20 | 1998-08-27 | The Regents Of The University Of California | Plasmon resonant particles, methods and apparatus |
| US6344272B1 (en) * | 1997-03-12 | 2002-02-05 | Wm. Marsh Rice University | Metal nanoshells |
| US6002476A (en) * | 1998-04-22 | 1999-12-14 | Chemicon Inc. | Chemical imaging system |
| US6992770B2 (en) * | 2001-01-25 | 2006-01-31 | Fuji Photo Film Co., Ltd. | Sensor utilizing attenuated total reflection |
| US6914668B2 (en) * | 2003-05-14 | 2005-07-05 | International Technologies (Laser) Ltd. | Personal identification verification and controlled substance detection and identification system |
| US7956997B2 (en) * | 2003-05-27 | 2011-06-07 | Optotrace Technologies, Inc. | Systems and methods for food safety detection |
| US7820064B2 (en) * | 2005-05-10 | 2010-10-26 | The Regents Of The University Of California | Spinodally patterned nanostructures |
| JP2010507099A (en) * | 2006-10-16 | 2010-03-04 | ザ アリゾナ ボード オブ リージェンツ ア ボディ コーポレイト オブ ザ ステイト オブ アリゾナ アクティング フォー アンド オン ビハーフ オブ アリゾナ ステイト ユニバーシティー | Synthetic antibody |
| US7869030B2 (en) * | 2007-01-03 | 2011-01-11 | Research Foundation Of State University Of New York | Aggregates of plural transition metal nanoparticles and plural cyanine dye molecules |
| CA2717563C (en) * | 2008-03-03 | 2017-02-28 | Kansas State University Research Foundation | Diagnostic assays for detecting protease activity associated with cancer |
| US20120021967A1 (en) * | 2008-04-23 | 2012-01-26 | Arizona Board of Regents, A Body Corporate of the State Of Arizona Acting for and Behalf of Arizona | Synthetic antibodies |
| US20120065123A1 (en) * | 2009-03-24 | 2012-03-15 | Johnston Stephen A | Synthetic Antibodies |
| WO2010123941A2 (en) * | 2009-04-20 | 2010-10-28 | Enhanced Spectrometry, Inc. | Method for storing and coding information with raman-active substances |
| CA2731892A1 (en) * | 2011-02-18 | 2012-08-18 | Universite De Montreal | Nanometric capsule raman scattering probes, method of production and use |
-
1998
- 1998-02-20 WO PCT/US1998/002995 patent/WO1998037417A1/en active IP Right Grant
- 1998-02-20 CA CA002280794A patent/CA2280794A1/en not_active Abandoned
- 1998-02-20 DE DE69836734T patent/DE69836734D1/en not_active Expired - Lifetime
- 1998-02-20 JP JP53677498A patent/JP4209471B2/en not_active Expired - Lifetime
- 1998-02-20 AT AT98906473T patent/ATE349697T1/en not_active IP Right Cessation
- 1998-02-20 AU AU61690/98A patent/AU748939B2/en not_active Expired
- 1998-02-20 US US09/027,048 patent/US6180415B1/en not_active Expired - Lifetime
- 1998-02-20 EP EP98906473A patent/EP0979409B1/en not_active Expired - Lifetime
-
2000
- 2000-12-18 US US09/740,615 patent/US7501288B2/en not_active Expired - Fee Related
-
2009
- 2009-03-05 US US12/398,180 patent/US7981695B2/en not_active Expired - Fee Related
-
2011
- 2011-06-09 US US13/157,151 patent/US8309370B2/en not_active Expired - Fee Related
-
2012
- 2012-10-17 US US13/654,005 patent/US8759116B2/en not_active Expired - Fee Related
-
2014
- 2014-03-26 US US14/226,173 patent/US20140209683A1/en not_active Abandoned
Also Published As
| Publication number | Publication date |
|---|---|
| AU748939B2 (en) | 2002-06-13 |
| ATE349697T1 (en) | 2007-01-15 |
| US20090161104A1 (en) | 2009-06-25 |
| EP0979409A1 (en) | 2000-02-16 |
| US6180415B1 (en) | 2001-01-30 |
| JP2001513198A (en) | 2001-08-28 |
| AU6169098A (en) | 1998-09-09 |
| US20140209683A1 (en) | 2014-07-31 |
| US20130038868A1 (en) | 2013-02-14 |
| US20110244479A1 (en) | 2011-10-06 |
| EP0979409B1 (en) | 2006-12-27 |
| DE69836734D1 (en) | 2007-02-08 |
| US7501288B2 (en) | 2009-03-10 |
| US7981695B2 (en) | 2011-07-19 |
| CA2280794A1 (en) | 1998-08-27 |
| US8759116B2 (en) | 2014-06-24 |
| EP0979409A4 (en) | 2005-08-03 |
| US20010002315A1 (en) | 2001-05-31 |
| US8309370B2 (en) | 2012-11-13 |
| WO1998037417A1 (en) | 1998-08-27 |
Similar Documents
| Publication | Publication Date | Title |
|---|---|---|
| JP4209471B2 (en) | Plasmon resonant particles, methods, and apparatus | |
| WO1998037417A9 (en) | Plasmon resonant particles, methods and apparatus | |
| RU2251572C2 (en) | Method for analysis of analytes with the use of particles as marks | |
| JP4247770B2 (en) | Analyte assays using particulate labels | |
| US7076092B2 (en) | High-throughput, dual probe biological assays based on single molecule detection | |
| US20090015831A1 (en) | Methods for providing extended dynamic range in analyte assays | |
| AU2002245537A1 (en) | Methods for providing extended dynamic range in analyte assays | |
| Docherty et al. | Multiple labelled nanoparticles for bio detection | |
| US6756014B2 (en) | Biochemical sensor and biochemical testing system using the same | |
| KR100808762B1 (en) | Detecting Method For Nano Bio-Chip | |
| JP2002253233A (en) | Biochemical sensor and biochemical survey instrument using the same | |
| KR20060066053A (en) | Method and apparatus for recognizing molecular compounds |
Legal Events
| Date | Code | Title | Description |
|---|---|---|---|
| A521 | Request for written amendment filed |
Free format text: JAPANESE INTERMEDIATE CODE: A523 Effective date: 20050214 |
|
| A621 | Written request for application examination |
Free format text: JAPANESE INTERMEDIATE CODE: A621 Effective date: 20050214 |
|
| A131 | Notification of reasons for refusal |
Free format text: JAPANESE INTERMEDIATE CODE: A131 Effective date: 20070828 |
|
| A601 | Written request for extension of time |
Free format text: JAPANESE INTERMEDIATE CODE: A601 Effective date: 20071106 |
|
| A602 | Written permission of extension of time |
Free format text: JAPANESE INTERMEDIATE CODE: A602 Effective date: 20071217 |
|
| A601 | Written request for extension of time |
Free format text: JAPANESE INTERMEDIATE CODE: A601 Effective date: 20071211 |
|
| A602 | Written permission of extension of time |
Free format text: JAPANESE INTERMEDIATE CODE: A602 Effective date: 20080128 |
|
| A601 | Written request for extension of time |
Free format text: JAPANESE INTERMEDIATE CODE: A601 Effective date: 20080124 |
|
| A602 | Written permission of extension of time |
Free format text: JAPANESE INTERMEDIATE CODE: A602 Effective date: 20080303 |
|
| A521 | Request for written amendment filed |
Free format text: JAPANESE INTERMEDIATE CODE: A523 Effective date: 20080219 |
|
| A131 | Notification of reasons for refusal |
Free format text: JAPANESE INTERMEDIATE CODE: A131 Effective date: 20080507 |
|
| A521 | Request for written amendment filed |
Free format text: JAPANESE INTERMEDIATE CODE: A523 Effective date: 20080804 |
|
| TRDD | Decision of grant or rejection written | ||
| A01 | Written decision to grant a patent or to grant a registration (utility model) |
Free format text: JAPANESE INTERMEDIATE CODE: A01 Effective date: 20080930 |
|
| A01 | Written decision to grant a patent or to grant a registration (utility model) |
Free format text: JAPANESE INTERMEDIATE CODE: A01 |
|
| A61 | First payment of annual fees (during grant procedure) |
Free format text: JAPANESE INTERMEDIATE CODE: A61 Effective date: 20081023 |
|
| R150 | Certificate of patent or registration of utility model |
Free format text: JAPANESE INTERMEDIATE CODE: R150 |
|
| FPAY | Renewal fee payment (event date is renewal date of database) |
Free format text: PAYMENT UNTIL: 20111031 Year of fee payment: 3 |
|
| FPAY | Renewal fee payment (event date is renewal date of database) |
Free format text: PAYMENT UNTIL: 20121031 Year of fee payment: 4 |
|
| FPAY | Renewal fee payment (event date is renewal date of database) |
Free format text: PAYMENT UNTIL: 20121031 Year of fee payment: 4 |
|
| FPAY | Renewal fee payment (event date is renewal date of database) |
Free format text: PAYMENT UNTIL: 20131031 Year of fee payment: 5 |
|
| R250 | Receipt of annual fees |
Free format text: JAPANESE INTERMEDIATE CODE: R250 |
|
| R250 | Receipt of annual fees |
Free format text: JAPANESE INTERMEDIATE CODE: R250 |
|
| R250 | Receipt of annual fees |
Free format text: JAPANESE INTERMEDIATE CODE: R250 |
|
| R250 | Receipt of annual fees |
Free format text: JAPANESE INTERMEDIATE CODE: R250 |
|
| R250 | Receipt of annual fees |
Free format text: JAPANESE INTERMEDIATE CODE: R250 |
|
| EXPY | Cancellation because of completion of term |