EP4553455A1 - System and method for rayleigh-based distributed acousting sensing - Google Patents
System and method for rayleigh-based distributed acousting sensing Download PDFInfo
- Publication number
- EP4553455A1 EP4553455A1 EP24211642.4A EP24211642A EP4553455A1 EP 4553455 A1 EP4553455 A1 EP 4553455A1 EP 24211642 A EP24211642 A EP 24211642A EP 4553455 A1 EP4553455 A1 EP 4553455A1
- Authority
- EP
- European Patent Office
- Prior art keywords
- response
- light signal
- probe
- optical fiber
- rayleigh
- Prior art date
- Legal status (The legal status is an assumption and is not a legal conclusion. Google has not performed a legal analysis and makes no representation as to the accuracy of the status listed.)
- Granted
Links
Images





Classifications
-
- G—PHYSICS
- G01—MEASURING; TESTING
- G01H—MEASUREMENT OF MECHANICAL VIBRATIONS OR ULTRASONIC, SONIC OR INFRASONIC WAVES
- G01H9/00—Measuring mechanical vibrations or ultrasonic, sonic or infrasonic waves by using radiation-sensitive means, e.g. optical means
- G01H9/004—Measuring mechanical vibrations or ultrasonic, sonic or infrasonic waves by using radiation-sensitive means, e.g. optical means using fibre optic sensors
-
- G—PHYSICS
- G01—MEASURING; TESTING
- G01D—MEASURING NOT SPECIALLY ADAPTED FOR A SPECIFIC VARIABLE; ARRANGEMENTS FOR MEASURING TWO OR MORE VARIABLES NOT COVERED IN A SINGLE OTHER SUBCLASS; TARIFF METERING APPARATUS; MEASURING OR TESTING NOT OTHERWISE PROVIDED FOR
- G01D5/00—Mechanical means for transferring the output of a sensing member; Means for converting the output of a sensing member to another variable where the form or nature of the sensing member does not constrain the means for converting; Transducers not specially adapted for a specific variable
- G01D5/26—Mechanical means for transferring the output of a sensing member; Means for converting the output of a sensing member to another variable where the form or nature of the sensing member does not constrain the means for converting; Transducers not specially adapted for a specific variable characterised by optical transfer means, i.e. using infrared, visible, or ultraviolet light
- G01D5/32—Mechanical means for transferring the output of a sensing member; Means for converting the output of a sensing member to another variable where the form or nature of the sensing member does not constrain the means for converting; Transducers not specially adapted for a specific variable characterised by optical transfer means, i.e. using infrared, visible, or ultraviolet light with attenuation or whole or partial obturation of beams of light
- G01D5/34—Mechanical means for transferring the output of a sensing member; Means for converting the output of a sensing member to another variable where the form or nature of the sensing member does not constrain the means for converting; Transducers not specially adapted for a specific variable characterised by optical transfer means, i.e. using infrared, visible, or ultraviolet light with attenuation or whole or partial obturation of beams of light the beams of light being detected by photocells
- G01D5/353—Mechanical means for transferring the output of a sensing member; Means for converting the output of a sensing member to another variable where the form or nature of the sensing member does not constrain the means for converting; Transducers not specially adapted for a specific variable characterised by optical transfer means, i.e. using infrared, visible, or ultraviolet light with attenuation or whole or partial obturation of beams of light the beams of light being detected by photocells influencing the transmission properties of an optical fibre
- G01D5/35338—Mechanical means for transferring the output of a sensing member; Means for converting the output of a sensing member to another variable where the form or nature of the sensing member does not constrain the means for converting; Transducers not specially adapted for a specific variable characterised by optical transfer means, i.e. using infrared, visible, or ultraviolet light with attenuation or whole or partial obturation of beams of light the beams of light being detected by photocells influencing the transmission properties of an optical fibre using other arrangements than interferometer arrangements
- G01D5/35354—Sensor working in reflection
- G01D5/35358—Sensor working in reflection using backscattering to detect the measured quantity
- G01D5/35361—Sensor working in reflection using backscattering to detect the measured quantity using elastic backscattering to detect the measured quantity, e.g. using Rayleigh backscattering
Definitions
- the present disclosure relates to distributed sensing in optical fibers.
- the present disclosure relates to a system and method for Rayleigh-based distributed acoustic sensing.
- DFOS distributed fiber optic sensing
- a known scheme typically used for DFOS is the so-called "single-ended" scheme, schematically depicted in Figure 1 .
- one end of an optical fiber 1 having a transmission property susceptible to the physical parameter to be sensed is connected to an interrogator device 2.
- the interrogator device 2 sends a probe light signal into the optical fiber 1 and detects the corresponding response light signal transmitted back by the optical fiber 1 in response thereto.
- the interrogator device 2 then processes the response light signal, thereby extracting information indicative of the physical parameter to be sensed.
- DAS distributed acoustic sensing
- acoustic event will designate a pressure change causing a localized strain (in particular, an axial strain) of the sensing optical fiber deployed along the structure to be monitored.
- the acoustic event may be a vibration, namely a periodic pressure change causing a localized strain of the sensing optical fiber which periodically varies over time.
- DAS is based on an analysis of the response light signal which is generated by the optical fiber when the probe light signal propagating therethrough undergoes a linear, elastic backscattering, in particular Rayleigh backscattering.
- RDAS Rayleigh-based DAS
- reflectometric techniques Rayleigh-based DAS
- Known reflectometric techniques can be divided into two main categories, according to the nature of the probe light signal exploited.
- a first category of reflectometric techniques employs pulse-shaped probe light signals. More specifically, in pulse-based reflectometric techniques (such as OTDR, namely Optical Time Domain Reflectometer), a sequence of light pulses is injected in the optical fiber, and one measurement of the response light signal is performed per each injected light pulse.
- pulse-based reflectometric techniques such as OTDR, namely Optical Time Domain Reflectometer
- a second category of reflectometric techniques instead makes use of non-pulse-shaped probe light signals.
- non-pulse-based reflectometric techniques such as OFDR, namely Optical Frequency Domain Reflectometer
- the probe light signal typically is a continuous wave whose instantaneous frequency is periodically linearly swept in time, the linearity of the sweep being a requirement for the technique to be effective. For each period of the frequency linear sweep, one measurement of the response light signal is typically performed.
- the response light signal of the optical fiber is measured at discrete time instants equally spaced by a measurement period ⁇ t r .
- the maximum detectable acoustic frequency will be also termed "acoustic bandwidth”.
- the limit on the maximum detectable acoustic frequency f a is determined by two factors.
- the first one is the maximum temporal rate at which the linear sweep of the instantaneous frequency of the probe light signal can be performed.
- the second one is the ratio between the period of the vibration to be sensed and the period of the frequency linear sweep. More precisely, the period of the frequency linear sweep shall be shorter than the period of the vibration.
- L max reducing the period of the frequency linear sweep requires increasing the electrical bandwidth at detection. Owing to these requirements, implementing long-range RDAS with large acoustic bandwidth is rather challenging.
- the way in which the linear sweep of the instantaneous frequency of the probe light signal is obtained determines the presence of intrinsic deadtime also in non-pulse-based reflectometric techniques. For example, if a tunable laser source is used to generate the probe light signal, the deadtime corresponds to the "recoiling" phase, during which the tunable laser is brought back to the initial frequency after a linear sweep is completed.
- the Applicant has tackled the problem of providing a system and method for Rayleigh-based distributed acoustic sensing which exhibit substantially no deadtime and a measurement period whose lower limit is substantially independent of the target sensing range L max .
- the Rayleigh response may then be converted into a spatial-domain Rayleigh response, through the propagation speed of light in the optical fiber.
- information indicative of the acoustic event to be sensed may be obtained.
- the repetition period T will be equal to the reciprocal of the spacing f m between the frequency-domain samples of H ( ⁇ k ), and the time-domain sampling interval dt will be equal to T / N , N corresponding to the number of samples composing H ( ⁇ k ).
- a probe electrical signal A ( t ) and a response electrical signal B ( t ) are obtained, whose spectra have again discrete support A ', which is substantially rigidly shifted towards baseband relatively to A and whose corresponding values are still a k and b k (short of a fixed scale factor).
- a point-wise ratio according to the right-hand side of equation [2] between the discrete Fourier transforms of the sampled signals a [ n ⁇ dt ] and b [ n ⁇ dt ] shall provide the frequency response coefficients H ( ⁇ k ), as long as the points of A' are contained in the set of discrete frequencies over which the spectra of a [ n ⁇ dt ] and b [ n ⁇ dt ] are sampled by the discrete Fourier transform.
- u corresponds to the starting index from which samples of a [ n ⁇ dt ] are taken and v is the starting index from which samples of b [ n ⁇ dt ] are taken.
- the two arrays may be time misaligned, meaning that the starting indexes u and v may have different values.
- dz c 0 2 A ′ ⁇ 1 f m n g
- c 0 the propagation speed of light in vacuum
- n g the group refractive index in the optical fiber
- is the cardinality of the discrete support A' of the spectra of the electrical signals A ( t ) and B ( t ), and the factor 2 accounts for the round-trip propagation of the probe light signal through the optical fiber.
- the measurement of the Rayleigh response may be iterated at discrete time instants, thereby providing a sequence of measurements of the spatial-domain Rayleigh response h[m ⁇ dz] equally spaced in time by the iteration period, which basically represents the measurement period ⁇ t r .
- a new iteration may be performed by incrementing the values of the starting indexes u and v of the same positive integer amount q ⁇ 1, as long as samples of the electrical signals A ( t ) and B ( t ) are available.
- the lower limit of the measurement period ⁇ t r is substantially independent of the target sensing range L max .
- the minimum measurement period ⁇ t r of the Rayleigh response is equal to the sampling period dt, which not only is a function of the modulation frequency f m (and hence of L max ), but is also inversely proportional to the integer number M .
- M the lower limit of the measurement period ⁇ t r may be arbitrarily reduced. From the practical point of view, this means that the lower limit of the measurement period ⁇ t r is substantially due to the processing capabilities of the data processing unit implementing the sampling and the processing of the electrical signals provided by the optical coherent detection of the probe light signal and response light signal.
- the result of the procedure above i.e. the sequence of measurements of the spatial-domain Rayleigh response h [ m ⁇ dz ] equally spaced in time by the iteration period, is then processed to obtain information indicative of the acoustic event.
- known algorithms can be applied, e.g. spectral correlation analysis or direct phase demodulation as explained for example in Z. He and Q. Liu, "Optical Fiber Distributed Acoustic Sensors: A Review," in Journal of Lightwave Technology, vol. 39, no. 12, pp. 3671-3686, 15 June, 2021, doi: 10. 11 09/J LT. 2021.305977 1 .
- the present disclosure provides a system for Rayleigh-based distributed acoustic sensing of an acoustic event, the system comprising:
- the periodically modulated probe light signal a ( t ) is a non-pulsed shaped light signal, where "non-pulsed shaped light signal” means that the amplitude of the light signal may vanish only in a discrete set of time instants.
- the system further comprises two polarization controllers configured to bring the unmodulated light signal c(t) on respective mutually orthogonal polarizations states
- the second optical detector comprises two optical detectors, each one operating on a respective polarization state.
- the system further comprises an optical amplifier configured to increase the optical power of the probe light signal a ( t ) before it is injected in the optical fiber.
- system further comprises a further optical amplifier configured to increases the optical power of the response light signal b ( t ) before it is received by the second optical detector.
- the present disclosure provides a method for Rayleigh-based distributed acoustic sensing of an acoustic event, the method comprising:
- step (d) comprises sampling the probe electrical signal A ( t ) and the response electrical signal B ( t ) synchronously.
- step (e) comprises identifying the first array of N consecutive probe samples and the second array of N consecutive response samples in a time-misaligned way.
- step (f) comprises:
- step (g) comprises determining a spatial-domain Rayleigh response h [ m ⁇ dz ] of the optical fiber and obtaining the information indicative of the acoustic event based on the spatial-domain Rayleigh response h [ m ⁇ dz ] .
- steps (d) to (g) are periodically iterated at discrete time instants, thereby providing a sequence of spatial-domain Rayleigh responses h [ m ⁇ dz ] equally spaced in time.
- the method further comprises applying a spectral correlation analysis to at least two spatial-domain Rayleigh responses h [ m ⁇ dz ] measured at different times t 1 and t 2 .
- Figure 2 shows a system 1000 for Rayleigh-based distributed acoustic sensing according to embodiments of the present invention.
- the system 1000 comprises an optical fiber 100 and an interrogator device 200 connected to one end of the optical fiber 100 according to a single-ended scheme.
- the optical fiber 100 is deployed along a structure to be monitored (not depicted in Figure 2 ) and has transmission properties susceptible to variations of the strain induced by possible acoustic events (either impulsive events or vibrations) affecting the structure to be monitored.
- the Applicant has made positive tests using a single mode ITU-T G.652 optical fiber.
- the length of the optical fiber 100 may be up to 50-100 km, as an example.
- the interrogator device 200 comprises a laser source 3 configured to generate a probe light signal a ( t ) and inject it into the optical fiber 100.
- the probe light signal a ( t ) is a light signal with carrier frequency ⁇ 0 , periodically modulated with a modulation frequency f m .
- the modulation may be applied to one or more of the probe light signal's quantities, namely amplitude, frequency, and phase.
- the modulation may be a non-linear modulation.
- the periodically modulated probe light signal a ( t ) may be a non-pulsed shaped light signal, where "non-pulsed shaped light signal” means that the amplitude of the light signal may vanish only in a discrete set of time instants.
- the carrier frequency ⁇ 0 of the probe light signal a ( t ) may be selected within a frequency range in which the optical fiber 100 is single mode.
- the laser source 3 has a coherence length equal to at least 2 ⁇ L max .
- the interrogator device 200 also comprises two optical detectors 4a 4b.
- Each optical detector 4a, 4b is configured to perform a coherent detection of a respective light signal. More particularly, the optical detector 4a is configured to perform a coherent detection of the probe light signal a ( t ) as injected in the optical fiber 100, while the optical detector 4b is configured to perform a coherent detection of the response light signal b ( t ) emitted by the optical fiber 100 in response to the probe light signal a ( t ) undergoing Rayleigh backscattering through the optical fiber 100.
- the interrogator device 200 comprises an optical splitter 5 and an optical circulator 6.
- the optical splitter 5 has an input connected to the output of the laser source 3 and two outputs connected to the optical detector 4a and to one of the ports of the optical circulator 6, respectively. Two further ports of the optical circulator 6 are connected to the optical fiber 100 and to the optical detector 4b, respectively.
- the probe light signal a ( t ) is split into two portions: one portion is sent to the optical detector 4a, while the other portion is sent to the optical fibre 100 via the optical circulator 6.
- the response light signal b ( t ) provided by the optical fiber 100 is sent via the circulator 6 to the optical detector 4b.
- the optical splitter 5 may have a splitting ratio comprised between 85:15 and 95:5, for example 90:10, the major part of the probe light signal a ( t ) being directed towards the optical fiber 100 via the optical circulator 6.
- the Applicant has made positive test using a 1x2 optical splitter 90:10 TN1550R2A1 by Thorlabs (Newton, New Jersey, USA) and a 3 port, single mode optical circulator 6015-3-APC by Thorlabs (Newton, New Jersey, USA).
- the interrogator device 200 also comprises a data processing unit 7 cooperating with the optical detectors 4a, 4b.
- the data processing unit 7 is configured to process the probe electrical signal A ( t ) and the response electrical signal B ( t ) to provide information indicative of the acoustic event to be sensed.
- the probe electrical signal A ( t ) and the response electrical signal B ( t ) may be synchronously sampled.
- the two arrays of N consecutive samples may be time misaligned, meaning that the starting indexes u and v may have different values.
- a discrete-time Fourier transform e.g. an FTT, Fast Fourier Transform
- a contiguous subset K' ⁇ K may be chosen; the first part of â ' is constructed taking (max K' + 1) samples from â , one each G samples, starting from â 0 towards â N -1 (e.g. [ â 0 , â G , â 2 G , ... ]). The second part of â ' is constructed taking
- the arrays â ' and b ⁇ ' basically are restricted to points corresponding to frequency values contained in their discrete frequency-domain support.
- the array ⁇ is then subjected to an inverse discrete-time Fourier transform (e.g. an IFFT, Inverse Fast Fourier Transform), thereby obtaining a time-domain Rayleigh response h [ m ⁇ dt ] of
- the data processing unit 7 then processes the spatial-domain Rayleigh response h [ m ⁇ dz ] to provide information indicative of the acoustic event to be sensed (step 304). Further details on this step will be provided herein below.
- the measurement of the Rayleigh response as per steps 302-304 may be iterated at discrete time instants, until end of the measurement session (step 305). Such iterations result in a sequence of measurements of the spatial-domain Rayleigh response h [ m ⁇ dz ] equally spaced in time by the iteration period, which basically represents the measurement period ⁇ t r .
- a new iteration may be performed by incrementing the values of the starting indexes u and v of the same positive integer amount q ⁇ 1, as long as samples of the electrical signals A ( t ) and B ( t ) are available.
- the lower limit of the measurement period ⁇ t r is substantially independent of the target sensing range L max .
- the minimum measurement period ⁇ t r of the Rayleigh response is equal to the sampling period dt, which not only is a function of the modulation frequency f m (and hence of L max ), but is also inversely proportional to the integer number M .
- M the lower limit of the measurement period ⁇ t r may be arbitrarily reduced. From the practical point of view, this means that the lower limit of the measurement period ⁇ t r is substantially due to the processing capabilities of the data processing unit implementing the sampling and the processing of the electrical signals provided by the optical coherent detection of the probe light signal and response light signal.
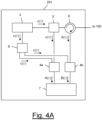
- Figure 4A shows an interrogator device 201 according to a first variant.
- the laser source 3 of the interrogator device 201 is also configured to provide an unmodulated light signal c ( t ).
- the coherence length of the unmodulated light signal c ( t ) may be equal to at least 2 ⁇ L max .
- the carrier frequency of the unmodulated light signal c ( t ) may be selected within a frequency range in which the optical fiber 100 is single mode.
- the carrier frequency of the unmodulated light signal c ( t ) may be shifted by a frequency shift f int relative to the carrier frequency of the probe light signal a ( t ).
- the frequency shift f int for example is in the RF range and such that f int ⁇
- the frequency shift can be, for example, in the range 100-500 MHz.
- the probe light signal a ( t ) and the unmodulated light signal c ( t ) are emitted through separate outputs of the laser source 3.
- the interrogator device 201 also comprises a further optical splitter 8.
- the further optical splitter 8 has an input connected to the output of laser source 2 through which the unmodulated light signal c ( t ) is emitted, and two outputs connected to the optical detectors 4a, 4b.
- the optical splitter 8 may be a 50:50 optical splitter.
- the Applicant has made positive tests using an optical splitter TN1550R5A1 by Thorlabs (Newton, New Jersey, USA).
- each optical detectors 4a, 4b use the unmodulated light signal c ( t ) to perform a heterodyne coherent detection of the light signals a ( t ) and b ( t ) respectively, as it will be described in further detail herein below.
- each optical detectors 4a, 4b may comprise an optical coupler 2x2 and a photodiode.
- the optical coupler 2x2 may be a 50:50 coupler, whose inputs receive the unmodulated light signal c ( t ) and the light signal a ( t ) or b ( t ), respectively, and whose outputs provide the received light signals to the photodiode.
- each optical detector 4a, 4b has made positive tests using, for each optical detector 4a, 4b, one C-band 50:50, 2x2 single mode optical coupler TN1550R5A2 by Thorlabs (Newton, New Jersey, USA) and a balanced photodiode PDB-480C-AC by Thorlabs (Newton, New Jersey, USA).
- each light signal a ( t ), b ( t ) may be heterodyned with the unmodulated light signal c ( t ).
- Such electrical signals are then sampled by the data processing unit 7 as described above, so as to provide the probe sampled signal a [ n ⁇ dt ] and the response sampled signal b [ n ⁇ dt ] .
- the data processing unit 7 then may subject the sampled signals a [ n ⁇ dt ] , b [ n ⁇ dt ] to a digital quadrature demodulation, to provide a baseband representation of such signals, i.e.
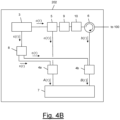
- Figure 4B shows an interrogator device 202 according to a second variant.
- the interrogator device 202 in addition to the components of the interrogator device 201 according to the first variant, also comprises an optical amplifier 9 interposed between the optical splitter 5 and the optical circulator 6.
- the optical amplifier 9 increases the optical power of the probe light signal a ( t ).
- the optical amplifier 9 may be an Erbium-doped fiber amplifier (EDFA).
- EDFA Erbium-doped fiber amplifier
- the optical amplifier 9 may be followed by an optical filter 10, in particular a bandpass optical filter.
- the optical amplifier 9 advantageously increases the optical power of the probe light signal a ( t ) and then allows increasing the target sensing range L max .of the optical fiber 100.
- Figure 4C shows an interrogator device 203 according to a third variant.
- the optical amplifier 9 and the optional optical filter 10 are interposed between the circulator 6 and the optical detector 4b.
- the optical amplifier 9 advantageously increases the optical power of the response light signal b ( t ) before it is received by the optical detector 4b, and then allows increasing the target sensing range L max .of the optical fiber 100.
- Figure 4D shows an interrogator device 204 according to a fourth variant.
- the fourth variant implements a coherent polarization-diversity scheme.
- the interrogator device 204 according to the fourth variant comprises two polarization controllers 11 and 12 connected to respective outputs of the optical splitter 8.
- Such polarization controllers 11 and 12 are configured to bring the unmodulated light signal c ( t ) on respective mutually orthogonal polarizations states.
- two optical detectors 4b1 and 4b2 are provided, each one operating on a respective polarization state.
- a polarization beam splitter 13 is provided, which separates the two polarization states of the response light signal b ( t ) and provides each one of them to a respective optical detectors 4b1 and 4b2 for separate heterodyne detection, which results into two separate response electrical signals B 1( t ) and B 2( t ).
- Each response electrical signal B 1( t ) and B 2( t ) is then separately subjected to the processing according to steps 301-304 of the flow chart of Figure 3 .
- the processing results in a couple of Rayleigh responses, one per each polarization state. This may be beneficial in providing additional information on the acoustic event to be sensed.
- Figure 5 shows in further detail the laser source 3 comprised in the interrogator device 201, 202, 203, 204.
- the laser source 3 for example comprises a CW laser 30, an optical splitter 31, a frequency shifter 32, an optical wave modulator 33 and a RF signal generator 34.
- the CW laser 30 for example is configured to emit the unmodulated light signal c ( t ).
- the optical frequency of the CW laser 30 may be comprised in the optical C-band, which ranges from 1530 nm to 1565 nm.
- the Applicant has made positive tests using a CW laser source Koheras Adjustik X15 HP by NKT Photonics (Birkeroed, Denmark).
- the optical splitter 31 has an input connected to the output of the CW laser 30 so as to split the unmodulated light signal c ( t ) into two portions.
- the splitting ratio of the optical splitter 31 may be comprised between 85:15 and 95:5, for example 90:10.
- the optical splitter 31 has two outputs: one output (the one emitting the major part of the unmodulated light signal c ( t )) is connected to the frequency shifter 32, while the other output (the one emitting the minor part of the unmodulated light signal c ( t )) is connected to the input of the optical splitter 8, which further splits the minor part of the unmodulated light signal c ( t ) and provides each part to a respective optical detector 4a, 4b, which uses it to perform heterodyne demodulation, as described above.
- the Applicant has made positive tests using a 1x2 optical splitter 90:10 TN1550R2A1 by Thorlabs (Newton, New Jersey, USA).
- the frequency shifter 32 is configured to shift the optical frequency of the major part of the unmodulated light signal c ( t ) by the frequency shift f int .
- the Applicant has made positive tests using the acousto-optic modulator FIBER-Q T-M110-0.2C2J-3-F2S (FS).
- the optical wave modulator 33 is configured to modulate the output of the frequency shifter 32 with a modulation frequency f m , so as to provide the probe light signal a ( t ). As discussed above, the modulation may be applied to one or more of the light signal's quantities, namely amplitude, frequency, and phase.
- the Applicant has made positive tests using the optical phase modulator LN81S-FC (MOD) by Thorlabs (Newton, New Jersey, USA).
- optical fiber 100 an optical fiber link of length L ⁇ 6.1 km, composed of two connected spools of single mode ITU-T G.652 optical fiber, whose lengths were respectively equal to 4.8 km and 1.3 km.
- the graph in Figure 6 shows the results of a single measurement of the spatial-domain Rayleigh response h [ m ⁇ dz ] obtained by a single iteration of steps 302-304 described above. The following parameters were applied:
- the abscissa axis represents the position z along the optical fiber 100, while the ordinate axis represents the normalized magnitude in dB of the spatial-domain Rayleigh response h [ m ⁇ dz ] .
- a 20-m-long moving average filter (11 samples) has been applied to the magnitude.
- the measurement of the spatial-domain Rayleigh response h [ m ⁇ dz ] may be repeated at discrete time instants, thereby providing a sequence of measurements of the spatial-domain Rayleigh response h [ m ⁇ dz ] equally spaced in time by the measurement period ⁇ t r .
- the data processing unit 7 processes the spatial-domain Rayleigh response h [ m ⁇ dz ] to provide information indicative of the acoustic event to be sensed (step 304 in the flow chart of Figure 3 ).
- the data processing unit 7 processes the spatial-domain Rayleigh response h [ m ⁇ dz ] by applying a spectral correlation analysis (SCA), which allows identifying a variation of the strain applied to a section Z of the optical fiber 100 between two different times t 1 and t 2 . More specifically, the spatial-domain Rayleigh response h [ m ⁇ dz ] is measured at times t 1 and t 2 . Then, the two measurements of the spatial-domain Rayleigh responses h [ m ⁇ dz ] are windowed to select only the spatial points pertaining to the section Z , thereby obtaining two arrays h 1 and h 2 .
- SCA spectral correlation analysis
- the spectral cross-correlation exhibits a peak at a frequency lag ⁇ f ⁇ ⁇ ⁇ ⁇ 0.
- the data processing unit 7 performs the following processing.
- the data processing unit 7 performs R measurements of the spatial-domain Rayleigh response, by repeating steps 302-304 above R times (step 801).
- the dataset obtained by the data processing unit 7 at step 801 may be represented as a R ⁇
- the second index indicates a specific spatial window and is represented by p .
- the new third index w identifies a spatial sample within the p th window.
- the data processing unit 7 choses a reference spatial-domain Rayleigh response with index r * and, for each value of the index r other than r and for every value of p , calculates a cross-correlation according to the following equation: HH ⁇ r * , p ⁇ HH ⁇ r , p l where HH ⁇ x , y is the array [ ⁇ x,y,f ⁇ f ⁇ [0,..., F - 1]] and ⁇ stands for cross-correlation of two discrete sequences with lag l .
- step 801 the data processing unit 7 reverts to step 801, thereby acquiring a new R 'x
- dataset H [ h r' , m ], r' ⁇ [ R, ..., R + R' - 1] to which the processing according to steps 802-805 is applied.
- the iterations of steps 801-805 thus enable a continuous monitoring of the optical fiber 100, until the end of the measurement session (step 806).
- the Applicant has performed some tests of the above procedure for processing the spatial-domain Rayleigh response h [ m ⁇ dz ] to provide information indicative of acoustic events of different types.
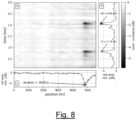
- a first type of acoustic event considered were impulsive events. Specifically, the system capability to sense two 25-ps-long pulses, spaced by 1.25 ms was tested.
- the tested optical fiber 100 was composed by two spools of standard ITU-T G.652 optical fiber, of lengths respectively equal to 4.8 km and 1.3 km, connected through a fiber stretcher.
- the starting coordinate of the spatial window ( p , i.e. the distance along the optical fiber 100) is reported on the abscissa axis
- time ( r ) is set forth on the ordinate axis
- the time localization of the two acoustic events can be performed by inspecting the row-wise minimum of the plane's magnitude.
- the two curves are reported in subplot c of Errore. L'edge riferimento non 6 stata trovata. 8, respectively as dotted-dashed and dashed lines.
- the location of the acoustic events can be obtained as the global minimum of the two curves, corresponding, in both cases, to z ⁇ 4826 m.
- the two acoustic events occurring at the same spatial position along the optical fiber 100 can be detected even if their time distance is not an integer multiple of the measurement period of an equivalent pulse-based RDAS system such as OTDR.
- the optical fiber 100 was composed by two spools of standard ITU-T G.652 optical fiber, of lengths respectively equal to 4.8 km and 1.3 km, connected through a fiber stretcher.
- the starting coordinate of the spatial window ( p + P , i.e. the distance along the optical fiber 100) is reported on the abscissa axis
- time ( r ) is reported on the ordinate axis
- the spatial localization of the vibration can be performed by computing the power of the phase signal along time per each spatial window (i.e. column-wise).
- the curve obtained is shown in Figure 9(b) , normalized with respect to its own maximum Errore .
- the spatial location of the vibration may be identified as the global maximum of the curve and corresponds to an index p 0 + P which in turn represents position z 0 ⁇ 4826 m within the optical fiber 100.
- the obtained magnitude is set forth in Figure 9(c) Errore. L'edge riferimento non 6 stata trovata. .
- frequency is reported on the abscissa axis and normalized amplitude on the ordinate axis; normalization is performed with respect to the maximum value.
- the system 1000 therefore is advantageous in that it exhibits substantially no deadtime and a measurement period whose lower limit is substantially independent of the target sensing range L max . It can therefore be used for a variety of applications, including for example:
Landscapes
- Physics & Mathematics (AREA)
- General Physics & Mathematics (AREA)
- Optical Transform (AREA)
- Measurement Of Mechanical Vibrations Or Ultrasonic Waves (AREA)
Abstract
Description
- The present disclosure relates to distributed sensing in optical fibers. In particular, the present disclosure relates to a system and method for Rayleigh-based distributed acoustic sensing.
- It is known use of optical fibers as sensors for a variety of physical parameters, such as pressure or temperature. Furthermore, use of optical fibers enables the so-called "distributed fiber optic sensing" (DFOS), in which the physical parameter to be sensed can be continuously sensed along the fiber length.
- A known scheme typically used for DFOS is the so-called "single-ended" scheme, schematically depicted in
Figure 1 . According to the known single-ended scheme, one end of anoptical fiber 1 having a transmission property susceptible to the physical parameter to be sensed is connected to aninterrogator device 2. Theinterrogator device 2 sends a probe light signal into theoptical fiber 1 and detects the corresponding response light signal transmitted back by theoptical fiber 1 in response thereto. Theinterrogator device 2 then processes the response light signal, thereby extracting information indicative of the physical parameter to be sensed. - One specific application of DFOS is distributed acoustic sensing (DAS). DAS enables detection and localization of "acoustic events" happening in a specific position and time along a structure to be monitored. In the present description and in the claims, the expression "acoustic event" will designate a pressure change causing a localized strain (in particular, an axial strain) of the sensing optical fiber deployed along the structure to be monitored. The acoustic event may be a vibration, namely a periodic pressure change causing a localized strain of the sensing optical fiber which periodically varies over time.
- Typically, DAS is based on an analysis of the response light signal which is generated by the optical fiber when the probe light signal propagating therethrough undergoes a linear, elastic backscattering, in particular Rayleigh backscattering.
- Rayleigh-based DAS (RDAS) may be implemented based on several known techniques, usually known as "reflectometric techniques". Known reflectometric techniques can be divided into two main categories, according to the nature of the probe light signal exploited.
- A first category of reflectometric techniques employs pulse-shaped probe light signals. More specifically, in pulse-based reflectometric techniques (such as OTDR, namely Optical Time Domain Reflectometer), a sequence of light pulses is injected in the optical fiber, and one measurement of the response light signal is performed per each injected light pulse.
- A second category of reflectometric techniques instead makes use of non-pulse-shaped probe light signals. In non-pulse-based reflectometric techniques (such as OFDR, namely Optical Frequency Domain Reflectometer), the probe light signal typically is a continuous wave whose instantaneous frequency is periodically linearly swept in time, the linearity of the sweep being a requirement for the technique to be effective. For each period of the frequency linear sweep, one measurement of the response light signal is typically performed.
- The Applicant has noticed that the above known reflectometric techniques for RDAS exhibit some drawbacks.
- In both the above known reflectometric techniques, indeed, the response light signal of the optical fiber is measured at discrete time instants equally spaced by a measurement period δtr . According to the Nyquist-Shannon sampling theorem, the measurement period δtr between consecutive measurements sets an upper limit on the maximum detectable acoustic frequency as fa ≤ fr /2 = 1/(2δtr ), where fr = 1/δtr is the measurement rate (in Hz). In the following description, the maximum detectable acoustic frequency will be also termed "acoustic bandwidth".
- As far as pulse-based reflectometric techniques are concerned, for the reflectometric technique to be effective, consecutive light pulses shall be time spaced by at least one round-trip propagation time through a target sensing range Lmax, which is defined as the maximum length of the optical fiber that can be interrogated. This sets a lower limit on the measurement period δtr namely δtr ≥ 2L max /c, where c is the propagation speed of light within the optical fiber. Therefore, the maximum detectable acoustic frequency scales with the target sensing range Lmax according to the following equation: fa ≤ c/(4Lmax ). The longer the target sensing range Lmax, the lower the maximum detectable acoustic frequency. For example, for Lmax = 10 km the maximum detectable acoustic frequency is fa ≤ 5 kHz, while for Lmax = 100 km the maximum detectable acoustic frequency fa ≤ 500 Hz (assuming c ≃ 2 · 108 m/s). Another way to look at this limitation entails considering that, as the probe light pulse propagates through the optical fiber, it illuminates only a specific fiber span at a time. Therefore, if an acoustic event happens at a position z in the optical fiber that is not traversed by the probe light pulse during the time extent of the acoustic event, such an acoustic event cannot be detected, leading to the presence of an intrinsic deadtime during which the optical fiber is not monitored.
- As to non-pulse-based reflectometric techniques, in this case the limit on the maximum detectable acoustic frequency fa is determined by two factors. The first one is the maximum temporal rate at which the linear sweep of the instantaneous frequency of the probe light signal can be performed. The second one is the ratio between the period of the vibration to be sensed and the period of the frequency linear sweep. More precisely, the period of the frequency linear sweep shall be shorter than the period of the vibration. On the other hand, for a given target sensing range Lmax, reducing the period of the frequency linear sweep requires increasing the electrical bandwidth at detection. Owing to these requirements, implementing long-range RDAS with large acoustic bandwidth is rather challenging.
- Furthermore, the way in which the linear sweep of the instantaneous frequency of the probe light signal is obtained determines the presence of intrinsic deadtime also in non-pulse-based reflectometric techniques. For example, if a tunable laser source is used to generate the probe light signal, the deadtime corresponds to the "recoiling" phase, during which the tunable laser is brought back to the initial frequency after a linear sweep is completed.
- The Applicant has then faced the problem of providing a system and method for Rayleigh-based distributed acoustic sensing which overcome the aforesaid drawbacks.
- In particular, the Applicant has tackled the problem of providing a system and method for Rayleigh-based distributed acoustic sensing which exhibit substantially no deadtime and a measurement period whose lower limit is substantially independent of the target sensing range Lmax.
- Without being bound to any theory, the Applicant has noticed that, since Rayleigh backscattering is a linear process, according to the theory of linear systems its input/output relation can be completely described in terms of a transfer function in the spectral domain, or a response function in the time domain. The time-domain response function of the optical fiber will be termed herein after also "Rayleigh response". Rayleigh-based distributed acoustic sensing may then rely on the analysis of the Rayleigh response of the optical fiber. Since the values of the Rayleigh response are complex, the analysis shall take into account both amplitude and phase of its values. Hence, if a(t) is the probe light signal and b(t) is the response light signal, the relation between the signals a(t) and b(t) in the spectral domain can be written, as:
 [a(t)] is the spectrum of the probe light signal, b(ω) =
 [b(t)] is the spectrum of the response light signal and H(ω) is the frequency-domain Rayleigh response of the optical fiber, where
 indicates the Fourier transform. From H(ω), the Rayleigh response of the optical fiber can be obtained through an inverse Fourier transform as:
 indicates the inverse Fourier transform. The Rayleigh response may then be converted into a spatial-domain Rayleigh response, through the propagation speed of light in the optical fiber. By proper analysis of the variation of the spatial-domain Rayleigh response over time, information indicative of the acoustic event to be sensed may be obtained.
- Starting from the above, the Applicant has realized that equation [2], expressed in the continuous-time domain, still holds if H(ω) is replaced with its frequency-sampled version H(ω k ), ω k = ω0 + 2πkfm , k ∈ K ⊂and if the inverse Fourier transform is replaced with an inverse discrete Fourier transform. In this case, a discrete-time signal h[n · dt] is obtained, corresponding to the sampled periodic repetition of the continuous-time function h(t), n being the sample index.

- According to the theory of the discrete Fourier transform, the repetition period T will be equal to the reciprocal of the spacing fm between the frequency-domain samples of H(ω k ), and the time-domain sampling interval dt will be equal to T/N, N corresponding to the number of samples composing H(ω k ).
- In view of the above, the Applicant has realized that, by providing the probe light signal a(t) in the form of a probe light signal with carrier frequency ω0, periodically modulated with a modulation period Tm = 1/fm (the modulation may be applied to one or more of the probe light signal's quantities, namely amplitude, frequency, and phase), the spectrum of the probe light signal a(ω) has discrete support A = { ω k = ω0 + 2πkfm, k ∈


- According to the theory of linear systems, when injecting such a probe light signal into an optical fiber, also the spectrum of the corresponding response light signal b(ω) has discrete support A, in whose points it assumes the values

- Hence, by subjecting both the light signals a(t) and b(t) to optical coherent detection, a probe electrical signal A(t) and a response electrical signal B(t) are obtained, whose spectra have again discrete support A', which is substantially rigidly shifted towards baseband relatively to A and whose corresponding values are still ak and bk (short of a fixed scale factor). The electrical signals A(t) and B(t) may then be sampled with a sampling frequency fs such that fs = M fm, where M is a non-zero positive integer such that fs ≥ 2 maxA', max A' being the maximum value in A', thereby obtaining a probe sampled signal a[n · dt] and a response sampled signal b[n · dt], where dt = 1/fs and n is the sample index.
- A point-wise ratio according to the right-hand side of equation [2] between the discrete Fourier transforms of the sampled signals a[n · dt] and b[n · dt] shall provide the frequency response coefficients H(ω k ), as long as the points of A' are contained in the set of discrete frequencies over which the spectra of a[n · dt] and b[n · dt] are sampled by the discrete Fourier transform.
- In this respect, the Applicant has noticed that such condition is fulfilled when T = Q · 1/fm , where Q is a non-zero positive integer. In other words, this requires computing the discrete Fourier transform of the sampled signals a[n · dt] and b[n · dt] over arrays of N = G fs /fm = G · M samples, where G is a non-zero positive integer. The arrays identified in the probe sampled signal a[n · dt] and in the response sampled signal b[n · dt] respectively are a = [au , ... , a u + N-1] and b = [bv , ... , b v + N-1], where u corresponds to the starting index from which samples of a[n · dt] are taken and v is the starting index from which samples of b[n · dt] are taken. The two arrays may be time misaligned, meaning that the starting indexes u and v may have different values. Their discrete Fourier transform provides two arrays â = [â 0, ... , â N-1] and b̂ = [b̂ 0, ..., b̂ N-1], respectively. The arrays â = [â 0, ..., â N-1] and b̂ = [b̂ 0, ..., b̂ N-1] may then be restricted to those samples corresponding to values contained in A' and subjected to a point-wise ratio according to the right-hand side of equation [2] above.
- After the point-wise ratio has been performed, an inverse Fourier transform is applied to the result, thereby obtaining a discrete Rayleigh response h[m · dt] of the optical fiber. The discrete Rayleigh response h[m · dt] may then be converted into a discrete spatial-domain Rayleigh response h[m · dz], whose spatial sampling step dz is provided by the following equation:

factor 2 accounts for the round-trip propagation of the probe light signal through the optical fiber. - The above discussion is still valid if arrays â and b̂ are restricted to samples pertaining to a subset A" of the discrete support A'.
- The measurement of the Rayleigh response may be iterated at discrete time instants, thereby providing a sequence of measurements of the spatial-domain Rayleigh response h[m ■ dz] equally spaced in time by the iteration period, which basically represents the measurement period δtr . Specifically, a new iteration may be performed by incrementing the values of the starting indexes u and v of the same positive integer amount q ≥ 1, as long as samples of the electrical signals A(t) and B(t) are available. The measurement period δtr is then related to the sampling period dt according to the following equation δtr = δt · q . The lower limit of the measurement period δtr is then δtr = δt , which is obtained when q = 1, namely when the measurement of the Rayleigh response is repeated each time a new sample of both the probe electrical signal A(t) and the response electrical signal B(t) is available.
- Advantageously, therefore, the lower limit of the measurement period δtr is substantially independent of the target sensing range Lmax.
- The target sensing range Lmax indeed affects the modulation frequency fm of the probe light signal, which shall be set such that Lmax = c/2fm. However, as said above, the minimum measurement period δtr of the Rayleigh response is equal to the sampling period dt, which not only is a function of the modulation frequency fm (and hence of Lmax ), but is also inversely proportional to the integer number M. Hence, in principle, by setting a suitably high value of M, the lower limit of the measurement period δtr may be arbitrarily reduced. From the practical point of view, this means that the lower limit of the measurement period δtr is substantially due to the processing capabilities of the data processing unit implementing the sampling and the processing of the electrical signals provided by the optical coherent detection of the probe light signal and response light signal.
- The result of the procedure above, i.e. the sequence of measurements of the spatial-domain Rayleigh response h[m · dz] equally spaced in time by the iteration period, is then processed to obtain information indicative of the acoustic event. For this purpose, known algorithms can be applied, e.g. spectral correlation analysis or direct phase demodulation as explained for example in Z. He and Q. Liu, "Optical Fiber Distributed Acoustic Sensors: A Review," in Journal of Lightwave Technology, vol. 39, no. 12, pp. 3671-3686, 15 June, 2021, doi: 10. 11 09/J LT. 2021.305977 1.
- Therefore, according to a first aspect, the present disclosure provides a system for Rayleigh-based distributed acoustic sensing of an acoustic event, the system comprising:
- an optical fiber;
- a laser source configured to inject a probe light signal a(t) in the optical fiber, the probe light signal a(t) being periodically modulated with a modulation frequency fm ;
- a first optical detector configured to perform a coherent detection of the probe light signal a(t) as injected in the optical fiber, thereby providing a probe electrical signal A(t), and a second optical detector configured to perform a coherent detection of a response light signal b(t) emitted by the optical fiber in response to the probe light signal a(t) undergoing Rayleigh backscattering through the optical fiber, thereby providing a response electrical signal B(t); and
- a data processing unit configured to sample the probe electrical signal A(t) and the response electrical signal B(t) with a sampling frequency fs such that fs = M fm where M is a non-zero positive integer, thereby providing a probe sampled signal a[n · dt] and a response sampled signal b[n · dt]; identify in the probe sampled signal a[n · dt] and the response sampled signal b[n · dt] a first array of N consecutive probe samples and a second array of N consecutive response samples, respectively, with N = G · M, G being a non-zero positive integer; provide a Rayleigh response of the optical fiber based on the first array of N consecutive probe samples and the second array of consecutive N response samples; and obtain information indicative of the acoustic event by processing the Rayleigh response of the optical fiber.
- According to some embodiments, the periodically modulated probe light signal a(t) is a non-pulsed shaped light signal, where "non-pulsed shaped light signal" means that the amplitude of the light signal may vanish only in a discrete set of time instants.
- According to an embodiment:
- the laser source is further configured to provide the first optical detector and the second optical detector with an unmodulated light signal c(t), the unmodulated light signal c(t) having a carrier frequency shifted relative to a carrier frequency of the probe light signal a(t); and
- the first optical detector and second optical detector are configured to perform a heterodyne coherent detection of the probe light signal a(t) and the response light signal b(t), respectively, using the unmodulated light signal c(t).
- According to an embodiment, the system further comprises two polarization controllers configured to bring the unmodulated light signal c(t) on respective mutually orthogonal polarizations states, and the second optical detector comprises two optical detectors, each one operating on a respective polarization state.
- According to an embodiment, the system further comprises an optical amplifier configured to increase the optical power of the probe light signal a(t) before it is injected in the optical fiber.
- In addition or alternatively, the system further comprises a further optical amplifier configured to increases the optical power of the response light signal b(t) before it is received by the second optical detector.
- According to a second aspect, the present disclosure provides a method for Rayleigh-based distributed acoustic sensing of an acoustic event, the method comprising:
- (a) injecting a probe light signal a(t) in an optical fiber, the probe light signal a(t) being periodically modulated with a modulation frequency fm ;
- (b) performing a coherent detection of the probe light signal a(t) as injected in the optical fiber, thereby providing a probe electrical signal A(t);
- (c) performing a coherent detection of a response light signal b(t) emitted by the optical fiber in response to the probe light signal a(t) undergoing Rayleigh backscattering through the optical fiber, thereby providing a response electrical signal B(t);
- (d) sampling the probe electrical signal A(t) and the response electrical signal B(t) with a sampling frequency fs such that fs = M fm where M is a non-zero positive integer, thereby providing a probe sampled signal a[n · dt] and a response sampled signal b[n · dt];
- (e) identifying in the probe sampled signal a[n · dt] and the response sampled signal b[n · dt] a first array of N consecutive probe samples and a second array of N consecutive response samples, respectively, with N = G · M, G being a non-zero positive integer;
- (f) providing a Rayleigh response of the optical fiber based on the first array of N consecutive probe samples and the second array of consecutive N response samples; and
- (g) obtaining information indicative of the acoustic event by processing the Rayleigh response of the optical fiber.
- According to an embodiment, step (d) comprises sampling the probe electrical signal A(t) and the response electrical signal B(t) synchronously.
- According to an embodiment, step (e) comprises identifying the first array of N consecutive probe samples and the second array of N consecutive response samples in a time-misaligned way.
- According to an embodiment, step (f) comprises:
- applying a discrete-time Fourier transform to the first array of N consecutive probe samples and to the second array of N consecutive response samples, thereby obtaining arrays â = [â 0, ..., â N-1] and b̂ = [b̂ 0, ..., b̂ N-1], respectively;
- subjecting the arrays â = [â 0, ..., â N-1] and b̂ = [b̂ 0, ..., b̂ N-1] to a point-wise ratio, thereby obtaining a further array ĉ ; and
- applying an inverse discrete-time Fourier transform to the further array ĉ .
- According to an embodiment, subjecting the arrays â = [â 0, ..., â N-1] and b̂ = [b̂ 0, ... , b̂ N-1] to the point-wise ratio comprises:
- constructing two restricted arrays â ' and b̂ ' by restricting each one of the arrays â = [â 0, ..., â N-1] and b̂ = [b̂ 0, ..., b̂ N-1] to frequency values contained in their discrete frequency-domain support; and
- obtaining the further array c as c = b̂ ' ⊘ â ' where ⊘ stands for Hadamard division.
- According to an embodiment, step (g) comprises determining a spatial-domain Rayleigh response h[m ·dz] of the optical fiber and obtaining the information indicative of the acoustic event based on the spatial-domain Rayleigh response h[m · dz].
- According to an embodiment, steps (d) to (g) are periodically iterated at discrete time instants, thereby providing a sequence of spatial-domain Rayleigh responses h[m · dz] equally spaced in time.
- According to an embodiment, the method further comprises applying a spectral correlation analysis to at least two spatial-domain Rayleigh responses h[m · dz] measured at different times t 1 and t 2.
- For the purpose of the present description and of the appended claims, except where otherwise indicated, all numbers expressing amounts, quantities, percentages, and so forth, are to be understood as being modified in all instances by the term "about". Also, all ranges include any combination of the maximum and minimum points disclosed and include any intermediate ranges therein, which may or may not be specifically enumerated herein.
- For the purpose of the present description and of the appended claims, the words "a" or "an" should be read to include one or at least one and the singular also includes the plural unless it is obvious that it is meant otherwise. This is done merely for convenience and to give a general sense of the disclosure.
- The present disclosure, in at least one of the aforementioned aspects, can be implemented according to one or more of the present embodiments, optionally combined together.
- The present disclosure will provide further particulars in the following detailed description, given by way of example and not of limitation, with reference to the following drawings, wherein:
-
Figure 1 (already described above) shows a known single-ended scheme typically used for DFOS; -
Figure 2 schematically shows a system for Rayleigh-based distributed acoustic sensing according to embodiments of the present invention; -
Figure 3 is a flow chart of the operation of the data processing unit included in the system ofFigure 2 , according to embodiments of the present invention; -
Figures 4A-4D show the interrogator device according to four possible variants of the present invention; -
Figure 5 shows in further detail the structure of the laser source according to an embodiment of the present invention; -
Figure 6 is a graph showing experimental results of a single measurement of the Rayleigh response provided by a system according to embodiments of the present invention; -
Figure 7 is a more detailed flow chart of the step of providing information indicative of the acoustic event to be sensed based on the Rayleigh response; -
Figure 8 is a graph showing experimentally obtained information indicative of an impulsive acoustic event; and -
Figure 9 is a graph showing experimentally obtained information indicative of a periodic acoustic event (vibration). -
Figure 2 shows asystem 1000 for Rayleigh-based distributed acoustic sensing according to embodiments of the present invention. - The
system 1000 comprises anoptical fiber 100 and aninterrogator device 200 connected to one end of theoptical fiber 100 according to a single-ended scheme. - The
optical fiber 100 is deployed along a structure to be monitored (not depicted inFigure 2 ) and has transmission properties susceptible to variations of the strain induced by possible acoustic events (either impulsive events or vibrations) affecting the structure to be monitored. The Applicant has made positive tests using a single mode ITU-T G.652 optical fiber. The length of theoptical fiber 100 may be up to 50-100 km, as an example. - The
interrogator device 200 comprises alaser source 3 configured to generate a probe light signal a(t) and inject it into theoptical fiber 100. The probe light signal a(t) is a light signal with carrier frequency ω0, periodically modulated with a modulation frequency fm . The probe light signal a(t) thus has a discrete frequency-domain support A = { ω k =
optical fiber 100 is single mode. For example, thelaser source 3 has a coherence length equal to at least 2 · Lmax. - The
interrogator device 200 also comprises twooptical detectors 4aoptical detector optical detector 4a is configured to perform a coherent detection of the probe light signal a(t) as injected in theoptical fiber 100, while theoptical detector 4b is configured to perform a coherent detection of the response light signal b(t) emitted by theoptical fiber 100 in response to the probe light signal a(t) undergoing Rayleigh backscattering through theoptical fiber 100. Coherent detections of the probe light signal a(t) and response light signal b(t) result in a probe electrical signal A(t) and a response electrical signal B(t), respectively; both the electrical signals A(t) and B(t) have a discrete frequency-domain support A' = { ω' k = 2πfint +
- In order to enable detection of both the probe light signal a(t) and the response light signal b(t), according to an embodiment the
interrogator device 200 comprises anoptical splitter 5 and anoptical circulator 6. - The
optical splitter 5 has an input connected to the output of thelaser source 3 and two outputs connected to theoptical detector 4a and to one of the ports of theoptical circulator 6, respectively. Two further ports of theoptical circulator 6 are connected to theoptical fiber 100 and to theoptical detector 4b, respectively. This way, the probe light signal a(t) is split into two portions: one portion is sent to theoptical detector 4a, while the other portion is sent to theoptical fibre 100 via theoptical circulator 6. Besides, the response light signal b(t) provided by theoptical fiber 100 is sent via thecirculator 6 to theoptical detector 4b. Theoptical splitter 5 may have a splitting ratio comprised between 85:15 and 95:5, for example 90:10, the major part of the probe light signal a(t) being directed towards theoptical fiber 100 via theoptical circulator 6. The Applicant has made positive test using a 1x2 optical splitter 90:10 TN1550R2A1 by Thorlabs (Newton, New Jersey, USA) and a 3 port, single mode optical circulator 6015-3-APC by Thorlabs (Newton, New Jersey, USA). - The
interrogator device 200 also comprises adata processing unit 7 cooperating with theoptical detectors data processing unit 7 is configured to process the probe electrical signal A(t) and the response electrical signal B(t) to provide information indicative of the acoustic event to be sensed. - The operation of the
data processing unit 7 will be now described in detail with reference to the flow chart ofFigure 3 . - According to an embodiment, the
data processing unit 7 samples the probe electrical signal A(t) and the response electrical signal B(t) (step 301). For both the electrical signals A(t) and B(t), the sampling is performed with a sampling frequency fs such that fs = M fm where M is a non-zero positive integer such that fs = M fm ≥ 2 maxA', thereby obtaining a probe sampled signal a[n · dt] and a response sampled signal b[n · dt], where dt = 1/fs is the sampling period and n is the sample index. The probe electrical signal A(t) and the response electrical signal B(t) may be synchronously sampled. - Then, according to an embodiment the
data processing unit 7 identifies in the probe sampled signal a[n · dt] and in the response sampled signal b[n · dt] a first array a = [au , ... , a u + N-1] of N consecutive probe samples and a second array b = [bv, ... , b v + N-1] of N consecutive response samples, respectively, where u corresponds to the starting index from which samples of a[n · dt] are taken and v is the starting index from which samples of b[n · dt] are taken. The number N is equal to N = G · M, G being a non-zero positive integer. The two arrays of N consecutive samples may be time misaligned, meaning that the starting indexes u and v may have different values. - The
data processing unit 7 then provides a measurement of the Rayleigh response of theoptical fiber 100 based on the two arrays a = [au, ... , a u + N-1] and b = [bv, ... , b v + N-1] (step 303). - According to an embodiment, at
step 303 the measurement of the Rayleigh response is obtained by applying to the two arrays a = [au, ..., a u + N-1] and b = [bv, ..., b v + N-1] a discrete-time Fourier transform (e.g. an FTT, Fast Fourier Transform), thereby obtaining the arrays â = [â 0, ..., â N-1] and b̂ = [b̂ 0, ..., b̂ N-1]. The arrays â = [â 0, ..., â N-1] and b̂ = [b̂ 0, ..., b̂ N-1] are then subjected to a point-wise ratio according to the right-hand side of equation [2] above. For this purpose, according to an embodiment, two further arrays â ' and b̂ ' are constructed, respectively from â = [â 0, ..., â N-1] and b̂ = [b̂ 0, ..., b̂ N-1]. Firstly, a contiguous subset K' ⊆ K may be chosen; the first part of â ' is constructed taking (maxK' + 1) samples from â , one each G samples, starting from â 0 towards â N-1(e.g. [â 0, âG, â 2G , ... ]). The second part of â ' is constructed taking |min K'| samples, one each G samples, starting â N-G|min K'| towards â N-1. The same procedure is applied to b̂ = [b̂ 0, ..., b̂ N-1] to obtain the further array b̂ '. This way, the arrays â ' and b̂ ' basically are restricted to points corresponding to frequency values contained in their discrete frequency-domain support. - Then, an array ĉ is calculated as ĉ = b̂ ' ⊘ â ' where ⊘ stands for Hadamard division. The array ĉ is then subjected to an inverse discrete-time Fourier transform (e.g. an IFFT, Inverse Fast Fourier Transform), thereby obtaining a time-domain Rayleigh response h[m · dt] of |K'| samples, corresponding to the spatial-domain Rayleigh response h[m · dz] of the
optical fiber 100. The spatial sampling step dz is equal to dz = Lmax /(|K'| - 1). - The
data processing unit 7 then processes the spatial-domain Rayleigh response h[m · dz] to provide information indicative of the acoustic event to be sensed (step 304). Further details on this step will be provided herein below. - While the
data processing unit 7 continuously receives the electrical signals A(t) and B(t) from theoptical detectors - Advantageously, therefore, the lower limit of the measurement period δtr is substantially independent of the target sensing range Lmax.
- The target sensing range Lmax indeed affects the modulation frequency fm of the probe light signal, which shall be set such that Lmax = c/2fm. However, as said above, the minimum measurement period δtr of the Rayleigh response is equal to the sampling period dt, which not only is a function of the modulation frequency fm (and hence of Lmax ), but is also inversely proportional to the integer number M. Hence, in principle, by setting a suitably high value of M, the lower limit of the measurement period δtr may be arbitrarily reduced. From the practical point of view, this means that the lower limit of the measurement period δtr is substantially due to the processing capabilities of the data processing unit implementing the sampling and the processing of the electrical signals provided by the optical coherent detection of the probe light signal and response light signal.
- Herein below, some variants of the
interrogator device 200 will be described. -
Figure 4A shows aninterrogator device 201 according to a first variant. - According to the first variant, in addition to the probe light signal a(t), the
laser source 3 of theinterrogator device 201 is also configured to provide an unmodulated light signal c(t). The coherence length of the unmodulated light signal c(t) may be equal to at least 2 · Lmax. The carrier frequency of the unmodulated light signal c(t) may be selected within a frequency range in which theoptical fiber 100 is single mode. The carrier frequency of the unmodulated light signal c(t) may be shifted by a frequency shift fint relative to the carrier frequency of the probe light signal a(t). The frequency shift fint for example is in the RF range and such that fint ≥ |min K| fm. The frequency shift can be, for example, in the range 100-500 MHz. According to an embodiment, the probe light signal a(t) and the unmodulated light signal c(t) are emitted through separate outputs of thelaser source 3. - According to the first variant, the
interrogator device 201 also comprises a furtheroptical splitter 8. The furtheroptical splitter 8 has an input connected to the output oflaser source 2 through which the unmodulated light signal c(t) is emitted, and two outputs connected to theoptical detectors optical splitter 8 may be a 50:50 optical splitter. The Applicant has made positive tests using an optical splitter TN1550R5A1 by Thorlabs (Newton, New Jersey, USA). - According to the first variant, the
optical detectors optical detectors optical detector optical detector 
data processing unit 7 as described above, so as to provide the probe sampled signal a[n · dt] and the response sampled signal b[n · dt]. Thedata processing unit 7 then may subject the sampled signals a[n · dt], b[n · dt] to a digital quadrature demodulation, to provide a baseband representation of such signals, i.e. having discrete frequency-domain support A" = { ω"k = 2πkfm , k ∈ K ⊂}. The sampled signals a[n · dt], b[n · dt] are then subjected to the processing according to steps 302-304 described above.
-
Figure 4B shows aninterrogator device 202 according to a second variant. - In addition to the components of the
interrogator device 201 according to the first variant, theinterrogator device 202 according to the second variant also comprises anoptical amplifier 9 interposed between theoptical splitter 5 and theoptical circulator 6. Theoptical amplifier 9 increases the optical power of the probe light signal a(t). Theoptical amplifier 9 may be an Erbium-doped fiber amplifier (EDFA). Optionally, theoptical amplifier 9 may be followed by anoptical filter 10, in particular a bandpass optical filter. Theoptical amplifier 9 advantageously increases the optical power of the probe light signal a(t) and then allows increasing the target sensing range Lmax .of theoptical fiber 100. -
Figure 4C shows aninterrogator device 203 according to a third variant. - Differently from the
interrogator device 202 according to the first variant, in theinterrogator device 203 according to the third variant theoptical amplifier 9 and the optionaloptical filter 10 are interposed between thecirculator 6 and theoptical detector 4b. In this case, theoptical amplifier 9 advantageously increases the optical power of the response light signal b(t) before it is received by theoptical detector 4b, and then allows increasing the target sensing range Lmax .of theoptical fiber 100. -
Figure 4D shows aninterrogator device 204 according to a fourth variant. - The fourth variant implements a coherent polarization-diversity scheme. Hence, in addition to the components of the
interrogator device 201 according to the first variant, theinterrogator device 204 according to the fourth variant comprises twopolarization controllers optical splitter 8.Such polarization controllers optical detector 4b, two optical detectors 4b1 and 4b2 are provided, each one operating on a respective polarization state. Between thecirculator 6 and the optical detectors 4b1 and 4b2, apolarization beam splitter 13 is provided, which separates the two polarization states of the response light signal b(t) and provides each one of them to a respective optical detectors 4b1 and 4b2 for separate heterodyne detection, which results into two separate response electrical signals B1(t) and B2(t). Each response electrical signal B1(t) and B2(t) is then separately subjected to the processing according to steps 301-304 of the flow chart ofFigure 3 . The processing results in a couple of Rayleigh responses, one per each polarization state. This may be beneficial in providing additional information on the acoustic event to be sensed. - The above variants may be reciprocally combined.
-
Figure 5 shows in further detail thelaser source 3 comprised in theinterrogator device - The
laser source 3 for example comprises aCW laser 30, anoptical splitter 31, afrequency shifter 32, anoptical wave modulator 33 and aRF signal generator 34. - The
CW laser 30 for example is configured to emit the unmodulated light signal c(t). The optical frequency of theCW laser 30 may be comprised in the optical C-band, which ranges from 1530 nm to 1565 nm. The Applicant has made positive tests using a CW laser source Koheras Adjustik X15 HP by NKT Photonics (Birkeroed, Denmark). - The
optical splitter 31 has an input connected to the output of theCW laser 30 so as to split the unmodulated light signal c(t) into two portions. The splitting ratio of theoptical splitter 31 may be comprised between 85:15 and 95:5, for example 90:10. Theoptical splitter 31 has two outputs: one output (the one emitting the major part of the unmodulated light signal c(t)) is connected to thefrequency shifter 32, while the other output (the one emitting the minor part of the unmodulated light signal c(t)) is connected to the input of theoptical splitter 8, which further splits the minor part of the unmodulated light signal c(t) and provides each part to a respectiveoptical detector - The
frequency shifter 32 is configured to shift the optical frequency of the major part of the unmodulated light signal c(t) by the frequency shift fint. The Applicant has made positive tests using the acousto-optic modulator FIBER-Q T-M110-0.2C2J-3-F2S (FS). - The
optical wave modulator 33 is configured to modulate the output of thefrequency shifter 32 with a modulation frequency fm , so as to provide the probe light signal a(t). As discussed above, the modulation may be applied to one or more of the light signal's quantities, namely amplitude, frequency, and phase. The Applicant has made positive tests using the optical phase modulator LN81S-FC (MOD) by Thorlabs (Newton, New Jersey, USA). - The Applicant has made some tests using, as
optical fiber 100, an optical fiber link of length L ≃ 6.1 km, composed of two connected spools of single mode ITU-T G.652 optical fiber, whose lengths were respectively equal to 4.8 km and 1.3 km. - The graph in
Figure 6 shows the results of a single measurement of the spatial-domain Rayleigh response h[m · dz] obtained by a single iteration of steps 302-304 described above. The following parameters were applied: - fm = 10 kHz, corresponding to Lmax ≃ 10.225 km with a group index ng = 1.466;
- fs = 500 MHz, corresponding to M = 50000;
- G = 2;
- X 1 = X 2 = 3M = 100000;
- u = v = M; and
- |K'| = 5393, corresponding to dz ≃ 1.9 m.
- In the graph in
Figure 6 , the abscissa axis represents the position z along theoptical fiber 100, while the ordinate axis represents the normalized magnitude in dB of the spatial-domain Rayleigh response h[m ·dz]. In order to reduce the detrimental visual effect of coherent Rayleigh fading, a 20-m-long moving average filter (11 samples) has been applied to the magnitude. - As discussed above, the measurement of the spatial-domain Rayleigh response h[m ·dz] may be repeated at discrete time instants, thereby providing a sequence of measurements of the spatial-domain Rayleigh response h[m · dz] equally spaced in time by the measurement period δtr .
- As mentioned above, the
data processing unit 7 processes the spatial-domain Rayleigh response h[m · dz] to provide information indicative of the acoustic event to be sensed (step 304 in the flow chart ofFigure 3 ). - According to an embodiment, the
data processing unit 7 processes the spatial-domain Rayleigh response h[m · dz] by applying a spectral correlation analysis (SCA), which allows identifying a variation of the strain applied to a section Z of theoptical fiber 100 between two different times t 1 and t 2. More specifically, the spatial-domain Rayleigh response h[m · dz] is measured at times t 1 and t 2. Then, the two measurements of the spatial-domain Rayleigh responses h[m · dz] are windowed to select only the spatial points pertaining to the section Z, thereby obtaining two arrays h1 and h2. The spectra of the arrays h1 and h2 are then computed and cross-correlated, as explained in S. T. Kreger et al.: "High Resolution Distributed Strain or Temperature Measurements in Single-and Multimode Fiber Using Swept-Wavelength Interferometry", Optical Fiber Sensors (p. ThE42), Cancun, Mexico. - According to the spectral shift property of the Rayleigh response, whenever a variation Δε ≠ 0 of the applied strain occurs between times t 1 and t 2, the spectral cross-correlation exhibits a peak at a frequency lag Δf ∝ Δε ≠ 0. On the other hand, if no variation of the strain occurs between times t 1 and t 2, the spectral cross-correlation exhibits a peak at Δf = 0. Hence, performing this analysis e.g. over a spatial partition of the whole
optical fiber 100 allows to monitor the change of strain in a distributed fashion along the whole length of theoptical fiber 100. Furthermore, by continuously extracting the Rayleigh response of theoptical fiber 100, such an analysis can be iterated in time, e.g. keeping the time instant t 1 fixed as a reference time and moving the time instant t 2 forward. - More specifically, with reference to the flow chart of
Figure 7 , according to embodiments of the present invention, thedata processing unit 7 performs the following processing. - First of all, the
data processing unit 7 performs R measurements of the spatial-domain Rayleigh response, by repeating steps 302-304 above R times (step 801). The dataset obtained by thedata processing unit 7 atstep 801 may be represented as a R×|K'| matrix H = [hr,m ], where the first index identifies the measurement time as tr = r q dt and the second index identifies a spatial sample within the spatial-domain Rayleigh response, so that m E [0, ... , |K'| - 1]. - Then, the
data processing unit 7 selects Nw spatial windows of sample length Lw along the second index of H, producing the 3-dimensional data matrix HH = [hr,p,w ], where p ∈ [0, ... , Nw - 1] and w ∈ [0, ... , Lw -1]. In this case, the second index indicates a specific spatial window and is represented by p. Hence, the new third index w identifies a spatial sample within the pth window. - Then, the
data processing unit 7 applies a discrete-time Fourier transform to F points (F ≥ Lw ) along the third axis of the matrix HH = [hr,p,w ], thus providing the matrix
- Then, the
data processing unit 7 choses a reference spatial-domain Rayleigh response with index r* and, for each value of the index r other than r and for every value of p, calculates a cross-correlation according to the following equation:


- Then, the
data processing unit 7 extracts information indicative of the acoustic event to be sensed from
- Then, the
data processing unit 7 reverts to step 801, thereby acquiring a new R'x|K'| dataset H = [hr',m ], r' ∈ [R, ..., R + R' - 1] to which the processing according to steps 802-805 is applied. The iterations of steps 801-805 thus enable a continuous monitoring of theoptical fiber 100, until the end of the measurement session (step 806). - The Applicant has performed some tests of the above procedure for processing the spatial-domain Rayleigh response h[m · dz] to provide information indicative of acoustic events of different types.
- A first type of acoustic event considered were impulsive events. Specifically, the system capability to sense two 25-ps-long pulses, spaced by 1.25 ms was tested.
- The tested
optical fiber 100 was composed by two spools of standard ITU-T G.652 optical fiber, of lengths respectively equal to 4.8 km and 1.3 km, connected through a fiber stretcher. - The following parameters were applied for each single measurement of the spatial-domain Rayleigh response according to the flow chart of
Figure 3 : - fm = 10 kHz, corresponding to Lmax ≃ 10.225 km with a group index ng = 1.466;
- fs = 500 MHz, corresponding to M = 50000;
- G = 1;
- X 1 = X 2 = 35M = 1.75 106;
- u = v = M;
- |K'| = 5393, corresponding to dz ≃ 1.9 m; and
- q = 2500, corresponding to fr = 200 kHz.
- As to the spectral correlation analysis of the measurements of the spatial-domain Rayleigh response, the following parameters were applied:
- Lw = 128;
- NW = 746 windows with a relative shift of 4 samples each;
- F = 128; and
- r* = 140.
-
Figure 8 is a graph which shows the magnitude of the two-dimensional matrix

optical fiber 100 have been selected; normalization has been performed with respect to the plane's maximum magnitude. - The time localization of the two acoustic events can be performed by inspecting the row-wise minimum of the plane's magnitude. Such a curve is reported in subplot b of
Figure 8 ; two time indices r 0 and r 1 (corresponding to times t 0 = r 0/fr and t 1 = r 1/fr ) are identified as the two local minima, highlighted by the two markers and corresponding to t 0 = 0.94 ms and t 1 = 2.19 ms. - The spatial identification of the two acoustic events can be instead performed inspecting the two one-dimensional arrays



- It has to be noted that the two acoustic events occurring at the same spatial position along the
optical fiber 100 can be detected even if their time distance is not an integer multiple of the measurement period of an equivalent pulse-based RDAS system such as OTDR. - A second type of acoustic event considered were periodic acoustic events, namely vibrations. Specifically, the system capability to sense a vibration having an acoustic frequency of fp = 5100 Hz was tested.
- The
optical fiber 100 was composed by two spools of standard ITU-T G.652 optical fiber, of lengths respectively equal to 4.8 km and 1.3 km, connected through a fiber stretcher. - The following parameters were applied for each single measurement of the spatial-domain Rayleigh response according to the flow chart of
Figure 3 : - fm = 10 kHz, corresponding to Lmax ≃ 10.225 km with a group index ng = 1.466;
- fs = 500 MHz, corresponding to M = 50000;
- G = 1;
- X 1 = X 2 = 35M = 1.75 106;
- u = v = M;
- |K'| = 5393, corresponding to dz ≃ 1.9 m; and
- q = 2500, corresponding to fr = 200 kHz.
- As to the spectral correlation analysis of the measurements of the spatial-domain Rayleigh response, the following parameters were applied:
- Lw = 45;
- NW = 746 windows with a relative shift of 4 samples each;
- F = 45; and
- r* = 140.
- In this case, a two-dimensional matrix


-
Figure 9(a) shows the phase difference between the matrixes
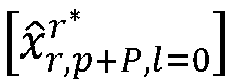
optical fiber 100 have been selected. - The spatial localization of the vibration can be performed by computing the power of the phase signal along time per each spatial window (i.e. column-wise). The curve obtained is shown in
Figure 9(b) , normalized with respect to its own maximum Errore. L'origine riferimento non 6 stata trovata.; distance is reported on the x-axis, amplitude on the y-axis. The spatial location of the vibration may be identified as the global maximum of the curve and corresponds to an index p 0 + P which in turn represents position z 0 ≃ 4826 m within theoptical fiber 100. - To determine the frequency of the vibration, the phase of the one-dimensional array
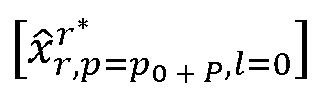
Figure 9(c) Errore. L'origine riferimento non 6 stata trovata.. In this graph, frequency is reported on the abscissa axis and normalized amplitude on the ordinate axis; normalization is performed with respect to the maximum value. This graph allows to identify the perturbation frequency as
- The
system 1000 according to the various embodiments of the present invention therefore is advantageous in that it exhibits substantially no deadtime and a measurement period whose lower limit is substantially independent of the target sensing range Lmax. It can therefore be used for a variety of applications, including for example: - detecting and localizing acoustic events induced by electric breakdowns in power cables. In this respect, the increased acoustic bandwidth of the
system 1000 relative to known interferometric techniques increases the sensitivity of the system and its effectiveness in assisting search and repair of the breakdowns; - detecting time and position of lightning striking along overhead lines;
- measuring the spectrum of acoustic events due to underwater leaks in pipelines, thereby facilitating their recognition and classification;
- measuring the acoustic waves reflected in geological monitoring, allowing higher frequency sensitivity;
- identifying fluid cavitation along pipelines;
- measuring vibration modes of overhead lines under wind perturbation, and calculating their mass thereof, this being a measure of accumulated ice; and
- measuring vibration spectrum of remote equipment and early detect mechanical degradation from spectrum variation, for example sensitive equipment like pumps in nuclear power plants.
Claims (14)
- A system (1000) for Rayleigh-based distributed acoustic sensing of an acoustic event, the system (1000) comprising:- an optical fiber (100);- a laser source (3) configured to inject a probe light signal (a(t)) in the optical fiber (100), the probe light signal (a(t)) being a light signal periodically modulated with a modulation frequency fm ;- a first optical detector (4a) configured to perform a coherent detection of the probe light signal (a(t)) as injected in the optical fiber (100), thereby providing a probe electrical signal (A(t)), and a second optical detector (4b) configured to perform a coherent detection of a response light signal (b(t)) emitted by the optical fiber (100) in response to the probe light signal (a(t)) undergoing Rayleigh backscattering through the optical fiber (100), thereby providing a response electrical signal (B(t)); and- a data processing unit (7) configured to sample the probe electrical signal (A(t)) and the response electrical signal (B(t)) with a sampling frequency fs such that fs = M fm where M is a non-zero positive integer, thereby providing a probe sampled signal a[n · dt] and a response sampled signal b[n · dt]; identify in the probe sampled signal a[n · dt] and the response sampled signal b[n · dt] a first array of N consecutive probe samples and a second array of N consecutive response samples, respectively, with N = G · M, G being a non-zero positive integer; provide a Rayleigh response of the optical fiber (100) based on the first array of N consecutive probe samples and the second array of consecutive N response samples; and obtain information indicative of the acoustic event by processing the Rayleigh response of the optical fiber (100).
- The system (1000) according to claim 1, wherein:- the laser source (3) is further configured to provide the first optical detector (4a) and the second optical detector (4b) with an unmodulated light signal (c(t)), the unmodulated light signal (c(t)) having a carrier frequency shifted relative to a carrier frequency of the probe light signal (a(t)); and- the first optical detector (4a) and second optical detector (4b) are configured to perform a heterodyne coherent detection of the probe light signal (a(t)) and the response light signal (b(t)), respectively, using the unmodulated light signal (c(t)).
- The system (1000) according to claim 2, wherein it further comprises two polarization controllers (11, 12) configured to bring the unmodulated light signal (c(t)) on respective mutually orthogonal polarizations states, and wherein the second optical detector (4b) comprises two optical detectors (4b1, 4b2), each one operating on a respective polarization state.
- The system (1000) according to any of the preceding claims, wherein it further comprises an optical amplifier (9) configured to increase the optical power of the probe light signal (a(t)) before it is injected in the optical fiber (100).
- The system (1000) according to any of the preceding claims, wherein it further comprises a further optical amplifier (9) configured to increases the optical power of the response light signal (b(t)) before it is received by the second optical detector (4b).
- The system (1000) according to any of the preceding claims, wherein the probe light signal (a(t)) being a light signal periodically modulated with non-linear modulation.
- A method for Rayleigh-based distributed acoustic sensing of an acoustic event, the method comprising:(a) injecting a probe light signal (a(t)) in an optical fiber (100), the probe light signal (a(t)) being a light signal periodically modulated with a modulation frequency fm ;(b) performing a coherent detection of the probe light signal (a(t)) as injected in the optical fiber (100), thereby providing a probe electrical signal (A(t));(c) performing a coherent detection of a response light signal (b(t)) emitted by the optical fiber (100) in response to the probe light signal (a(t)) undergoing Rayleigh backscattering through the optical fiber (100), thereby providing a response electrical signal (B(t));(d) sampling the probe electrical signal (A(t)) and the response electrical signal (B(t)) with a sampling frequency fs such that fs = M fm where M is a non-zero positive integer, thereby providing a probe sampled signal a[n · dt] and a response sampled signal b[n · dt];(e) identifying in the probe sampled signal a[n · dt] and the response sampled signal b[n · dt] a first array of N consecutive probe samples and a second array of N consecutive response samples, respectively, with N = G · M, G being a non-zero positive integer;(f) providing a Rayleigh response of the optical fiber (100) based on the first array of N consecutive probe samples and the second array of consecutive N response samples; and(g) obtaining information indicative of the acoustic event by processing the Rayleigh response of the optical fiber (100).
- The method according to claim 7, wherein step (d) comprises sampling the probe electrical signal (A(t)) and the response electrical signal (B(t)) synchronously.
- The method according to claim 7 or 8, wherein step (e) comprises identifying the first array of N consecutive probe samples and the second array of N consecutive response samples in a time-misaligned way.
- The method according to any of claims 7 to 9, wherein step (f) comprises:- applying a discrete-time Fourier transform to the first array of N consecutive probe samples and to the second array of N consecutive response samples, thereby obtaining arrays â = [â 0, ..., â N-1] and b̂ = [b̂ 0, b̂ N-1], respectively;- subjecting the arrays â = [â 0, ..., â N-1] and b̂ = [b̂ 0, ..., b̂ N-1] to a point-wise ratio, thereby obtaining a further array ĉ ; and- applying an inverse discrete-time Fourier transform to the further array ĉ .
- The method according to claim 10, wherein subjecting the arrays â = [â 0, ..., â N-1] and b̂ = [b̂ 0, ... , b̂ N-1] to the point-wise ratio comprises:- constructing two restricted arrays â ' and b̂ ' by restricting each one of the arrays â = [â 0, ..., â N-1] and b̂ = [b̂ 0, ..., b̂ N-1] to frequency values contained in their discrete frequency-domain support; and- obtaining the further array ĉ as ĉ = b̂ ' ⊘ â ' where ⊘ stands for Hadamard division.
- The method according to any of claims 7 to 11, wherein step (g) comprises determining a spatial-domain Rayleigh response h[m · dz] of the optical fiber (100) and obtaining the information indicative of the acoustic event based on the spatial-domain Rayleigh response h[m · dz].
- The method according to claim 12, wherein steps (d) to (g) are periodically iterated at discrete time instants, thereby providing a sequence of spatial-domain Rayleigh responses h[m · dz] equally spaced in time.
- The method according to claim 13, wherein it further comprises applying a spectral correlation analysis to at least two spatial-domain Rayleigh responses h[m · dz] measured at different times t 1 and t 2.
Applications Claiming Priority (1)
| Application Number | Priority Date | Filing Date | Title |
|---|---|---|---|
| IT202300023607 | 2023-11-09 |
Publications (2)
| Publication Number | Publication Date |
|---|---|
| EP4553455A1 true EP4553455A1 (en) | 2025-05-14 |
| EP4553455B1 EP4553455B1 (en) | 2026-07-08 |
Family
ID=89474695
Family Applications (1)
| Application Number | Title | Priority Date | Filing Date |
|---|---|---|---|
| EP24211642.4A Active EP4553455B1 (en) | 2023-11-09 | 2024-11-08 | System and method for rayleigh-based distributed acousting sensing |
Country Status (4)
| Country | Link |
|---|---|
| US (1) | US20250155278A1 (en) |
| EP (1) | EP4553455B1 (en) |
| CN (1) | CN119958680A (en) |
| AU (1) | AU2024259835A1 (en) |
Citations (5)
| Publication number | Priority date | Publication date | Assignee | Title |
|---|---|---|---|---|
| US10203264B2 (en) * | 2014-08-28 | 2019-02-12 | Adelos, Inc. | Noise management for optical time delay interferometry |
| EP3477266A1 (en) * | 2017-10-26 | 2019-05-01 | AiQ Dienstleistungen UG (haftungsbeschränkt) | Distributed acoustic sensing device using different coherent interrogating light patterns, and corresponding sensing method |
| CN113503954A (en) * | 2021-05-27 | 2021-10-15 | 南京大学 | phi-OTDR signal measurement and noise suppression method based on multi-domain compressed sensing |
| WO2022229616A1 (en) * | 2021-04-28 | 2022-11-03 | Optasense Holdings Limited | Fibre optic sensing |
| US20230073827A1 (en) * | 2019-10-11 | 2023-03-09 | Sintela Limited | Signal processing methods for an optical detection system |
-
2024
- 2024-11-08 US US18/942,001 patent/US20250155278A1/en active Pending
- 2024-11-08 CN CN202411587395.XA patent/CN119958680A/en active Pending
- 2024-11-08 EP EP24211642.4A patent/EP4553455B1/en active Active
- 2024-11-08 AU AU2024259835A patent/AU2024259835A1/en active Pending
Patent Citations (5)
| Publication number | Priority date | Publication date | Assignee | Title |
|---|---|---|---|---|
| US10203264B2 (en) * | 2014-08-28 | 2019-02-12 | Adelos, Inc. | Noise management for optical time delay interferometry |
| EP3477266A1 (en) * | 2017-10-26 | 2019-05-01 | AiQ Dienstleistungen UG (haftungsbeschränkt) | Distributed acoustic sensing device using different coherent interrogating light patterns, and corresponding sensing method |
| US20230073827A1 (en) * | 2019-10-11 | 2023-03-09 | Sintela Limited | Signal processing methods for an optical detection system |
| WO2022229616A1 (en) * | 2021-04-28 | 2022-11-03 | Optasense Holdings Limited | Fibre optic sensing |
| CN113503954A (en) * | 2021-05-27 | 2021-10-15 | 南京大学 | phi-OTDR signal measurement and noise suppression method based on multi-domain compressed sensing |
Non-Patent Citations (2)
| Title |
|---|
| S. T. KREGER ET AL.: "High Resolution Distributed Strain or Temperature Measurements in Single-and Multimode Fiber Using Swept-Wavelength Interferometry", OPTICAL FIBER SENSORS, pages ThE42 |
| Z. HEQ. LIU: "Optical Fiber Distributed Acoustic Sensors: A Review", JOURNAL OF LIGHTWAVE TECHNOLOGY, vol. 39, no. 12, 15 June 2021 (2021-06-15), pages 3671 - 3686, XP011858392, DOI: 10.1109/JLT.2021.3059771 |
Also Published As
| Publication number | Publication date |
|---|---|
| US20250155278A1 (en) | 2025-05-15 |
| CN119958680A (en) | 2025-05-09 |
| AU2024259835A1 (en) | 2025-05-29 |
| EP4553455B1 (en) | 2026-07-08 |
Similar Documents
| Publication | Publication Date | Title |
|---|---|---|
| Bao et al. | Recent development in the distributed fiber optic acoustic and ultrasonic detection | |
| EP3640618B1 (en) | High rate distributed acoustic sensing using high power light pulses | |
| US10151626B2 (en) | Fibre optic distributed sensing | |
| CN114543973A (en) | Distributed ultrahigh frequency vibration signal measuring method and optical fiber sensor | |
| EP3477266B1 (en) | Distributed acoustic sensing device using different coherent interrogating light patterns, and corresponding sensing method | |
| WO2012101592A1 (en) | Distributed and dynamical brillouin sensing in optical fibers | |
| US12411026B2 (en) | Fibre optic sensing | |
| EP3916365A1 (en) | Method and system for interrogating optical fibers | |
| CN114838745B (en) | Single-data-channel multi-light-path parallel sensing method and system | |
| Li et al. | Broadband vibration signal measurement based on multi-coset sampling in phase-sensitive OTDR system | |
| JP2017110953A (en) | Group delay difference measuring method between propagation modes and group delay difference measuring system between propagation modes | |
| JP2004205368A (en) | Multipoint strain measuring system using ofdr method | |
| JP5849056B2 (en) | Optical pulse test apparatus and optical pulse test method | |
| Fan et al. | Digital phase shift based simulated coherence phase demodulation technology for Φ-OTDR | |
| US20250155278A1 (en) | System and method for rayleigh-based distributed acousting sensing | |
| Muanenda et al. | A φ-OTDR sensor for high-frequency distributed vibration measurements with minimal post-processing | |
| Sharif et al. | General method for rayleigh signature interrogation in distributed acoustic sensors based on optical time-domain reflectometry | |
| JP6751371B2 (en) | Spatial mode dispersion measuring method and spatial mode dispersion measuring apparatus | |
| Vallifuoco et al. | Lamb waves detection through phi-OTDR for structural health monitoring | |
| Gomes et al. | Pulse repetition rate and unwrapping limits in otdr fiber optic sensing systems | |
| BR102024023333A2 (en) | SYSTEM AND METHOD FOR RAYLEIGH-BASED DISTRIBUTED ACOUSTIC SENSING OF AN ACOUSTIC EVENT | |
| Aldoğan et al. | Development of a phase-OTDR interrogator based on coherent detection scheme | |
| Guo et al. | A low background noise distributed detection method for cable partial discharge based on ultraweak fiber Bragg grating array | |
| Waagaard et al. | Real-time phase-recording DAS in 171 km low-loss fiber | |
| Ishimaru et al. | Fast BOTDA acquiring method based on broadband light as a probe signal |
Legal Events
| Date | Code | Title | Description |
|---|---|---|---|
| PUAI | Public reference made under article 153(3) epc to a published international application that has entered the european phase |
Free format text: ORIGINAL CODE: 0009012 |
|
| STAA | Information on the status of an ep patent application or granted ep patent |
Free format text: STATUS: THE APPLICATION HAS BEEN PUBLISHED |
|
| AK | Designated contracting states |
Kind code of ref document: A1 Designated state(s): AL AT BE BG CH CY CZ DE DK EE ES FI FR GB GR HR HU IE IS IT LI LT LU LV MC ME MK MT NL NO PL PT RO RS SE SI SK SM TR |
|
| STAA | Information on the status of an ep patent application or granted ep patent |
Free format text: STATUS: REQUEST FOR EXAMINATION WAS MADE |
|
| 17P | Request for examination filed |
Effective date: 20251107 |
|
| GRAP | Despatch of communication of intention to grant a patent |
Free format text: ORIGINAL CODE: EPIDOSNIGR1 |
|
| STAA | Information on the status of an ep patent application or granted ep patent |
Free format text: STATUS: GRANT OF PATENT IS INTENDED |
|
| INTG | Intention to grant announced |
Effective date: 20260203 |
|
| GRAJ | Information related to disapproval of communication of intention to grant by the applicant or resumption of examination proceedings by the epo deleted |
Free format text: ORIGINAL CODE: EPIDOSDIGR1 |
|
| STAA | Information on the status of an ep patent application or granted ep patent |
Free format text: STATUS: REQUEST FOR EXAMINATION WAS MADE |
|
| GRAP | Despatch of communication of intention to grant a patent |
Free format text: ORIGINAL CODE: EPIDOSNIGR1 |
|
| STAA | Information on the status of an ep patent application or granted ep patent |
Free format text: STATUS: GRANT OF PATENT IS INTENDED |
|
| INTC | Intention to grant announced (deleted) | ||
| INTG | Intention to grant announced |
Effective date: 20260428 |
|
| GRAS | Grant fee paid |
Free format text: ORIGINAL CODE: EPIDOSNIGR3 |
|
| GRAA | (expected) grant |
Free format text: ORIGINAL CODE: 0009210 |
|
| STAA | Information on the status of an ep patent application or granted ep patent |
Free format text: STATUS: THE PATENT HAS BEEN GRANTED |
|
| AK | Designated contracting states |
Kind code of ref document: B1 Designated state(s): AL AT BE BG CH CY CZ DE DK EE ES FI FR GB GR HR HU IE IS IT LI LT LU LV MC ME MK MT NL NO PL PT RO RS SE SI SK SM TR |
|
| REG | Reference to a national code |
Ref country code: CH Ref legal event code: F10 Free format text: ST27 STATUS EVENT CODE: U-0-0-F10-F00 (AS PROVIDED BY THE NATIONAL OFFICE) Effective date: 20260708 Ref country code: GB Ref legal event code: FG4D |
|
| REG | Reference to a national code |
Ref country code: IE Ref legal event code: FG4D |
|
| REG | Reference to a national code |
Ref country code: DE Ref legal event code: R096 Ref document number: 602024005999 Country of ref document: DE |