EP4534963A1 - Spectroscopy device, raman spectroscopic measurement device, and spectroscopy method - Google Patents
Spectroscopy device, raman spectroscopic measurement device, and spectroscopy method Download PDFInfo
- Publication number
- EP4534963A1 EP4534963A1 EP22943848.6A EP22943848A EP4534963A1 EP 4534963 A1 EP4534963 A1 EP 4534963A1 EP 22943848 A EP22943848 A EP 22943848A EP 4534963 A1 EP4534963 A1 EP 4534963A1
- Authority
- EP
- European Patent Office
- Prior art keywords
- spectroscopic
- photons
- light
- pixel
- pixels
- Prior art date
- Legal status (The legal status is an assumption and is not a legal conclusion. Google has not performed a legal analysis and makes no representation as to the accuracy of the status listed.)
- Pending
Links
Images






Classifications
-
- G—PHYSICS
- G01—MEASURING; TESTING
- G01J—MEASUREMENT OF INTENSITY, VELOCITY, SPECTRAL CONTENT, POLARISATION, PHASE OR PULSE CHARACTERISTICS OF INFRARED, VISIBLE OR ULTRAVIOLET LIGHT; COLORIMETRY; RADIATION PYROMETRY
- G01J3/00—Spectrometry; Spectrophotometry; Monochromators; Measuring colours
- G01J3/28—Investigating the spectrum
- G01J3/30—Measuring the intensity of spectral lines directly on the spectrum itself
- G01J3/36—Investigating two or more bands of a spectrum by separate detectors
-
- G—PHYSICS
- G01—MEASURING; TESTING
- G01J—MEASUREMENT OF INTENSITY, VELOCITY, SPECTRAL CONTENT, POLARISATION, PHASE OR PULSE CHARACTERISTICS OF INFRARED, VISIBLE OR ULTRAVIOLET LIGHT; COLORIMETRY; RADIATION PYROMETRY
- G01J3/00—Spectrometry; Spectrophotometry; Monochromators; Measuring colours
- G01J3/28—Investigating the spectrum
- G01J3/44—Raman spectrometry; Scattering spectrometry ; Fluorescence spectrometry
-
- G—PHYSICS
- G01—MEASURING; TESTING
- G01J—MEASUREMENT OF INTENSITY, VELOCITY, SPECTRAL CONTENT, POLARISATION, PHASE OR PULSE CHARACTERISTICS OF INFRARED, VISIBLE OR ULTRAVIOLET LIGHT; COLORIMETRY; RADIATION PYROMETRY
- G01J3/00—Spectrometry; Spectrophotometry; Monochromators; Measuring colours
- G01J3/28—Investigating the spectrum
- G01J3/2803—Investigating the spectrum using photoelectric array detector
-
- G—PHYSICS
- G01—MEASURING; TESTING
- G01J—MEASUREMENT OF INTENSITY, VELOCITY, SPECTRAL CONTENT, POLARISATION, PHASE OR PULSE CHARACTERISTICS OF INFRARED, VISIBLE OR ULTRAVIOLET LIGHT; COLORIMETRY; RADIATION PYROMETRY
- G01J3/00—Spectrometry; Spectrophotometry; Monochromators; Measuring colours
- G01J3/28—Investigating the spectrum
- G01J3/2823—Imaging spectrometer
-
- G—PHYSICS
- G01—MEASURING; TESTING
- G01N—INVESTIGATING OR ANALYSING MATERIALS BY DETERMINING THEIR CHEMICAL OR PHYSICAL PROPERTIES
- G01N21/00—Investigating or analysing materials by the use of optical means, i.e. using sub-millimetre waves, infrared, visible or ultraviolet light
- G01N21/62—Systems in which the material investigated is excited whereby it emits light or causes a change in wavelength of the incident light
- G01N21/63—Systems in which the material investigated is excited whereby it emits light or causes a change in wavelength of the incident light optically excited
- G01N21/65—Raman scattering
-
- H—ELECTRICITY
- H04—ELECTRIC COMMUNICATION TECHNIQUE
- H04N—PICTORIAL COMMUNICATION, e.g. TELEVISION
- H04N25/00—Circuitry of solid-state image sensors [SSIS]; Control thereof
- H04N25/10—Circuitry of solid-state image sensors [SSIS]; Control thereof for transforming different wavelengths into image signals
- H04N25/11—Arrangement of colour filter arrays [CFA]; Filter mosaics
- H04N25/13—Arrangement of colour filter arrays [CFA]; Filter mosaics characterised by the spectral characteristics of the filter elements
- H04N25/135—Arrangement of colour filter arrays [CFA]; Filter mosaics characterised by the spectral characteristics of the filter elements based on four or more different wavelength filter elements
-
- H—ELECTRICITY
- H04—ELECTRIC COMMUNICATION TECHNIQUE
- H04N—PICTORIAL COMMUNICATION, e.g. TELEVISION
- H04N25/00—Circuitry of solid-state image sensors [SSIS]; Control thereof
- H04N25/10—Circuitry of solid-state image sensors [SSIS]; Control thereof for transforming different wavelengths into image signals
- H04N25/17—Colour separation based on photon absorption depth, e.g. full colour resolution obtained simultaneously at each pixel location
Definitions
- the present disclosure relates to a spectroscopic device, a Raman spectroscopic measurement device, and a spectroscopic method.
- CMOS image sensor in addition to CCD, a CMOS image sensor is also known.
- CMOS image sensors are not widely used in the field of spectroscopic measurement requiring high sensitivity and high accuracy.
- an amplifier is arranged in each pixel, and a charge is converted into a voltage for each pixel.
- readout noise since readout noise is also integrated as the number of stages of vertical binning increases, there is a problem in that an SN ratio of a signal is lower than that in the case of using a CCD image sensor.
- an electrical signal output from each pixel is converted into the number of photons on the basis of light received by each pixel.
- the electrical signal is converted into the number of photons, for example, the number of photons of a pixel that has not received light is zero. Therefore, when the number of photons of the plurality of pixels belonging to the same column is integrated after conversion into the number of photons, the influence of readout noise of each pixel can be sufficiently reduced. Therefore, in this spectroscopic method, the spectroscopic spectrum data can be acquired with an excellent SN ratio.
- Each pixel 21 includes a photodiode 22 and an amplifier 23.
- the photodiode 22 accumulates electrons (photoelectrons) generated by the input of the light L1 as charges.
- the amplifier 23 converts the charges accumulated in the photodiode 22 into an electrical signal (for example, a signal indicating a voltage value) and amplifies the electrical signal.
- the electrical signal amplified by the amplifier 23 is transferred to a vertical signal line 25 connecting the pixels 21 in the row direction to each other by switching a selection switch 24 of each pixel 21.
- the electrical signal transferred to the vertical signal line 25 is sent to an A/D converter 27 via a low-pass filter 26 for noise removal. Note that, in the imaging sensor 10, each pixel 21 may include the low-pass filter 26 and the A/D converter 27.
- the first conversion unit 12A includes the A/D converter 27 described above.
- the A/D converter 27 converts an analog value indicated by the electrical signal output from the amplifier 23 of each of the plurality of pixels 21 into a digital value.
- the converted digital value is output to the second conversion unit 12B via an output unit 28.
- the digital value output from the A/D converter 27 is expressed by the following Formula (1).
- Digital value [DN] Gain [DN/e] ⁇ Number of electrons [e] + Offset value [DN]
- FIG. 4(a) and FIG. 4(b) are graphs showing an example of conversion from an analog value to a digital value.
- FIG. 4(a) shows the probability distribution of electrons when two photons are input on average to one pixel in a case where the readout noise is 0.15 [e-rms].
- thresholds for dividing the number of electrons are set with reference to an intermediate value of the numbers of electrons, such as 0.5e, 1.5e, 2.5e ... (see broken lines in FIG. 4(a) ). Data for distinguishing these numbers of electrons from each other is the above-described threshold data.
- the distortion amount of the spectroscopic spectrum image increases as the optical image is farther from the center of the pixel unit 11.
- the distortion amount of the spectroscopic spectrum images 31A and 31E is larger than the distortion amount of the spectroscopic spectrum images 31B and 31D.
- the specifying unit 14 may specify the pixel 21 to be used for integration of the number of photons and an integration ratio of the pixels 21 on the basis of aberration information of the light L1 in the spectroscopic optical system 4, and the generation unit 13 may integrate the number of photons of the plurality of pixels 21 by using the integration ratio.
- the specifying unit 14 may have an integration ratio map M2 with respect to the pixel unit 11.
- the aberration information to be used for generating the integration ratio map M2 can be acquired in advance by simulation data or actual measurement data in the case of guiding the light L1 to the spectroscopic optical system 4. In the case of using actual measurement data, aberration information can be acquired on the basis of spectroscopic spectrum data of a plurality of optical images on the premise that there is no local distortion.
- the number of photons of the pixel 21 of coordinates (x,y) is P(x,y).
- the reference of the x coordinate of the pixel 21 corresponding to the spectroscopic spectrum image 31B is 300 and the y coordinate is -512 to +512
- vertical binning of the pixel 21 corresponding to the spectroscopic spectrum image 31B is expressed by the following Formula (4).
- the reference of the x coordinate of the pixel 21 corresponding to the spectroscopic spectrum image 31E is 700 and the y coordinate is -512 to +512
- vertical binning of the pixel 21 corresponding to the spectroscopic spectrum image 31E is expressed by the following Formula (5).
- the number of photons of the plurality of pixels 21 belonging to the same column are integrated to generate spectroscopic spectrum data based on an integration result.
- the pixel 21 whose readout noise is equal to or less than the threshold is specified as the pixel 21 to be used for integration of the number of photons, and only the pixel 21 whose readout noise is equal to or less than the threshold is specified as the pixel 21 to be used for integration of the number of photons.
- an electrical signal output from each pixel 21 is converted into the number of photons on the basis of light received by each pixel 21 constituting the pixel unit 11.
- the electrical signal is converted into the number of photons, for example, the number of photons of the pixel 21 that has not received light is zero. Therefore, when the number of photons of the plurality of pixels 21 belonging to the same column is integrated after conversion into the number of photons, the influence of readout noise of each pixel 21 can be sufficiently reduced. Therefore, in the spectroscopic device 5, the spectroscopic spectrum data can be acquired with an excellent SN ratio.
Landscapes
- Physics & Mathematics (AREA)
- Spectroscopy & Molecular Physics (AREA)
- General Physics & Mathematics (AREA)
- Health & Medical Sciences (AREA)
- Chemical & Material Sciences (AREA)
- Analytical Chemistry (AREA)
- Biochemistry (AREA)
- General Health & Medical Sciences (AREA)
- Life Sciences & Earth Sciences (AREA)
- Immunology (AREA)
- Pathology (AREA)
- Nuclear Medicine, Radiotherapy & Molecular Imaging (AREA)
- Engineering & Computer Science (AREA)
- Multimedia (AREA)
- Signal Processing (AREA)
- Investigating, Analyzing Materials By Fluorescence Or Luminescence (AREA)
- Spectrometry And Color Measurement (AREA)
Abstract
Description
- The present disclosure relates to a spectroscopic device, a Raman spectroscopic measurement device, and a spectroscopic method.
- As a conventional spectroscopic device, for example, a spectroscopic device described in
Patent Literature 1 is mentioned. This conventional spectroscopic device is a so-called Raman spectroscopic device. The spectroscopic device includes a means for linearly irradiating excitation light, a movable stage on which a sample is placed, an objective lens focusing Raman light from an excitation light irradiation region, a slit provided at an image forming position of the Raman light, a spectroscope dispersing light passing through the slit, a CCD detector detecting a Raman spectrum image, and a control device controlling mapping measurement by synchronization between the movable stage and the CCD detector. - Patent Literature 1:
Japanese Unexamined Patent Publication No. 2016-180732 - In the field of spectroscopic measurement requiring high sensitivity and high accuracy, such as Raman spectroscopy, fluorescence spectroscopy, and plasma spectroscopy, vertical binning of a CCD image sensor is used to acquire spectroscopic spectrum data in order to improve an SN ratio of a signal. In the vertical binning in the CCD image sensor, charges generated in each pixel are added for a plurality of stages. In the CCD image sensor, readout noise is generated only in an amplifier of the final stage, and does not increase in the process of vertical binning. Therefore, as the number of stages of vertical binning increases, the SN ratio of the signal can be improved.
- As the image sensor, in addition to CCD, a CMOS image sensor is also known. However, at present, CMOS image sensors are not widely used in the field of spectroscopic measurement requiring high sensitivity and high accuracy. In the CMOS image sensor, an amplifier is arranged in each pixel, and a charge is converted into a voltage for each pixel. In the case of performing vertical binning by a conventional CMOS image sensor, since readout noise is also integrated as the number of stages of vertical binning increases, there is a problem in that an SN ratio of a signal is lower than that in the case of using a CCD image sensor.
- The present disclosure has been made to solve the above problems, and an object thereof is to provide a spectroscopic device, a Raman spectroscopic measurement device, and a spectroscopic method capable of acquiring spectroscopic spectrum data with an excellent SN ratio.
- The gist of a spectroscopic device, a Raman spectroscopic measurement device, and a spectroscopic method according to an aspect of the present disclosure is as described in the following [1] to [12].
- [1] A spectroscopic device receiving light wavelength-resolved in a predetermined direction by a spectroscopic optical system including a spectroscopic element to output spectroscopic spectrum data of the light, the spectroscopic device including: a pixel unit including a plurality of pixels receiving the wavelength-resolved light to convert the light into an electrical signal, and the plurality of pixels being arranged in a row direction along a wavelength resolution direction and in a column direction perpendicular to the row direction; a conversion unit converting the electrical signal from the plurality of pixels into a number of photons; and a generation unit integrating the number of photons of a plurality of pixels belonging to the same column to generate spectroscopic spectrum data based on an integration result.
In this spectroscopic device, an electrical signal output from each pixel is converted into the number of photons on the basis of light received by each pixel constituting the pixel unit. When the electrical signal is converted into the number of photons, for example, the number of photons of a pixel that has not received light is zero. Therefore, when the number of photons of the plurality of pixels belonging to the same column is integrated after conversion into the number of photons, the influence of readout noise of each pixel can be sufficiently reduced. Therefore, in this spectroscopic device, the spectroscopic spectrum data can be acquired with an excellent SN ratio. - [2] The spectroscopic device described in [1], further including a specifying unit specifying a pixel to be used for integration of the number of photons among the plurality of pixels belonging to the same column. In this case, by specifying the pixel suitable for integration of the number of photons, the influence of the readout noise of each pixel can be more sufficiently reduced. By reducing the influence of the readout noise of each pixel, the conversion accuracy from the electrical signal to the number of photons is enhanced, and the SN ratio of the spectroscopic spectrum data is further improved.
- [3] The spectroscopic device described in [2], wherein the specifying unit specifies a pixel whose readout noise is equal to or less than a threshold as the pixel to be used for integration of the number of photons. Thereby, the influence of the readout noise of each pixel can be more sufficiently reduced. By reducing the influence of the readout noise of each pixel, the conversion accuracy from the electrical signal to the number of photons is enhanced, and the SN ratio of the spectroscopic spectrum data is further improved.
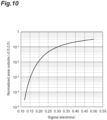
- [4] The spectroscopic device described in [3], wherein the threshold of the readout noise is set to 0.3 [e-rms]. Thereby, an erroneous conversion rate at the time of converting the electrical signal into the number of photons can be suppressed to 10% or less.
- [5] The spectroscopic device described in any one of [2] to [4], wherein the specifying unit specifies the pixel to be used for integration of the number of photons such that the number of pixels to be used for integration of the number of photons is the same in each column. In this case, it is possible to align integrated values of the readout noise of the pixels of each column to be used for integration of the number of photons in the row direction. Therefore, the SN ratio of the spectroscopic spectrum data can be stably improved.
- [6] The spectroscopic device described in any one of [2] to [5], wherein the specifying unit specifies the pixel to be used for integration of the number of photons and an integration ratio of the pixels on the basis of aberration information of the light in the spectroscopic optical system, and the generation unit integrates the number of photons of the plurality of pixels by using the integration ratio. According to such a configuration, even when distortion due to aberration occurs in the image of the wavelength-resolved light, the number of photons of the plurality of pixels can be suitably integrated.
- [7] The spectroscopic device described in any one of [2] to [6], wherein the specifying unit holds in advance area information indicating an area where there is no input of the light in the pixel unit, and excludes a pixel corresponding to the area information from the integration of the number of photons. In this case, by excluding pixels not requiring integration of the number of photons, the influence of the readout noise of each pixel can be further reduced.
- [8] The spectroscopic device described in any one of [1] to [7], wherein the conversion unit includes a first conversion unit converting the electrical signal into a digital value and a second conversion unit converting the digital value into a number of photons on the basis of reference data held in advance. In this case, the number of photons of each pixel can be acquired in a state where the influence of variations in the gain and offset of each pixel is suppressed.
- [9] The spectroscopic device described in any one of [1] to [8], further including an analysis unit analyzing the spectroscopic spectrum data. In this case, the spectroscopic device is provided with a spectroscopic spectrum data analysis function, so that convenience is improved.
- [10] The spectroscopic device described in any one of [1] to [9], further including a spectroscopic optical system including a spectroscopic element dispersing the light in the wavelength resolution direction. In this case, the spectroscopic device is provided with a wavelength resolution function of the light, so that convenience is improved.
- [11] A Raman spectroscopic measurement device including: the spectroscopic device described in any one of [1] to [10]; a light source unit generating light with which a sample is irradiated; and a light guiding optical system guiding Raman scattered light generated by irradiating the sample with the light to the spectroscopic device.
In this Raman spectroscopic measurement device, an electrical signal output from each pixel is converted into the number of photons on the basis of Raman scattered light received by each pixel constituting the pixel unit. When the electrical signal is converted into the number of photons, for example, the number of photons of a pixel that has not received Raman scattered light is zero. Therefore, when the number of photons of the plurality of pixels belonging to the same column is integrated after conversion into the number of photons, the influence of readout noise of each pixel can be sufficiently reduced. Therefore, in this Raman spectroscopic measurement device, spectroscopic spectrum data of the Raman scattered light can be acquired with an excellent SN ratio. - [12] A spectroscopic method of receiving light wavelength-resolved in a predetermined direction to acquire spectroscopic spectrum data of the light, the spectroscopic method including: a light receiving step of receiving the wavelength-resolved light by a plurality of pixels arranged in a row direction along a wavelength resolution direction and in a column direction perpendicular to the row direction to convert the light into an electrical signal; a converting step of converting the electrical signal from the plurality of pixels into a number of photons; and a generating step of integrating the number of photons of a plurality of pixels belonging to the same column to generate spectroscopic spectrum data based on an integration result.
- In this spectroscopic method, an electrical signal output from each pixel is converted into the number of photons on the basis of light received by each pixel. When the electrical signal is converted into the number of photons, for example, the number of photons of a pixel that has not received light is zero. Therefore, when the number of photons of the plurality of pixels belonging to the same column is integrated after conversion into the number of photons, the influence of readout noise of each pixel can be sufficiently reduced. Therefore, in this spectroscopic method, the spectroscopic spectrum data can be acquired with an excellent SN ratio.
- According to the present disclosure, the spectroscopic spectrum data can be acquired with an excellent SN ratio.
-
-
FIG. 1 is a block diagram illustrating a configuration of a Raman spectroscopic measurement device according to an embodiment of the present disclosure. -
FIG. 2 is a view illustrating a structure of an imaging sensor. -
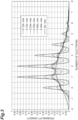
FIG. 3 is a graph showing a relationship between a number of electrons and a probability density. -
FIGS. 4(a) and 4(b) are graphs showing an example of conversion from an analog value to a digital value. -
FIG. 5 is a schematic view illustrating a step of acquiring an offset value. -
FIG. 6 is a schematic view illustrating a step of acquiring a gain. -
FIG. 7 is a schematic view illustrating a correspondence relationship between a gain and an offset value, and a threshold. -
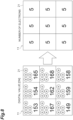
FIG. 8 is a value schematically illustrating a process of converting a digital value for each pixel into a number of electrons. -
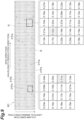
FIG. 9 is a schematic view illustrating an example of a readout noise map in a pixel unit. -
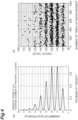
FIG. 10 is a graph showing a relationship between readout noise and an erroneous conversion rate at the time of converting an electrical signal into a number of photons. -
FIG. 11(a) is a schematic view illustrating an example of a spectroscopic spectrum image having aberration, andFIG. 11(b) is a schematic view illustrating an example of spectroscopic spectrum data obtained on the basis of the spectroscopic spectrum image illustrated inFIG. 11(a) . -
FIG. 12 is a schematic view illustrating an example of an integration ratio map in the pixel unit. -
FIG. 13 is a schematic graph showing spectroscopic spectrum data obtained by vertical binning using the integration ratio map. -
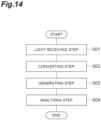
FIG. 14 is a flowchart illustrating a spectroscopic method according to an embodiment of the present disclosure. - Hereinafter, preferred embodiments of a spectroscopic device and a Raman spectroscopic measurement device according to an aspect of the present disclosure will be described in detail with reference to the drawings.
-
FIG. 1 is a block diagram illustrating a configuration of a Raman spectroscopic measurement device according to an embodiment of the present disclosure. A Ramanspectroscopic measurement device 1 is a device measuring physical properties of a sample S by using Raman scattered light Lr. In the Ramanspectroscopic measurement device 1, the sample S is irradiated with light L1 from alight source unit 2, the Raman scattered light Lr generated by an interaction between the light L1 and the sample S is detected by aspectroscopic device 5, and spectroscopic spectrum data of the Raman scattered light Lr is acquired. By analyzing the spectroscopic spectrum data acquired by thespectroscopic device 5 with acomputer 6, various physical properties such as the molecular structure, crystallinity, orientation, and distortion amount of the sample S can be evaluated. Examples of the sample S include semiconductor materials, polymers, cells, and pharmaceuticals. - As illustrated in
FIG. 1 , the Ramanspectroscopic measurement device 1 includes thelight source unit 2, a light guidingoptical system 3, a spectroscopicoptical system 4, thespectroscopic device 5, thecomputer 6, and adisplay unit 7. In the following description, for convenience, light incident on thespectroscopic device 5 through the spectroscopicoptical system 4 may be referred to as the light L1 to be distinguished from the Raman scattered light Lr. In thespectroscopic device 5 incorporated in the Ramanspectroscopic measurement device 1, the light L1 refers to the Raman scattered light Lr. - The
light source unit 2 is a portion generating light L0 with which the sample S is irradiated. As a light source constituting thelight source unit 2, for example, a laser light source serving as an excitation light source for Raman spectroscopy, a light emitting diode, or the like can be used. The light guidingoptical system 3 is a portion guiding the Raman scattered light Lr generated by irradiating the sample S with the light L0 to thespectroscopic device 5. The light guidingoptical system 3 includes, for example, a collimating lens, one or a plurality of mirrors, a slit, and the like. - The spectroscopic
optical system 4 is a portion wavelength-resolving the light L1 in a predetermined direction. The spectroscopicoptical system 4 includes a spectroscopic element dispersing the light L1 in a predetermined wavelength resolution direction. As the spectroscopic element, for example, a prism, a diffraction grating (grating) such as a planar diffraction grating or a concave diffraction grating, and the like can be used. The Raman scattered light Lr is dispersed by the spectroscopicoptical system 4 and input to thespectroscopic device 5. - In
FIG. 1 , the spectroscopicoptical system 4 is configured separately from thespectroscopic device 5, but the spectroscopicoptical system 4 may be incorporated as a constituent element of thespectroscopic device 5. That is, thespectroscopic device 5 may further include the spectroscopicoptical system 4 including a spectroscopic element that disperses the light L1 in the wavelength resolution direction. In this case, thespectroscopic device 5 is provided with a wavelength resolution function of the light L1, so that convenience is improved. - The
spectroscopic device 5 is a portion receiving the light L1 wavelength-resolved in a predetermined direction to output spectroscopic spectrum data of the light L1. In the present embodiment, thespectroscopic device 5 receives the Raman scattered light Lr dispersed in a predetermined wavelength resolution direction by the spectroscopicoptical system 4 and outputs spectroscopic spectrum data of the Raman scattered light Lr to thecomputer 6. - The
computer 6 physically includes a storage device such as a RAM or a ROM, a processor (arithmetic circuit) such as a CPU, a communication interface, and the like. As thecomputer 6, for example, a personal computer, a cloud server, or a smart device (smartphone, tablet terminal, or the like) can be used. Thecomputer 6 is connected to thelight source unit 2 of the Ramanspectroscopic measurement device 1 and thespectroscopic device 5 so as to be able to communicate information with one another, and can integrally control these constituent elements. Thecomputer 6 also functions as ananalysis unit 8 analyzing physical properties of the sample S on the basis of the spectroscopic spectrum data received from ageneration unit 13. Thecomputer 6 outputs information indicating the analysis result of theanalysis unit 8 to thedisplay unit 7. - As illustrated in
FIG. 1 , thespectroscopic device 5 includes apixel unit 11, aconversion unit 12, thegeneration unit 13, and a specifyingunit 14. Thepixel unit 11 includes a plurality ofpixels 21 receiving the wavelength-resolved light L1 and converting the light into an electrical signal. In the present embodiment, thepixel unit 11 and afirst conversion unit 12A (described later) configured by animaging sensor 10. In the present embodiment, thespectroscopic device 5 is configured as a camera including theimaging sensor 10, asecond conversion unit 12B (described later), thegeneration unit 13, and the specifyingunit 14. - Here, the
spectroscopic device 5 is separated from thecomputer 6, but thespectroscopic device 5 may be formed by integrating the camera including theimaging sensor 10, thesecond conversion unit 12B, thegeneration unit 13, and the specifyingunit 14 with the computer 6 (analysis unit 8) connected to the camera so as to be able to communicate information with each other electrically or wirelessly. In this case, the spectroscopic device is provided with a spectroscopic spectrum data analysis function, so that convenience is improved. Thespectroscopic device 5 may be formed by integrating the camera including theimaging sensor 10 and thesecond conversion unit 12B with thecomputer 6 functioning as thegeneration unit 13, the specifyingunit 14, and theanalysis unit 8. - Examples of the
imaging sensor 10 include a quantitative complementary metal oxide semiconductor (qCMOS) image sensor (registered trademark), a single photon avalanche diode (SPAD) image sensor, and a multi-pixel photon counter (MPPC: registered trademark) capable of identifying the number of photons or the number of photoelectrons. In the present embodiment, theimaging sensor 10 includes a qCMOS image sensor. In the present embodiment, the number of photons refers to the number of photons incident to eachpixel 21 of theimaging sensor 10 or the number of photoelectrons generated in eachpixel 21 of theimaging sensor 10. -
FIG. 2 is a view illustrating a structure of an imaging sensor.FIG. 2 illustrates a qCMOS image sensor among the above-described sensors. As illustrated inFIG. 2 , in thepixel unit 11 of theimaging sensor 10, a plurality ofpixels 21 arranged in a row direction and a column direction perpendicular to the row direction. Here, the row direction is along the wavelength resolution direction by the spectroscopicoptical system 4, and the column direction is along a vertical binning direction described later. InFIG. 2 , for convenience of description, thepixels 21 of 3 rows × 3 columns are illustrated, but thepixels 21 of n rows × m columns are arranged in the actual pixel unit 11 (seeFIG. 9 or the like). - Each
pixel 21 includes aphotodiode 22 and anamplifier 23. Thephotodiode 22 accumulates electrons (photoelectrons) generated by the input of the light L1 as charges. Theamplifier 23 converts the charges accumulated in thephotodiode 22 into an electrical signal (for example, a signal indicating a voltage value) and amplifies the electrical signal. The electrical signal amplified by theamplifier 23 is transferred to avertical signal line 25 connecting thepixels 21 in the row direction to each other by switching aselection switch 24 of eachpixel 21. The electrical signal transferred to thevertical signal line 25 is sent to an A/D converter 27 via a low-pass filter 26 for noise removal. Note that, in theimaging sensor 10, eachpixel 21 may include the low-pass filter 26 and the A/D converter 27. - When the electrical signal amplified by the
amplifier 23 is read, readout noise which is random noise is generated in theamplifier 23.FIG. 3 is a graph showing a relationship between a number of electrons and a probability density. InFIG. 3 , the horizontal axis represents the number of electrons, and the vertical axis represents the probability density. As shown inFIG. 3 , the number of electrons generated by the input photons follows the Poisson distribution. -
FIG. 3 shows the probability distribution of electrons when two photons are input on average to one pixel for each readout noise. InFIG. 3 , as the readout noise, seven examples of 0.12 [e-rms], 0.15 [e-rms], 0.25 [e-rms], 0.35 [e-rms], 0.40 [e-rms], 0.45 [e-rms], and 1.0 [e-rms] are shown. From the results shown inFIG. 3 , it can be seen that the smaller the readout noise, the sharper the peak of the waveform of the probability distribution appears, and the separation of the distribution for each number of electrons becomes clear. Therefore, it is possible to obtain the magnitude of the readout noise capable of classifying the number of electrons depending on whether or not the peak of the probability distribution can be identified. - As illustrated in
FIG. 1 , theconversion unit 12 is a portion converting the electrical signal from the plurality ofpixels 21 into a number of photons. Theconversion unit 12 includes thefirst conversion unit 12A converting the electrical signal into a digital value and thesecond conversion unit 12B converting the digital value into the number of photons on the basis of threshold data (reference data) held in advance. - In the present embodiment, the
first conversion unit 12A includes the A/D converter 27 described above. The A/D converter 27 converts an analog value indicated by the electrical signal output from theamplifier 23 of each of the plurality ofpixels 21 into a digital value. The converted digital value is output to thesecond conversion unit 12B via anoutput unit 28. The digital value output from the A/D converter 27 is expressed by the following Formula (1).Digital value [DN] = Gain [DN/e] × Number of electrons [e] + Offset value [DN] -
FIG. 4(a) and FIG. 4(b) are graphs showing an example of conversion from an analog value to a digital value.FIG. 4(a) shows the probability distribution of electrons when two photons are input on average to one pixel in a case where the readout noise is 0.15 [e-rms]. InFIG. 4(a) , thresholds for dividing the number of electrons are set with reference to an intermediate value of the numbers of electrons, such as 0.5e, 1.5e, 2.5e ... (see broken lines inFIG. 4(a) ). Data for distinguishing these numbers of electrons from each other is the above-described threshold data. - In
FIG. 4(b) , the gain is 11 [DN/e], and the offset value is 100 [DN]. As shown inFIG. 4(b) , when the gain is 11 [DN/e], the distribution of the digital values can be approximated to the distribution of the analog values. Furthermore, since the gain is an odd number, taking of a digital value corresponding to the threshold is suppressed. Since the gain value is large, the output digital value can be approximated by an analog value. In the present embodiment, the gain of thepixel unit 11 may be, for example, 10 [DN/e] or more. - Returning to
FIG. 1 , thesecond conversion unit 12B, and thegeneration unit 13 and the specifyingunit 14 described later are physically configured by a computer system including a storage device such as a RAM or a ROM, a processor (arithmetic circuit) such as a CPU, a communication interface, and the like. Thesecond conversion unit 12B may include a programmable logic controller (PLC), and may include an integrated circuit such as a field-programmable gate array (FPGA). - The
second conversion unit 12B holds reference data for converting the digital value output from thefirst conversion unit 12A into the number of photons. For example, a lookup table is used as the reference data. The reference data is generated in consideration of variations in gain and offset value amongpixels 21. The reference data is generated, for example, on the basis of the gain and the offset value of each of the plurality ofpixels 21. The reference data includes, for example, threshold data of eachpixel 21. - The threshold data is data for dividing the number of electrons.
FIG. 5 is a schematic view illustrating a step of acquiring an offset value. The digital value output from the A/D converter 27 is expressed by the above-described Formula (1). The offset value is indicated by a digital value output in a state where the light L1 is not input. In the present embodiment, as illustrated inFIG. 5 , a plurality of digital values is acquired from a plurality of dark images acquired by thepixel unit 11 in a state where the light L1 is not input. Then, an offset value is acquired by averaging the acquired digital values for each pixel. -
FIG. 6 is a schematic view illustrating a step of acquiring a gain. In acquiring the gain of eachpixel 21, first, a plurality of frame images by thepixel unit 11 is acquired with a sufficient light amount. Then, an average optical signal value S [DN] of the digital values in eachpixel 21 and a standard deviation N [DN] are acquired. In this case, since the gain is represented by N2/S, the gain can be derived from the average optical signal value S and the standard deviation N. - For example, when the intermediate value of the numbers of electrons is set as a threshold, the threshold indicating the lower limit of each number of electrons is expressed by the following Formula (2). Furthermore, a threshold indicating the upper limit of each number of electrons is expressed by the following Formula (3). A range represented by the lower limit threshold and the upper limit threshold is a range of the threshold corresponding to the number of electrons.
Threshold (lower value) = (Number of electrons - 0.5) × Gain + Offset value Threshold (upper limit) = (Number of electrons + 0.5) × Gain + Offset value -
FIG. 7 is a view schematically illustrating a correspondence relationship between a gain and an offset value, and a threshold. InFIG. 7 , the threshold when it is determined that the number of electrons is 5 is illustrated for each pixel. For example, when the gain is 10.9 [DN/e] and the offset value is 97.7 [DN], the lower limit threshold is 146.8 [DN] and the upper limit threshold is 157.7 [DN]. -
FIG. 8 is a value schematically illustrating a process of converting a digital value for each pixel into a number of electrons. As illustrated inFIG. 8 , thesecond conversion unit 12B can derive the number of electrons corresponding to the digital value by referring to the threshold data. For example, the number of electrons of thepixel 21 whose digital value is 162 [DN] is derived as 5 electrons. Thesecond conversion unit 12B can obtain the average number of photons by dividing the average number of electrons by the quantum efficiency for each pixel. When the quantum efficiency is 100%, the number of electrons and the number of photons are the same. Thesecond conversion unit 12B outputs the number of photons derived for eachpixel 21 to thegeneration unit 13. Furthermore, thesecond conversion unit 12B outputs instruction information instructing the specifyingunit 14 to start processing at the time of outputting the number of photons to thegeneration unit 13. - Returning to
FIG. 1 again, thegeneration unit 13 is a portion integrating the number of photons of the plurality ofpixels 21 belonging to the same column to generate spectroscopic spectrum data based on an integration result. The integration of the number of photons of the plurality ofpixels 21 belonging to the same column is processing corresponding to so-called vertical binning. Here, instead of performing vertical binning on the electrical signal from eachpixel 21, vertical binning is performed on the number of photons converted from the electrical signal. The spectroscopic spectrum data may be a two-dimensional image representing the number of photons in eachpixel 21, or may be a histogram obtained by plotting the number of pixels with respect to the number of photons. Thegeneration unit 13 outputs the generated spectroscopic spectrum data to thecomputer 6. - The specifying
unit 14 is a portion specifying thepixel 21 to be used for integration of the number of photons among the plurality ofpixels 21 belonging to the same column. That is, the specifyingunit 14 is a portion specifying thepixel 21 to be used for vertical binning in thegeneration unit 13. The specifyingunit 14 specifies, for example, thepixel 21 whose readout noise is equal to or less than a threshold as thepixel 21 to be used for integration of the number of photons. Upon receiving the instruction information from thesecond conversion unit 12B, the specifyingunit 14 generates specific information indicating the specifiedpixel 21 and outputs the specific information to thegeneration unit 13. In thegeneration unit 13, the number of photons of the plurality ofpixels 21 belonging to the same column are integrated using only thepixel 21 indicated by the specific information to generate spectroscopic spectrum data based on an integration result. - For example, as illustrated in
FIG. 9 , the specifyingunit 14 may hold a readout noise map M1 with respect to thepixel unit 11. The readout noise map M1 is created, for example, by measuring readout noise of eachpixel 21 before thepixel unit 11 is incorporated into thespectroscopic device 5. In the example ofFIG. 9 , a readout noise map with respect to the horizontallylong pixel unit 11 in which the number of pixels in the row direction is large than the number of pixels in the column direction. In the readout noise map M1, the threshold of the readout noise is set to 0.3 [e-rms]. The specifyingunit 14 specifies thepixel 21 whose readout noise is 0.3 [e-rms] or less as the pixel to be used for integration of the number of photons on the basis of the readout noise map M1. The specifyingunit 14 excludes thepixel 21 whose readout noise exceeds 0.3 [e-rms] (the pixel 21Fa inFIG. 9 ) from the pixels to be used for integration of the number of photons. - The threshold in the readout noise map M11 is set on the basis of a relationship between readout noise and an erroneous conversion rate at the time of converting an electrical signal into a number of photons.
FIG. 10 is a graph showing a relationship between readout noise and an erroneous conversion rate at the time of converting an electrical signal into a number of photons. As shown inFIG. 10 , in the case of setting the threshold of the readout noise to 0.3 [e-rms], the erroneous conversion rate at the time of converting the electrical signal into the number of photons can be suppressed to 10% or less. - The specifying
unit 14 may specify thepixel 21 to be used for integration of the number of photons such that the number ofpixels 21 to be used for integration of the number of photons is the same in each column. In this case, the specifyingunit 14 may specify the integrated number of pixels of another column in accordance with the integrated number of pixels of the column having the largest number of pixels excluded from the pixels to be used for integration of the number of photons. For example, when the number of pixels of each column is 1024 pixels, and the integrated number of pixels of a column having the largest number of pixels excluded from the pixels to be used for integration of the number of photons is 1020 pixels (four pixels are excluded), arbitrary four pixels of another column may be set as dummy pixels not to be used for integration of the number of photons, and the integrated number of pixels of all columns may be aligned to 1020 pixels. - The specifying
unit 14 may hold in advance area information indicating an area where there is no input of the light L1 in thepixel unit 11, and may exclude thepixel 21 corresponding to the area information from the integration of the number of photons. The area information is generated in advance on the basis of, for example, specifications or an arrangement mode of the spectroscopic element in the spectroscopicoptical system 4. The area information may be superimposed on the readout noise map M1. In the example ofFIG. 9 , thepixels 21 located at both ends of each column belong to an area R where there is no input of the light L1. Thepixel 21 belonging to the area R (pixel 21Fb inFIG. 9 ) is excluded from the integration of the number of photons in each column. - As described above, the spectroscopic
optical system 4 includes a spectroscopic element dispersing the light L1 in the wavelength resolution direction. However, it is assumed that the spectroscopic spectrum image actually formed on thepixel unit 11 through the spectroscopicoptical system 4 is not linear due to the influence of aberration of the optical system as represented by, for example, Czerny-Turner type spectroscopy. - For example, in
FIG. 11(a) , five wavelength-resolved spectroscopic spectrum images (31A to 31E from the short wavelength side) are formed with respect to thepixel unit 11 in a state of being separated from each other in the row direction (wavelength resolution direction) For example, in the example ofFIG. 11(a) , thespectroscopic spectrum image 31C located at the center of thepixel unit 11 has a linear shape in the column direction (vertical binning direction), but in each of thespectroscopic spectrum images spectroscopic spectrum images pixel unit 11. - The distortion amount of the spectroscopic spectrum image increases as the optical image is farther from the center of the
pixel unit 11. The distortion amount of thespectroscopic spectrum images spectroscopic spectrum images pixel 21 of each column is performed in a state where such distortion occurs, as illustrated inFIG. 11(b) , there is a concern that the wavelength resolution in the row direction decreases according to the degree of distortion in spectroscopicspectrum data items spectroscopic spectrum images spectroscopic spectrum image 31C among spectroscopicspectrum data items 32A to 32E based on thespectroscopic spectrum images 31A to 31E. Furthermore, peak values of the spectroscopicspectrum data items - With respect to such a problem, the specifying
unit 14 may specify thepixel 21 to be used for integration of the number of photons and an integration ratio of thepixels 21 on the basis of aberration information of the light L1 in the spectroscopicoptical system 4, and thegeneration unit 13 may integrate the number of photons of the plurality ofpixels 21 by using the integration ratio. Specifically, as illustrated inFIG. 12 , the specifyingunit 14 may have an integration ratio map M2 with respect to thepixel unit 11. The aberration information to be used for generating the integration ratio map M2 can be acquired in advance by simulation data or actual measurement data in the case of guiding the light L1 to the spectroscopicoptical system 4. In the case of using actual measurement data, aberration information can be acquired on the basis of spectroscopic spectrum data of a plurality of optical images on the premise that there is no local distortion. - The specifying
unit 14 may refer to the integration ratio map M2 and perform subpixel processing based on the integration ratio of the plurality ofpixels 21 adjacent in the row direction at the time of vertical binning of the number of photons.FIG. 12 illustrates an extraction of the integration ratio of a part of thepixels 21 corresponding to thespectroscopic spectrum image 31B and thespectroscopic spectrum image 31E in the integration ratio map M of theentire pixel unit 11. As described above, the distortion of thespectroscopic spectrum image 31E is larger than the distortion of thespectroscopic spectrum image 31B. Therefore, in the example ofFIG. 12 , in the vertical binning of thepixel 21 corresponding to thespectroscopic spectrum image 31B, subpixel processing based on the integration ratio of the twopixels 21 adjacent in the row direction is performed. In the vertical binning of thepixel 21 corresponding to thespectroscopic spectrum image 31E, subpixel processing based on the integration ratio of the threepixels 21 adjacent in the row direction is performed. - In the example of
FIG. 12 , the number of photons of thepixel 21 of coordinates (x,y) is P(x,y). Assuming that the reference of the x coordinate of thepixel 21 corresponding to thespectroscopic spectrum image 31B is 300 and the y coordinate is -512 to +512, vertical binning of thepixel 21 corresponding to thespectroscopic spectrum image 31B is expressed by the following Formula (4). Assuming that the reference of the x coordinate of thepixel 21 corresponding to thespectroscopic spectrum image 31E is 700 and the y coordinate is -512 to +512, vertical binning of thepixel 21 corresponding to thespectroscopic spectrum image 31E is expressed by the following Formula (5).
[Mathematical Formula 1]

- In
FIG. 12 , as a part of thepixel 21 corresponding to thespectroscopic spectrum image 31B, four pixels of coordinates (300,-500), coordinates (301,-500), coordinates (300,-501), and coordinates (301,-501) are illustrated. For these four pixels, the integration ratio of P(300,-500) is 80%, the integration ratio of P(301,-500) is 20%, the integration ratio of P(300,-501) is 90%, and the integration ratio of P(301,-501) is 10%. Therefore, in Formula (4), α(300,-500) is obtained by the following Formula (6), and α(300,-501) is obtained by the following Formula (7).

- Furthermore, in
FIG. 12 , nine pixels of coordinates (699,350), coordinates (700,350), coordinates (701,350), coordinates (699,349), coordinates (700,349), coordinates (701,349), coordinates (699,348), coordinates (700,348), and coordinates (701,348) are illustrated as a part of thepixel 21 corresponding to thespectroscopic spectrum image 31E. For these nine pixels, the integration ratio of P(699,350) is 15%, the integration ratio of P(700,350) is 70%, the integration ratio of P(701,350) is 15%, the integration ratio of P(699,349) is 20%, the integration ratio of P(700,349) is 70%, the integration ratio of P(701,349) is 10%, the integration ratio of P(699,348) is 25%, the integration ratio of P(700,348) is 70%, and the integration ratio of P(701,348) is 5%. - Therefore, in Formula (5), β(700,350) is obtained by the following Formula (8), and β(700,349) is obtained by the following Formula (9). Furthermore, β(700,348) is obtained by the following Formula (10).
β(700,350) = (15 × P(699,350) + 70 × P(700,350) + 15 × P(701,350)) β(700,349) = (20 × P(699,349) + 70 × P(700,349) + 10 × P(701,349)) β(700,348) = (25 × P(699,348) + 70 × P(700,348) + 5 × P(701,348)) -
FIG. 13 is a schematic graph showing spectroscopic spectrum data obtained by vertical binning using the integration ratio map. As shown inFIG. 13 , by integrating the number of photons of the plurality ofpixels 21 using the integration ratio based on the aberration information of the light L1, even when distortion occurs in thespectroscopic spectrum images 31A to 31E, a decrease in wavelength resolution in the row direction can be suppressed in each of spectroscopicspectrum data items 32A to 32E based on thespectroscopic spectrum images 31A to 31E. Furthermore, a decrease in peak value is also suppressed, and the SN ratio is also improved. - Note that, in the example of
FIG. 12 , only the integration ratio map M2 of thepixel unit 11 is illustrated, but the readout noise map M1 illustrated inFIG. 9 may be superimposed on the integration ratio map M2. Furthermore, area information illustrated inFIG. 9 may be further superimposed on the integration ratio map M2. In this case, thegeneration unit 13 excludes thepixel 21 specified by the readout noise map M1 and the area information from the pixels to be used for integration of the number of photons, and then performs vertical binning by subpixel processing using the integration ratio map M2. -
FIG. 14 is a flowchart illustrating a spectroscopic method according to an embodiment of the present disclosure. This spectroscopic method is a method of receiving light wavelength-resolved in a predetermined direction to acquire spectroscopic spectrum data of the light. The spectroscopic method according to the present embodiment is performed using thespectroscopic device 5 described above. As illustrated inFIG. 14 , this spectroscopic method includes a light receiving step (step S01), a converting step (step S02), a generating step (step S03), and an analyzing step (step S4). - In the light receiving step S01, the wavelength-resolved light L1 or the Raman scattered light Lr is received by the plurality of
pixels 21 arranged in the row direction along the wavelength resolution direction and in the column direction perpendicular to the row direction and converted into an electrical signal. In the converting step S02, the electrical signal from the plurality ofpixels 21 into a number of photons. In the present embodiment, the electrical signal is converted into a digital value by thefirst conversion unit 12A, and then the digital value is converted into the number of photons by the threshold data held by thesecond conversion unit 12B. - In the generating step S03, the number of photons of the plurality of
pixels 21 belonging to the same column are integrated to generate spectroscopic spectrum data based on an integration result. In the present embodiment, in the integration of the number of photons, thepixel 21 whose readout noise is equal to or less than the threshold is specified as thepixel 21 to be used for integration of the number of photons, and only thepixel 21 whose readout noise is equal to or less than the threshold is specified as thepixel 21 to be used for integration of the number of photons. - In the analyzing step S04, the sample S is analyzed on the basis of the spectroscopic spectrum data generated in the generating step S03. For example, the waveform, peak position, peak intensity, half-value width, and the like of the spectroscopic spectrum are analyzed to evaluate various physical properties such as the molecular structure, crystallinity, orientation, and distortion amount of the sample S.
- As described above, in the
spectroscopic device 5, an electrical signal output from eachpixel 21 is converted into the number of photons on the basis of light received by eachpixel 21 constituting thepixel unit 11. When the electrical signal is converted into the number of photons, for example, the number of photons of thepixel 21 that has not received light is zero. Therefore, when the number of photons of the plurality ofpixels 21 belonging to the same column is integrated after conversion into the number of photons, the influence of readout noise of eachpixel 21 can be sufficiently reduced. Therefore, in thespectroscopic device 5, the spectroscopic spectrum data can be acquired with an excellent SN ratio. - In the
spectroscopic device 5, the specifyingunit 14 specifying thepixel 21 to be used for integration of the number of photons among the plurality ofpixels 21 belonging to the same column is provided. By specifying thepixel 21 suitable for integration of the number of photons by the specifyingunit 14, the influence of the readout noise of eachpixel 21 can be more sufficiently reduced. By reducing the influence of the readout noise of eachpixel 21, the conversion accuracy from the electrical signal to the number of photons is enhanced, and the SN ratio of the spectroscopic spectrum data is further improved. - In the
spectroscopic device 5, the specifyingunit 14 specifies thepixel 21 whose readout noise is equal to or less than a threshold as thepixel 21 to be used for integration of the number of photons. Thereby, the influence of the readout noise of eachpixel 21 can be more sufficiently reduced. By reducing the influence of the readout noise of eachpixel 21, the conversion accuracy from the electrical signal to the number of photons is enhanced, and the SN ratio of the spectroscopic spectrum data is further improved. - In the
spectroscopic device 5, the threshold of the readout noise is set to 0.3 [e-rms]. Thereby, an erroneous conversion rate at the time of converting the electrical signal into the number of photons can be suppressed to 10% or less. - In the
spectroscopic device 5, the specifyingunit 14 specifies the pixel to be used for integration of the number of photons such that the number ofpixels 21 to be used for integration of the number of photons is the same in each column. Thereby, it is possible to align integrated values of the readout noise of thepixels 21 of each column to be used for integration of the number of photons in the row direction. Therefore, the SN ratio of the spectroscopic spectrum data can be stably improved. - In the
spectroscopic device 5, the specifyingunit 14 specifies thepixel 21 to be used for integration of the number of photons and an integration ratio of thepixels 21 on the basis of aberration information of the light in the spectroscopicoptical system 4, and thegeneration unit 13 integrates the number of photons of the plurality ofpixels 21 by using the integration ratio. According to such a configuration, even when distortion due to aberration occurs in the image of the wavelength-resolved light L1, the number of photons of the plurality ofpixels 21 can be suitably integrated. - In the
spectroscopic device 5, the specifyingunit 14 holds in advance area information indicating an area where there is no input of the light in thepixel unit 11, and excludes thepixel 21 belonging to the area R indicating the area information from the integration of the number of photons. Thereby, since pixels not requiring integration of the number of photons can be excluded, the influence of the readout noise of eachpixel 21 can be further reduced. - In the
spectroscopic device 5, theconversion unit 12 includes thefirst conversion unit 12A converting the electrical signal into a digital value and thesecond conversion unit 12B converting the digital value into the number of photons on the basis of reference data held in advance. Thereby, the number of photons of eachpixel 21 can be acquired in a state where the influence of variations in the gain and offset of eachpixel 21 is suppressed. - In the Raman
spectroscopic measurement device 1 configured by incorporating thespectroscopic device 5 described above, an electrical signal output from eachpixel 21 is converted into the number of photons on the basis of the Raman scattered light Lr received by eachpixel 21 constituting thepixel unit 11. When the electrical signal is converted into the number of photons, for example, the number of photons of thepixel 21 that has not received the Raman scattered light Lr is zero. Therefore, when the number of photons of the plurality ofpixels 21 belonging to the same column is integrated after conversion into the number of photons, the influence of readout noise of eachpixel 21 can be sufficiently reduced. Therefore, in the Ramanspectroscopic measurement device 1, spectroscopic spectrum data of the Raman scattered light Lr can be acquired with an excellent SN ratio. - Note that, the
spectroscopic device 5 is not limited to be applied to the Ramanspectroscopic measurement device 1, and may be applied to other spectroscopic measurement devices such as a fluorescence spectroscopic measurement device, a plasma spectroscopic measurement device, and an emission spectroscopic measurement device. Furthermore, thespectroscopic device 5 may be applied to other spectroscopic measurement devices such as a film thickness measurement device, optical density measurement, laser-induced breakdown spectroscopy (LIBS) measurement, and differential optical absorption spectroscopy (DOAS) measurement. -
- 1
- Raman spectroscopic measurement device
- 2
- light source unit
- 3
- light guiding optical system
- 4
- spectroscopic optical system
- 5
- spectroscopic device
- 8
- analysis unit
- 11
- pixel unit
- 12
- conversion unit
- 12A
- first conversion unit
- 12B
- second conversion unit
- 13
- generation unit
- 14
- specifying unit
- 21
- pixel
- L1
- light
- Lr
- Raman scattered light
Claims (12)
- A spectroscopic device receiving light wavelength-resolved in a predetermined direction by a spectroscopic optical system including a spectroscopic element to output spectroscopic spectrum data of the light, the spectroscopic device comprising:a pixel unit including a plurality of pixels receiving the wavelength-resolved light to convert the light into an electrical signal, and the plurality of pixels being arranged in a row direction along a wavelength resolution direction and in a column direction perpendicular to the row direction;a conversion unit converting the electrical signal from the plurality of pixels into a number of photons; anda generation unit integrating the number of photons of a plurality of pixels belonging to the same column to generate spectroscopic spectrum data based on an integration result.
- The spectroscopic device according to claim 1, further comprising a specifying unit specifying a pixel to be used for integration of the number of photons among the plurality of pixels belonging to the same column.
- The spectroscopic device according to claim 2, wherein the specifying unit specifies a pixel whose readout noise is equal to or less than a threshold as the pixel to be used for integration of the number of photons.
- The spectroscopic device according to claim 3, wherein the threshold of the readout noise is set to 0.3 [e-rms].
- The spectroscopic device according to any one of claims 2 to 4, wherein the specifying unit specifies the pixel to be used for integration of the number of photons such that the number of pixels to be used for integration of the number of photons is the same in each column.
- The spectroscopic device according to any one of claims 2 to 4, wherein the specifying unit specifies the pixel to be used for integration of the number of photons and an integration ratio of the pixels on the basis of aberration information of the light in the spectroscopic optical system, and the generation unit integrates the number of photons of the plurality of pixels by using the integration ratio.
- The spectroscopic device according to any one of claims 2 to 4, wherein the specifying unit holds in advance area information indicating an area where there is no input of the light in the pixel unit, and excludes a pixel corresponding to the area information from the integration of the number of photons.
- The spectroscopic device according to any one of claims 1 to 4, wherein the conversion unit includes a first conversion unit converting the electrical signal into a digital value and a second conversion unit converting the digital value into a number of photons on the basis of reference data held in advance.
- The spectroscopic device according to any one of claims 1 to 4, further comprising an analysis unit analyzing the spectroscopic spectrum data.
- The spectroscopic device according to any one of claims 1 to 4, further comprising a spectroscopic optical system including a spectroscopic element dispersing the light in the wavelength resolution direction.
- A Raman spectroscopic measurement device comprising:the spectroscopic device according to any one of claims 1 to 4;a light source unit generating light with which a sample is irradiated; anda light guiding optical system guiding Raman scattered light generated by irradiating the sample with the light to the spectroscopic device.
- A spectroscopic method of receiving light wavelength-resolved in a predetermined direction to acquire spectroscopic spectrum data of the light, the spectroscopic method comprising:a light receiving step of receiving the wavelength-resolved light by a plurality of pixels arranged in a row direction along a wavelength resolution direction and in a column direction perpendicular to the row direction to convert the light into an electrical signal;a converting step of converting the electrical signal from the plurality of pixels into a number of photons; anda generating step of integrating the number of photons of a plurality of pixels belonging to the same column to generate spectroscopic spectrum data based on an integration result.
Applications Claiming Priority (2)
| Application Number | Priority Date | Filing Date | Title |
|---|---|---|---|
| JP2022086928 | 2022-05-27 | ||
| PCT/JP2022/046722 WO2023228449A1 (en) | 2022-05-27 | 2022-12-19 | Spectroscopy device, raman spectroscopic measurement device, and spectroscopy method |
Publications (2)
| Publication Number | Publication Date |
|---|---|
| EP4534963A1 true EP4534963A1 (en) | 2025-04-09 |
| EP4534963A4 EP4534963A4 (en) | 2026-07-15 |
Family
ID=88918863
Family Applications (1)
| Application Number | Title | Priority Date | Filing Date |
|---|---|---|---|
| EP22943848.6A Pending EP4534963A4 (en) | 2022-05-27 | 2022-12-19 | SPECTROSCOPY DEVICE, RAMANSPECTROSCOPY MEASURING DEVICE AND SPECTROSCOPY METHOD |
Country Status (7)
| Country | Link |
|---|---|
| US (1) | US20250258039A1 (en) |
| EP (1) | EP4534963A4 (en) |
| JP (1) | JP7886408B2 (en) |
| KR (1) | KR20250016065A (en) |
| CN (1) | CN119278360A (en) |
| TW (1) | TW202346833A (en) |
| WO (1) | WO2023228449A1 (en) |
Family Cites Families (9)
| Publication number | Priority date | Publication date | Assignee | Title |
|---|---|---|---|---|
| US6486948B1 (en) * | 1999-09-14 | 2002-11-26 | Haishan Zeng | Apparatus and methods relating to high speed Raman spectroscopy |
| CA2664133C (en) * | 2006-08-22 | 2012-10-23 | Bayer Healthcare Llc | A method for correcting a spectral image for optical aberrations using software |
| US8982206B2 (en) * | 2011-04-07 | 2015-03-17 | Uwm Research Foundation, Inc. | High speed microscope with narrow detector and pixel binning |
| US9546904B2 (en) * | 2013-03-15 | 2017-01-17 | P & P Optica Inc. | Apparatus and method for optimizing data capture and data correction for spectroscopic analysis |
| CN107003183B (en) * | 2014-12-02 | 2018-11-16 | 浜松光子学株式会社 | Spectroscopic measurement device and spectroscopic measurement method |
| JP5901814B1 (en) | 2015-03-25 | 2016-04-13 | 日本分光株式会社 | Microspectroscope |
| LU93350B1 (en) * | 2016-12-12 | 2018-07-03 | Phoenix Contact Gmbh & Co Kg Intellectual Property Licenses & Standards | Method for monitoring an electromechanical component of an automation system |
| CN114866717B (en) * | 2017-11-24 | 2025-06-03 | 浜松光子学株式会社 | Photon counting device, photon counting method and program |
| KR102655740B1 (en) * | 2018-06-20 | 2024-04-05 | 삼성전자주식회사 | Apparatus and method for correcting spectral image and, apparatus and method for analyzing substances of object |
-
2022
- 2022-12-19 EP EP22943848.6A patent/EP4534963A4/en active Pending
- 2022-12-19 CN CN202280096488.5A patent/CN119278360A/en active Pending
- 2022-12-19 WO PCT/JP2022/046722 patent/WO2023228449A1/en not_active Ceased
- 2022-12-19 JP JP2024522896A patent/JP7886408B2/en active Active
- 2022-12-19 KR KR1020247027888A patent/KR20250016065A/en active Pending
- 2022-12-19 US US18/855,076 patent/US20250258039A1/en active Pending
-
2023
- 2023-02-16 TW TW112105481A patent/TW202346833A/en unknown
Also Published As
| Publication number | Publication date |
|---|---|
| KR20250016065A (en) | 2025-02-03 |
| WO2023228449A1 (en) | 2023-11-30 |
| JP7886408B2 (en) | 2026-07-07 |
| JPWO2023228449A1 (en) | 2023-11-30 |
| CN119278360A (en) | 2025-01-07 |
| EP4534963A4 (en) | 2026-07-15 |
| TW202346833A (en) | 2023-12-01 |
| US20250258039A1 (en) | 2025-08-14 |
Similar Documents
| Publication | Publication Date | Title |
|---|---|---|
| US20240077360A1 (en) | Spectrometric device and spectrometric method | |
| US10209375B2 (en) | X-ray data processing apparatus, X-ray data processing method, and X-ray data processing program | |
| EP3716612A1 (en) | Photon counting device and photon counting method | |
| CN102435315A (en) | Photon counting full-spectrum direct-reading Raman spectrometer | |
| EP3564651A1 (en) | Multi-resolution spectrometer | |
| US20250258039A1 (en) | Spectroscopy device, raman spectroscopic measurement device, and spectroscopy method | |
| US12513432B2 (en) | Photon counting device, photon counting method, and photon counting processing program | |
| CN102507464A (en) | Photon counting full-spectrum direct reading absorption spectrometer | |
| US12574662B2 (en) | Threshold value determination method, threshold value determination program, threshold value determination device, photon number identification system, photon number identification method, and photon number identification processing program | |
| US20250341469A1 (en) | Spectroscopic device, raman spectroscopic measurement device, and spectroscopic method | |
| EP4422199A1 (en) | Photon count identification system, photon count identification method, and photon count identification processing program | |
| US20250189453A1 (en) | Spectroscopic device, raman spectroscopic measurement device, and spectroscopic method | |
| JP2012122882A (en) | Light detection device and observation device | |
| US20250216306A1 (en) | Apparatus for detecting chemicals in a sample | |
| EP4358533A1 (en) | Estimation method, estimation program, and estimation device | |
| KR20260040000A (en) | Photodetection device, film thickness measurement device, semiconductor process monitoring device, and noise detection method | |
| KR20260048546A (en) | Photodetection device, film thickness measurement device, semiconductor process monitoring device, and noise detection method |
Legal Events
| Date | Code | Title | Description |
|---|---|---|---|
| STAA | Information on the status of an ep patent application or granted ep patent |
Free format text: STATUS: THE INTERNATIONAL PUBLICATION HAS BEEN MADE |
|
| PUAI | Public reference made under article 153(3) epc to a published international application that has entered the european phase |
Free format text: ORIGINAL CODE: 0009012 |
|
| STAA | Information on the status of an ep patent application or granted ep patent |
Free format text: STATUS: REQUEST FOR EXAMINATION WAS MADE |
|
| 17P | Request for examination filed |
Effective date: 20240826 |
|
| AK | Designated contracting states |
Kind code of ref document: A1 Designated state(s): AL AT BE BG CH CY CZ DE DK EE ES FI FR GB GR HR HU IE IS IT LI LT LU LV MC ME MK MT NL NO PL PT RO RS SE SI SK SM TR |
|
| DAV | Request for validation of the european patent (deleted) | ||
| DAX | Request for extension of the european patent (deleted) | ||
| A4 | Supplementary search report drawn up and despatched |
Effective date: 20260612 |
|
| RIC1 | Information provided on ipc code assigned before grant |
Ipc: G01J 3/36 20060101AFI20260611BHEP Ipc: G01J 3/44 20060101ALI20260611BHEP Ipc: G01J 3/28 20060101ALI20260611BHEP Ipc: G01N 21/65 20060101ALI20260611BHEP Ipc: H04N 25/00 20230101ALI20260611BHEP Ipc: H04N 25/70 20230101ALI20260611BHEP Ipc: H04N 25/76 20230101ALI20260611BHEP Ipc: H04N 25/46 20230101ALI20260611BHEP Ipc: H04N 25/17 20230101ALI20260611BHEP Ipc: H04N 25/13 20230101ALI20260611BHEP |