EP4528634A1 - Method of bioimage analysis for the detection of color abnormalities through color distribution assessment - Google Patents
Method of bioimage analysis for the detection of color abnormalities through color distribution assessment Download PDFInfo
- Publication number
- EP4528634A1 EP4528634A1 EP23198720.7A EP23198720A EP4528634A1 EP 4528634 A1 EP4528634 A1 EP 4528634A1 EP 23198720 A EP23198720 A EP 23198720A EP 4528634 A1 EP4528634 A1 EP 4528634A1
- Authority
- EP
- European Patent Office
- Prior art keywords
- contour
- aoi
- melanoma
- image
- area
- Prior art date
- Legal status (The legal status is an assumption and is not a legal conclusion. Google has not performed a legal analysis and makes no representation as to the accuracy of the status listed.)
- Granted
Links
Images





Classifications
-
- G—PHYSICS
- G06—COMPUTING OR CALCULATING; COUNTING
- G06T—IMAGE DATA PROCESSING OR GENERATION, IN GENERAL
- G06T7/00—Image analysis
- G06T7/0002—Inspection of images, e.g. flaw detection
- G06T7/0012—Biomedical image inspection
-
- A—HUMAN NECESSITIES
- A61—MEDICAL OR VETERINARY SCIENCE; HYGIENE
- A61B—DIAGNOSIS; SURGERY; IDENTIFICATION
- A61B5/00—Measuring for diagnostic purposes; Identification of persons
- A61B5/44—Detecting, measuring or recording for evaluating the integumentary system, e.g. skin, hair or nails
- A61B5/441—Skin evaluation, e.g. for skin disorder diagnosis
- A61B5/444—Evaluating skin marks, e.g. mole, nevi, tumour, scar
-
- G—PHYSICS
- G06—COMPUTING OR CALCULATING; COUNTING
- G06T—IMAGE DATA PROCESSING OR GENERATION, IN GENERAL
- G06T7/00—Image analysis
- G06T7/90—Determination of colour characteristics
-
- G—PHYSICS
- G06—COMPUTING OR CALCULATING; COUNTING
- G06V—IMAGE OR VIDEO RECOGNITION OR UNDERSTANDING
- G06V10/00—Arrangements for image or video recognition or understanding
- G06V10/20—Image preprocessing
- G06V10/25—Determination of region of interest [ROI] or a volume of interest [VOI]
-
- G—PHYSICS
- G06—COMPUTING OR CALCULATING; COUNTING
- G06V—IMAGE OR VIDEO RECOGNITION OR UNDERSTANDING
- G06V20/00—Scenes; Scene-specific elements
- G06V20/60—Type of objects
- G06V20/69—Microscopic objects, e.g. biological cells or cellular parts
- G06V20/698—Matching; Classification
-
- A—HUMAN NECESSITIES
- A61—MEDICAL OR VETERINARY SCIENCE; HYGIENE
- A61B—DIAGNOSIS; SURGERY; IDENTIFICATION
- A61B5/00—Measuring for diagnostic purposes; Identification of persons
- A61B5/68—Arrangements of detecting, measuring or recording means, e.g. sensors, in relation to patient
- A61B5/6887—Arrangements of detecting, measuring or recording means, e.g. sensors, in relation to patient mounted on external non-worn devices, e.g. non-medical devices
- A61B5/6898—Portable consumer electronic devices, e.g. music players, telephones, tablet computers
-
- G—PHYSICS
- G06—COMPUTING OR CALCULATING; COUNTING
- G06T—IMAGE DATA PROCESSING OR GENERATION, IN GENERAL
- G06T2207/00—Indexing scheme for image analysis or image enhancement
- G06T2207/30—Subject of image; Context of image processing
- G06T2207/30004—Biomedical image processing
- G06T2207/30088—Skin; Dermal
-
- G—PHYSICS
- G06—COMPUTING OR CALCULATING; COUNTING
- G06T—IMAGE DATA PROCESSING OR GENERATION, IN GENERAL
- G06T2207/00—Indexing scheme for image analysis or image enhancement
- G06T2207/30—Subject of image; Context of image processing
- G06T2207/30004—Biomedical image processing
- G06T2207/30096—Tumor; Lesion
Definitions
- Melanoma is an aggressive form of skin cancer with rapidly rising incidence. In the early stages, melanoma can be treated successfully with surgery alone and survival rates are high, but after metastasis survival rates drop significantly. Therefore, early and correct diagnosis is important for ensuring patients have the best possible prognosis.
- Melanoma misdiagnosis accounts for more pathology and dermatology malpractice claims than any cancer other than breast cancer, as malignant melanoma can disguise clinically as benign lesions (false negatives), and benign pigmented lesions can clinically simulate malignant melanoma (false positives), thus there is a clear need for tools that aid clinicians and improve workflow.
- Image analysis can be defined as the combination of computational techniques for the automatic processing of carefully captured images to produce datasets of measurements and extract useful information.
- the images themselves can come from a variety of sources, from digital cameras or smartphones to more advanced sensors integrated into sophisticated instruments.
- Image analysis has already been proposed to be useful for extracting biologically relevant information in applications such as detection of plant diseases, determination of food quality and safety, diagnosis of skin cancer and many more.
- the purpose of analyzing images is to spot abnormalities that can be attributed to a biological phenomenon when compared to a known (normal) condition.
- Bioimage analysis can be achieved with excellent outcomes by employing dedicated instrumentation with specific camera sensor features.
- building dedicated instrumentation is considered outdated and in addition cannot satisfy the need for rapid, simple, and inexpensive point-of need diagnostics or self-testing.
- Smartphone applications performing bioimage analysis for diagnostic purposes lack in accuracy because of a) differences in smartphone cameras specifications, b) variation in lighting conditions during image capturing and c) photos that are taken by non-experts.
- the deep-learning technology known as the Al method
- Al bioimage analysis requires high quality photos that are pre-processed manually, which can be time-consuming and can vary, depending on the skill of the person.
- prior art bioimage analysis is challenged by insufficient training data, interpretability, and requirements for high computational power.
- prior art methods of diagnostic bioimage analysis based on the detection of color abnormalities do not provide suitable metrics for the quantitative assessment of the likelihood that a skin lesion is melanoma.
- the invention described herein provides a method according to claim 1 that solves the problems of the prior art.
- the present invention provides a computer implemented method of detecting melanoma in a digital skin image, comprising the following steps:
- the method described herein facilitates the detection of color abnormalities during bioimage analysis to characterize a particular skin condition as "normal” or “not normal” when compared to a known physiological state, and specifically for the discrimination of malignant melanoma from benign nevi.
- the method can also be adapted for use in a range of medical, biological, or other applications such as the detection of plant diseases or food quality deterioration. It is not based on Al and does not depend on the camera sensor specifications and the lighting conditions during picture capturing. It can also be integrated into smartphone applications for usage by non-expert individuals and with low computation power.
- the method assesses the color distribution in a particular image area of interest by employing a series of mathematical calculations that must be performed in a particular order. These calculations result in the identification of color contours and the relative distances among them within the area of interest.
- the advantage for the disclosed method compared to prior art image analysis methods is that it provides a quantitative method for assessing the likelihood that a particular skin lesion is a melanoma or a benign nevus. As will be shown in the attached Examples, the method of the present invention discriminates malignant melanoma with high accuracy that reaches or exceeds 93%, which is greater than the accuracy normally achieved by the trained eye of a medical expert which rarely exceeds 70%.
- the invention also provides an apparatus for detecting a melanoma in a digital image of a skin tissue, the apparatus comprising a camera adapted to obtain said image, a processor adapted to process the image data according to the method disclosed herein, and an output device adapted to indicate a likelihood of the presence or absence of a melanoma.
- Also provided is a computer program comprising instructions which, when the program is executed by a computer, cause the computer to carry out the method disclosed herein.
- the present disclosure provides a computer implemented image analysis method for diagnosing melanoma in a digital skin image. It also provides an apparatus for detecting a melanoma in a digital image of a tissue as well as a computer program for implementing said method.
- the method refers to the assessment of color distribution in an image which can be used to characterize a particular skin condition as "normal” or “not normal” when compared to a known physiological state.
- the image can be taken by a digital camera, a smartphone camera, or any other kind of sensing elements integrated into an instrument.
- the abnormal or non-physiological state is a condition that does not appear naturally but instead it can be attributed to a biological phenomenon such as the growth of cancer cells.
- the invention discloses an iterative process for quantitatively analyzing a digital image of a melanotic and non-melanotic skin lesion for the detection of color distribution abnormalities. Specifically, the inventors have found that if the number of contours classified as having abnormal color distribution increases during said process, this is an indication of the presence of a melanoma. A steady or decreasing number of contours classified as having abnormal color distribution corresponds to a benign skin condition such as a nevus.
- step 101 the area of interest (AOI) which corresponds to the part of the image that is checked for color abnormalities is first defined using an image segmentation algorithm. The AOI is thereby separated from the outside area (OA). This step is important for color normalization purposes.
- the AOI and the OA are converted into grayscale.
- step 102 the mean color intensity value and the standard deviation for the AOI and for the area outside the AOI are calculated. This step results in the calculation of a risk threshold as a function of the mean and standard deviation. The risk threshold is used in step 107 to determine whether each of the contours identified has normal or abnormal color distribution.
- the method then calculates the geometric center of the AOI. Since the shape of interest is only one, the centroid and the mass center are identical. In a preferred embodiment, the method also calculates the symmetry of the AOI. If the AOI is asymmetrical, this is an indication of a malignant lesion. In another preferred embodiment, the noise at the borders of the AOI and specifically the peaks around the borders are measured. This is achieved, first by measuring the distance of each pixel at the border of the area of interest and subsequently calculating the points that intersect the mean value and the distance. An anomalous border of the AOI is an indication of a melanoma. In a more preferred embodiment, the method calculates both the symmetry of the AOI and the noise at the borders of the AOI.
- step 104 the color of the AOI is divided into contours.
- a threshold value is applied to the image and said intensity threshold value creates one or more contours.
- threshold values start from the first intensity level that the global threshold detects.
- step 105 if more than one contours are identified in the previous step, the euclidean distance of the mass center of each contour identified is calculated and in step 106, for each contour identified a ratio is calculated of the average plus the standard deviation of all the measured distances divided by each contour distance.
- step 107 the resulting ratio is compared to the risk threshold calculated in step 102, whereby each identified contour is classified as having normal or abnormal color distribution.
- the method additionally comprise a subsequent step wherein, if a sub-contour is detected inside a contour, the average color intensity of an area around the center of the sub-contour and the average color intensity of an area around the center of the corresponding main contour are measured to determine if the intensity of the sub-contour is significantly different from that of the corresponding main contour.
- the area around the center of the sub-contour and the corresponding main contour whose average color intensity is measured should extend from 5 or more pixels towards all directions. More preferably, the area around the center of the sub-contour and the corresponding main contour whose average color intensity is measured should extend from 5 to 15 pixels towards all directions.
- a sub-contour whose intensity is significantly different from that of the main contour is classified as having abnormal color distribution.
- Steps 104, 105, 106 and 107 are repeated until the size of a contour covers the AOI. During each repetition of step 104, a different threshold value is applied, by increasing the value so that each time the contour covers a larger area.
- step 108 the number of contours (and optionally sub-contours) having abnormal color distribution identified during each repetition is calculated. As will be shown in the Examples, the presence of multiple contours having abnormal color distribution whose numbers are increasing during the process highly correlates with the presence of a melanoma.
- the method disclosed herein is used to determine the possibility that a skin lesion is a melanoma.
- a method is needed to allow individuals who may be concerned that they have melanoma to obtain a rapid, preliminary screening using a computer-based image analysis and pattern recognition tool that is easily accessible, for instance via the Internet, and which can utilize readily-available imaging techniques such as a smartphone camera or convention digital camera.
- the present invention expands the methods disclosed in the prior art to provide such a capability.
- Figure 2 is a flow diagram illustrating a preferred embodiment of the computer implemented method 200 of detecting a melanoma in a digital image of a tissue.
- the method 200 is exemplary. In use, the method 200 may include additional steps, omit some steps, and/or perform certain steps in different order.
- the method 200 is presented as an overview. Many of the specifics of performing the various steps of the method 200 are described in detail herein.
- a skin image such as a dermoscopic image or an image taken by a smartphone camera, examined for the presence of lesions, is divided into two parts, the one part is the AOI, and the second part is the OA (outside area).
- the area of interest gets unified as one and masked from the outside part (masked image). Subsequently, the two areas are converted into grayscale.
- step 202 two vectors are generated, one that corresponds to OA and the other to the AOI.
- the mean color intensity and standard deviation of both areas is then calculated, preferably by random picking from 60% to 70% of the corresponding vector.
- a risk threshold is then calculated as a function of the mean and standard deviation calculated during this step. When the standard deviation is high, there is high probability of unwanted noise, such as blurry image, presence of hair, freckles etc.). Subsequently, the geometric center, or centroid, of the AOI and the OA is calculated as a function of pixel intensity.
- step 203 the symmetry of the AOI is calculated.
- an ellipse is fitted on the masked area. If the area is symmetrical, then the area of the ellipse and the masked area should converge at about 90% or higher, preferably at 90% plus or minus 2% or higher. If the AOI is asymmetrical, it is assigned a risk value indicating an increased probability of the presence of a malignant lesion.
- step 204 the noise at the borders of the AOI and specifically the peaks around the borders are measured. This is achieved, first by measuring the distance of each pixel at the border of the area of interest and subsequently calculating the points that intersect the mean value and the distance. If are more than 5 intersected points are calculated, the AOI has anomalous borders and it is assigned a risk value indicating an increased possibility of the presence of a lesion.
- step 206 the color of the AOI is divided into contours, preferably by using binary (global) thresholding.
- a threshold value is applied to the grayscale image and this grayscale intensity threshold value creates one or more contours. Threshold values start from the first intensity level that the global threshold detects.
- step 207 if more than one contours are identified in the previous step, the euclidean distance of the mass center of each contour identified is calculated and in step 208, for each contour identified, a ratio is calculated of the average plus the standard deviation of all the measured distances divided by each contour distance. In step 209, the resulting ratio is compared to the risk threshold calculated in step 202, whereby each identified contour is classified as having normal or abnormal color distribution.
- step 210 if a sub-contour is detected inside a contour, the average color intensity of an area around the center of the sub-contour and the average color intensity of an area around the center of the corresponding main contour are measured to determine if the intensity of the sub-contour is significantly different from that of the corresponding main contour.
- the area around the center of the sub-contour and the corresponding main contour whose average color intensity is measured should extend from 5 or more pixels towards all directions. More preferably, the area around the center of the sub-contour and the corresponding main contour whose average color intensity is measured should extend from 5 to 15 pixels towards all directions.
- a sub-contour whose intensity is significantly different from that of the main contour is classified as having abnormal color distribution.
- the average color intensity of the sub-contour is considered as significantly different from that of the corresponding main contour if it corresponds to a different basic color to that of the corresponding main contour.
- the average color intensity of the sub-contour is considered as significantly different from that of the corresponding main contour if it corresponds to a different basic color in the grayscale range. For instance, if the difference of the mean values of the two areas (sub-contour and contour) is higher than 30 the average color intensity of the sub-contour is considered as significantly different from that of the corresponding main contour. The value of 30 emerges considering that there are 8 basic colors (white, black plus the six basic colors produced by the three main colors).
- the grayscale values extend from 0 to 255, so 255 divided by 8 equals 31.2, such that the white shades correspond to values of 0 to 30, yellow shades correspond to values of 30 - 60 etc. If the average color intensity of the sub-contour and contour is, for example, 150 and 100 respectively, they belong to different "packs" of color shades.
- steps 206, 207, 208, 209 and 210 are repeated until the size of a contour covers the AOI.
- steps 206, 207, 208, 209 and 210 are repeated until the size of a contour reaches the 75% to 80% percent of the lesion area (AOI).
- the 75% to 80% values correspond to the optimum percentage as it covers the maximum AOI excluding the unwanted information at the borders, such as shadows and dark spots, which might be caused by imperfect segmentation.
- the range of the threshold levels depends on the object that is depicted in the image, and for that reason it is not always the same.
- a different threshold value is applied, by increasing the value so that the contour increasingly covers a larger area.
- the intensity threshold value applied during each repetition of step 206 increases by a value of one.
- the evaluation outcome of the above steps is used to determine whether the color distribution indicates the existence of melanoma. More specifically, in Figure 3 , the difference between the distribution of contours with abnormal color distribution during the iterations of the described process, detected in melanotic and non-melanotic lesions is presented. As the algorithm proceeds from one repetition to the other and detects the contours, the ones classified as having abnormal color distribution ("risky contours") are plotted against the number of repetitions taking place each time throughout the process. In case of a melanoma, an increasing curve is created as the number of repetitions increases, indicating the abnormal color distribution observed in such lesions ( Figure 3A ).
- a risk value may be calculated in order to provide a quantitative assessment of the growth rate at which the number of contours with abnormal color distribution increases during the iterative process. Said risk value increases every time a contour or sub-contour is classified as having abnormal color distribution. For instance, one unit is added to the risk value every time a contour or sub-contour is classified as having abnormal color distribution.
- a cumulative risk value is subsequently calculated (step 211) at the end of the iterative process, which provides a quantitative assessment of the probability of the presence of a melanotic lesion.
- the symmetry of the AOI and/or the noise at the borders of the AOI are also taken into consideration when calculating the cumulative risk value.
- two units may be extracted from the cumulative risk value if the AOI is both symmetrical and with smooth borders; two units may be added to the cumulative risk value if the AOI is asymmetrical and has anomalous borders; one unit may be extracted from the cumulative risk value if the AOI is asymmetrical with smooth borders or symmetrical with anomalous borders.
- a cumulative risk value is calculated in step 211
- the ratio of the cumulative risk value divided by the total number of repetitions is compared to a classification threshold in step 212.
- the inventors have analyzed a large number of medical images from melanoma and non-melanoma cases (Example 1) and have concluded that the classification threshold R c ranges from 0.18 to 0.25, (0.18, 0.25). The exact value depends on the image, i.e., whether it is a dermoscopic image or a smartphone image. The person skilled in the art looking to determine the exact value of the classification threshold R c for the particular images used, would use a few known samples (melanotic and non-melanotic) to calibrate the algorithm, as explained in Example 1.
- the lesion is non-melanotic, whereas if the ratio is higher than the R c , the lesion is melanotic.
- the method disclosed herein was used to analyze 44 medical images containing 15 known melanoma and 29 non-melanoma (nevi) cases ( Figure 4 ). The images are randomly picked to avoid bias in the results. The methodological steps were incorporated into a computer algorithm which analyzed every image independently.
- R c For the calculation of R c , the data were split to a training set (80%) and a test set (20%).
- the inventors analyzed 600 digital images of skin lesions in order to determine whether the lesion is a melanoma or nevus.
- the methodological steps were incorporated into a computer algorithm which analyzed every image independently.
- the classification threshold R c was set at 0.232.
Landscapes
- Engineering & Computer Science (AREA)
- Health & Medical Sciences (AREA)
- Physics & Mathematics (AREA)
- Life Sciences & Earth Sciences (AREA)
- General Physics & Mathematics (AREA)
- Theoretical Computer Science (AREA)
- General Health & Medical Sciences (AREA)
- Biomedical Technology (AREA)
- Molecular Biology (AREA)
- Multimedia (AREA)
- Computer Vision & Pattern Recognition (AREA)
- Medical Informatics (AREA)
- Pathology (AREA)
- Heart & Thoracic Surgery (AREA)
- Biophysics (AREA)
- Surgery (AREA)
- Animal Behavior & Ethology (AREA)
- Public Health (AREA)
- Veterinary Medicine (AREA)
- Dermatology (AREA)
- Nuclear Medicine, Radiotherapy & Molecular Imaging (AREA)
- Radiology & Medical Imaging (AREA)
- Quality & Reliability (AREA)
- Measuring And Recording Apparatus For Diagnosis (AREA)
Abstract
Description
- The present invention relates to biomedical image analysis methods for the detection of a lesion, and specifically for the detection of melanomas, in a digital image of a tissue. It also relates to apparatuses adapted to perform said methods as well as computer programs for use in said methods.
- Melanoma is an aggressive form of skin cancer with rapidly rising incidence. In the early stages, melanoma can be treated successfully with surgery alone and survival rates are high, but after metastasis survival rates drop significantly. Therefore, early and correct diagnosis is important for ensuring patients have the best possible prognosis. Melanoma misdiagnosis accounts for more pathology and dermatology malpractice claims than any cancer other than breast cancer, as malignant melanoma can disguise clinically as benign lesions (false negatives), and benign pigmented lesions can clinically simulate malignant melanoma (false positives), thus there is a clear need for tools that aid clinicians and improve workflow.
- Digital microscopy has become an essential tool in pathological research over the past few decades. The generation of digital images of histological tissue has allowed the creation and application of image analysis algorithms. Image analysis can be defined as the combination of computational techniques for the automatic processing of carefully captured images to produce datasets of measurements and extract useful information. The images themselves can come from a variety of sources, from digital cameras or smartphones to more advanced sensors integrated into sophisticated instruments. Image analysis has already been proposed to be useful for extracting biologically relevant information in applications such as detection of plant diseases, determination of food quality and safety, diagnosis of skin cancer and many more. In all such cases, the purpose of analyzing images (bioimage analysis) is to spot abnormalities that can be attributed to a biological phenomenon when compared to a known (normal) condition.
- Bioimage analysis can be achieved with excellent outcomes by employing dedicated instrumentation with specific camera sensor features. However, in the current era of smartphone diagnostics, building dedicated instrumentation is considered outdated and in addition cannot satisfy the need for rapid, simple, and inexpensive point-of need diagnostics or self-testing. Smartphone applications performing bioimage analysis for diagnostic purposes lack in accuracy because of a) differences in smartphone cameras specifications, b) variation in lighting conditions during image capturing and c) photos that are taken by non-experts. As an alternative, the deep-learning technology, known as the Al method, has become a new trend since it is not affected by the aforementioned problems. However, Al bioimage analysis requires high quality photos that are pre-processed manually, which can be time-consuming and can vary, depending on the skill of the person. In addition, prior art bioimage analysis is challenged by insufficient training data, interpretability, and requirements for high computational power. Most importantly, prior art methods of diagnostic bioimage analysis based on the detection of color abnormalities do not provide suitable metrics for the quantitative assessment of the likelihood that a skin lesion is melanoma.
- Therefore, the need remains for image analysis methods that provide an easy to implement, highly accurate procedure for the discrimination of malignant melanoma from benign skin lesions.
- The invention described herein provides a method according to
claim 1 that solves the problems of the prior art. Specifically, the present invention provides a computer implemented method of detecting melanoma in a digital skin image, comprising the following steps: - a) determining the area of interest (AOI) in the digital image through an image segmentation algorithm;
- b) calculating the mean value and the standard deviation for the AOI and for the area outside the AOI to extract a risk threshold;
- c) calculating the geometric center of the AOI, whereby the initial centroid is defined;
- d) dividing the color of the AOI into contours;
- e) if multiple contours are identified in step (d), calculating the euclidean distance of the mass center of each contour identified;
- f) calculating the ratio of the average plus the standard deviation of all the measured distances divided by each contour distance;
- g) comparing said ratio with the risk threshold extracted in step (b) whereby said contour is classified as having normal or abnormal color distribution; and
- h) repeating steps (d) to (g) by applying multiple threshold values to the image, until the size of a contour covers the AOI;
- The method described herein facilitates the detection of color abnormalities during bioimage analysis to characterize a particular skin condition as "normal" or "not normal" when compared to a known physiological state, and specifically for the discrimination of malignant melanoma from benign nevi. The method can also be adapted for use in a range of medical, biological, or other applications such as the detection of plant diseases or food quality deterioration. It is not based on Al and does not depend on the camera sensor specifications and the lighting conditions during picture capturing. It can also be integrated into smartphone applications for usage by non-expert individuals and with low computation power.
- The method assesses the color distribution in a particular image area of interest by employing a series of mathematical calculations that must be performed in a particular order. These calculations result in the identification of color contours and the relative distances among them within the area of interest. The advantage for the disclosed method compared to prior art image analysis methods is that it provides a quantitative method for assessing the likelihood that a particular skin lesion is a melanoma or a benign nevus. As will be shown in the attached Examples, the method of the present invention discriminates malignant melanoma with high accuracy that reaches or exceeds 93%, which is greater than the accuracy normally achieved by the trained eye of a medical expert which rarely exceeds 70%.
- The invention also provides an apparatus for detecting a melanoma in a digital image of a skin tissue, the apparatus comprising a camera adapted to obtain said image, a processor adapted to process the image data according to the method disclosed herein, and an output device adapted to indicate a likelihood of the presence or absence of a melanoma.
- Also provided is a computer program comprising instructions which, when the program is executed by a computer, cause the computer to carry out the method disclosed herein.
- Other aspects and benefits of the present invention will become apparent from the detailed description to follow.
- The present invention will now be described with reference to certain embodiments thereof which are illustrated in the accompanying drawings. It should be noted that the accompanying drawings illustrate preferred embodiments of the invention, therefore should not be considered as limiting the scope of the invention.
-
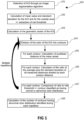
Fig. 1 shows a schematic flowchart diagram of a method of detecting an abnormal morphological feature in a digital image of a skin tissue according to the invention. -
Fig. 2 shows the workflow of a method of detecting an abnormal morphological feature in a digital image of a skin tissue according to a preferred embodiment of the invention. -
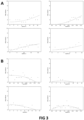
Fig. 3 shows exemplary output graphs according to the invention. An increase in the number of contours classified as having abnormal color distribution ("risky contours") during the process (repetitions) as depicted in the top curves (A) is an indication of the presence of a melanoma. A steady or decreasing number of contours having abnormal color distribution (B) corresponds to a benign skin condition. -
Fig. 4 is a presentation of the contour process applied to a melanotic nevus (A) and a melanoma (B) through a series of images. In the nevus the color is expanding uniformly, while in the melanoma it expands in a random way. -
Fig. 5 is a diagrammatic presentation of the process of calculating the number of peaks around the borders of the AOI. (A) corresponds to a digital image of a melanoma and (B) corresponds to a digital image of a nevus. -
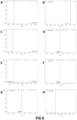
Fig. 6 is a diagrammatic presentation of the process of calculating the optimal Rc. (A), (C), (E) and (G) represent the results from the training set; (B), (D), (F) and (H) represent the results from the test set. The Rc values tested were 0.25 (A, B), 0.24 (C, D), 0.22 (E, F) and 0.22 (G, H). The result obtained at the end of this process was Rc = 0.232 (I). -
Fig. 7 shows dermoscopic images of a nevus (A) and a melanoma (C) and the corresponding output for the nevus (B) and for the melanoma (D). - The present disclosure provides a computer implemented image analysis method for diagnosing melanoma in a digital skin image. It also provides an apparatus for detecting a melanoma in a digital image of a tissue as well as a computer program for implementing said method.
- The term "contour centroid" or "centroid" as used throughout the description and claims refers to the geometric center of a contour.
- The term "sub-contour" as used throughout the description and claims refers to any contour that is detected inside a contour.
- The method refers to the assessment of color distribution in an image which can be used to characterize a particular skin condition as "normal" or "not normal" when compared to a known physiological state. The image can be taken by a digital camera, a smartphone camera, or any other kind of sensing elements integrated into an instrument. The abnormal or non-physiological state is a condition that does not appear naturally but instead it can be attributed to a biological phenomenon such as the growth of cancer cells.
- The invention discloses an iterative process for quantitatively analyzing a digital image of a melanotic and non-melanotic skin lesion for the detection of color distribution abnormalities. Specifically, the inventors have found that if the number of contours classified as having abnormal color distribution increases during said process, this is an indication of the presence of a melanoma. A steady or decreasing number of contours classified as having abnormal color distribution corresponds to a benign skin condition such as a nevus.
- The detection of color abnormalities in a particular image is achieved by following a series of distinct mathematical functions (
Figure 1 ). Instep 101, the area of interest (AOI) which corresponds to the part of the image that is checked for color abnormalities is first defined using an image segmentation algorithm. The AOI is thereby separated from the outside area (OA). This step is important for color normalization purposes. In a preferred embodiment, the AOI and the OA are converted into grayscale. - In
step 102, the mean color intensity value and the standard deviation for the AOI and for the area outside the AOI are calculated. This step results in the calculation of a risk threshold as a function of the mean and standard deviation. The risk threshold is used instep 107 to determine whether each of the contours identified has normal or abnormal color distribution. - In
step 103, the method then calculates the geometric center of the AOI. Since the shape of interest is only one, the centroid and the mass center are identical. In a preferred embodiment, the method also calculates the symmetry of the AOI. If the AOI is asymmetrical, this is an indication of a malignant lesion. In another preferred embodiment, the noise at the borders of the AOI and specifically the peaks around the borders are measured. This is achieved, first by measuring the distance of each pixel at the border of the area of interest and subsequently calculating the points that intersect the mean value and the distance. An anomalous border of the AOI is an indication of a melanoma. In a more preferred embodiment, the method calculates both the symmetry of the AOI and the noise at the borders of the AOI. - In
step 104, the color of the AOI is divided into contours. During this step, a threshold value is applied to the image and said intensity threshold value creates one or more contours. In a preferred embodiment, threshold values start from the first intensity level that the global threshold detects. - In
step 105, if more than one contours are identified in the previous step, the euclidean distance of the mass center of each contour identified is calculated and instep 106, for each contour identified a ratio is calculated of the average plus the standard deviation of all the measured distances divided by each contour distance. - In
step 107 the resulting ratio is compared to the risk threshold calculated instep 102, whereby each identified contour is classified as having normal or abnormal color distribution. - In a preferred embodiment, the method additionally comprise a subsequent step wherein, if a sub-contour is detected inside a contour, the average color intensity of an area around the center of the sub-contour and the average color intensity of an area around the center of the corresponding main contour are measured to determine if the intensity of the sub-contour is significantly different from that of the corresponding main contour. Preferably, the area around the center of the sub-contour and the corresponding main contour whose average color intensity is measured should extend from 5 or more pixels towards all directions. More preferably, the area around the center of the sub-contour and the corresponding main contour whose average color intensity is measured should extend from 5 to 15 pixels towards all directions. A sub-contour whose intensity is significantly different from that of the main contour is classified as having abnormal color distribution.
-
Steps step 104, a different threshold value is applied, by increasing the value so that each time the contour covers a larger area. - In
step 108, the number of contours (and optionally sub-contours) having abnormal color distribution identified during each repetition is calculated. As will be shown in the Examples, the presence of multiple contours having abnormal color distribution whose numbers are increasing during the process highly correlates with the presence of a melanoma. - The method disclosed herein is used to determine the possibility that a skin lesion is a melanoma. In view of the serious nature of melanoma, and the extreme importance of early detection of the disease, a method is needed to allow individuals who may be concerned that they have melanoma to obtain a rapid, preliminary screening using a computer-based image analysis and pattern recognition tool that is easily accessible, for instance via the Internet, and which can utilize readily-available imaging techniques such as a smartphone camera or convention digital camera. The present invention expands the methods disclosed in the prior art to provide such a capability.
-
Figure 2 is a flow diagram illustrating a preferred embodiment of the computer implementedmethod 200 of detecting a melanoma in a digital image of a tissue. Themethod 200 is exemplary. In use, themethod 200 may include additional steps, omit some steps, and/or perform certain steps in different order. Themethod 200 is presented as an overview. Many of the specifics of performing the various steps of themethod 200 are described in detail herein. - In
step 201, a skin image, such as a dermoscopic image or an image taken by a smartphone camera, examined for the presence of lesions, is divided into two parts, the one part is the AOI, and the second part is the OA (outside area). The area of interest gets unified as one and masked from the outside part (masked image). Subsequently, the two areas are converted into grayscale. - In
step 202, two vectors are generated, one that corresponds to OA and the other to the AOI. The mean color intensity and standard deviation of both areas is then calculated, preferably by random picking from 60% to 70% of the corresponding vector. A risk threshold is then calculated as a function of the mean and standard deviation calculated during this step. When the standard deviation is high, there is high probability of unwanted noise, such as blurry image, presence of hair, freckles etc.). Subsequently, the geometric center, or centroid, of the AOI and the OA is calculated as a function of pixel intensity. - In
step 203, the symmetry of the AOI is calculated. To define the symmetry of a lesion, an ellipse is fitted on the masked area. If the area is symmetrical, then the area of the ellipse and the masked area should converge at about 90% or higher, preferably at 90% plus or minus 2% or higher. If the AOI is asymmetrical, it is assigned a risk value indicating an increased probability of the presence of a malignant lesion. - In
step 204, the noise at the borders of the AOI and specifically the peaks around the borders are measured. This is achieved, first by measuring the distance of each pixel at the border of the area of interest and subsequently calculating the points that intersect the mean value and the distance. If are more than 5 intersected points are calculated, the AOI has anomalous borders and it is assigned a risk value indicating an increased possibility of the presence of a lesion. - In
step 205, a bilateral filter is applied to smoothen the noise or unwanted detail. The filter applied, which is a function of the standard deviation for the AOI, depends on the resolution of the image which is analyzed. For instance, when a dermoscopic image is analyzed, the recommended values tend to be higher, whereas when phone images, with high resolution camera, are taken to be analyzed, the recommended values tend to be lower. - In
step 206, the color of the AOI is divided into contours, preferably by using binary (global) thresholding. During this step, a threshold value is applied to the grayscale image and this grayscale intensity threshold value creates one or more contours. Threshold values start from the first intensity level that the global threshold detects. - In
step 207, if more than one contours are identified in the previous step, the euclidean distance of the mass center of each contour identified is calculated and instep 208, for each contour identified, a ratio is calculated of the average plus the standard deviation of all the measured distances divided by each contour distance. Instep 209, the resulting ratio is compared to the risk threshold calculated instep 202, whereby each identified contour is classified as having normal or abnormal color distribution. - In
step 210, if a sub-contour is detected inside a contour, the average color intensity of an area around the center of the sub-contour and the average color intensity of an area around the center of the corresponding main contour are measured to determine if the intensity of the sub-contour is significantly different from that of the corresponding main contour. Preferably, the area around the center of the sub-contour and the corresponding main contour whose average color intensity is measured should extend from 5 or more pixels towards all directions. More preferably, the area around the center of the sub-contour and the corresponding main contour whose average color intensity is measured should extend from 5 to 15 pixels towards all directions. A sub-contour whose intensity is significantly different from that of the main contour is classified as having abnormal color distribution. As an example, the average color intensity of the sub-contour is considered as significantly different from that of the corresponding main contour if it corresponds to a different basic color to that of the corresponding main contour. If the image is in grayscale, the average color intensity of the sub-contour is considered as significantly different from that of the corresponding main contour if it corresponds to a different basic color in the grayscale range. For instance, if the difference of the mean values of the two areas (sub-contour and contour) is higher than 30 the average color intensity of the sub-contour is considered as significantly different from that of the corresponding main contour. The value of 30 emerges considering that there are 8 basic colors (white, black plus the six basic colors produced by the three main colors). The grayscale values extend from 0 to 255, so 255 divided by 8 equals 31.2, such that the white shades correspond to values of 0 to 30, yellow shades correspond to values of 30 - 60 etc. If the average color intensity of the sub-contour and contour is, for example, 150 and 100 respectively, they belong to different "packs" of color shades. - Subsequently, steps 206, 207, 208, 209 and 210 are repeated until the size of a contour covers the AOI. Preferably, steps 206, 207, 208, 209 and 210 are repeated until the size of a contour reaches the 75% to 80% percent of the lesion area (AOI). The 75% to 80% values correspond to the optimum percentage as it covers the maximum AOI excluding the unwanted information at the borders, such as shadows and dark spots, which might be caused by imperfect segmentation. As each skin lesion has different shades of colors which are distributed differently, the contours also converge differently. Thus, the range of the threshold levels depends on the object that is depicted in the image, and for that reason it is not always the same. During each repetition of
step 206, a different threshold value is applied, by increasing the value so that the contour increasingly covers a larger area. Preferably the intensity threshold value applied during each repetition ofstep 206 increases by a value of one. - The evaluation outcome of the above steps is used to determine whether the color distribution indicates the existence of melanoma. More specifically, in
Figure 3 , the difference between the distribution of contours with abnormal color distribution during the iterations of the described process, detected in melanotic and non-melanotic lesions is presented. As the algorithm proceeds from one repetition to the other and detects the contours, the ones classified as having abnormal color distribution ("risky contours") are plotted against the number of repetitions taking place each time throughout the process. In case of a melanoma, an increasing curve is created as the number of repetitions increases, indicating the abnormal color distribution observed in such lesions (Figure 3A ). When the lesion is non-melanotic, the curve shown is steady or decreasing (Figure 3B ), depicting the relatively even color distribution seen to a non-melanotic compared to a melanotic lesion. Similarly,Figure 4 shows through a series of images that, when the contour process is applied to a melanotic nevi (Figure 4A ) the color is expanding uniformly, whereas when it is applied to a melanoma (Figure 4B ), the color expands in a random way. - During each repetition of
steps 206 to 210, a risk value may be calculated in order to provide a quantitative assessment of the growth rate at which the number of contours with abnormal color distribution increases during the iterative process. Said risk value increases every time a contour or sub-contour is classified as having abnormal color distribution. For instance, one unit is added to the risk value every time a contour or sub-contour is classified as having abnormal color distribution. A cumulative risk value is subsequently calculated (step 211) at the end of the iterative process, which provides a quantitative assessment of the probability of the presence of a melanotic lesion. In another preferred embodiment, the symmetry of the AOI and/or the noise at the borders of the AOI are also taken into consideration when calculating the cumulative risk value. For instance, two units may be extracted from the cumulative risk value if the AOI is both symmetrical and with smooth borders; two units may be added to the cumulative risk value if the AOI is asymmetrical and has anomalous borders; one unit may be extracted from the cumulative risk value if the AOI is asymmetrical with smooth borders or symmetrical with anomalous borders. - If a cumulative risk value is calculated in
step 211, the ratio of the cumulative risk value divided by the total number of repetitions is compared to a classification threshold instep 212. The inventors have analyzed a large number of medical images from melanoma and non-melanoma cases (Example 1) and have concluded that the classification threshold Rc ranges from 0.18 to 0.25, (0.18, 0.25). The exact value depends on the image, i.e., whether it is a dermoscopic image or a smartphone image. The person skilled in the art looking to determine the exact value of the classification threshold Rc for the particular images used, would use a few known samples (melanotic and non-melanotic) to calibrate the algorithm, as explained in Example 1. - If the ratio of the cumulative risk value divided by the total number of repetitions is smaller than the classification threshold Rc, the lesion is non-melanotic, whereas if the ratio is higher than the Rc, the lesion is melanotic.
- The method disclosed herein was used to analyze 44 medical images containing 15 known melanoma and 29 non-melanoma (nevi) cases (
Figure 4 ). The images are randomly picked to avoid bias in the results. The methodological steps were incorporated into a computer algorithm which analyzed every image independently. - [1] Each image under analysis was divided into two parts, the one part being the area of interest, and the second part being the outside part (surrounding area) by applying the KNN algorithm. The area of interest was subsequently unified as one and masked from the outside part (masked image).
- [2] The two areas were converted into grayscale. For that reason, the pixels of each area were read as a one-dimensional vector. For the conversion the luminance method was used, vectorimage = 0.299 .Red+0.587 · Green+0.114 · Blue. Also, the same method was used to convert the masked image into a grayscale.
- [3] From step [2], two vectors were generated, one corresponding to the outside area and the other to the area of interest, (OA, AOI). The mean value and standard deviation is calculated for each vector by random picking from 60% to 70% of it, (EOA, σOA), (EAOI, σAOI). The definition of these values facilitates the determination of the condition and the intensity texture of skin (OA) and the AOI. An increased σ value corresponds to more "noisy" texture. More specifically, a "noisy" texture is defined by a non-uniform color distribution, meaning that the skin has many small differentiation points (e.g., freckles) and these skin areas are in a higher risk to develop skin cancer originating from moles. Also, lower values of EAOI means darker colors.
- [4] The centroid, which is the center of the shape/ surface of the area of interest (initial centroid) was defined by using the "image moment" equation for the masked part.


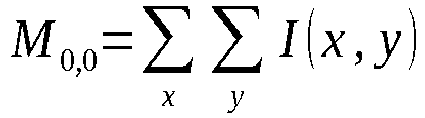
- [5] The shape of a nevus, or benign lesion, tends to be rounder and is classified as symmetrical. This can also be seen in
Figure 4 , where benign skin lesions (Figure 4A ) have a rounder shape compared to melanoma (Figure 4B ). To define the symmetry of a lesion, an ellipse was fitted on the masked area. If the area is symmetrical, then the area of the ellipse and the masked area should converge ≥ 90%. The elliptical area is calculated from Elarea = π · A ·B, where A is the length of the semi major axis and B the length of the semi minor axis, and convergence is calculated as follows:

- [6] The noise at the borders of the area of interest and specifically the peaks around the borders were measured. Every pixel on the border of a lesion can be considered as a (x, y) 2-dimensional space vector. The euclidean distance of each (xi, yi) point from its lesion center (cx, cy) was calculated using the formula:


Figure 5 is a diagrammatic presentation of the process of calculating the number of peaks around the borders of the AOI.Figure 5A corresponds to a digital image of a melanoma andFigure 5B corresponds to a digital image of a nevus. - [7] A Gaussian filter was applied to smoothen the noise or unwanted detail. The parameters set for σx ∈ (5, 11) and σy ∈ (5, 11) depend on the images which are analyzed. For example, when dermatoscopic images are analyzed, the recommended values of σx, and σy are: σx, = 11, σy = 11. When phone images, with high resolution camera are taken to be analyzed, the recommended values of σx, and σy are lower, σx = 7, σy = 7.
- [8] A risk threshold Rth was defined, considering the results from the step [3].


- [9] The color of the area of interest was divided into contours, starting from darker to lighter ones. To achieve this, multiple conversions of the smoothed masked image to a binary one (black and white) were performed, using binary (global) thresholding. During this procedure, multiple threshold values were applied to the grayscale image. Threshold levels started from the first intensity level that the global threshold detected, until it reached the 75% to 80% percent of the lesion area. The range of the threshold levels depends on the object that is depicted in the image, and for that reason it is not always the same.
- [10] Each grayscale intensity threshold value, created one or more contours. In every case where there were more contours than one, the mass center of all the contours was measured, by using:


- [11] For every sub-contour that was detected inside a contour during step [10], the area around its center was measured, to determine if it represented a significant change inside the main contour. The area measured extended from 5 to 15 pixels towards all directions, from both contour and its sub-contour area, except, if the sub-contour was located at the main contour center, then another area was chosen randomly. Any significant change at this step meant that the intensity of the two areas was completely different. If the difference of the mean values of the two areas (sub-contour and contour) was higher than 30, the average color intensity of the sub-contour was considered significantly different. If a sub-contour with a significant change had been detected, one risk value was added to the step [10] result, meaning that from this point the value r was defined as ri+1 = ri + 1.
- [12] Steps [10] and [11] were repeated until step [9] reached the desired covered area. The method for each iteration returned a risk value, ri, which means that a one dimensional (1D) array r̂ was added.
- [13] Finally, the symmetry and the borders that arose from step [5] and [6] respectively, was added as extra feature, r', in the resulting 1D array r̂ from step [12].

- [14] The classification is defined by:


- For the calculation of Rc, the data were split to a training set (80%) and a test set (20%).
- Starting from Rc values of 0.18 to 0.25, all values were tested until a Rc value was calculated that classified the most known melanoma cases as melanomas and had the lowest percentage of nevi lesions classified as melanoma.
Figure 6 is a diagrammatic presentation of this process.Figures 6A, 6C, 6E and 6G represent the results from the training set;Figures 6B, 6D, 6F and 6H represent the results from the test set. The Rc values tested were 0.25 (Figures 6A, 6B ), 0.24 (Figures 6C, 6D ), 0.22 (Figures (Figures 6E, 6F ) and 0.22 (Figures 6G, 6H ). - The Rc value was evaluated with the test data and the score was recorded.
- The same process was repeated multiple times by shuffling the data.
- At the end of this process, the Rc was the average score from all the trials.
- The result obtained at the end of this process was Rc = 0.232, (
Figure 6I ) scoring accuracy of 88%, sensitivity = 86% and specificity = 89.6%. - The number of contours with abnormal color distribution ("risky contours") per repetition was plotted against the number of repetitions as shown in
Figure 7 . From the output graph the following metrics are extracted:

- Using the image analysis method disclosed herein, the inventors analyzed 600 digital images of skin lesions in order to determine whether the lesion is a melanoma or nevus. The methodological steps were incorporated into a computer algorithm which analyzed every image independently. Following the calibration performed in Example 1, the classification threshold Rc was set at 0.232.
- The results showed that the detection of color abnormalities was correlated to melanoma conditions. Color abnormalities were found in 96% of the pictures of a melanoma whereas they were detected in only 10% of non-melanoma pictures. This corresponds to a 93% accuracy for the methodology which is greater than the accuracy normally achieved by the trained eye of a medical expert which rarely exceeds 70%, mainly due to low specificity levels when no preliminary diagnosis occurs.
Claims (10)
- A computer implemented method of detecting melanoma in a digital skin image, comprising the following steps:a) determining the area of interest (AOI) in the digital image through an image segmentation algorithm;b) calculating the mean value and the standard deviation for the AOI and for the area outside the AOI to extract a risk threshold;c) calculating the geometric center of the AOI, whereby the initial centroid is defined;d) dividing the color of the AOI into contours;e) if multiple contours are identified in step (d), calculating the euclidean distance of the mass center of each contour identified;f) calculating the ratio of the average plus the standard deviation of all the measured distances divided by each contour distance;g) comparing said ratio with the risk threshold extracted in step (b) whereby said contour is classified as having normal or abnormal color distribution; andh) repeating steps (d) to (g) by applying multiple threshold values to the image, until the size of a contour covers the AOI;wherein the presence of multiple contours having abnormal color distribution and whose numbers are increasing during the process is an indication of a melanoma.
- The method according to claim 1, wherein if a sub-contour is detected inside a contour, then step (d) further comprises measuring the average color intensity of an area about 5 or more pixels towards all directions around the mass center of said contour and sub-contour; wherein if the two calculated averages are significantly different then said sub-contour is classified as having abnormal color distribution.
- The method according to claims 1 or 2, further comprises calculating a risk value during each repetition, and wherein said risk value increases every time a contour and/or sub-contour is classified as having abnormal color distribution; whereby the cumulative risk value obtained at the end of the process is used to classify the AOI as a melanoma or as non-melanotic lesion.
- The method according to claim 3, wherein the ratio of the cumulative risk value obtained at the end of the process divided by the total number of repetitions is compared to a classification threshold value ranging from 0.18 to 0.25, whereby if said ratio is greater than the classification threshold value it is an indication of a melanoma.
- The method according to any one of the previous claims, wherein during step (a) the AOI is masked from the outside area and wherein the masked AOI and the area outside the AOI are converted into grayscale.
- The method according to any one of the previous claims, wherein step (b) further comprises calculating the symmetry of the AOI, wherein an asymmetric AOI is an indication of a melanoma.
- The method according to any one of the previous claims, wherein step (b) further comprises measuring the noise at the borders of the AOI, wherein an anomalous border of the AOI is an indication of a melanoma.
- An apparatus for detecting a melanoma in a digital image of a tissue, the apparatus comprising: a camera adapted to obtain said image; a processor adapted to process the image data according to the method of any of the preceding claims; and an output device adapted to indicate a likelihood of the presence or absence of a melanoma.
- The apparatus according to claim 8, wherein said apparatus is a smartphone or a tablet.
- A computer program comprising instructions which, when the program is executed by a computer, cause the computer to carry out the method according to claims 1 to 7.
Priority Applications (3)
| Application Number | Priority Date | Filing Date | Title |
|---|---|---|---|
| EP23198720.7A EP4528634B1 (en) | 2023-09-21 | 2023-09-21 | Method of bioimage analysis for the detection of color abnormalities through color distribution assessment |
| PCT/EP2024/075842 WO2025061646A1 (en) | 2023-09-21 | 2024-09-17 | Method of bioimage analysis for the detection of color abnormalities through color distribution assessment |
| AU2024344610A AU2024344610A1 (en) | 2023-09-21 | 2024-09-17 | Method of bioimage analysis for the detection of color abnormalities through color distribution assessment |
Applications Claiming Priority (1)
| Application Number | Priority Date | Filing Date | Title |
|---|---|---|---|
| EP23198720.7A EP4528634B1 (en) | 2023-09-21 | 2023-09-21 | Method of bioimage analysis for the detection of color abnormalities through color distribution assessment |
Publications (2)
| Publication Number | Publication Date |
|---|---|
| EP4528634A1 true EP4528634A1 (en) | 2025-03-26 |
| EP4528634B1 EP4528634B1 (en) | 2026-04-29 |
Family
ID=88236759
Family Applications (1)
| Application Number | Title | Priority Date | Filing Date |
|---|---|---|---|
| EP23198720.7A Active EP4528634B1 (en) | 2023-09-21 | 2023-09-21 | Method of bioimage analysis for the detection of color abnormalities through color distribution assessment |
Country Status (3)
| Country | Link |
|---|---|
| EP (1) | EP4528634B1 (en) |
| AU (1) | AU2024344610A1 (en) |
| WO (1) | WO2025061646A1 (en) |
Families Citing this family (1)
| Publication number | Priority date | Publication date | Assignee | Title |
|---|---|---|---|---|
| CN120543532B (en) * | 2025-05-28 | 2026-01-06 | 广东铂崛科技有限公司 | A Machine Vision-Based Method and System for Impurity Analysis in Metal Powder |
-
2023
- 2023-09-21 EP EP23198720.7A patent/EP4528634B1/en active Active
-
2024
- 2024-09-17 WO PCT/EP2024/075842 patent/WO2025061646A1/en active Pending
- 2024-09-17 AU AU2024344610A patent/AU2024344610A1/en active Pending
Non-Patent Citations (3)
| Title |
|---|
| ALI ABDER-RAHMAN H ET AL: "Automating the ABCD Rule for Melanoma Detection: A Survey", IEEE ACCESS, IEEE, USA, vol. 8, 28 April 2020 (2020-04-28), pages 83333 - 83346, XP011787841, [retrieved on 20200512], DOI: 10.1109/ACCESS.2020.2991034 * |
| MAHDIRAJI SAEID AMOUZAD ET AL: "Skin lesion images classification using new color pigmented boundary descriptors", 2017 3RD INTERNATIONAL CONFERENCE ON PATTERN RECOGNITION AND IMAGE ANALYSIS (IPRIA), IEEE, 19 April 2017 (2017-04-19), pages 102 - 107, XP033125833, [retrieved on 20170717], DOI: 10.1109/PRIA.2017.7983026 * |
| T-T DO ET AL: "Accessible Melanoma Detection using Smartphones and Mobile Image Analysis", ARXIV.ORG, CORNELL UNIVERSITY LIBRARY, 201 OLIN LIBRARY CORNELL UNIVERSITY ITHACA, NY 14853, 27 November 2017 (2017-11-27), XP080840297 * |
Also Published As
| Publication number | Publication date |
|---|---|
| WO2025061646A1 (en) | 2025-03-27 |
| EP4528634B1 (en) | 2026-04-29 |
| AU2024344610A1 (en) | 2026-04-02 |
Similar Documents
| Publication | Publication Date | Title |
|---|---|---|
| Vidya et al. | Skin cancer detection using machine learning techniques | |
| US10531825B2 (en) | Thresholding methods for lesion segmentation in dermoscopy images | |
| Noronha et al. | Automated classification of glaucoma stages using higher order cumulant features | |
| JP6265588B2 (en) | Image processing apparatus, operation method of image processing apparatus, and image processing program | |
| US10786227B2 (en) | System and method for ultrasound examination | |
| CN104812288B (en) | Image processing apparatus and image processing method | |
| US10540765B2 (en) | Image processing device, image processing method, and computer program product thereon | |
| US20210209755A1 (en) | Automatic lesion border selection based on morphology and color features | |
| EP4113433A1 (en) | Classification and improvement of quality of vascular images | |
| Glaister | Automatic segmentation of skin lesions from dermatological photographs | |
| Lee et al. | Hair segmentation using adaptive threshold from edge and branch length measures | |
| Mithun et al. | Automated detection of optic disc and blood vessel in retinal image using morphological, edge detection and feature extraction technique | |
| CN119399219A (en) | A medical ultrasound image segmentation method and system based on adaptive feature fusion | |
| EP4528634A1 (en) | Method of bioimage analysis for the detection of color abnormalities through color distribution assessment | |
| Vázquez et al. | Improvements in retinal vessel clustering techniques: towards the automatic computation of the arterio venous ratio | |
| Fondón et al. | Automatic optic cup segmentation algorithm for retinal fundus images based on random forest classifier | |
| EP4398188A1 (en) | Vessel recognition using weighted gabor technique | |
| Yu et al. | Automated retinal vessel type classification in color fundus images | |
| Ponmalar et al. | Efficient diabetic retinopathy detection using machine learning techniques | |
| KR101468121B1 (en) | Hybrid Medical Diagnosis System Having Aerobic Disease Diagnosis System and Tongue Diagnosis System Based on 3D Image | |
| Firdausy et al. | A study on recent developments for detection of neovascularization | |
| CN119090764B (en) | High-definition medical image processing method | |
| Özkan et al. | Biomedical System Design Capsule Project Report | |
| Karmakar et al. | Precision Segmentation and Feature Extraction of Blood Vessels of Retina using Automated Algorithm | |
| Shankara et al. | Analysing Feature Extraction Methods for Enhanced Accuracy in Lung Cancer |
Legal Events
| Date | Code | Title | Description |
|---|---|---|---|
| PUAI | Public reference made under article 153(3) epc to a published international application that has entered the european phase |
Free format text: ORIGINAL CODE: 0009012 |
|
| STAA | Information on the status of an ep patent application or granted ep patent |
Free format text: STATUS: THE APPLICATION HAS BEEN PUBLISHED |
|
| AK | Designated contracting states |
Kind code of ref document: A1 Designated state(s): AL AT BE BG CH CY CZ DE DK EE ES FI FR GB GR HR HU IE IS IT LI LT LU LV MC ME MK MT NL NO PL PT RO RS SE SI SK SM TR |
|
| STAA | Information on the status of an ep patent application or granted ep patent |
Free format text: STATUS: REQUEST FOR EXAMINATION WAS MADE |
|
| 17P | Request for examination filed |
Effective date: 20250915 |
|
| RIC1 | Information provided on ipc code assigned before grant |
Ipc: G06T 7/00 20170101AFI20251217BHEP Ipc: G06T 7/90 20170101ALI20251217BHEP Ipc: G06V 10/25 20220101ALI20251217BHEP Ipc: G06V 20/69 20220101ALI20251217BHEP Ipc: A61B 5/00 20060101ALN20251217BHEP |
|
| GRAP | Despatch of communication of intention to grant a patent |
Free format text: ORIGINAL CODE: EPIDOSNIGR1 |
|
| STAA | Information on the status of an ep patent application or granted ep patent |
Free format text: STATUS: GRANT OF PATENT IS INTENDED |
|
| RIC1 | Information provided on ipc code assigned before grant |
Ipc: G06T 7/00 20170101AFI20260115BHEP Ipc: G06T 7/90 20170101ALI20260115BHEP Ipc: G06V 10/25 20220101ALI20260115BHEP Ipc: G06V 20/69 20220101ALI20260115BHEP Ipc: A61B 5/00 20060101ALN20260115BHEP |
|
| RAP3 | Party data changed (applicant data changed or rights of an application transferred) |
Owner name: BIOPIX DNA TECHNOLOGY S.A. |
|
| GRAS | Grant fee paid |
Free format text: ORIGINAL CODE: EPIDOSNIGR3 |
|
| INTG | Intention to grant announced |
Effective date: 20260213 |
|
| RIC1 | Information provided on ipc code assigned before grant |
Ipc: G06T 7/00 20170101AFI20260209BHEP Ipc: G06T 7/90 20170101ALI20260209BHEP Ipc: G06V 10/25 20220101ALI20260209BHEP Ipc: G06V 20/69 20220101ALI20260209BHEP Ipc: A61B 5/00 20060101ALN20260209BHEP |
|
| GRAA | (expected) grant |
Free format text: ORIGINAL CODE: 0009210 |
|
| STAA | Information on the status of an ep patent application or granted ep patent |
Free format text: STATUS: THE PATENT HAS BEEN GRANTED |
|
| AK | Designated contracting states |
Kind code of ref document: B1 Designated state(s): AL AT BE BG CH CY CZ DE DK EE ES FI FR GB GR HR HU IE IS IT LI LT LU LV MC ME MK MT NL NO PL PT RO RS SE SI SK SM TR |
|
| REG | Reference to a national code |
Ref country code: CH Ref legal event code: F10 Free format text: ST27 STATUS EVENT CODE: U-0-0-F10-F00 (AS PROVIDED BY THE NATIONAL OFFICE) Effective date: 20260429 |