EP4528305A1 - Method and system for characterizing a spatial pattern for a microstructural property of a biological tissue - Google Patents
Method and system for characterizing a spatial pattern for a microstructural property of a biological tissue Download PDFInfo
- Publication number
- EP4528305A1 EP4528305A1 EP23198152.3A EP23198152A EP4528305A1 EP 4528305 A1 EP4528305 A1 EP 4528305A1 EP 23198152 A EP23198152 A EP 23198152A EP 4528305 A1 EP4528305 A1 EP 4528305A1
- Authority
- EP
- European Patent Office
- Prior art keywords
- tissue
- property
- value
- map
- microstructural
- Prior art date
- Legal status (The legal status is an assumption and is not a legal conclusion. Google has not performed a legal analysis and makes no representation as to the accuracy of the status listed.)
- Granted
Links
Images


Classifications
-
- G—PHYSICS
- G06—COMPUTING OR CALCULATING; COUNTING
- G06T—IMAGE DATA PROCESSING OR GENERATION, IN GENERAL
- G06T7/00—Image analysis
- G06T7/0002—Inspection of images, e.g. flaw detection
- G06T7/0012—Biomedical image inspection
- G06T7/0014—Biomedical image inspection using an image reference approach
-
- G—PHYSICS
- G01—MEASURING; TESTING
- G01R—MEASURING ELECTRIC VARIABLES; MEASURING MAGNETIC VARIABLES
- G01R33/00—Arrangements or instruments for measuring magnetic variables
- G01R33/20—Arrangements or instruments for measuring magnetic variables involving magnetic resonance
- G01R33/44—Arrangements or instruments for measuring magnetic variables involving magnetic resonance using nuclear magnetic resonance [NMR]
- G01R33/48—NMR imaging systems
- G01R33/4828—Resolving the MR signals of different chemical species, e.g. water-fat imaging
-
- G—PHYSICS
- G01—MEASURING; TESTING
- G01R—MEASURING ELECTRIC VARIABLES; MEASURING MAGNETIC VARIABLES
- G01R33/00—Arrangements or instruments for measuring magnetic variables
- G01R33/20—Arrangements or instruments for measuring magnetic variables involving magnetic resonance
- G01R33/44—Arrangements or instruments for measuring magnetic variables involving magnetic resonance using nuclear magnetic resonance [NMR]
- G01R33/48—NMR imaging systems
- G01R33/50—NMR imaging systems based on the determination of relaxation times, e.g. T1 measurement by IR sequences; T2 measurement by multiple-echo sequences
-
- G—PHYSICS
- G01—MEASURING; TESTING
- G01R—MEASURING ELECTRIC VARIABLES; MEASURING MAGNETIC VARIABLES
- G01R33/00—Arrangements or instruments for measuring magnetic variables
- G01R33/20—Arrangements or instruments for measuring magnetic variables involving magnetic resonance
- G01R33/44—Arrangements or instruments for measuring magnetic variables involving magnetic resonance using nuclear magnetic resonance [NMR]
- G01R33/48—NMR imaging systems
- G01R33/54—Signal processing systems, e.g. using pulse sequences ; Generation or control of pulse sequences; Operator console
- G01R33/56—Image enhancement or correction, e.g. subtraction or averaging techniques, e.g. improvement of signal-to-noise ratio and resolution
- G01R33/5608—Data processing and visualization specially adapted for MR, e.g. for feature analysis and pattern recognition on the basis of measured MR data, segmentation of measured MR data, edge contour detection on the basis of measured MR data, for enhancing measured MR data in terms of signal-to-noise ratio by means of noise filtering or apodization, for enhancing measured MR data in terms of resolution by means for deblurring, windowing, zero filling, or generation of gray-scaled images, colour-coded images or images displaying vectors instead of pixels
-
- G—PHYSICS
- G06—COMPUTING OR CALCULATING; COUNTING
- G06T—IMAGE DATA PROCESSING OR GENERATION, IN GENERAL
- G06T7/00—Image analysis
- G06T7/0002—Inspection of images, e.g. flaw detection
- G06T7/0012—Biomedical image inspection
-
- G—PHYSICS
- G06—COMPUTING OR CALCULATING; COUNTING
- G06T—IMAGE DATA PROCESSING OR GENERATION, IN GENERAL
- G06T7/00—Image analysis
- G06T7/70—Determining position or orientation of objects or cameras
- G06T7/73—Determining position or orientation of objects or cameras using feature-based methods
- G06T7/74—Determining position or orientation of objects or cameras using feature-based methods involving reference images or patches
-
- G—PHYSICS
- G06—COMPUTING OR CALCULATING; COUNTING
- G06V—IMAGE OR VIDEO RECOGNITION OR UNDERSTANDING
- G06V10/00—Arrangements for image or video recognition or understanding
- G06V10/70—Arrangements for image or video recognition or understanding using pattern recognition or machine learning
- G06V10/764—Arrangements for image or video recognition or understanding using pattern recognition or machine learning using classification, e.g. of video objects
-
- G—PHYSICS
- G06—COMPUTING OR CALCULATING; COUNTING
- G06T—IMAGE DATA PROCESSING OR GENERATION, IN GENERAL
- G06T2207/00—Indexing scheme for image analysis or image enhancement
- G06T2207/10—Image acquisition modality
- G06T2207/10072—Tomographic images
- G06T2207/10088—Magnetic resonance imaging [MRI]
-
- G—PHYSICS
- G06—COMPUTING OR CALCULATING; COUNTING
- G06T—IMAGE DATA PROCESSING OR GENERATION, IN GENERAL
- G06T2207/00—Indexing scheme for image analysis or image enhancement
- G06T2207/30—Subject of image; Context of image processing
- G06T2207/30004—Biomedical image processing
- G06T2207/30016—Brain
Definitions
- the present disclosure is directed, in general, to imaging techniques for imaging biological objects, like tissues, using for instance Magnetic Resonance Imaging (MRI). More specifically, the present invention is directed to methods and systems for characterizing microstructural properties of biological tissue from a property map, e.g., from a spatial map of quantitative MRI (qMRI) parameters.
- MRI Magnetic Resonance Imaging
- radiologists identify an anatomical anomaly and monitor its evolution over time to establish the patient's diagnosis, prognosis and/or treatment planning. For instance, in multiple sclerosis, demyelinating lesions are typically detected in the brain using conventional MRI sequences. The progression of the disease is then evaluated by considering, among others, the evolution of brain lesions over time in terms of number of lesions and volume change.
- the pathophysiological mechanisms that are at the source of the progression of an anomaly e.g., the accumulation of macrophages at the lesion border in multiple sclerosis
- property mapping techniques like qMRI have been shown to be of interest to quantify tissue microstructural change in response to pathology, and to bring valuable complementary information to standard radiological metrics [1, 2].
- property mapping like qMRI techniques allow to study microstructural tissue composition, both in abnormal and normal-appearing tissue.
- previous work has shown the relevance of estimating microstructural properties of normal-appearing tissue in multiple sclerosis [3].
- a gradient of increasing alterations was found in periventricular normal-appearing tissue and showed to correlate with disability [4].
- Other studies focused on the estimation of normal-appearing tissue surrounding multiple sclerosis lesions (so-called perilesional tissue) [5,6].
- Vaneckova et al. [4] proposed to compute an Euclidean distance map, where each voxel of a brain image is associated with an intensity representing the distance to the border of the brain ventricles. Periventricular bands were then extracted by applying distance thresholds and discretizing the distance map. And finally, average qMRI values were estimated in each periventricular band and a gradient was observed by comparing values between different bands. Similar solutions were proposed in the papers of Shi et al. [5] and Wittayer et al. [6] .
- Another problem of the proposed solutions is a lack of sensitivity that reduces the information that can be extracted from the obtained results.
- Another disadvantage of existing techniques is that the information on spatial distribution of the tissue properties is not well condensed in an easily usable, ideally a scalar, value. This can be crucial for clinical adoption of such a metric.
- An objective of the present invention is to propose a method and a system capable of precisely and efficiently characterizing the relation between a tissue microstructural property and its location in space with respect to a center of interest, notably in order to provide results based on quantitative metrics, e.g. qMRI metrics, that enable comparison between patients independently from an examination site or MRI apparatuses used for acquiring images of the patients.
- quantitative metrics e.g. qMRI metrics
- the present invention concerns a computer-implemented method for characterizing a spatial distribution of a tissue microstructural property from quantitative imaging data, like qMRI data, the method comprising:
- the present invention also concerns a system for characterizing a spatial distribution of a tissue microstructural property from quantitative imaging data, said system comprising:
- the present invention further concerns an imaging apparatus, e.g., an MRI apparatus, comprising the previously described system, wherein said imaging apparatus is typically configured for acquiring said property map or deriving it from existing sequences (i.e., z-score maps).
- an imaging apparatus e.g., an MRI apparatus, comprising the previously described system, wherein said imaging apparatus is typically configured for acquiring said property map or deriving it from existing sequences (i.e., z-score maps).
- said method comprises, and the control unit is configured for, comparing the value obtained for at least one of said fitting parameter, e.g. said outputted value, to a reference value.
- the method comprises automatically sending a warning signal.
- said comparison might be used for triggering an automatic sending of said warning signal.
- said method comprises, and the control unit is configured for, automatically classifying the tissue in a class of tissue in function of the value of at least one of said fitting parameters, e.g. in function of the outputted value.
- said set of voxels might be obtained by applying a mask to the property map in order to select, by means of said mask, voxels belonging to a specific region of said biological object and which form said set.
- a mask configured for defining or selecting a specific region within a biological object as well as the technique used for applying such a mask to a map are known in the art and therefore do not need to be further described here.
- said set of voxels might be obtained by clustering the voxels of the property map, using for instance k-means clustering techniques.
- Figure 1 describes the different steps of the method 100 carried out by a preferred embodiment of the system 200 according to the invention which is illustrated by Figure 2 .
- a control unit 202 of the system 200 according to the invention is preferentially connected, for instance via a first interface, to a known in the art imaging apparatus, e.g. an MRI apparatus 201. While qMRI will be taken as concrete illustration of the present invention, other imaging apparatus might be connected to the system 200 according to the invention, as long as it can provide the system 200 with a property or quantitative map of a tissue microstructural property for a tissue of a biological object 206.
- the MRI apparatus 201 typically comprises different coils and respective coil controllers configured for generating magnetic fields and RF pulses in order to acquire an MRI signal from the biological object 206, e.g. a brain, under investigation. Said MRI signal is transmitted by a receiver coil controller to the control unit 202.
- the latter might be configured for reconstructing qMRI maps of the biological object 206 from said MRI signal.
- the control unit 202 might be configured for controlling the MRI apparatus 201 so that the latter performs MR imaging enabling an acquisition of qMRI maps.
- the control unit 202 might be connected to a database or any other system for acquiring or receiving, e.g. via said first interface, a property map, e.g.
- Said control unit 202 comprises typically a memory 203 and is connected to a second interface, e.g. a display 204 for displaying images reconstructed from the received MRI signal.
- the system 200 according to the invention might also be part of the MRI apparatus 201.
- the system 200 is configured for carrying out the following steps: At step 110, the system 200, e.g. its control unit 202, receives or acquires one or several property maps configured for mapping a microstructural property of a tissue of the biological object 206.
- Said property maps are for instance qMRI maps 101 obtained from MRI scans of a brain according to known in the art techniques configured for providing quantitative MRI data.
- Said property map might by any map derived from a qMRI map, like a z-score map.
- the property map is a biological object map made of voxels, wherein the intensity value of each voxel is a measure of a tissue parameter (or property) obtained, for said biological object 206, via a quantitative imaging technique, preferentially a qMRI technique.
- a qMRI map according to the invention is for instance:
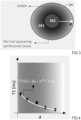
- Figure 3 schematically represents an acquired property map 301 for a tissue of a biological object.
- the acquired property map 301 may cover a region of the biological object 206 that comprises a lesion 302 surrounded by normal-appearing perilesional tissue 303.
- the present invention enables notably to characterize a microstructural property of said perilesional tissue 303.
- the system 200 determines or measures, for each voxel of a set of voxels within said property map, a distance d , which is preferentially a Euclidean distance, separating the concerned voxel of said set from a center of interest.
- Said set of voxels may comprise all voxels of the property map, or might be selected according to any known techniques, for instance by applying a mask to the acquired property map so as to select only a single type of tissue within the biological object, or only a part of the latter.
- each voxel of said set is thus associated to a distance d determined or measured for said voxel (i.e.
- the center of interest is preferentially a boundary of the lesion (i.e. the boundary between the lesion and the normal-appearing perilesional tissue), said distance d being the Euclidean distance between said boundary and the considered voxel.
- the center of interest can be the center of the lesion itself, or a border of the lesion (e.g., the closest border of the lesion) or a predefined spatial area in the biological object (e.g., a whole brain area such as the hippocampus or any other spatially defined region, e.g., periventricular region), or a specific anatomical landmark.
- a border of the lesion e.g., the closest border of the lesion
- a predefined spatial area in the biological object e.g., a whole brain area such as the hippocampus or any other spatially defined region, e.g., periventricular region
- a specific anatomical landmark e.g., a specific anatomical landmark.
- the system 200 notably its control unit 202, is configured for fitting, for said set of voxels, a function f to the measured values V expressed in function of the determined distance d .
- a function f to the measured values V expressed in function of the determined distance d .
- ⁇ 0 , ⁇ 1 , and ⁇ 2 are the fitting parameters that need to be determined by the control unit 202.
- the mathematical model used for fitting V(d) can be based on any type of function (like the exponential function presented in association with Fig. 4 ), mathematical or geometrical transform or operation.
- the system 200 preferably its control unit 202, is configured for determining, from said fit, the values of each fitting parameter ( ⁇ 1 ,..., ⁇ N ).
- the control unit 202 will be configured for determining the value of the fitting parameters ⁇ 0 , ⁇ 1 , and ⁇ 2 .
- the system 200 preferably its control unit 202, is configured for outputting the value of at least one of said fitting parameters.
- the control unit 202 may output the value of the fitting parameter ⁇ 1 and use the latter for a comparison with a reference value or for performing group-wise comparisons, for instance for identifying clusters of fitting parameters or cluster of fits (i.e., of fitting curves) that are alike (e.g., the closest to a mean), using for instance a k-means clustering method.
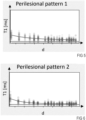
- measured values of the relaxation time T1 in function of the distance d might differ when considering a first lesion ( Figure 5 ) or a second lesion ( Figure 6 ).
- each lesion will present a different perilesional pattern (namely a perilesional pattern 1 for the first lesion and a perilesional pattern 2 for the second lesion, as illustrated in the presented graphs) that can be characterized by the fitting parameters whose values (which are metrics) enable to compare the obtained pattern with a reference pattern (i.e. with reference values for said fitting parameters).
- a reference pattern i.e. with reference values for said fitting parameters.
- the present invention further proposes to use different fits (e.g. different fitting mathematical formulas for the function f ) for reflecting different microstructural mechanisms, such as different lesion types in multiple sclerosis.
- the present invention may enable to distinguish, for a same type of tissue, multiple classes of non-healthy tissue.
- the system 200 notably its control unit 202, is configured for displaying, via the display 204, said at least one fitting parameter, for instance in association with a reference value.
- An advantage of the present invention is that it is based on property maps. It relies thus on absolute physical parameters of the tissue, resulting in better comparability between longitudinal scans of the same patients, between multi-site acquisitions or between different cohorts of subjects (e.g., healthy vs. pathological patients) in comparison to conventional "weighted” imaging.
- it can be used for providing fitting parameter values independent from hardware and other spurious effects, enabling notably the creation of "normative values" for the fitting parameters which might be used for defining a range of normal values seen in "normal” tissue and that will thus characterize a "normal” spatial distribution of a microstructural property under analysis when considering a tissue of interest.
- a fitting parameter value obtained then for an individual patient can be checked against such normative values in order to determine if the spatial distribution of the microstructural property obtained for said patient is within the known range of normative values or not. This may for instance help to better characterize a disease and improve diagnosis, providing for instance support to a radiologist or other medical doctor for a clinical decision.
- the extracted or outputted fitting parameter(s) might be automatically classified in a class of tissue by the control unit 202, wherein one or several classes of tissue (typically, several classes for a same type of tissue) are for instance predefined in the memory 203 of the system 200 in function of such range of normal values for the fitting parameter(s).
- the present invention proposes to evaluate, within a tissue, a spatial distribution or pattern of a microstructural property of said tissue, wherein a mathematical model, i.e. said fitting function, is used for characterizing said spatial pattern from quantitative values acquired for said microstructural property, by associating each voxel of a property map acquired for said microstructural property with a continuous distance metric.
- a mathematical model i.e. said fitting function
Landscapes
- Engineering & Computer Science (AREA)
- Physics & Mathematics (AREA)
- General Physics & Mathematics (AREA)
- Computer Vision & Pattern Recognition (AREA)
- Theoretical Computer Science (AREA)
- Health & Medical Sciences (AREA)
- General Health & Medical Sciences (AREA)
- Condensed Matter Physics & Semiconductors (AREA)
- Nuclear Medicine, Radiotherapy & Molecular Imaging (AREA)
- High Energy & Nuclear Physics (AREA)
- Radiology & Medical Imaging (AREA)
- Artificial Intelligence (AREA)
- Medical Informatics (AREA)
- Signal Processing (AREA)
- Quality & Reliability (AREA)
- Computing Systems (AREA)
- Databases & Information Systems (AREA)
- Evolutionary Computation (AREA)
- Software Systems (AREA)
- Multimedia (AREA)
- Magnetic Resonance Imaging Apparatus (AREA)
Abstract
- acquiring (110), for a biological object and via a first interface, a property map for a tissue of said biological object (206), wherein said property map comprises voxels whose intensity represents a measured value V of said microstructural property;
- determining (120), for at least a set of said voxels, a distance d separating each voxel of said set from a center of interest so that each voxel of said set be associated to a measured value V and a determined distance d;
- fitting (130), for said set of voxels, a function f to the measured values V expressed in function of the determined distance d according to V(d) = f(β1, ... ,βN,d) in order to determine a set of fitting parameters (β1, ... ,βN);
- determining (140), from said fit, the values of each fitting parameter (β1, ... ,βN) ;
- outputting (150) the value of at least one of said fitting parameters.
Description
- The present disclosure is directed, in general, to imaging techniques for imaging biological objects, like tissues, using for instance Magnetic Resonance Imaging (MRI). More specifically, the present invention is directed to methods and systems for characterizing microstructural properties of biological tissue from a property map, e.g., from a spatial map of quantitative MRI (qMRI) parameters.
- In most radiologically-diagnosed diseases (e.g., tumor, multiple sclerosis, Alzheimer's disease), radiologists identify an anatomical anomaly and monitor its evolution over time to establish the patient's diagnosis, prognosis and/or treatment planning. For instance, in multiple sclerosis, demyelinating lesions are typically detected in the brain using conventional MRI sequences. The progression of the disease is then evaluated by considering, among others, the evolution of brain lesions over time in terms of number of lesions and volume change. The pathophysiological mechanisms that are at the source of the progression of an anomaly (e.g., the accumulation of macrophages at the lesion border in multiple sclerosis) are often theoretically understood, yet not quantifiable using conventional clinical imaging techniques. However, it would be clinically relevant to characterize microstructural properties of normal-appearing tissue as it could be predictive of future progression (e.g., lesion enlargement for multiple sclerosis, hippocampus atrophy in Alzheimer's disease).
- In this context, property mapping techniques like qMRI have been shown to be of interest to quantify tissue microstructural change in response to pathology, and to bring valuable complementary information to standard radiological metrics [1, 2]. In fact, property mapping like qMRI techniques allow to study microstructural tissue composition, both in abnormal and normal-appearing tissue. For instance, previous work has shown the relevance of estimating microstructural properties of normal-appearing tissue in multiple sclerosis [3]. In particular, a gradient of increasing alterations was found in periventricular normal-appearing tissue and showed to correlate with disability [4]. Other studies focused on the estimation of normal-appearing tissue surrounding multiple sclerosis lesions (so-called perilesional tissue) [5,6]. These findings suggest that estimating the relation between tissue microstructural properties and their location in space is of relevance to characterize a disease. However, to this date, solutions that are able to efficiently and precisely characterize such relation are still missing.
- Indeed, existing solutions aim at characterizing microstructural alterations in normal-appearing tissue surrounding an area of interest by implementing a "ring-based approach". For instance, Vaneckova et al. [4] proposed to compute an Euclidean distance map, where each voxel of a brain image is associated with an intensity representing the distance to the border of the brain ventricles. Periventricular bands were then extracted by applying distance thresholds and discretizing the distance map. And finally, average qMRI values were estimated in each periventricular band and a gradient was observed by comparing values between different bands. Similar solutions were proposed in the papers of Shi et al. [5] and Wittayer et al. [6] .
- One problem of the proposed solutions is a lack of sensitivity that reduces the information that can be extracted from the obtained results. Another disadvantage of existing techniques is that the information on spatial distribution of the tissue properties is not well condensed in an easily usable, ideally a scalar, value. This can be crucial for clinical adoption of such a metric.
- An objective of the present invention is to propose a method and a system capable of precisely and efficiently characterizing the relation between a tissue microstructural property and its location in space with respect to a center of interest, notably in order to provide results based on quantitative metrics, e.g. qMRI metrics, that enable comparison between patients independently from an examination site or MRI apparatuses used for acquiring images of the patients.
- Said objective is achieved according to the present invention by a method and a system for characterizing a tissue microstructural property in function of its location with respect to a center of interest according to the object of the independent claims. Dependent claims present further advantages of the invention.
- The present invention concerns a computer-implemented method for characterizing a spatial distribution of a tissue microstructural property from quantitative imaging data, like qMRI data, the method comprising:
- receiving or acquiring, for a biological object and via a first interface, a property map, e.g. a qMRI map, for a tissue of said biological object, e.g. a brain, wherein said property map comprises voxels whose intensity represents a measured value V , notably a measurable quantitative value, of said microstructural property for said tissue, said microstructural property being for instance defined as a measurable quantitative parameter. In particular, said property map is a quantitative T1 or a quantitative T2 map of a brain, wherein, in this case, the measured or mapped brain tissue quantitative parameter or property is then the T1 or T2 relaxation time measured for instance in milliseconds. Said property map might be derived from another property map, for instance it can be a deviation map showing differences of measured quantitative values with respect to normative values (e.g., a z-scope map). Said property map might also be a combination of a T1 and T2 map, or a map of an electrical parameter/property of said tissue (e.g. tissue conductivity), or a map of magnetization transfer characteristics of a tissue (e.g. magnetization transfer ratio (MTR), fractional pool-size, exchange rates measured for a brain), or any other voxel-wise quantifiable property related to a tissue. Preferentially, the property map is acquired by qMRI. Optionally, it is acquired by qMRI combined with one or several other imaging techniques (e.g. computed tomography (CT) or ultrasound imaging technique) capable of quantifying a tissue microstructural property. Said property map might also be a CT image of said biological object configured for providing a map of said tissue microstructural property or parameter. In particular, said property map might be obtained by combining quantitative measurements of different tissue microstructural properties, i.e. by combining different quantitative parameters measured for a same voxel of the tissue. In particular, said property map might be a 2-dimension (2D) or 3-dimension (3D) map. Preferentially, said property map is a quantitative map;
- determining, for at least a set of said voxels, a distance d , e.g. an Euclidean distance , separating each voxel (i.e. its position) of said set from a center of interest (i.e. from the position of a center of interest, wherein said center of interest can be for instance a closest lesion boundary with respect to the considered voxel, or a center of a lesion, etc.) so that each voxel of said set be associated to a measured value V and a determined distance d ;
- fitting, for said set of voxels, a function f to the measured values V expressed in function of the determined distance d in order to determine a set of fitting parameters ( β 1,...,βN ) with N a positive integer, N ≥ 1, preferentially N=2, i.e. solving

- determining or extracting, from said fit, the values of each fitting parameter ( β1 ,...,βN );
- outputting, via a second interface, the value of at least one of said fitting parameters ( β1 ,...,βN ).
- The present invention also concerns a system for characterizing a spatial distribution of a tissue microstructural property from quantitative imaging data, said system comprising:
- a first interface for receiving or acquiring a property map, e.g., a qMRI map, for a tissue of a biological object, wherein said property map comprises voxels whose intensity represents a measured value V of said microstructural property for said tissue;
- a memory for storing said property map;
- a control unit comprising a processor, the control unit being configured for
- Determining, for at least a set of said voxels, a distance d , e.g., a Euclidean distance, separating each voxel of said set from a center of interest so that each voxel of said set be associated to a measured value V and a determined distance d ;
- for said set of voxels, fitting a function f(β1,...,βN,d) to the measured values V along the determined distance d according to V(d) = f(β1,...,βN,d), wherein V(d) is the measured value V associated to a voxel of said set located at the determined distance d of said center of interest, and ( β1 ,... ,βN ) are fitting parameters;
- extracting, from said fit, the values of each fitting parameter ( β1 ,...,βN );
- a second interface, connected to the control unit, and configured for outputting the value of at least one of said fitting parameters ( β1 ,...,βN ). Said second interface might be the same as the first interface, and may comprise for instance a display connected to the control unit and configured for displaying the values of the fitting parameters ( β1 ,...,βN ).
- The present invention further concerns an imaging apparatus, e.g., an MRI apparatus, comprising the previously described system, wherein said imaging apparatus is typically configured for acquiring said property map or deriving it from existing sequences (i.e., z-score maps).
- Preferentially, said method comprises, and the control unit is configured for, comparing the value obtained for at least one of said fitting parameter, e.g. said outputted value, to a reference value. In particular, if a difference between said value, notably the outputted value, and the reference value is greater than a predefined threshold, then the method comprises automatically sending a warning signal. In other words, said comparison might be used for triggering an automatic sending of said warning signal.
- Optionally, said method comprises, and the control unit is configured for, automatically classifying the tissue in a class of tissue in function of the value of at least one of said fitting parameters, e.g. in function of the outputted value.
- Preferentially, if said microstructural property of the tissue is anisotropic, i.e. varies in the space in function of the location of the voxel, then the function f may further depend on different anisotropic directions within the tissue, and thus on the position of the voxel in addition to said distance d. For instance,
Equation 1 could be expressed as
r represents the position (e.g. the coordinates) of the voxel within a frame of reference, d is the determined distance between the position of said voxel and said center of interest, i.e. the position of said center of interest within said frame of reference. - In particular, said set of voxels might be obtained by applying a mask to the property map in order to select, by means of said mask, voxels belonging to a specific region of said biological object and which form said set. Such a mask configured for defining or selecting a specific region within a biological object as well as the technique used for applying such a mask to a map are known in the art and therefore do not need to be further described here. Alternatively, said set of voxels might be obtained by clustering the voxels of the property map, using for instance k-means clustering techniques.
- The foregoing has broadly outlined the features and technical advantages of the present disclosure so that those skilled in the art may better understand the detailed description that follows. Additional features and advantages of the disclosure will be described hereinafter that form the object of the claims. Those skilled in the art will appreciate that they may readily use the concept and the specific embodiment disclosed as a basis for modifying or designing other structures for carrying out the same purposes of the present disclosure. Those skilled in the art will also realize that such equivalent constructions do not depart from the spirit and scope of the disclosure as defined by the set of claims.
- For a more complete understanding of the present disclosure, and the advantages thereof, reference is now made to the following descriptions taken in conjunction with the accompanying drawings, wherein like numbers designate like objects, and in which:
-
Figure 1 illustrates a flowchart of a method for characterizing a spatial distribution of a microstructural property of a tissue from qMRI data according to the invention; -
Figure 2 illustrates a preferred embodiment of a system for characterizing a spatial distribution of a microstructural property of a tissue from qMRI data according to the invention; -
Figure 3 schematically represents a lesion surrounded by normal-appearing tissue; -
Figure 4 presents a graph of measured values V for T1 relaxation time in function of the distance d obtained for the lesion ofFig. 3 and fitted by a preferred function f according to the invention; -
Figures 5 & 6 present experimental results when applying the method according to the invention; -
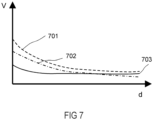
Figure 7 presents a schematic comparison of the fitting results for a same type of tissue. -
Figures 1 to 7 , discussed below, and the various embodiments used to describe the principles of the present disclosure in this patent document are by way of illustration only and should not be construed in any way to limit the scope of the disclosure. Those skilled in the art will understand that the principles of the present disclosure may be implemented in any suitably arranged device. The numerous innovative teachings of the present application will be described with reference to exemplary non-limiting embodiments. - We will now describe in more details the method according to the invention through
Figure 1 and2 , whereinFigure 1 describes the different steps of themethod 100 carried out by a preferred embodiment of thesystem 200 according to the invention which is illustrated byFigure 2 . - In
Figure 2 , acontrol unit 202 of thesystem 200 according to the invention is preferentially connected, for instance via a first interface, to a known in the art imaging apparatus, e.g. anMRI apparatus 201. While qMRI will be taken as concrete illustration of the present invention, other imaging apparatus might be connected to thesystem 200 according to the invention, as long as it can provide thesystem 200 with a property or quantitative map of a tissue microstructural property for a tissue of abiological object 206. - The
MRI apparatus 201 typically comprises different coils and respective coil controllers configured for generating magnetic fields and RF pulses in order to acquire an MRI signal from thebiological object 206, e.g. a brain, under investigation. Said MRI signal is transmitted by a receiver coil controller to thecontrol unit 202. The latter might be configured for reconstructing qMRI maps of thebiological object 206 from said MRI signal. In particular, thecontrol unit 202 might be configured for controlling theMRI apparatus 201 so that the latter performs MR imaging enabling an acquisition of qMRI maps. Alternatively or additionally, thecontrol unit 202 might be connected to a database or any other system for acquiring or receiving, e.g. via said first interface, a property map, e.g. a qMRI map, of the tissue microstructural property of said biological object. Saidcontrol unit 202 comprises typically amemory 203 and is connected to a second interface, e.g. adisplay 204 for displaying images reconstructed from the received MRI signal. Thesystem 200 according to the invention might also be part of theMRI apparatus 201. - According to the present invention, the
system 200 is configured for carrying out the following steps:
Atstep 110, thesystem 200, e.g. itscontrol unit 202, receives or acquires one or several property maps configured for mapping a microstructural property of a tissue of thebiological object 206. Said property maps are for instance qMRI maps 101 obtained from MRI scans of a brain according to known in the art techniques configured for providing quantitative MRI data. Said property map might by any map derived from a qMRI map, like a z-score map. - According to the present invention, the property map is a biological object map made of voxels, wherein the intensity value of each voxel is a measure of a tissue parameter (or property) obtained, for said
biological object 206, via a quantitative imaging technique, preferentially a qMRI technique. In particular, a qMRI map according to the invention is for instance: - T1 map, measuring T1 relaxation time;
- T2 map, measuring T2 relaxation time;
- T2* map, measuring T2* relaxation time;
- T1ρ map, measuring T1ρ relaxation time;
- MT (magnetization transfer), measuring tissue myelination;
- any diffusivity map, such as tissue fractional anisotropy;
- myelin water imaging, measuring tissue myelination;
- quantitative conductivity map, measuring tissue electrical conductivity;
- quantitative susceptibility map, measuring tissue magnetic susceptibility;
- quantitative elastography map, measuring tissue mechanical stiffness.
-
Figure 3 schematically represents an acquiredproperty map 301 for a tissue of a biological object. As shown inFig. 3 , the acquiredproperty map 301 may cover a region of thebiological object 206 that comprises alesion 302 surrounded by normal-appearingperilesional tissue 303. The present invention enables notably to characterize a microstructural property of saidperilesional tissue 303. - At
step 120, thesystem 200, e.g., itscontrol unit 202, determines or measures, for each voxel of a set of voxels within said property map, a distance d , which is preferentially a Euclidean distance, separating the concerned voxel of said set from a center of interest. Said set of voxels may comprise all voxels of the property map, or might be selected according to any known techniques, for instance by applying a mask to the acquired property map so as to select only a single type of tissue within the biological object, or only a part of the latter. At the end ofstep 120, each voxel of said set is thus associated to a distance d determined or measured for said voxel (i.e. if the set comprises for instance N voxels v1,...,vN, then to each voxel vi of the set, with i∈{1,...,N}, is associated a distance di ). Preferentially, said distance d is then stored, for each voxel of the set, in thememory 203 of thesystem 200 according to the invention. In the illustration of the invention presented inFigure 3 , the center of interest is preferentially a boundary of the lesion (i.e. the boundary between the lesion and the normal-appearing perilesional tissue), said distance d being the Euclidean distance between said boundary and the considered voxel. The center of interest can be the center of the lesion itself, or a border of the lesion (e.g., the closest border of the lesion) or a predefined spatial area in the biological object (e.g., a whole brain area such as the hippocampus or any other spatially defined region, e.g., periventricular region), or a specific anatomical landmark. - At
step 130, thesystem 200, notably itscontrol unit 202, is configured for fitting, for said set of voxels, a function f to the measured values V expressed in function of the determined distance d. This is better understood with the illustrations ofFig. 3 and 4 . Let's suppose that theproperty map 301 shown inFig. 3 is a T1 map of a brain region comprising thelesion 302. The (intensity) value V of each voxel of the map is thus a T1 relaxation time that has been measured at a specific position within the biological object. The set of voxels is then for instance the voxels comprised in the normal-appearing perilesional region (see theperilesional tissue 303 inFig. 3 ) surrounding thelesion 301. For each voxel of the set, the Euclidean distance d between the voxel and the border of the lesion has been measured by thecontrol unit 202 from the position of the voxel and the position of the border.Figure 4 shows then a graph representing the measured value V , i.e. the T1 relaxation time expressed in milliseconds in the present case, in function of the distance d expressed for instance in millimeter. This gives rise to a cloud of points that is then fitted by the function f according to V(d) = f(β1,...,βN,d) wherein fitting parameters ( β1 ,...,βN ) are the unknown in the equation, and have thus to be determined. In the example ofFig. 4 , f = β 0 · e -β1 d +β 2, giving rise to
control unit 202. The mathematical model used for fitting V(d) can be based on any type of function (like the exponential function presented in association withFig. 4 ), mathematical or geometrical transform or operation. - At
step 140, thesystem 200, preferably itscontrol unit 202, is configured for determining, from said fit, the values of each fitting parameter ( β1 ,...,βN ). For instance, according to the example provided inFig. 4 , thecontrol unit 202 will be configured for determining the value of the fitting parameters β0, β1, and β2. - At
step 150, thesystem 200, preferably itscontrol unit 202, is configured for outputting the value of at least one of said fitting parameters. For instance, thecontrol unit 202 may output the value of the fitting parameter β1 and use the latter for a comparison with a reference value or for performing group-wise comparisons, for instance for identifying clusters of fitting parameters or cluster of fits (i.e., of fitting curves) that are alike (e.g., the closest to a mean), using for instance a k-means clustering method. Indeed, as shown inFig. 5 and 6 , measured values of the relaxation time T1 in function of the distance d might differ when considering a first lesion (Figure 5 ) or a second lesion (Figure 6 ). Therefore, each lesion will present a different perilesional pattern (namely aperilesional pattern 1 for the first lesion and aperilesional pattern 2 for the second lesion, as illustrated in the presented graphs) that can be characterized by the fitting parameters whose values (which are metrics) enable to compare the obtained pattern with a reference pattern (i.e. with reference values for said fitting parameters). Such comparison is better illustrated inFig. 7 , wherein, for a same type of tissue, differentfitting curves - Finally, at
step 150, thesystem 200, notably itscontrol unit 202, is configured for displaying, via thedisplay 204, said at least one fitting parameter, for instance in association with a reference value. - An advantage of the present invention is that it is based on property maps. It relies thus on absolute physical parameters of the tissue, resulting in better comparability between longitudinal scans of the same patients, between multi-site acquisitions or between different cohorts of subjects (e.g., healthy vs. pathological patients) in comparison to conventional "weighted" imaging. In particular, it can be used for providing fitting parameter values independent from hardware and other spurious effects, enabling notably the creation of "normative values" for the fitting parameters which might be used for defining a range of normal values seen in "normal" tissue and that will thus characterize a "normal" spatial distribution of a microstructural property under analysis when considering a tissue of interest. A fitting parameter value obtained then for an individual patient can be checked against such normative values in order to determine if the spatial distribution of the microstructural property obtained for said patient is within the known range of normative values or not. This may for instance help to better characterize a disease and improve diagnosis, providing for instance support to a radiologist or other medical doctor for a clinical decision. In particular, the extracted or outputted fitting parameter(s) might be automatically classified in a class of tissue by the
control unit 202, wherein one or several classes of tissue (typically, several classes for a same type of tissue) are for instance predefined in thememory 203 of thesystem 200 in function of such range of normal values for the fitting parameter(s). - Finally, the previously described invention presents the following advantages with respect to prior art techniques:
- It proposes a direct estimation of a spatial pattern measured for a microstructural property of a tissue;
- It has an increased sensitivity with respect to prior techniques, wherein spatial patterns were estimated from an independent evaluation of different subregions. Indeed, since all voxels of the set are considered simultaneously to model the spatial pattern or distribution of the microstructural property, all information is persevered, achieving a higher sensitivity to the characterization of such pattern. This might allow, e.g., to distinguish more complex pathologies from each other;
- It enables to determine spatial patterns which might be associated to specific (sub-) pathologies, lesion types or alike. Indeed, a spatial pattern (i.e. a fitting parameter) obtained for a biological object under analysis that is different from a normal pattern can then be categorized within a category of a set of categories, wherein each category defines a biologically different spatial pattern. For instance, a lesion can be associated to a category of lesions within a set of lesion categories that each represents a biologically different lesion pathology. The proposed method aggregates complex information contained in the property map and gives it a biological/medical meaning, facilitating the diagnostic assessment based on the fitting parameters.
- To summarize, the present invention proposes to evaluate, within a tissue, a spatial distribution or pattern of a microstructural property of said tissue, wherein a mathematical model, i.e. said fitting function, is used for characterizing said spatial pattern from quantitative values acquired for said microstructural property, by associating each voxel of a property map acquired for said microstructural property with a continuous distance metric.
-
- MR
- magnetic resonance
- MRI
- magnetic resonance imaging
- qMRI
- quantitative magnetic resonance imaging
- CT
- computed tomography
-
- [1] Li, Xiaojuan, and Sharmila Majumdar. "Quantitative MRI of articular cartilage and its clinical applications." Journal of Magnetic Resonance Imaging 38.5 (2013): 991-1008.
- [2] Granziera, Cristina, et al. "Quantitative magnetic resonance imaging towards clinical application in multiple sclerosis." Brain 144.5 (2021): 1296-1311.
- [3] Vrenken, Hugo, et al., "Whole-Brain T1 Mapping in Multiple Sclerosis: Global Changes of Normal-appearing Gray and White Matter" Radiology (2006).
- [4] Vaneckova, Manuela et al., "Periventricular gradient of T1 tissue alterations in multiple sclerosis" Neuroimage:Clinical (2022).
- [5] Shi, Zhuowei, et al., "Microstructural alterations in different types of lesions and their perilesional white matter in relapsing-remitting multiple sclerosis based on diffusion kurtosis imaging", Multiple Sclerosis and Related Disorders (2023).
- [6] Wittayer, Matthias, et al., "Exploring (peri-) lesional and structural connectivity tissue damage through T1/T2-weighted ratio in iron rim multiple sclerosis lesions", Magnetic Resonance Imaging (2023).
Claims (12)
- A computer-implemented method (100) for characterizing a spatial distribution of a tissue microstructural property from quantitative imaging data, the method comprising- acquiring (110), for a biological object (206) and via a first interface, a property map for a tissue of said biological object (206), wherein said property map comprises voxels whose intensity represents a measured value V of said microstructural property for said tissue;- determining (120), for at least a set of said voxels, a distance d separating each voxel of said set from a center of interest so that each voxel of said set be associated to a measured value V and a determined distance d ;- fitting (130), for said set of voxels, a function f to the measured values V expressed in function of the determined distance d according to V(d) = f(β1,...,βN,d) in order to determine a set of fitting parameters ( β1 ,...,βN );- determining (140), from said fit, the values of each fitting parameter ( β1,...,βN );- outputting (150) the value of at least one of said fitting parameters.
- The computer-implemented method (100) of claim 1, comprising comparing the outputted value to a reference value.
- The computer implemented method (100) of claim 2, comprising automatically sending a warning signal if a difference between said outputted value and the reference value is greater than a predefined threshold.
- The computer-implemented method (100) according to one of the claims 1 to 3, comprising automatically classifying the tissue in a class of tissue in function of the value of at least one of said fitting parameters.
- The computer-implemented method (100) according to one of the claims 1 to 4, wherein the function f further depends on a position
r of the voxel within a frame of reference according to V(r , d) = f(β 1,...,βN,r , d) . - System (200) for characterizing a spatial distribution of a tissue microstructural property from quantitative imaging data, said system (200) comprising:- a first interface for receiving or acquiring a property map for a tissue of a biological object (206), wherein said property map comprises voxels whose intensity represents a measured value V of said microstructural property;- a memory (203) for storing said property map;- a control unit (202) comprising a processor, the control unit (203) being configured for carrying out the steps of the method according to claim 1;- a second interface, connected to the control unit (202), for outputting the value of at least one of said fitting parameters.
- System (200) according to claim 6, wherein the control unit (202) is further configured for comparing the outputted value to a reference value.
- System (200) according to claim 7, wherein the control unit (202) is further configured for automatically sending a warning signal if a difference between said outputted value and the reference value is greater than a predefined threshold.
- System (200) according to one of the claims 6-8, wherein the control unit (202) is further configured for automatically classifying the tissue in a class of tissue in function of the value of at least one of said fitting parameters.
- System (200) according to one of the claims 6-9, wherein the function f further depends on a position
r of the voxel within a frame of reference according to V(r ,d) = f(β 1 ,...,βN,r ,d ). - Imaging apparatus comprising the system according to one of the claims 6 to 10.
- Imaging apparatus according to claim 11, wherein said imaging apparatus is a Magnetic Resonance Imaging apparatus.
Priority Applications (2)
| Application Number | Priority Date | Filing Date | Title |
|---|---|---|---|
| EP23198152.3A EP4528305B1 (en) | 2023-09-19 | 2023-09-19 | Method and system for characterizing a spatial pattern for a microstructural property of a biological tissue |
| US18/889,640 US20250095154A1 (en) | 2023-09-19 | 2024-09-19 | Method and system for characterizing a spatial pattern for a microstructural property of a biological tissue |
Applications Claiming Priority (1)
| Application Number | Priority Date | Filing Date | Title |
|---|---|---|---|
| EP23198152.3A EP4528305B1 (en) | 2023-09-19 | 2023-09-19 | Method and system for characterizing a spatial pattern for a microstructural property of a biological tissue |
Publications (2)
| Publication Number | Publication Date |
|---|---|
| EP4528305A1 true EP4528305A1 (en) | 2025-03-26 |
| EP4528305B1 EP4528305B1 (en) | 2026-02-04 |
Family
ID=88098211
Family Applications (1)
| Application Number | Title | Priority Date | Filing Date |
|---|---|---|---|
| EP23198152.3A Active EP4528305B1 (en) | 2023-09-19 | 2023-09-19 | Method and system for characterizing a spatial pattern for a microstructural property of a biological tissue |
Country Status (2)
| Country | Link |
|---|---|
| US (1) | US20250095154A1 (en) |
| EP (1) | EP4528305B1 (en) |
Citations (4)
| Publication number | Priority date | Publication date | Assignee | Title |
|---|---|---|---|---|
| US20170309025A1 (en) * | 2016-04-21 | 2017-10-26 | The Trustees Of The University Of Pennsylvania | Vivo detection of egfr mutation in glioblastoma via mri signature consistent with deep peritumoral infiltration |
| US20170345149A1 (en) * | 2016-05-26 | 2017-11-30 | Synthetic Mr Ab | Method, device and non-transitory digital storage medium for non-aqueous tissue volume estimation |
| US20190370965A1 (en) * | 2017-02-22 | 2019-12-05 | The United States Of America, As Represented By The Secretary, Department Of Health And Human Servic | Detection of prostate cancer in multi-parametric mri using random forest with instance weighting & mr prostate segmentation by deep learning with holistically-nested networks |
| US20200015734A1 (en) * | 2017-12-05 | 2020-01-16 | Rulon Mayer | “One Stop Shop” for Prostate Cancer Staging using Imaging Biomarkers and Spatially Registered Multi-Parametric MRI |
-
2023
- 2023-09-19 EP EP23198152.3A patent/EP4528305B1/en active Active
-
2024
- 2024-09-19 US US18/889,640 patent/US20250095154A1/en active Pending
Patent Citations (4)
| Publication number | Priority date | Publication date | Assignee | Title |
|---|---|---|---|---|
| US20170309025A1 (en) * | 2016-04-21 | 2017-10-26 | The Trustees Of The University Of Pennsylvania | Vivo detection of egfr mutation in glioblastoma via mri signature consistent with deep peritumoral infiltration |
| US20170345149A1 (en) * | 2016-05-26 | 2017-11-30 | Synthetic Mr Ab | Method, device and non-transitory digital storage medium for non-aqueous tissue volume estimation |
| US20190370965A1 (en) * | 2017-02-22 | 2019-12-05 | The United States Of America, As Represented By The Secretary, Department Of Health And Human Servic | Detection of prostate cancer in multi-parametric mri using random forest with instance weighting & mr prostate segmentation by deep learning with holistically-nested networks |
| US20200015734A1 (en) * | 2017-12-05 | 2020-01-16 | Rulon Mayer | “One Stop Shop” for Prostate Cancer Staging using Imaging Biomarkers and Spatially Registered Multi-Parametric MRI |
Non-Patent Citations (5)
| Title |
|---|
| GRANZIERA, CRISTINA ET AL.: "Quantitative magnetic resonance imaging towards clinical application in multiple sclerosis", BRAIN, vol. 144, no. 5, 2021, pages 1296 - 1311, XP093075280, DOI: 10.1093/brain/awab029 |
| SHI, ZHUOWEI ET AL.: "Microstructural alterations in different types of lesions and their perilesional white matter in relapsing-remitting multiple sclerosis based on diffusion kurtosis imaging", MULTIPLE SCLEROSIS AND RELATED DISORDERS, 2023 |
| VANECKOVA, MANUELA ET AL.: "Periventricular gradient of T1 tissue alterations in multiple sclerosis", NEUROIMAGE:CLINICAL, 2022 |
| VRENKEN, HUGO ET AL.: "Whole-Brain T1 Mapping in Multiple Sclerosis: Global Changes of Normal-appearing Gray and White Matter", RADIOLOGY, 2006 |
| WITTAYER, MATTHIAS ET AL.: "Exploring (peri-) lesional and structural connectivity tissue damage through Tl/T2-weighted ratio in iron rim multiple sclerosis lesions", MAGNETIC RESONANCE IMAGING, 2023 |
Also Published As
| Publication number | Publication date |
|---|---|
| EP4528305B1 (en) | 2026-02-04 |
| US20250095154A1 (en) | 2025-03-20 |
Similar Documents
| Publication | Publication Date | Title |
|---|---|---|
| US11928827B2 (en) | Grading of structures for state determination | |
| Gerischer et al. | Combining viscoelasticity, diffusivity and volume of the hippocampus for the diagnosis of Alzheimer's disease based on magnetic resonance imaging | |
| Derakhshan et al. | Evaluation of automated techniques for the quantification of grey matter atrophy in patients with multiple sclerosis | |
| US20180344161A1 (en) | Medical instrument for analysis of white matter brain lesions | |
| Kitzler et al. | Deficient MWF mapping in multiple sclerosis using 3D whole-brain multi-component relaxation MRI | |
| US20160086326A1 (en) | Processing imaging data to obtain tissue type information | |
| Webb et al. | Automatic detection of hippocampal atrophy on magnetic resonance images | |
| Shen et al. | VBM lesion detection depends on the normalization template: a study using simulated atrophy | |
| Ertekin et al. | Total intracranial and lateral ventricle volumes measurement in Alzheimer’s disease: A methodological study | |
| WO2008027393A2 (en) | Computer aided detection of bone metastasis | |
| WO2013086026A1 (en) | System and method of automatically detecting tissue abnormalities | |
| US20240005506A1 (en) | Methods and systems for analyzing brain lesions with longitudinal 3d mri data | |
| Kunimatsu et al. | Utilization of diffusion tensor tractography in combination with spatial normalization to assess involvement of the corticospinal tract in capsular/pericapsular stroke: feasibility and clinical implications | |
| JP2006507902A (en) | System and method for magnetic resonance imaging for iron deposition in the brain | |
| JP2016504070A (en) | Quantifying tissue surface roughness based on image data and determining the presence of disease based on it | |
| EP4528305B1 (en) | Method and system for characterizing a spatial pattern for a microstructural property of a biological tissue | |
| Fein et al. | Controlling for premorbid brain size in imaging studies: T1-derived cranium scaling factor vs. T2-derived intracranial vault volume | |
| van Tuijl et al. | Reliability of velocity pulsatility in small vessels on 3tesla mri in the basal ganglia: A test–retest study | |
| Ellingson et al. | Gray and white matter delineation in the human spinal cord using diffusion tensor imaging and fuzzy logic | |
| US10657410B2 (en) | Method and system for abnormal tissue detection using z-scores in a joint histogram | |
| US20230316716A1 (en) | Systems and methods for automated lesion detection using magnetic resonance fingerprinting data | |
| Dore et al. | CapAIBL: automated reporting of cortical PET quantification without need of MRI on brain surface using a patch-based method | |
| EP3718468B1 (en) | Age-specific image atlas | |
| US20230320610A1 (en) | Method and system for estimating brain tissue damage within white matter tracts from a quantitative map | |
| CN112465739A (en) | Method and provision system for generating a surrogate marker based on medical image data |
Legal Events
| Date | Code | Title | Description |
|---|---|---|---|
| PUAI | Public reference made under article 153(3) epc to a published international application that has entered the european phase |
Free format text: ORIGINAL CODE: 0009012 |
|
| STAA | Information on the status of an ep patent application or granted ep patent |
Free format text: STATUS: THE APPLICATION HAS BEEN PUBLISHED |
|
| AK | Designated contracting states |
Kind code of ref document: A1 Designated state(s): AL AT BE BG CH CY CZ DE DK EE ES FI FR GB GR HR HU IE IS IT LI LT LU LV MC ME MK MT NL NO PL PT RO RS SE SI SK SM TR |
|
| STAA | Information on the status of an ep patent application or granted ep patent |
Free format text: STATUS: REQUEST FOR EXAMINATION WAS MADE |
|
| 17P | Request for examination filed |
Effective date: 20250923 |
|
| GRAP | Despatch of communication of intention to grant a patent |
Free format text: ORIGINAL CODE: EPIDOSNIGR1 |
|
| STAA | Information on the status of an ep patent application or granted ep patent |
Free format text: STATUS: GRANT OF PATENT IS INTENDED |
|
| RIC1 | Information provided on ipc code assigned before grant |
Ipc: G01R 33/56 20060101AFI20251030BHEP Ipc: G06T 7/00 20170101ALI20251030BHEP Ipc: G01R 33/50 20060101ALI20251030BHEP |
|
| INTG | Intention to grant announced |
Effective date: 20251110 |
|
| GRAS | Grant fee paid |
Free format text: ORIGINAL CODE: EPIDOSNIGR3 |
|
| GRAA | (expected) grant |
Free format text: ORIGINAL CODE: 0009210 |
|
| STAA | Information on the status of an ep patent application or granted ep patent |
Free format text: STATUS: THE PATENT HAS BEEN GRANTED |
|
| AK | Designated contracting states |
Kind code of ref document: B1 Designated state(s): AL AT BE BG CH CY CZ DE DK EE ES FI FR GB GR HR HU IE IS IT LI LT LU LV MC ME MK MT NL NO PL PT RO RS SE SI SK SM TR |
|
| REG | Reference to a national code |
Ref country code: CH Ref legal event code: F10 Free format text: ST27 STATUS EVENT CODE: U-0-0-F10-F00 (AS PROVIDED BY THE NATIONAL OFFICE) Effective date: 20260204 Ref country code: GB Ref legal event code: FG4D |
|
| REG | Reference to a national code |
Ref country code: DE Ref legal event code: R096 Ref document number: 602023011525 Country of ref document: DE |
|
| REG | Reference to a national code |
Ref country code: IE Ref legal event code: FG4D |