EP4517405A1 - Phase image acquisition method and quantitative data acquisition method - Google Patents
Phase image acquisition method and quantitative data acquisition method Download PDFInfo
- Publication number
- EP4517405A1 EP4517405A1 EP23815589.9A EP23815589A EP4517405A1 EP 4517405 A1 EP4517405 A1 EP 4517405A1 EP 23815589 A EP23815589 A EP 23815589A EP 4517405 A1 EP4517405 A1 EP 4517405A1
- Authority
- EP
- European Patent Office
- Prior art keywords
- phase
- phase image
- concave portion
- acquisition method
- image
- Prior art date
- Legal status (The legal status is an assumption and is not a legal conclusion. Google has not performed a legal analysis and makes no representation as to the accuracy of the status listed.)
- Granted
Links
Images


Classifications
-
- G—PHYSICS
- G03—PHOTOGRAPHY; CINEMATOGRAPHY; ANALOGOUS TECHNIQUES USING WAVES OTHER THAN OPTICAL WAVES; ELECTROGRAPHY; HOLOGRAPHY
- G03H—HOLOGRAPHIC PROCESSES OR APPARATUS
- G03H1/00—Holographic processes or apparatus using light, infrared or ultraviolet waves for obtaining holograms or for obtaining an image from them; Details peculiar thereto
- G03H1/26—Processes or apparatus specially adapted to produce multiple sub- holograms or to obtain images from them, e.g. multicolour technique
-
- G—PHYSICS
- G01—MEASURING; TESTING
- G01N—INVESTIGATING OR ANALYSING MATERIALS BY DETERMINING THEIR CHEMICAL OR PHYSICAL PROPERTIES
- G01N21/00—Investigating or analysing materials by the use of optical means, i.e. using sub-millimetre waves, infrared, visible or ultraviolet light
- G01N21/17—Systems in which incident light is modified in accordance with the properties of the material investigated
- G01N21/41—Refractivity; Phase-affecting properties, e.g. optical path length
- G01N21/45—Refractivity; Phase-affecting properties, e.g. optical path length using interferometric methods; using Schlieren methods
- G01N21/453—Holographic interferometry
-
- G—PHYSICS
- G01—MEASURING; TESTING
- G01N—INVESTIGATING OR ANALYSING MATERIALS BY DETERMINING THEIR CHEMICAL OR PHYSICAL PROPERTIES
- G01N15/00—Investigating characteristics of particles; Investigating permeability, pore-volume or surface-area of porous materials
- G01N15/01—Investigating characteristics of particles; Investigating permeability, pore-volume or surface-area of porous materials specially adapted for biological cells, e.g. blood cells
-
- G—PHYSICS
- G01—MEASURING; TESTING
- G01N—INVESTIGATING OR ANALYSING MATERIALS BY DETERMINING THEIR CHEMICAL OR PHYSICAL PROPERTIES
- G01N15/00—Investigating characteristics of particles; Investigating permeability, pore-volume or surface-area of porous materials
- G01N15/10—Investigating individual particles
- G01N15/14—Optical investigation techniques, e.g. flow cytometry
- G01N15/1434—Optical arrangements
-
- G—PHYSICS
- G01—MEASURING; TESTING
- G01N—INVESTIGATING OR ANALYSING MATERIALS BY DETERMINING THEIR CHEMICAL OR PHYSICAL PROPERTIES
- G01N33/00—Investigating or analysing materials by specific methods not covered by groups G01N1/00 - G01N31/00
- G01N33/02—Food
- G01N33/08—Eggs, e.g. by candling
-
- G—PHYSICS
- G02—OPTICS
- G02B—OPTICAL ELEMENTS, SYSTEMS OR APPARATUS
- G02B21/00—Microscopes
- G02B21/06—Means for illuminating specimens
- G02B21/08—Condensers
- G02B21/14—Condensers affording illumination for phase-contrast observation
-
- G—PHYSICS
- G03—PHOTOGRAPHY; CINEMATOGRAPHY; ANALOGOUS TECHNIQUES USING WAVES OTHER THAN OPTICAL WAVES; ELECTROGRAPHY; HOLOGRAPHY
- G03H—HOLOGRAPHIC PROCESSES OR APPARATUS
- G03H1/00—Holographic processes or apparatus using light, infrared or ultraviolet waves for obtaining holograms or for obtaining an image from them; Details peculiar thereto
- G03H1/04—Processes or apparatus for producing holograms
- G03H1/0486—Improving or monitoring the quality of the record, e.g. by compensating distortions, aberrations
-
- G—PHYSICS
- G03—PHOTOGRAPHY; CINEMATOGRAPHY; ANALOGOUS TECHNIQUES USING WAVES OTHER THAN OPTICAL WAVES; ELECTROGRAPHY; HOLOGRAPHY
- G03H—HOLOGRAPHIC PROCESSES OR APPARATUS
- G03H1/00—Holographic processes or apparatus using light, infrared or ultraviolet waves for obtaining holograms or for obtaining an image from them; Details peculiar thereto
- G03H1/04—Processes or apparatus for producing holograms
- G03H1/08—Synthesising holograms, i.e. holograms synthesized from objects or objects from holograms
- G03H1/0866—Digital holographic imaging, i.e. synthesizing holobjects from holograms
-
- C—CHEMISTRY; METALLURGY
- C12—BIOCHEMISTRY; BEER; SPIRITS; WINE; VINEGAR; MICROBIOLOGY; ENZYMOLOGY; MUTATION OR GENETIC ENGINEERING
- C12M—APPARATUS FOR ENZYMOLOGY OR MICROBIOLOGY; APPARATUS FOR CULTURING MICROORGANISMS FOR PRODUCING BIOMASS, FOR GROWING CELLS OR FOR OBTAINING FERMENTATION OR METABOLIC PRODUCTS, i.e. BIOREACTORS OR FERMENTERS
- C12M41/00—Means for regulation, monitoring, measurement or control, e.g. flow regulation
- C12M41/30—Means for regulation, monitoring, measurement or control, e.g. flow regulation of concentration
- C12M41/36—Means for regulation, monitoring, measurement or control, e.g. flow regulation of concentration of biomass, e.g. colony counters or by turbidity measurements
-
- G—PHYSICS
- G01—MEASURING; TESTING
- G01N—INVESTIGATING OR ANALYSING MATERIALS BY DETERMINING THEIR CHEMICAL OR PHYSICAL PROPERTIES
- G01N15/00—Investigating characteristics of particles; Investigating permeability, pore-volume or surface-area of porous materials
- G01N15/02—Investigating particle size or size distribution
- G01N15/0205—Investigating particle size or size distribution by optical means
- G01N15/0227—Investigating particle size or size distribution by optical means using imaging; using holography
-
- G—PHYSICS
- G01—MEASURING; TESTING
- G01N—INVESTIGATING OR ANALYSING MATERIALS BY DETERMINING THEIR CHEMICAL OR PHYSICAL PROPERTIES
- G01N15/00—Investigating characteristics of particles; Investigating permeability, pore-volume or surface-area of porous materials
- G01N15/10—Investigating individual particles
- G01N2015/1006—Investigating individual particles for cytology
-
- G—PHYSICS
- G01—MEASURING; TESTING
- G01N—INVESTIGATING OR ANALYSING MATERIALS BY DETERMINING THEIR CHEMICAL OR PHYSICAL PROPERTIES
- G01N15/00—Investigating characteristics of particles; Investigating permeability, pore-volume or surface-area of porous materials
- G01N15/10—Investigating individual particles
- G01N15/14—Optical investigation techniques, e.g. flow cytometry
- G01N15/1434—Optical arrangements
- G01N2015/1454—Optical arrangements using phase shift or interference, e.g. for improving contrast
-
- G—PHYSICS
- G02—OPTICS
- G02B—OPTICAL ELEMENTS, SYSTEMS OR APPARATUS
- G02B21/00—Microscopes
- G02B21/32—Micromanipulators structurally combined with microscopes
-
- G—PHYSICS
- G03—PHOTOGRAPHY; CINEMATOGRAPHY; ANALOGOUS TECHNIQUES USING WAVES OTHER THAN OPTICAL WAVES; ELECTROGRAPHY; HOLOGRAPHY
- G03H—HOLOGRAPHIC PROCESSES OR APPARATUS
- G03H1/00—Holographic processes or apparatus using light, infrared or ultraviolet waves for obtaining holograms or for obtaining an image from them; Details peculiar thereto
- G03H1/04—Processes or apparatus for producing holograms
- G03H1/0443—Digital holography, i.e. recording holograms with digital recording means
-
- G—PHYSICS
- G03—PHOTOGRAPHY; CINEMATOGRAPHY; ANALOGOUS TECHNIQUES USING WAVES OTHER THAN OPTICAL WAVES; ELECTROGRAPHY; HOLOGRAPHY
- G03H—HOLOGRAPHIC PROCESSES OR APPARATUS
- G03H1/00—Holographic processes or apparatus using light, infrared or ultraviolet waves for obtaining holograms or for obtaining an image from them; Details peculiar thereto
- G03H1/0005—Adaptation of holography to specific applications
- G03H2001/0033—Adaptation of holography to specific applications in hologrammetry for measuring or analysing
- G03H2001/0038—Adaptation of holography to specific applications in hologrammetry for measuring or analysing analogue or digital holobjects
-
- G—PHYSICS
- G03—PHOTOGRAPHY; CINEMATOGRAPHY; ANALOGOUS TECHNIQUES USING WAVES OTHER THAN OPTICAL WAVES; ELECTROGRAPHY; HOLOGRAPHY
- G03H—HOLOGRAPHIC PROCESSES OR APPARATUS
- G03H1/00—Holographic processes or apparatus using light, infrared or ultraviolet waves for obtaining holograms or for obtaining an image from them; Details peculiar thereto
- G03H1/0005—Adaptation of holography to specific applications
- G03H2001/005—Adaptation of holography to specific applications in microscopy, e.g. digital holographic microscope [DHM]
-
- G—PHYSICS
- G03—PHOTOGRAPHY; CINEMATOGRAPHY; ANALOGOUS TECHNIQUES USING WAVES OTHER THAN OPTICAL WAVES; ELECTROGRAPHY; HOLOGRAPHY
- G03H—HOLOGRAPHIC PROCESSES OR APPARATUS
- G03H2210/00—Object characteristics
- G03H2210/10—Modulation characteristics, e.g. amplitude, phase, polarisation
- G03H2210/12—Phase modulating object, e.g. living cell
Definitions
- the disclosed technology relates to a phase image acquisition method and a quantitative data acquisition method.
- JP2018-516591A describes a cell culture incubator including an incubator cabinet including an internal chamber for incubating cells in a cell culture container and a holographic imager configured to image the cells in the internal chamber.
- a phase image generated based on a hologram image (interference image) formed by interference between object light transmitted through a cell and reference light coherent to the object light is an image showing a phase distribution of the object light transmitted through the cell, and a state of the cell is reflected. Accordingly, it is possible to perform quality evaluation of the cell based on the phase image. For example, a total phase amount obtained by integrating a phase amount for each pixel of the phase image can be used as quantitative data for evaluating the cell.
- the phase image of the cell can be acquired in a state where the cell is accommodated in a concave portion (well) provided in a dish (container) with a bottom surface of the concave portion being inclined.
- a phase component derived from the inclination of the bottom surface of the concave portion is superimposed.
- the phase component derived from the bottom surface of the concave portion is, so to speak, noise, and causes a decrease in the accuracy of the quantitative data obtained from the phase image.
- the disclosed technology has been made in view of the above points, and an object of the disclosed technology is to appropriately remove unnecessary phase components from the phase image of the object.
- a phase image acquisition method includes: acquiring a hologram image of an object in a state where the object is accommodated in a concave portion provided in a container with a bottom surface of the concave portion being curved; generating a phase image from the hologram image; and performing processing of subtracting a phase component derived from a polynomial indicating a shape of the bottom surface of the concave portion from the phase image to acquire a processed phase image.
- a degree of the polynomial is 2 or more and 7 or less. It is preferable that a change amount in a height of the bottom surface of the concave portion in the phase image is 10 ⁇ m or more.
- the object may be, for example, a cell or a cell aggregate.
- the cell or the cell aggregate may be a fertilized egg of an animal.
- the phase image acquisition method may further include: acquiring a phase image of the cell or the cell aggregate cultured in a state of being accommodated in the concave portion.
- a quantitative data acquisition method is a method for acquiring quantitative data using the above-described phase image acquisition method, the quantitative data acquisition method includes: deriving quantitative data indicating a state of the cell or the cell aggregate based on the processed phase image.
- a phase image acquisition method includes: a first step of acquiring a hologram image of an object in a state where the object is accommodated in a concave portion provided in a container with a bottom surface of the concave portion being curved; a second step of generating a phase image from the hologram image; and a third step of performing processing (background removal processing) of subtracting a phase component derived from a polynomial according to a shape of the bottom surface of the concave portion from the phase image to acquire a processed phase image.
- the object to be acquired as the phase image is a fertilized egg of an animal
- the fertilized egg may be developed to a state of an embryo.
- the phase image acquisition method according to the disclosed technology can be used, for example, for the purpose of quality management, quality evaluation, quality inspection, or quality prediction of the fertilized eggs.
- Fig. 1 is a diagram showing an example of a culture state of a fertilized egg 200.
- the fertilized egg 200 is cultured in a state of being accommodated in a concave portion 110 provided in a container 100.
- the container 100 may include a plurality of the concave portions 110, and the fertilized eggs 200 may be accommodated in each of the plurality of concave portions 110.
- the container 100 may be, for example, a commercially available dish or petri dish.
- the concave portion 110 may be a well provided in a dish or a petri dish.
- 38Special GPS registered trademark manufactured by CooperSurgical, Inc. can be suitably used.
- Culture medium 210 is accommodated in the concave portion 110 together with the fertilized egg 200, and the fertilized egg 200 is cultured in a state of being immersed in the culture medium 210 in the concave portion 110.
- the bottom surface 120 of the concave portion 110 is curved of which the height at a center portion 121 is the lowest and is inclined in a direction that gently rises from the center portion 121 toward the outside.
- the shape of the bottom surface 120 of the concave portion 110 may be a spherical shape.
- the fertilized egg 200 In a case of acquiring a hologram image of the fertilized egg 200, it is necessary to capture the fertilized egg 200 with a microscope. It is preferable to suppress the movement amount of the fertilized egg 200 in order to maintain a state where the fertilized egg 200 is within the visual field of the microscope. In a case where the fertilized egg 200 is disposed on a flat surface, the fertilized egg 200 swings due to convection or the like caused by heating of the culture medium, and it is difficult to maintain the state where the fertilized egg 200 is within the visual field of the microscope.
- the fertilized egg 200 can be disposed in the vicinity of the center portion 121, and the movement amount of the fertilized egg 200 can be suppressed.
- the hologram image of the fertilized egg 200 is acquired.
- the hologram image of the fertilized egg 200 is acquired in a state where the fertilized egg 200 is accommodated in the concave portion 110.
- Fig. 2 is a diagram showing an example of a configuration of a holography apparatus 10 used for acquiring the hologram image.
- the holography apparatus 10 includes a splitter 21, reflection mirrors 22 and 24, an objective lens 23, an imaging lens 25, a combiner 26, and an imaging apparatus 30.
- the fertilized egg 200 as the imaging target is disposed between the reflection mirror 22 and the objective lens 23 in a state of being accommodated in the concave portion 110 of the container 100 together with the culture medium.
- a HeNe laser having a wavelength of 632.8 nm can be used as a laser light source 20.
- Laser light L0 which linearly polarized light emitted from the laser light source 20 is divided into two laser light rays by the splitter 21.
- One of the two laser light rays is object light L1 and the other is reference light L2.
- a beam splitter can be used as the splitter 21.
- the object light L1 is incident on the reflection mirror 22.
- the fertilized eggs 200 are irradiated with the object light L1 of which a traveling direction is bent by the reflection mirror 22.
- the object light L1 is irradiated in a direction that penetrates the bottom surface 120 of the concave portion 110.
- An image formed by the object light L1 transmitted through the fertilized egg 200 is magnified by the objective lens 23.
- the object light L1 transmitted through the objective lens 23 is bent in a traveling direction by the reflection mirror 24 and is incident on the combiner 26 through the imaging lens 25.
- the reference light L2 is also incident on the combiner 26.
- the object light L1 and the reference light L2 are combined by the combiner 26 and are imaged on an imaging surface of the imaging apparatus 30.
- a beam splitter can be used as the combiner 26.
- the hologram image which is the interference image generated by the interference between the object light L1 and the reference light L2, is imaged by the imaging apparatus 30.
- the imaging apparatus 30 comprises an imaging element such as a complementary metal-oxide-semiconductor (CMOS) image sensor, and generates image data of the hologram image.
- CMOS complementary metal-oxide-semiconductor
- the hologram image of the fertilized egg 200 acquired by the imaging apparatus 30 is trimmed to have a size of, for example, 2048 ⁇ 2048, and is then subjected to a two-dimensional Fourier transform.
- a Fourier-transformed image obtained by this processing may include an image based on direct light, object light, and conjugated light.
- a position of the object light is specified by specifying a deviation amount of the object light with respect to the direct light in the Fourier-transformed image, and, for example, a complex amplitude component of only the object light is extracted by frequency filtering processing using a mask of a circular opening having a radius of 250 pixels.
- an angular spectrum method is applied to restore the image showing the phase of the fertilized egg 200 at any spatial position.
- an angular spectrum U(f x , f y ; 0) of the Fourier-transformed image of a wave front u(x, y; 0) captured by the imaging surface of the imaging apparatus 30 is obtained.
- the angular spectrum U(f x , f y ; 0) is multiplied by a transfer function H(f x , f y ; z), and thus, a wave front at any position z in an optical axis direction (z direction) is reproduced.
- the transfer function H(f x , f y ; z) is a frequency response function (Fourier transform of an impulse response function (green function)).
- Equation (2) an inverse Fourier transform is performed on a wave front U(f x , f y ; z) at the position z in the optical axis direction (z direction), and thus, a solution u(x, y; z) at the position z is derived.
- phase image is generated by deriving a phase ⁇ for u(x, y; z) as represented in Equation (3) below.
- ⁇ arctan Im u Re u
- phase in the phase image before unwrapping obtained by the above processing is convolved to a value of 0 to 2 ⁇ . Therefore, for example, a phase connection (unwrapping) method such as unweighted least squares or Flynn's algorithm is applied to connect the portions of 2 ⁇ or more. It should be noted that, many unwrapping methods have been proposed, and an appropriate method that does not cause phase mismatch may be appropriately selected.
- Fig. 3 is a diagram showing an example of a phase image before unwrapping of the fertilized egg 200.
- a phase component derived from the inclination of the bottom surface 120 of the concave portion 110 is superimposed on the phase image.
- the phase component derived from the bottom surface 120 of the concave portion 110 is, so to speak, noise, and causes a decrease in the accuracy of the quantitative data obtained from the phase image.
- the phase component derived from the bottom surface 120 of the concave portion 110 is removed by the background removal processing described below.
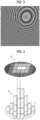
- Fig. 4 is a diagram showing a concept of a phase image I P .
- a phase amount at each pixel k of the phase image I P is three-dimensionally displayed.
- the phase amount at each pixel j of the phase image I P is shown on a plane in gray scale.
- phase amount at each pixel j of the phase image I P is denoted by P S and the phase of the background (region where the fertilized egg 200 is not present) present in the same focal plane is denoted by P B
- the background removal processing can be represented by Equation (4) below.
- phase in the present specification is a phase of an electric field amplitude in a case where light is regarded as an electromagnetic wave, and is used in a more general sense.
- the phase P B of the background is a phase component derived from the bottom surface 120 of the concave portion 110. Therefore, the phase P B of the background can be calculated by specifying the shape of the bottom surface 120 of the concave portion 110. Since the bottom surface 120 of the concave portion 110 is curved, it is possible to perform function fitting with a degree of a polynomial of 2 or more on the shape of the bottom surface 120 of the concave portion 110.
- the function fitting can be performed, for example, by acquiring a profile of the shape of the bottom surface 120 of the concave portion 110 by actual measurement and searching for a polynomial approximating the acquired profile.
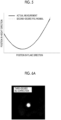
- Fig. 5 is a diagram showing an example of function fitting performed on the shape of the bottom surface 120 of the concave portion 110.
- a horizontal axis indicates a position of the concave portion 110 in the plane direction
- a vertical axis indicates a position of the concave portion 110 in the height direction.
- a dotted line is a curve defined by a second-degree polynomial indicating the shape of the bottom surface 120 of the concave portion 110
- a solid line is a profile obtained by actually measuring the shape of the bottom surface 120 of the concave portion 110. It can be seen that the solid line and the dotted line substantially coincide with each other.
- the shape of the bottom surface 120 of the concave portion 110 can be described by a degree of a polynomial of 2 or more.
- the phase P B of the background that is, the phase component derived from the bottom surface 120 of the concave portion 110 can be derived from a polynomial indicating the shape of the bottom surface 120 of the concave portion 110.
- the phase P B of the background is represented by Equation (5) below.
- x is a distance from the center portion 121 of the concave portion 110.
- m is a degree of the polynomial.
- a k is a coefficient of each term and can be obtained from the polynomial indicating the shape of the bottom surface 120 of the concave portion 110.
- Equation (6) n s is a refractive index of the container 100
- n m is a refractive index of the culture medium
- ⁇ is a wavelength of the object light in the hologram optical system.
- P B x n s ⁇ n m ⁇ C x ⁇ ⁇ 2 ⁇
- phase component derived from the polynomial indicating the shape of the bottom surface 120 of the concave portion 110 is subtracted from the phase amount of each pixel in the phase image obtained in the second step.
- a phase image from which the phase component derived from the bottom surface 120 of the concave portion 110 is removed is acquired.
- the phase P B of the background that is, the phase image from which the phase component derived from the bottom surface 120 of the concave portion 110 is removed will be referred to as a "processed phase image" below.
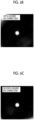
- Figs. 6A , 6B, and 6C are diagrams showing examples of the processed phase images.
- Fig. 6A is a processed phase image in a case where the function fitting is performed with the degree of the polynomial indicating the shape of the bottom surface 120 of the concave portion 110 set to 3.
- Fig. 6B is a processed phase image in a case where the function fitting is performed with the degree of the polynomial indicating the shape of the bottom surface 120 of the concave portion 110 set to 5.
- Fig. 6C is a processed phase image in a case where the function fitting is performed with the degree of the polynomial indicating the shape of the bottom surface 120 of the concave portion 110 set to 7.
- Figs. 6A to 6C by performing the background removal processing, a processed phase image from which the phase component derived from the bottom surface 120 of the concave portion 110 is removed and only the fertilized egg 200 is extracted can be acquired.
- Fig. 7 is a diagram showing an example of a container 100X according to a comparative example.
- the container 100X is different from the container 100 (see Fig. 1 ) according to the embodiment of the disclosed technology in that the bottom surface 120 of a concave portion 110X is non-curved. That is, the inclination of the bottom surface 120X of the concave portion 110X according to the comparative example is linear.
- the error in the function fitting is an error of the phase P B of the background derived based on the polynomial, in a case where the container 100X according to the comparative example is used, it is difficult to appropriately remove the phase component derived from the bottom surface 120X of the concave portion 110X.
- the bottom surface 120 of the concave portion 110 of the container 100 is a curved surface of which the height at the center portion 121 is the lowest and is gently inclined toward the outside from the center portion 121, it is possible to perform high-accuracy function fitting on the shape of the bottom surface 120 of the concave portion 110 (see Fig. 5 ). That is, according to the phase image acquisition method according to the embodiment of the disclosed technology, it is possible to appropriately remove unnecessary phase components from the phase image of the object.
- the degree of the polynomial indicating the shape of the bottom surface 120 of the concave portion 110 is 2 or more and 7 or less.
- the degree of the polynomial By setting the degree of the polynomial to 2 or more, it is possible to describe the curved surface by the polynomial.
- the degree of the polynomial By setting the degree of the polynomial to 7 or less, it is possible to perform high-accuracy function fitting on the shape of the bottom surface 120 of the concave portion 110, and it is possible to appropriately remove the phase component derived from the bottom surface 120 of the concave portion 110. In a case where the degree of the polynomial is 8 or more, an error tends to occur in the function fitting.
- the change amount ⁇ h in the height of the bottom surface 120 of the concave portion 110 in the phase image (within the visualization range of the phase image) is 10 ⁇ m or more.
- the change amount ⁇ h is 10 ⁇ m or more, it is possible to perform the function fitting of the shape of the bottom surface 120 of the concave portion 110 with high accuracy, and it is possible to appropriately remove the phase component derived from the bottom surface 120 of the concave portion 110.
- the method of deriving quantitative data according to the embodiment of the disclosed technology uses the above-described phase image acquisition method. That is, the quantitative data derivation method is a method of deriving the quantitative data indicating the state of the fertilized egg 200 based on the processed phase image acquired by performing the above-described phase image acquisition method.
- the quantitative data derivation method according to the present embodiment will be described in detail below.
- the phase amount P j at each pixel j of the processed phase image can be represented by Equation (7) below.
- n j is a refractive index of the fertilized egg 200 in a part corresponding to each pixel j of the processed phase image
- d j is a thickness of the fertilized egg 200 in the part corresponding to each pixel j of the processed phase image
- ⁇ is a wavelength of the object light in the hologram optical system.
- the processed phase image of the fertilized egg 200 is an image showing a phase distribution of the object light L1 transmitted through the fertilized egg 200, and is also an image showing an optical path length distribution of the object light transmitted through the fertilized egg 200. Since the optical path length in the fertilized egg 200 corresponds to the product of the refractive index of the fertilized egg 200 and the thickness of the fertilized egg 200, the processed phase image of the fertilized egg 200 includes information on the refractive index and the thickness (shape) of the fertilized egg 200 as represented in Equation (7). Since the processed phase image of the fertilized egg 200 reflects the internal state of the fertilized egg 200, it is possible to perform quality evaluation of the fertilized egg 200 based on the processed phase image.
- the total phase amount P A represented by Equation (8) below can be used as the quantitative data indicating the state of the fertilized egg 200.
- s is an area of each pixel j of the processed phase image
- v j is a volume of the fertilized egg 200 in the part corresponding to each pixel j of the processed phase image.
- the total phase amount P A corresponds to the amount obtained by integrating the phase amount P j for each pixel of the processed phase image for all the pixels j.
- the pixel value of the processed phase image corresponds to the phase amount P j .
- the quality of the fertilized egg 200 can be determined by performing the threshold value determination on the total phase amount P A derived based on the processed phase image.
- the accuracy of the quantitative data can be enhanced, and the evaluation of the fertilized egg 200 can be appropriately performed.
- the quantitative data derived based on the phase image is not limited to the total phase amount P A .
- statistical values such as a maximum value, a minimum value, a median value, an average value, a variance, and a standard deviation of the pixel values (phase amounts P j ) of the processed phase images can also be used as the quantitative data.
- a phase density which is a value obtained by dividing the total phase amount P A by the volume of the fertilized egg 200, can also be used as the quantitative data.
- the object from which the phase image is acquired is a fertilized egg
- the object may be a cell or a cell aggregate other than the fertilized egg.
- the disclosed technology can be applied to a case of acquiring a phase image of an induced pluripotent stem cell (iPS cell) or a spheroid which is an aggregate thereof.
- the object from which the phase image is acquired may be an artificial object.
- the mouse embryos are cultured for 5 days using the dish shown in Table 1 below.
- the shape of the bottom surface of the concave portion (well) provided in each dish is shown in Table 1.
- the bottom surface of the concave portion of the dish according to Examples 1 and 2 is curved as shown in Fig. 1 .
- the dish according to Comparative Example 1 is a dish having a flat bottom surface without a concave portion.
- the bottom surface of the concave portion of the dish according to Comparative Example 2 is non-curved in which the inclination is linear as shown in Fig. 7 .
- a hologram image of the mouse embryo is acquired, and a phase image is acquired from the hologram image.
- phase images of the mouse embryos acquired in each of the examples and the comparative examples are subjected to background removal processing.
- Examples 1 and 2 in which the bottom surface of the concave portion (well) is curved, the function fitting with a fifth-degree polynomial is performed on the shape of the bottom surface of the concave portion.
- Comparative Example 2 in which the bottom surface of the concave portion is non-curved, the function fitting with a first-degree polynomial is performed on the shape of the bottom surface of the concave portion.
- a processed phase image is acquired by removing the phase component derived from these polynomials from the phase image.
- Comparative Example 1 in which the bottom surface of the dish is flat, the background removal processing is not performed.
- the movement amount of the mouse embryo during the culture period is measured.
- the position of the mouse embryo at the time of the start of the culture is defined as the initial position, and the distance from the initial position of the position of the mouse embryo in a case where the mouse embryo is moved to a position farthest from the initial position during the culture period is defined as the movement amount.
- the measured values of the movement amount are shown in Table 1. Since the dishes according to Example 1, Example 2, and Comparative Example 2 comprise the concave portion having the inclined bottom surface, the movement amount of the mouse embryo is suppressed. On the other hand, in a case where the dish according to Comparative Example 1 having a flat bottom surface is used, the movement amount of the mouse embryo is the largest.
- a phase measurement error is acquired for the processed phase images acquired for each of the examples and the comparative examples.
- the total phase amount P A represented by Equation (8) is repeatedly measured 100 times with respect to the same mouse embryo immediately after the start of the culture.
- a value obtained by dividing the width of the phase amount at which the variation of the total phase amount P A is ⁇ 1 ⁇ by the average value of the total phase amount P A is defined as a phase measurement error.
- ⁇ is a standard deviation.
- the measured values of the phase measurement error are shown in Table 1.
- a phase image acquisition method including:
- the phase image acquisition method further including: acquiring a phase image of the cell or the cell aggregate cultured in a state of being accommodated in the concave portion.
- a quantitative data acquisition method using the phase image acquisition method according to Supplementary Note 4 or 5 including: deriving quantitative data indicating a state of the cell or the cell aggregate based on the processed phase image.
- JP2022-091056 filed on June 3, 2022 is incorporated herein by reference in its entirety.
- all documents, patent applications, and technical standards described in the specification are incorporated herein by references to the same extent as the incorporation of the individual documents, patent applications, and technical standards by references are described specifically and individually.
Landscapes
- Chemical & Material Sciences (AREA)
- Physics & Mathematics (AREA)
- General Physics & Mathematics (AREA)
- Life Sciences & Earth Sciences (AREA)
- Health & Medical Sciences (AREA)
- Analytical Chemistry (AREA)
- Biochemistry (AREA)
- General Health & Medical Sciences (AREA)
- Immunology (AREA)
- Pathology (AREA)
- Dispersion Chemistry (AREA)
- Engineering & Computer Science (AREA)
- Food Science & Technology (AREA)
- Optics & Photonics (AREA)
- Medicinal Chemistry (AREA)
- Apparatus Associated With Microorganisms And Enzymes (AREA)
Abstract
Description
- The disclosed technology relates to a phase image acquisition method and a quantitative data acquisition method.
- The following technology is known as a technology for monitoring cells using a holography technology. For example,
JP2018-516591A - A phase image generated based on a hologram image (interference image) formed by interference between object light transmitted through a cell and reference light coherent to the object light is an image showing a phase distribution of the object light transmitted through the cell, and a state of the cell is reflected. Accordingly, it is possible to perform quality evaluation of the cell based on the phase image. For example, a total phase amount obtained by integrating a phase amount for each pixel of the phase image can be used as quantitative data for evaluating the cell.
- The phase image of the cell can be acquired in a state where the cell is accommodated in a concave portion (well) provided in a dish (container) with a bottom surface of the concave portion being inclined. In the phase image of the cell acquired in this state, a phase component derived from the inclination of the bottom surface of the concave portion is superimposed. The phase component derived from the bottom surface of the concave portion is, so to speak, noise, and causes a decrease in the accuracy of the quantitative data obtained from the phase image.
- The disclosed technology has been made in view of the above points, and an object of the disclosed technology is to appropriately remove unnecessary phase components from the phase image of the object.
- A phase image acquisition method according to the disclosed technology includes: acquiring a hologram image of an object in a state where the object is accommodated in a concave portion provided in a container with a bottom surface of the concave portion being curved; generating a phase image from the hologram image; and performing processing of subtracting a phase component derived from a polynomial indicating a shape of the bottom surface of the concave portion from the phase image to acquire a processed phase image.
- It is preferable that a degree of the polynomial is 2 or more and 7 or less. It is preferable that a change amount in a height of the bottom surface of the concave portion in the phase image is 10 µm or more.
- The object may be, for example, a cell or a cell aggregate. The cell or the cell aggregate may be a fertilized egg of an animal.
- The phase image acquisition method according to an embodiment of the disclosed technology may further include: acquiring a phase image of the cell or the cell aggregate cultured in a state of being accommodated in the concave portion.
- A quantitative data acquisition method according to the disclosed technology is a method for acquiring quantitative data using the above-described phase image acquisition method, the quantitative data acquisition method includes: deriving quantitative data indicating a state of the cell or the cell aggregate based on the processed phase image.
- According to the disclosed technology, it is possible to appropriately remove unnecessary phase components from the phase image of the object.
-
-
Fig. 1 is a diagram showing an example of a culture state of a fertilized egg according to an embodiment of the disclosed technology. -
Fig. 2 is a diagram showing an example of a configuration of a holography apparatus according to the embodiment of the disclosed technology. -
Fig. 3 is a diagram showing an example of a phase image before unwrapping of the fertilized egg according to the embodiment of the disclosed technology. -
Fig. 4 is a diagram showing a concept of the phase image according to the embodiment of the disclosed technology. -
Fig. 5 is a diagram showing an example of function fitting performed on a shape of a bottom surface of a concave portion according to the embodiment of the disclosed technology. -
Fig. 6A is a diagram showing an example of a processed phase image according to the embodiment of the disclosed technology. -
Fig. 6B is a diagram showing an example of a processed phase image according to the embodiment of the disclosed technology. -
Fig. 6C is a diagram showing an example of a processed phase image according to the embodiment of the disclosed technology. -
Fig. 7 is a diagram showing an example of a configuration of a container according to a comparative example. -
Fig. 8 is a diagram showing a change amount in a height of the bottom surface of the concave portion according to the embodiment of the disclosed technology. - Hereinafter, an example of embodiments of the disclosed technology will be described with reference to the drawings. It should be noted that the same or equivalent components and portions in the drawings are assigned by the same reference numerals, and the overlapping description will be omitted.
- A phase image acquisition method according to an embodiment of the disclosed technology includes: a first step of acquiring a hologram image of an object in a state where the object is accommodated in a concave portion provided in a container with a bottom surface of the concave portion being curved; a second step of generating a phase image from the hologram image; and a third step of performing processing (background removal processing) of subtracting a phase component derived from a polynomial according to a shape of the bottom surface of the concave portion from the phase image to acquire a processed phase image.
- Each of the first to third steps will be described in detail below. In the present embodiment, a case where the object to be acquired as the phase image is a fertilized egg of an animal will be described as an example. The fertilized egg may be developed to a state of an embryo. The phase image acquisition method according to the disclosed technology can be used, for example, for the purpose of quality management, quality evaluation, quality inspection, or quality prediction of the fertilized eggs.
-
Fig. 1 is a diagram showing an example of a culture state of a fertilizedegg 200. The fertilizedegg 200 is cultured in a state of being accommodated in aconcave portion 110 provided in acontainer 100. Thecontainer 100 may include a plurality of theconcave portions 110, and the fertilizedeggs 200 may be accommodated in each of the plurality ofconcave portions 110. Thecontainer 100 may be, for example, a commercially available dish or petri dish. Theconcave portion 110 may be a well provided in a dish or a petri dish. As thecontainer 100, for example, 38Special GPS (registered trademark) manufactured by CooperSurgical, Inc. can be suitably used. -
Culture medium 210 is accommodated in theconcave portion 110 together with the fertilizedegg 200, and the fertilizedegg 200 is cultured in a state of being immersed in theculture medium 210 in theconcave portion 110. Thebottom surface 120 of theconcave portion 110 is curved of which the height at acenter portion 121 is the lowest and is inclined in a direction that gently rises from thecenter portion 121 toward the outside. The shape of thebottom surface 120 of theconcave portion 110 may be a spherical shape. - In a case of acquiring a hologram image of the fertilized
egg 200, it is necessary to capture the fertilizedegg 200 with a microscope. It is preferable to suppress the movement amount of the fertilizedegg 200 in order to maintain a state where the fertilizedegg 200 is within the visual field of the microscope. In a case where the fertilizedegg 200 is disposed on a flat surface, the fertilizedegg 200 swings due to convection or the like caused by heating of the culture medium, and it is difficult to maintain the state where the fertilizedegg 200 is within the visual field of the microscope. Since thebottom surface 120 of theconcave portion 110 has an inclination such that the height at thecenter portion 121 is the lowest, the fertilizedegg 200 can be disposed in the vicinity of thecenter portion 121, and the movement amount of the fertilizedegg 200 can be suppressed. - In the first step, the hologram image of the fertilized
egg 200 is acquired. The hologram image of the fertilizedegg 200 is acquired in a state where the fertilizedegg 200 is accommodated in theconcave portion 110.Fig. 2 is a diagram showing an example of a configuration of aholography apparatus 10 used for acquiring the hologram image. - The
holography apparatus 10 includes asplitter 21,reflection mirrors objective lens 23, animaging lens 25, acombiner 26, and animaging apparatus 30. The fertilizedegg 200 as the imaging target is disposed between thereflection mirror 22 and theobjective lens 23 in a state of being accommodated in theconcave portion 110 of thecontainer 100 together with the culture medium. - For example, a HeNe laser having a wavelength of 632.8 nm can be used as a
laser light source 20. Laser light L0 which linearly polarized light emitted from thelaser light source 20 is divided into two laser light rays by thesplitter 21. One of the two laser light rays is object light L1 and the other is reference light L2. A beam splitter can be used as thesplitter 21. The object light L1 is incident on thereflection mirror 22. The fertilizedeggs 200 are irradiated with the object light L1 of which a traveling direction is bent by thereflection mirror 22. The object light L1 is irradiated in a direction that penetrates thebottom surface 120 of theconcave portion 110. - An image formed by the object light L1 transmitted through the fertilized
egg 200 is magnified by theobjective lens 23. The object light L1 transmitted through theobjective lens 23 is bent in a traveling direction by thereflection mirror 24 and is incident on thecombiner 26 through theimaging lens 25. On the other hand, the reference light L2 is also incident on thecombiner 26. The object light L1 and the reference light L2 are combined by thecombiner 26 and are imaged on an imaging surface of theimaging apparatus 30. A beam splitter can be used as thecombiner 26. - The hologram image, which is the interference image generated by the interference between the object light L1 and the reference light L2, is imaged by the
imaging apparatus 30. Theimaging apparatus 30 comprises an imaging element such as a complementary metal-oxide-semiconductor (CMOS) image sensor, and generates image data of the hologram image. - An example of a method for acquiring the phase image from the hologram image will be described below. First, the hologram image of the fertilized
egg 200 acquired by theimaging apparatus 30 is trimmed to have a size of, for example, 2048 × 2048, and is then subjected to a two-dimensional Fourier transform. A Fourier-transformed image obtained by this processing may include an image based on direct light, object light, and conjugated light. - Subsequently, a position of the object light is specified by specifying a deviation amount of the object light with respect to the direct light in the Fourier-transformed image, and, for example, a complex amplitude component of only the object light is extracted by frequency filtering processing using a mask of a circular opening having a radius of 250 pixels.
- Subsequently, for example, an angular spectrum method is applied to restore the image showing the phase of the fertilized
egg 200 at any spatial position. Specifically, an angular spectrum U(fx, fy; 0) of the Fourier-transformed image of a wave front u(x, y; 0) captured by the imaging surface of theimaging apparatus 30 is obtained. Subsequently, as represented in Equation (1) below, the angular spectrum U(fx, fy; 0) is multiplied by a transfer function H(fx, fy; z), and thus, a wave front at any position z in an optical axis direction (z direction) is reproduced. Here, the transfer function H(fx, fy; z) is a frequency response function (Fourier transform of an impulse response function (green function)).
- Subsequently, as represented in Equation (2) below, an inverse Fourier transform is performed on a wave front U(fx, fy; z) at the position z in the optical axis direction (z direction), and thus, a solution u(x, y; z) at the position z is derived.

- Subsequently, the phase image is generated by deriving a phase ϕ for u(x, y; z) as represented in Equation (3) below.

- A phase in the phase image before unwrapping obtained by the above processing is convolved to a value of 0 to 2π. Therefore, for example, a phase connection (unwrapping) method such as unweighted least squares or Flynn's algorithm is applied to connect the portions of 2π or more. It should be noted that, many unwrapping methods have been proposed, and an appropriate method that does not cause phase mismatch may be appropriately selected.
-
Fig. 3 is a diagram showing an example of a phase image before unwrapping of the fertilizedegg 200. A phase component derived from the inclination of thebottom surface 120 of theconcave portion 110 is superimposed on the phase image. The phase component derived from thebottom surface 120 of theconcave portion 110 is, so to speak, noise, and causes a decrease in the accuracy of the quantitative data obtained from the phase image. The phase component derived from thebottom surface 120 of theconcave portion 110 is removed by the background removal processing described below. -
Fig. 4 is a diagram showing a concept of a phase image IP. In a lower part ofFig. 4 , a phase amount at each pixel k of the phase image IP is three-dimensionally displayed. In an upper part ofFig. 4 , the phase amount at each pixel j of the phase image IP is shown on a plane in gray scale. - Here, in a case where the phase amount at each pixel j of the phase image IP is denoted by PS and the phase of the background (region where the fertilized
egg 200 is not present) present in the same focal plane is denoted by PB, the background removal processing can be represented by Equation (4) below. The term "phase" in the present specification is a phase of an electric field amplitude in a case where light is regarded as an electromagnetic wave, and is used in a more general sense.
- The phase PB of the background is a phase component derived from the
bottom surface 120 of theconcave portion 110. Therefore, the phase PB of the background can be calculated by specifying the shape of thebottom surface 120 of theconcave portion 110. Since thebottom surface 120 of theconcave portion 110 is curved, it is possible to perform function fitting with a degree of a polynomial of 2 or more on the shape of thebottom surface 120 of theconcave portion 110. The function fitting can be performed, for example, by acquiring a profile of the shape of thebottom surface 120 of theconcave portion 110 by actual measurement and searching for a polynomial approximating the acquired profile. -
Fig. 5 is a diagram showing an example of function fitting performed on the shape of thebottom surface 120 of theconcave portion 110. InFig. 5 , a horizontal axis indicates a position of theconcave portion 110 in the plane direction, and a vertical axis indicates a position of theconcave portion 110 in the height direction. InFig. 5 , a dotted line is a curve defined by a second-degree polynomial indicating the shape of thebottom surface 120 of theconcave portion 110, and a solid line is a profile obtained by actually measuring the shape of thebottom surface 120 of theconcave portion 110. It can be seen that the solid line and the dotted line substantially coincide with each other. As described above, the shape of thebottom surface 120 of theconcave portion 110 can be described by a degree of a polynomial of 2 or more. - The phase PB of the background, that is, the phase component derived from the
bottom surface 120 of theconcave portion 110 can be derived from a polynomial indicating the shape of thebottom surface 120 of theconcave portion 110. The phase PB of the background is represented by Equation (5) below. In Equation (5), x is a distance from thecenter portion 121 of theconcave portion 110. m is a degree of the polynomial. ak is a coefficient of each term and can be obtained from the polynomial indicating the shape of thebottom surface 120 of theconcave portion 110.
- In a case where the polynomial indicating the shape of the
bottom surface 120 is denoted by C(x), the phase PB of the background can be converted by performing the conversion processing represented by Equation (6) below. In Equation (6), ns is a refractive index of thecontainer 100, nm is a refractive index of the culture medium, and λ is a wavelength of the object light in the hologram optical system.
- In the background removal processing, as represented in Equation (4), the phase component derived from the polynomial indicating the shape of the
bottom surface 120 of theconcave portion 110 is subtracted from the phase amount of each pixel in the phase image obtained in the second step. As a result, a phase image from which the phase component derived from thebottom surface 120 of theconcave portion 110 is removed is acquired. The phase PB of the background, that is, the phase image from which the phase component derived from thebottom surface 120 of theconcave portion 110 is removed will be referred to as a "processed phase image" below. -
Figs. 6A ,6B, and 6C are diagrams showing examples of the processed phase images.Fig. 6A is a processed phase image in a case where the function fitting is performed with the degree of the polynomial indicating the shape of thebottom surface 120 of theconcave portion 110 set to 3.Fig. 6B is a processed phase image in a case where the function fitting is performed with the degree of the polynomial indicating the shape of thebottom surface 120 of theconcave portion 110 set to 5.Fig. 6C is a processed phase image in a case where the function fitting is performed with the degree of the polynomial indicating the shape of thebottom surface 120 of theconcave portion 110 set to 7. As shown inFigs. 6A to 6C , by performing the background removal processing, a processed phase image from which the phase component derived from thebottom surface 120 of theconcave portion 110 is removed and only the fertilizedegg 200 is extracted can be acquired. -
Fig. 7 is a diagram showing an example of acontainer 100X according to a comparative example. Thecontainer 100X is different from the container 100 (seeFig. 1 ) according to the embodiment of the disclosed technology in that thebottom surface 120 of aconcave portion 110X is non-curved. That is, the inclination of thebottom surface 120X of theconcave portion 110X according to the comparative example is linear. - According to the
container 100X of the comparative example, since the change in height of acenter portion 121X of thebottom surface 120X of theconcave portion 110X is rapid, the error is large in a case where the function fitting is performed on the shape of thebottom surface 120X. Since the error in the function fitting is an error of the phase PB of the background derived based on the polynomial, in a case where thecontainer 100X according to the comparative example is used, it is difficult to appropriately remove the phase component derived from thebottom surface 120X of theconcave portion 110X. - On the other hand, since the
bottom surface 120 of theconcave portion 110 of thecontainer 100 according to the embodiment of the disclosed technology is a curved surface of which the height at thecenter portion 121 is the lowest and is gently inclined toward the outside from thecenter portion 121, it is possible to perform high-accuracy function fitting on the shape of thebottom surface 120 of the concave portion 110 (seeFig. 5 ). That is, according to the phase image acquisition method according to the embodiment of the disclosed technology, it is possible to appropriately remove unnecessary phase components from the phase image of the object. - It is preferable that the degree of the polynomial indicating the shape of the
bottom surface 120 of theconcave portion 110 is 2 or more and 7 or less. By setting the degree of the polynomial to 2 or more, it is possible to describe the curved surface by the polynomial. By setting the degree of the polynomial to 7 or less, it is possible to perform high-accuracy function fitting on the shape of thebottom surface 120 of theconcave portion 110, and it is possible to appropriately remove the phase component derived from thebottom surface 120 of theconcave portion 110. In a case where the degree of the polynomial is 8 or more, an error tends to occur in the function fitting. It should be noted that, even in a case where the fitting is performed with the degree of 8 or more, in a case where the contribution of the coefficient (ak × xk) is smaller than 10% of the sum (Σk = 2 to 7 ak × xk) of the contributions of the coefficients of the degree of 2 to 7, it is assumed that the fitting is substantially performed with the degree of 7. In addition, it is preferable that the change amount Δh (seeFig. 8 ) in the height of thebottom surface 120 of theconcave portion 110 in the phase image (within the visualization range of the phase image) is 10 µm or more. In a case where the change amount Δh is 10 µm or more, it is possible to perform the function fitting of the shape of thebottom surface 120 of theconcave portion 110 with high accuracy, and it is possible to appropriately remove the phase component derived from thebottom surface 120 of theconcave portion 110. - The method of deriving quantitative data according to the embodiment of the disclosed technology uses the above-described phase image acquisition method. That is, the quantitative data derivation method is a method of deriving the quantitative data indicating the state of the fertilized
egg 200 based on the processed phase image acquired by performing the above-described phase image acquisition method. The quantitative data derivation method according to the present embodiment will be described in detail below. - The phase amount Pj at each pixel j of the processed phase image can be represented by Equation (7) below. Here, nj is a refractive index of the fertilized
egg 200 in a part corresponding to each pixel j of the processed phase image, dj is a thickness of the fertilizedegg 200 in the part corresponding to each pixel j of the processed phase image, and λ is a wavelength of the object light in the hologram optical system.
- The processed phase image of the fertilized
egg 200 is an image showing a phase distribution of the object light L1 transmitted through the fertilizedegg 200, and is also an image showing an optical path length distribution of the object light transmitted through the fertilizedegg 200. Since the optical path length in the fertilizedegg 200 corresponds to the product of the refractive index of the fertilizedegg 200 and the thickness of the fertilizedegg 200, the processed phase image of the fertilizedegg 200 includes information on the refractive index and the thickness (shape) of the fertilizedegg 200 as represented in Equation (7). Since the processed phase image of the fertilizedegg 200 reflects the internal state of the fertilizedegg 200, it is possible to perform quality evaluation of the fertilizedegg 200 based on the processed phase image. Specifically, the total phase amount PA represented by Equation (8) below can be used as the quantitative data indicating the state of the fertilizedegg 200. In Equation (8), s is an area of each pixel j of the processed phase image, and vj is a volume of the fertilizedegg 200 in the part corresponding to each pixel j of the processed phase image. As represented in Equation (8), the total phase amount PA corresponds to the amount obtained by integrating the phase amount Pj for each pixel of the processed phase image for all the pixels j. The pixel value of the processed phase image corresponds to the phase amount Pj.
- For example, the quality of the fertilized
egg 200 can be determined by performing the threshold value determination on the total phase amount PA derived based on the processed phase image. By deriving the quantitative data indicating the state of the fertilizedegg 200 based on the processed phase image acquired by performing the phase image acquisition method according to the embodiment of the disclosed technology, the accuracy of the quantitative data can be enhanced, and the evaluation of the fertilizedegg 200 can be appropriately performed. - The quantitative data derived based on the phase image is not limited to the total phase amount PA. For example, statistical values such as a maximum value, a minimum value, a median value, an average value, a variance, and a standard deviation of the pixel values (phase amounts Pj) of the processed phase images can also be used as the quantitative data. In addition, a phase density, which is a value obtained by dividing the total phase amount PA by the volume of the fertilized
egg 200, can also be used as the quantitative data. - In the above description, a case where the object from which the phase image is acquired is a fertilized egg has been described as an example, but the present embodiment is not limited to this aspect. The object may be a cell or a cell aggregate other than the fertilized egg. For example, the disclosed technology can be applied to a case of acquiring a phase image of an induced pluripotent stem cell (iPS cell) or a spheroid which is an aggregate thereof. In addition, the object from which the phase image is acquired may be an artificial object.
- The mouse embryos are cultured for 5 days using the dish shown in Table 1 below. The shape of the bottom surface of the concave portion (well) provided in each dish is shown in Table 1. The bottom surface of the concave portion of the dish according to Examples 1 and 2 is curved as shown in
Fig. 1 . The dish according to Comparative Example 1 is a dish having a flat bottom surface without a concave portion. The bottom surface of the concave portion of the dish according to Comparative Example 2 is non-curved in which the inclination is linear as shown inFig. 7 . In a state where the mouse embryo is accommodated in each dish, a hologram image of the mouse embryo is acquired, and a phase image is acquired from the hologram image. - For each dish, an image of a cross section is imaged, and a change amount Δh (see
Fig. 8 ) in a height of a bottom surface of a concave portion (well) in the phase image is measured. The measured values of the change amount Δh are shown in Table 1. - The phase images of the mouse embryos acquired in each of the examples and the comparative examples are subjected to background removal processing. In Examples 1 and 2 in which the bottom surface of the concave portion (well) is curved, the function fitting with a fifth-degree polynomial is performed on the shape of the bottom surface of the concave portion. In Comparative Example 2 in which the bottom surface of the concave portion is non-curved, the function fitting with a first-degree polynomial is performed on the shape of the bottom surface of the concave portion. A processed phase image is acquired by removing the phase component derived from these polynomials from the phase image. In Comparative Example 1 in which the bottom surface of the dish is flat, the background removal processing is not performed.
- For each of the examples and the comparative examples, the movement amount of the mouse embryo during the culture period is measured. The position of the mouse embryo at the time of the start of the culture is defined as the initial position, and the distance from the initial position of the position of the mouse embryo in a case where the mouse embryo is moved to a position farthest from the initial position during the culture period is defined as the movement amount. The measured values of the movement amount are shown in Table 1. Since the dishes according to Example 1, Example 2, and Comparative Example 2 comprise the concave portion having the inclined bottom surface, the movement amount of the mouse embryo is suppressed. On the other hand, in a case where the dish according to Comparative Example 1 having a flat bottom surface is used, the movement amount of the mouse embryo is the largest.
- A phase measurement error is acquired for the processed phase images acquired for each of the examples and the comparative examples. The total phase amount PA represented by Equation (8) is repeatedly measured 100 times with respect to the same mouse embryo immediately after the start of the culture. A value obtained by dividing the width of the phase amount at which the variation of the total phase amount PA is ±1σ by the average value of the total phase amount PA is defined as a phase measurement error. σ is a standard deviation. The measured values of the phase measurement error are shown in Table 1.
- In the dishes according to Examples 1 and 2 in which the bottom surface of the concave portion (well) is curved, it is possible to perform high-accuracy function fitting on the shape of the bottom surface of the concave portion, and the background removal processing can be appropriately performed. As a result, the phase measurement error could be set to 5% or less. On the other hand, in the dish according to Comparative Example 2 in which the shape of the bottom surface of the concave portion is non-curved, it is difficult to perform high-accuracy function fitting on the shape of the bottom surface of the concave portion, and it is difficult to appropriately perform the background removal processing. As a result, the phase measurement error is significantly larger compared to Examples 1 and 2.
- As described above, by performing the background removal processing using the dishes according to Examples 1 and 2, it is possible to suppress the movement amount of the mouse embryo and to acquire quantitative data (total phase amount PA) with a small error.
[Table 1] Dish product name Shape of bottom surface Change amount Δh in height of bottom surface Fitting function Movement amount Phase measurement error Example 1 38Special GPS® manufactured by CooperSurgical, Inc. Curved 28 µm fifth-degree polynomial 0.1 mm ±3.4% Example 2 Embryo GPS® manufactured by CooperSurgical, Inc. Curved 5 µm fifth-degree polynomial 0.2 mm ±4.5% Comparative Example 1 Falcon® Cell Culture Dish manufactured by Corning Flat 0 µm - 20 mm ±3.2% Comparative Example 2 Manufactured by DNP Group Non-curved 20 µm first-degree polynomial 0.1 mm ±10.5% - In regard to the embodiment described above, the following supplementary notes will be further disclosed.
- A phase image acquisition method including:
- acquiring a hologram image of an object in a state where the object is accommodated in a concave portion provided in a container with a bottom surface of the concave portion being curved;
- generating a phase image from the hologram image; and
- performing processing of subtracting a phase component derived from a polynomial indicating a shape of the bottom surface of the concave portion from the phase image to acquire a processed phase image.
- The phase image acquisition method according to Supplementary Note 1,
in which a degree of the polynomial is 2 or more and 7 or less. - The phase image acquisition method according to Supplementary Note 1 or 2,
in which a change amount in a height of the bottom surface of the concave portion in the phase image is 10 µm or more. - The phase image acquisition method according to any one of Supplementary Notes 1 to 3,
in which the object is a cell or a cell aggregate. - The phase image acquisition method according to Supplementary Note 4,
in which the cell or the cell aggregate is a fertilized egg of an animal. - The phase image acquisition method according to Supplementary Note 4 or 5, further including:
acquiring a phase image of the cell or the cell aggregate cultured in a state of being accommodated in the concave portion. - A quantitative data acquisition method using the phase image acquisition method according to Supplementary Note 4 or 5, the quantitative data acquisition method including:
deriving quantitative data indicating a state of the cell or the cell aggregate based on the processed phase image. - Further, the disclosure of
JP2022-091056 filed on June 3, 2022
Claims (7)
- A phase image acquisition method comprising:acquiring a hologram image of an object in a state where the object is accommodated in a concave portion provided in a container with a bottom surface of the concave portion being curved;generating a phase image from the hologram image; andperforming processing of subtracting a phase component derived from a polynomial indicating a shape of the bottom surface of the concave portion from the phase image to acquire a processed phase image.
- The phase image acquisition method according to claim 1,
wherein a degree of the polynomial is 2 or more and 7 or less. - The phase image acquisition method according to claim 2,
wherein a change amount in a height of the bottom surface of the concave portion in the phase image is 10 µm or more. - The phase image acquisition method according to any one of claims 1 to 3,
wherein the object is a cell or a cell aggregate. - The phase image acquisition method according to claim 4,
wherein the cell or the cell aggregate is a fertilized egg of an animal. - The phase image acquisition method according to claim 4, further comprising:
acquiring a phase image of the cell or the cell aggregate cultured in a state of being accommodated in the concave portion. - A quantitative data acquisition method using the phase image acquisition method according to claim 4, the quantitative data acquisition method comprising:
deriving quantitative data indicating a state of the cell or the cell aggregate based on the processed phase image.
Applications Claiming Priority (2)
| Application Number | Priority Date | Filing Date | Title |
|---|---|---|---|
| JP2022091056 | 2022-06-03 | ||
| PCT/JP2023/014780 WO2023233827A1 (en) | 2022-06-03 | 2023-04-11 | Phase image acquisition method and quantitative data acquisition method |
Publications (3)
| Publication Number | Publication Date |
|---|---|
| EP4517405A1 true EP4517405A1 (en) | 2025-03-05 |
| EP4517405A4 EP4517405A4 (en) | 2025-08-13 |
| EP4517405B1 EP4517405B1 (en) | 2026-04-22 |
Family
ID=89026145
Family Applications (1)
| Application Number | Title | Priority Date | Filing Date |
|---|---|---|---|
| EP23815589.9A Active EP4517405B1 (en) | 2022-06-03 | 2023-04-11 | Phase image acquisition method and quantitative data acquisition method |
Country Status (4)
| Country | Link |
|---|---|
| US (1) | US20250085666A1 (en) |
| EP (1) | EP4517405B1 (en) |
| JP (1) | JPWO2023233827A1 (en) |
| WO (1) | WO2023233827A1 (en) |
Family Cites Families (8)
| Publication number | Priority date | Publication date | Assignee | Title |
|---|---|---|---|---|
| US10472598B2 (en) * | 2014-05-22 | 2019-11-12 | Sumitomo Bakelite Co., Ltd. | Cell mass culture vessel |
| EP2985719A1 (en) * | 2014-08-15 | 2016-02-17 | IMEC vzw | A system and method for cell recognition |
| EP3308281A4 (en) | 2015-03-31 | 2019-12-04 | Thrive Bioscience, Inc. | CELL CULTURE INCUBATORS WITH INTEGRATED IMAGING SYSTEMS |
| CN110383042B (en) * | 2017-03-10 | 2023-02-03 | 雅马哈发动机株式会社 | camera system |
| JP7000176B2 (en) * | 2018-01-30 | 2022-01-19 | 株式会社日立ハイテク | Optical image measuring device |
| EP3766984B1 (en) * | 2018-03-12 | 2024-10-30 | FUJIFILM Corporation | Determination method` |
| WO2019202979A1 (en) * | 2018-04-18 | 2019-10-24 | 富士フイルム株式会社 | Observation device, observation device operation method, and observation control program |
| JP2022091056A (en) | 2020-12-08 | 2022-06-20 | 王子ホールディングス株式会社 | Sheet-like heat-resistant material and laminate |
-
2023
- 2023-04-11 WO PCT/JP2023/014780 patent/WO2023233827A1/en not_active Ceased
- 2023-04-11 JP JP2024524214A patent/JPWO2023233827A1/ja active Pending
- 2023-04-11 EP EP23815589.9A patent/EP4517405B1/en active Active
-
2024
- 2024-11-22 US US18/955,974 patent/US20250085666A1/en active Pending
Also Published As
| Publication number | Publication date |
|---|---|
| EP4517405A4 (en) | 2025-08-13 |
| EP4517405B1 (en) | 2026-04-22 |
| WO2023233827A1 (en) | 2023-12-07 |
| US20250085666A1 (en) | 2025-03-13 |
| JPWO2023233827A1 (en) | 2023-12-07 |
Similar Documents
| Publication | Publication Date | Title |
|---|---|---|
| Kuś et al. | Holographic tomography: hardware and software solutions for 3D quantitative biomedical imaging | |
| US9089281B2 (en) | Optical tomographic imaging apparatus | |
| CN110346340B (en) | Machine learning fast aberration measurement system and method based on wavefront sensor | |
| EP4194923A1 (en) | Observation device and observation method | |
| Carney et al. | Quantitative phase imaging comparison of digital holographic microscopy and transport of intensity equation phase through simultaneous measurements of live cells | |
| US11867624B2 (en) | System for reconstructing and outputting a structure of an estimation sample using refractive index distribution of updated estimation sample | |
| Zhou et al. | Robust statistical phase-diversity method for high-accuracy wavefront sensing | |
| US12067713B2 (en) | Determination method | |
| EP4517405A1 (en) | Phase image acquisition method and quantitative data acquisition method | |
| EP3992609A1 (en) | Image processing device, evaluation system, image processing program, and image processing method | |
| Khan et al. | AutoSAFT: Autofocusing for extended depth of imaging in scanning acoustic microscopy | |
| CN120467237B (en) | A method and system for detecting the three-dimensional contour of a spherical optical lens | |
| Ralston et al. | Phase stability technique for inverse scattering in optical coherence tomography | |
| JP7207813B2 (en) | OCT image generation method, OCT system and storage medium | |
| CN117203514A (en) | How to obtain evaluation value | |
| EP4538385A1 (en) | Method, device, and information processing program for determining necrosis cell region | |
| CN117388219A (en) | A stacked diffraction position correction imaging method, system and electronic equipment | |
| KR102141967B1 (en) | Oct system, method of generating oct image and storage medium | |
| Krauze et al. | Enhanced QPI functionality by combining OCT and ODT methods | |
| JP3871183B2 (en) | Method and apparatus for measuring three-dimensional shape of optical element | |
| Wang et al. | Automatic and accurate phase aberration compensation for a digital holographic microscopy system based on one-dimensional weighted curve fitting | |
| Zvahelskyi | On In-situ Imaging for 3D Laser Microprinting | |
| Matkivsky et al. | Determination and correction of aberrations in full field OCT using phase gradient autofocus by maximizing the likelihood function | |
| Liu et al. | TIE-based 3D detection of surface defects in optical components | |
| You et al. | Single-Axis Ptychographic Coherent Diffractive Imaging for Spectroscopic and Wavefront Retrieval |
Legal Events
| Date | Code | Title | Description |
|---|---|---|---|
| STAA | Information on the status of an ep patent application or granted ep patent |
Free format text: STATUS: THE INTERNATIONAL PUBLICATION HAS BEEN MADE |
|
| PUAI | Public reference made under article 153(3) epc to a published international application that has entered the european phase |
Free format text: ORIGINAL CODE: 0009012 |
|
| STAA | Information on the status of an ep patent application or granted ep patent |
Free format text: STATUS: REQUEST FOR EXAMINATION WAS MADE |
|
| 17P | Request for examination filed |
Effective date: 20241128 |
|
| AK | Designated contracting states |
Kind code of ref document: A1 Designated state(s): AL AT BE BG CH CY CZ DE DK EE ES FI FR GB GR HR HU IE IS IT LI LT LU LV MC ME MK MT NL NO PL PT RO RS SE SI SK SM TR |
|
| REG | Reference to a national code |
Ref country code: DE Ref legal event code: R079 Free format text: PREVIOUS MAIN CLASS: G02B0021000000 Ipc: G03H0001040000 Ref document number: 602023015857 Country of ref document: DE |
|
| A4 | Supplementary search report drawn up and despatched |
Effective date: 20250716 |
|
| RIC1 | Information provided on ipc code assigned before grant |
Ipc: G03H 1/04 20060101AFI20250710BHEP Ipc: G03H 1/08 20060101ALI20250710BHEP Ipc: G01N 21/45 20060101ALI20250710BHEP Ipc: G01N 33/08 20060101ALI20250710BHEP Ipc: G02B 21/14 20060101ALI20250710BHEP Ipc: G01N 15/01 20240101ALI20250710BHEP Ipc: G01N 15/1434 20240101ALI20250710BHEP Ipc: G03H 1/00 20060101ALN20250710BHEP Ipc: C12M 1/34 20060101ALN20250710BHEP Ipc: G01N 15/10 20240101ALN20250710BHEP Ipc: G01N 15/0227 20240101ALN20250710BHEP Ipc: G02B 21/32 20060101ALN20250710BHEP Ipc: G06T 7/194 20170101ALN20250710BHEP |
|
| DAV | Request for validation of the european patent (deleted) | ||
| DAX | Request for extension of the european patent (deleted) | ||
| GRAP | Despatch of communication of intention to grant a patent |
Free format text: ORIGINAL CODE: EPIDOSNIGR1 |
|
| STAA | Information on the status of an ep patent application or granted ep patent |
Free format text: STATUS: GRANT OF PATENT IS INTENDED |
|
| RIC1 | Information provided on ipc code assigned before grant |
Ipc: G03H 1/04 20060101AFI20251121BHEP Ipc: G03H 1/08 20060101ALI20251121BHEP Ipc: G01N 21/45 20060101ALI20251121BHEP Ipc: G01N 33/08 20060101ALI20251121BHEP Ipc: G02B 21/14 20060101ALI20251121BHEP Ipc: G01N 15/01 20240101ALI20251121BHEP Ipc: G01N 15/1434 20240101ALI20251121BHEP Ipc: G03H 1/00 20060101ALN20251121BHEP Ipc: C12M 1/34 20060101ALN20251121BHEP Ipc: G01N 15/10 20240101ALN20251121BHEP Ipc: G01N 15/0227 20240101ALN20251121BHEP Ipc: G02B 21/32 20060101ALN20251121BHEP Ipc: G06T 7/194 20170101ALN20251121BHEP |
|
| INTG | Intention to grant announced |
Effective date: 20251215 |
|
| GRAS | Grant fee paid |
Free format text: ORIGINAL CODE: EPIDOSNIGR3 |
|
| GRAA | (expected) grant |
Free format text: ORIGINAL CODE: 0009210 |
|
| STAA | Information on the status of an ep patent application or granted ep patent |
Free format text: STATUS: THE PATENT HAS BEEN GRANTED |
|
| AK | Designated contracting states |
Kind code of ref document: B1 Designated state(s): AL AT BE BG CH CY CZ DE DK EE ES FI FR GB GR HR HU IE IS IT LI LT LU LV MC ME MK MT NL NO PL PT RO RS SE SI SK SM TR |
|
| REG | Reference to a national code |
Ref country code: CH Ref legal event code: F10 Free format text: ST27 STATUS EVENT CODE: U-0-0-F10-F00 (AS PROVIDED BY THE NATIONAL OFFICE) Effective date: 20260422 Ref country code: GB Ref legal event code: FG4D |